Embed Size (px)
DESCRIPTION
Fox News Poll 9-23-15
Citation preview
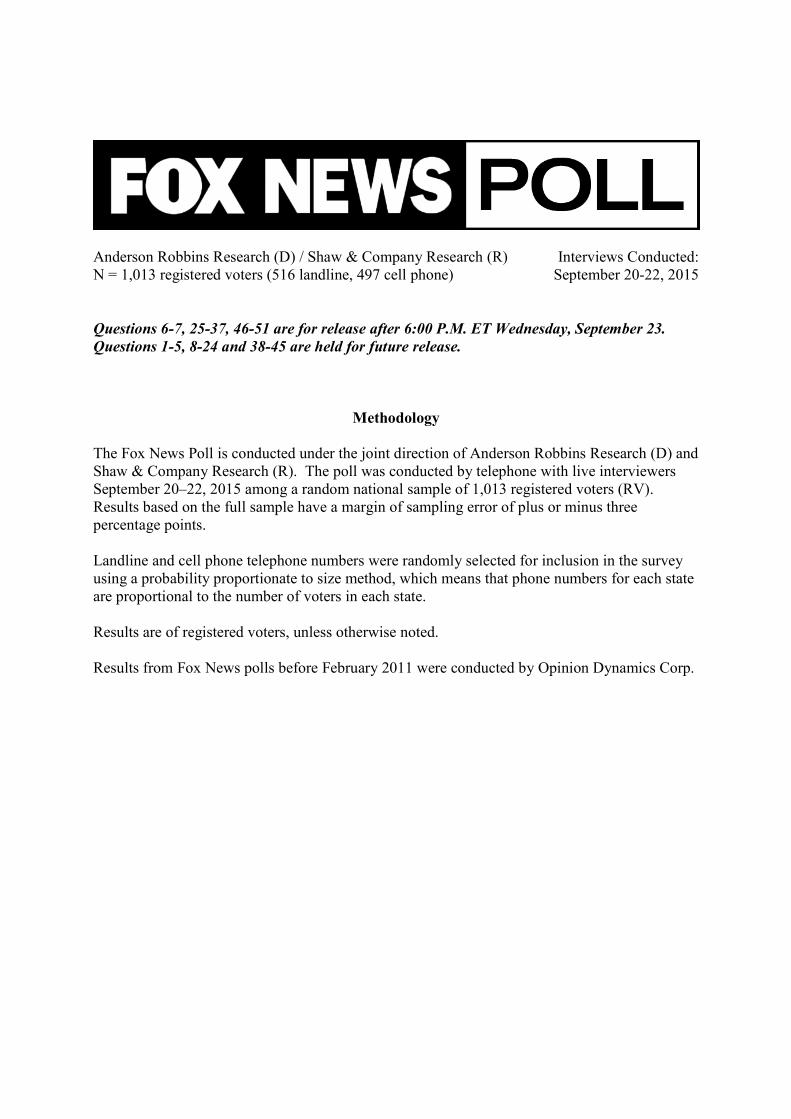
Anderson Robbins Research (D) / Shaw & Company Research (R) Interviews Conducted:
N = 1,013 registered voters (516 landline, 497 cell phone) September 20-22, 2015
Questions 6-7, 25-37, 46-51 are for release after 6:00 P.M. ET Wednesday, September 23.
Questions 1-5, 8-24 and 38-45 are held for future release.
Methodology
The Fox News Poll is conducted under the joint direction of Anderson Robbins Research (D) and
Shaw & Company Research (R). The poll was conducted by telephone with live interviewers
September 20–22, 2015 among a random national sample of 1,013 registered voters (RV).
Results based on the full sample have a margin of sampling error of plus or minus three
percentage points.
Landline and cell phone telephone numbers were randomly selected for inclusion in the survey
using a probability proportionate to size method, which means that phone numbers for each state
are proportional to the number of voters in each state.
Results are of registered voters, unless otherwise noted.
Results from Fox News polls before February 2011 were conducted by Opinion Dynamics Corp.

Questions 1-5 are held for future release.
6.-7. I'm going to read you the names of several individuals and groups. Please tell me
whether you have a generally favorable or unfavorable opinion of each one. If you've
never heard of one please just say so. [RANDOMIZE]
Pope Francis
Favorable Unfavorable (Can’t say) Never heard of
20-22 Sep 15 55% 20 10 15
Catholics 68% 14 5 13
PAST TREND 21-23 Jul 13 46% 8 19 26
The Catholic Church
Favorable Unfavorable (Can’t say) Never heard of
20-22 Sep 15 51% 30 14 5
Catholics 75% 13 8 4
PAST TREND 23-24 Sep 03 46% 29 24 1
Questions 8-24 are held for future release.
Moving on…
25. In the presidential [primary election / caucus] in [state] next year, are you more likely
to vote in the Democratic or Republican [primary election / caucus] for president, or are
you unlikely to participate in either?
Democratic
primary/caucus
Republican
primary/caucus Neither
(Other /
Don’t know)
20-22 Sep 15 38% 39 16 7
Self-identified Democrats 83% 3 11 4
Self-identified Republicans 3% 84 9 4
Self-identified Independents 17% 22 44 17 *Breakout among self-identified D/R/I based on party identification question – below Q51

[Q26-Q27 IF DEMOCRATIC PRIMARY IN Q25, N=381]
26. I’m going to read a list of potential candidates for the 2016 Democratic nomination.
Please tell me which one you would like to see as the Democratic presidential nominee.
[IF NOT SURE, ASK: Well, if you had to decide today, which one would you choose?]
[RANDOMIZE LIST] [AMONG Q25 LIKELY DEMOCRATIC PRIMARY VOTERS]
20-22
Sep 15
11-13
Aug 15
30 Jul-2
Aug 15
13-15
Jul 15
21-23
Jun 15
N=381 N=401 N=499 N=382 N=375
Hillary Clinton 44% 49% 51% 59% 61%
Bernie Sanders 30 30 22 19 15
Joe Biden 18 10 13 8 11
Martin O’Malley 2 1 1 1 1
Jim Webb 1 1 1 1 2
Larry Lessig * N/A N/A N/A N/A
Lincoln Chafee - - 1 1 -
Andrew Cuomo N/A N/A N/A N/A 3
(Other) * 1 1 1 1
(None of the
above)
2 3 3 4 2
(Don’t know) 3 4 6 5 5
31 May-
2 Jun 15
9-12
May 15
19-21
Apr 15
29-31
Mar 15
N=395 N=370 N=388 N=397 Hillary Clinton 57% 63% 62% 61%
Bernie Sanders 11 6 4 3
Joe Biden 8 6 9 12
Elizabeth Warren 7 13 12 11
Martin O’Malley 4 - 1 2
Jim Webb 2 2 - 1
Andrew Cuomo 1 2 3 3
Lincoln Chafee 1 - - N/A
(Other) 1 1 - 1
(None of the
above) 2 2 4 3
(Don’t know) 6 6 5 3
May 2015 and earlier: results include Elizabeth Warren

25-27
Jan 15
7-9
Dec 14
20-22
Jul 14
13-15
Apr 14
14-16
Dec 13
N=390 N=409 N=438 N=395 N=412
Hillary Clinton 55% 62% 64% 69% 68%
Joe Biden 17 10 12 14 12
Elizabeth Warren 12 12 9 6 7
Andrew Cuomo 4 2 5 2 4
Bernie Sanders 3 3 N/A N/A N/A
Martin O’Malley 2 1 1 1 1
Jim Webb 1 1 N/A N/A N/A
(Other) - - - - 1
(None of the
above) 2 5 4 4 2
(Don’t know) 3 5 4 3 6
January 2015 and earlier: results among self-identified Democrats
[SKIP AND CODE AS DON’T KNOW IF DON’T KNOW IN Q26]
27. And which Democrat would be your second choice? [IF NOT SURE, ASK: Well, if you
had to decide today, which one would you choose?] [ONLY READ LIST IF
REQUESTED. READ IN SAME ORDER AS Q26. DO NOT ACCEPT CHOICE
FROM Q26.]
First choice Second choice Without Biden
Hillary Clinton 44% 26% 56%
Bernie Sanders 30 13 32
Joe Biden 18 38 NA
Martin O’Malley 2 3 2
Jim Webb 1 2 2
Larry Lessig * 1 *
Lincoln Chafee - 1 - (Other) * 1 *
(None of the above) 2 7 3
(Don’t know) 3 8 4

[Q28-Q29 IF REPUBLICAN PRIMARY IN Q25, N=398]
28. I’m going to read a list of potential candidates for the 2016 Republican nomination.
Please tell me which one you would like to see as the Republican presidential nominee.
[IF NOT SURE, ASK: Well, if you had to decide today, which one would you choose?]
[RANDOMIZE LIST] [AMONG Q25 LIKELY REPUBLICAN PRIMARY VOTERS]
20-22
Sep 15
N=398
Donald Trump 26%
Ben Carson 18
Carly Fiorina 9
Marco Rubio 9
Ted Cruz 8
Jeb Bush 7
Chris Christie 5
John Kasich 4
Mike Huckabee 3
Rand Paul 2
George Pataki 1
Jim Gilmore *
Rick Santorum -
Bobby Jindal -
Lindsey Graham -
(Other) 3
(None of the above) 1
(Don’t know) 4
11-13
Aug 15
30 Jul-
2 Aug 15
13-15
Jul 15
21-23
Jun 15
31 May-
2 Jun 15
9-12
May 15
19-21
Apr 15
29-31
Mar 15
N=381 N=475 N=389 N=378 N=370 N=413 N=383 N=379
Donald Trump 25% 26% 18% 11% 4% 4% 5% 3%
Ben Carson 12 7 6 10 11 13 6 11
Ted Cruz 10 6 4 4 8 6 8 10
Jeb Bush 9 15 14 15 12 13 9 12
Mike Huckabee 6 6 4 6 6 10 9 10
Scott Walker 6 9 15 9 12 11 12 15
Carly Fiorina 5 2 1 3 2 1 - 1
John Kasich 4 3 2 2 2 2 2 1
Marco Rubio 4 5 7 8 7 9 13 8
Rand Paul 3 5 8 9 9 7 10 9
Chris Christie 3 3 3 2 5 6 6 4
Rick Santorum 1 2 2 3 2 2 1 2
Rick Perry 1 1 1 2 4 2 2 3
Bobby Jindal 1 1 - 2 1 1 1 2
George Pataki 1 * - 1 2 - 1 1
Jim Gilmore * - N/A N/A N/A N/A N/A N/A
Lindsey Graham - - - 1 2 - 1 -
(Other) * 1 1 - 1 1 1 1
(None of the above) 2 1 4 3 2 3 3 4
(Don’t know) 7 7 9 9 10 10 9 6
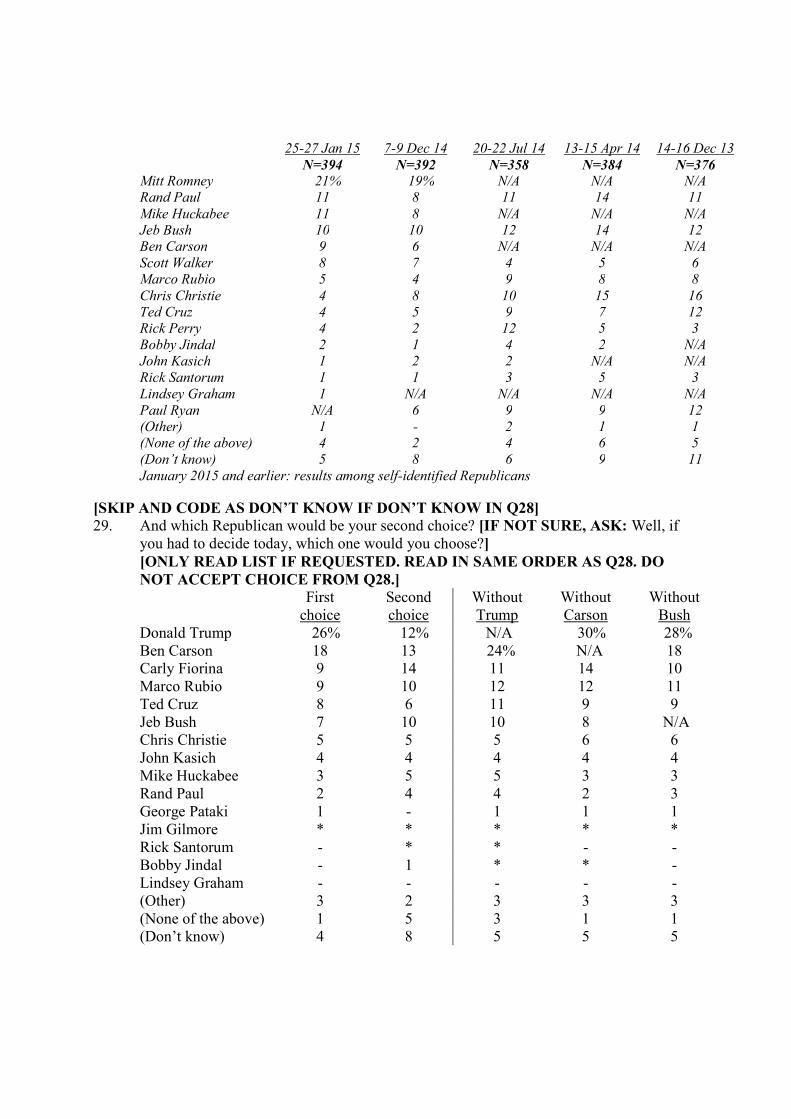
25-27 Jan 15 7-9 Dec 14 20-22 Jul 14 13-15 Apr 14 14-16 Dec 13
N=394 N=392 N=358 N=384 N=376 Mitt Romney 21% 19% N/A N/A N/A
Rand Paul 11 8 11 14 11
Mike Huckabee 11 8 N/A N/A N/A
Jeb Bush 10 10 12 14 12
Ben Carson 9 6 N/A N/A N/A
Scott Walker 8 7 4 5 6
Marco Rubio 5 4 9 8 8
Chris Christie 4 8 10 15 16
Ted Cruz 4 5 9 7 12
Rick Perry 4 2 12 5 3
Bobby Jindal 2 1 4 2 N/A
John Kasich 1 2 2 N/A N/A
Rick Santorum 1 1 3 5 3
Lindsey Graham 1 N/A N/A N/A N/A
Paul Ryan N/A 6 9 9 12
(Other) 1 - 2 1 1
(None of the above) 4 2 4 6 5
(Don’t know) 5 8 6 9 11
January 2015 and earlier: results among self-identified Republicans
[SKIP AND CODE AS DON’T KNOW IF DON’T KNOW IN Q28]
29. And which Republican would be your second choice? [IF NOT SURE, ASK: Well, if
you had to decide today, which one would you choose?]
[ONLY READ LIST IF REQUESTED. READ IN SAME ORDER AS Q28. DO
NOT ACCEPT CHOICE FROM Q28.]
First
choice
Second
choice
Without
Trump
Without
Carson
Without
Bush
Donald Trump 26% 12% N/A 30% 28%
Ben Carson 18 13 24% N/A 18
Carly Fiorina 9 14 11 14 10
Marco Rubio 9 10 12 12 11
Ted Cruz 8 6 11 9 9
Jeb Bush 7 10 10 8 N/A
Chris Christie 5 5 5 6 6
John Kasich 4 4 4 4 4
Mike Huckabee 3 5 5 3 3
Rand Paul 2 4 4 2 3
George Pataki 1 - 1 1 1
Jim Gilmore * * * * *
Rick Santorum - * * - -
Bobby Jindal - 1 * * -
Lindsey Graham - - - - -
(Other) 3 2 3 3 3
(None of the above) 1 5 3 1 1
(Don’t know) 4 8 5 5 5

[RESUME ALL]
30. Regardless of how you plan to vote, who do you believe will be the next president of the
United States? (OPEN ENDED -- DO NOT READ RESPONSES -- accept only one)
20-22 Sep 15
(Hillary Clinton) 28%
(Donald Trump) 20
(Bernie Sanders) 5
(Joe Biden) 4
(Jeb Bush) 4
(Ben Carson) 3
(Carly Fiorina) 3
(Ted Cruz) 2
(Marco Rubio) 2
(Chris Christie) 1
(John Kasich) 1
(Mike Huckabee) *
(Martin O’Malley) *
(George Pataki) *
(Scott Walker) *
(Other) *
(Don’t know) 26
For reference: Regardless of how you plan to vote, who do you believe will be the next president
of the United States? (DO NOT READ RESPONSES)
18-19 Mar 08 18-19 Dec 07 9-10 Oct 07
(John McCain) 35% 5% 2%
(Barack Obama) 26 13 6
(Hillary Clinton) 18 33 44
(Rudy Giuliani) N/A 7 12
(John Edwards) N/A 4 3
(Mike Huckabee) N/A 4 -
(Mitt Romney) N/A 3 2
(Fred Thompson) N/A 1 3
(Al Gore) N/A - 2
(Chris Dodd) N/A - 1
(Other) 2 2 2
(Don’t know) 19 29 23

31. If the 2016 presidential election were held today, how would you vote if the candidates
were: [IF DON’T KNOW] Well, which way do you lean? [ROTATE NAMES]
Democrat
Hillary
Clinton
Republican
Donald
Trump (Other) (Wouldn’t vote) (Don’t know)
20-22 Sep 15 46% 42 3 7 2
PAST TREND 11-13 Aug 15 47% 42 2 7 3
21-23 Jun 15* 51% 34 3 9 3
*June 2015: results among split sample, ± 4%
32. Which of the following potential 2016 presidential matchups would make you more
worried that American democracy is in trouble? If the race were between Democrat
Hillary Clinton and Republican Jeb Bush -- or -- if the race were between Democrat
Bernie Sanders and Republican Donald Trump?
Clinton vs.
Bush
Sanders vs.
Trump (Wouldn’t vote) (Don’t know)
20-22 Sep 15 39% 53 1 7
33. Democrats are planning to hold a total of six presidential debates among the candidates
competing to be the Democratic Party’s nominee -- is that too many debates, too few
debates or about the right number?
Too many Too few About right (Don’t know)
20-22 Sep 15 - All Voters 27% 15 53 5
Democratic primary voters 25% 14 58 2
34. Republicans are planning to hold at least nine presidential debates among the candidates
competing to be the Republican Party’s nominee -- is that too many debates, too few
debates or about the right number?
Too many Too few About right (Don’t know)
20-22 Sep 15 - All Voters 46% 6 43 5
Republican primary voters 41% 7 50 2

35. Did you watch or listen to the Republican presidential candidate debates held last week at
Ronald Reagan Library in California?
---------------------Yes---------------------
TOTAL Yes
(Earlier
debate
only)
(Later
debate
only)
(Both
debates) No
(Don’t
know)
20-22 Sep 15 50% 34 5 4 7 49 1
11-13 Aug 15* 52% 33 6 7 6 47 * *Cleveland debate held August 6, 2015
36. [IF RESPONDENT DID NOT WATCH EITHER: Based on what you have heard or
read about the debate, and …] Setting aside which candidate you are supporting, who do
you think did the best job in the debates? [DO NOT READ LIST UNLESS REQUESTED]
Overall
Among Q25
Republican
Primary Voters
Among Q35
Debate Watchers
N=398 (±4.5%) N=507(±4%)
Carly Fiorina 27% 35% 39%
Donald Trump 14 19 17
Ben Carson 6 8 7
Marco Rubio 5 7 9
Jeb Bush 5 3 5
John Kasich 2 1 4
Chris Christie 2 2 4
Ted Cruz 1 2 2
Mike Huckabee 1 2 1
Rand Paul 1 1 1
Lindsey Graham * - *
Bobby Jindal * - -
Scott Walker - - -
George Pataki - - -
Rick Santorum - - -
(Other) 2 - 1
(None of the above) 5 4 3
(Don’t know) 29 18 8

37. [IF RESPONDENT DID NOT WATCH EITHER: Based on what you have heard or
read about the debate, and …] Setting aside which candidate you are supporting, who do
you think did the worst job in the debates? [READ LIST IF REQUESTED]
Overall
Among Q25Republican
Primary Voters
Among Q35
Debate Watchers
N=398 (±4.5%) N=507 (±4%)
Donald Trump 26% 21% 30%
Jeb Bush 7 8 9
Rand Paul 4 8 8
Ben Carson 4 5 6
Chris Christie 3 4 4
Carly Fiorina 3 3 5
Marco Rubio 2 3 2
Ted Cruz 2 1 3
Mike Huckabee 2 2 3
Lindsey Graham 1 2 1
John Kasich 1 2 2
George Pataki 1 1 1
Scott Walker 1 1 2
Bobby Jindal 1 1 1
Rick Santorum * * *
(Other) 3 2 3
(None of the above) 4 3 4
(Don’t know) 36 31 15

Summary Chart among Q35 Debate Watchers, N=507 Best job Worst job Net
Carly Fiorina 39% 5% +34
Marco Rubio 9 2 +7
John Kasich 4 2 +2
Ben Carson 7 6 +1
Rick Santorum - * -
Chris Christie 4 4 -
Ted Cruz 2 3 -1
Bobby Jindal - 1 -1
George Pataki - 1 -1
Lindsey Graham * 1 -1
Mike Huckabee 1 3 -2
Scott Walker - 2 -2
Jeb Bush 5 9 -4
Rand Paul 1 8 -7
Donald Trump 17 30 -13
For reference: Results from August 11-13, 2015 regarding Cleveland debate held August 6, 2015.
Summary Chart among Debate Watchers, N=527
Best job Worst job Net
Carly Fiorina 13% 1% +12
Ben Carson 10 2 +8
John Kasich 10 2 +8
Marco Rubio 9 2 +7
Ted Cruz 6 2 +4
Mike Huckabee 3 2 +1
Scott Walker 2 1 +1
Bobby Jindal - * -
Jim Gilmore - * -
George Pataki * 1 -1
Rick Santorum - 1 -1
Lindsey Graham * 2 -2
Rick Perry - 3 -3
Jeb Bush 6 11 -5
Chris Christie 1 8 -7
Rand Paul 1 12 -11
Donald Trump 19 32 -13

Questions 38-45 are held for future release.
46. Regardless of how you plan to vote, which of the following better describes how you feel
about Donald Trump’s comments on the campaign trail?
He is too mean and
blunt to be
president
He tells it like it is,
and we need that
now in a president (Don’t know)
20-22 Sep 15 49% 44 7
[Ask GOP primary voters only]
47. Since the 2014 midterm election, do you think the Republican majorities in the U.S.
House and Senate have done all they could to block or reverse Barack Obama’s agenda?
Yes No (Don’t know)
20-22 Sep 15 30% 66 4
[If no, ask:]
48. And why do you think that is? Is it mainly because:
They didn’t really
want to block
Obama’s agenda.
They aren’t
smart enough
to block
Obama’s
agenda.
They would
rather fight
each other.
(Other/mixed)
(Don’t know)
20-22 Sep 15 28% 13 38 13 8
[RESUME ALL]
49. Would you say you feel betrayed by politicians from your political party, or not?
Yes No
(No party/
independent) (Don’t know)
20-22 Sep 15 51% 40 3 5
Moving on…
50. How concerned are you that scandals would have a serious effect on Hillary Clinton’s
administration if she were elected president?
------Concerned------ ------Not concerned------
TOTAL Very
Some-
what TOTAL Not very
Not at
all
(Don’t
know)
20-22 Sep 15 62% 40 22 35 15 20 3
9-12 May 15 61% 37 24 38 20 18 2

51. Do you think Hillary Clinton is lying about how her emails were handled while she was
secretary of state?
Yes No (Don’t know)
20-22 Sep 15 58% 32 10
For reference: As you may know, while Hillary Clinton was secretary of state she used a personal
email account and a computer server at her home to do government work. In March, Clinton said
no emails on her private server contained classified information. However, internal government
investigators recently determined classified information was contained in Clinton’s emails on that
server. Do you think Clinton knowingly lied about the emails or there’s another explanation?
Clinton
knowingly lied
There’s another
explanation
(Clinton told
the truth) (Don’t know)
11-13 Aug 15 58% 33 2 7
POLITICAL IDENTIFICATION
When you think about politics, do you think of yourself as a Democrat or a Republican?
Democrat Republican
(Independent /
Other)
(Don’t know /
Refused)
20-22 Sep 15 40% 41 17 3
RECENT TREND 11-13 Aug 15 42% 38 17 3
30 Jul-2 Aug 15 41% 37 17 5
13-15 Jul 15 41% 37 20 2
21-23 Jun 15 42% 38 15 4
31 May-2 Jun 15 43% 37 18 2
9-12 May 15 41% 37 20 2
19-21 Apr 15 42% 38 17 3
29-31 Mar 15 41% 37 20 3
1-3 Mar 15 39% 39 17 4
8-10 Feb 15 43% 38 17 2
25-27 Jan 15 39% 39 19 3
11-13 Jan 15 38% 39 21 3
7-9 Dec 14 41% 39 18 2
25-27 Oct 14 43% 38 17 3
12-14 Oct 14 40% 38 18 4
28-30 Sep 14 40% 39 18 4
7-9 Sep 14 40% 39 18 3
10-12 Aug 14 41% 36 19 3

Fox News Poll -- Margin of Error for Subgroups
The Fox News Poll is conducted under the joint direction of Anderson Robbins Research (D) and Shaw &
Company Research (R). The poll was conducted by telephone with live interviewers September 20-22, 2015
among a random national sample of 1,013 registered voters. Results based on the full sample have a margin of
sampling error of plus or minus three percentage points.
Results among the attached subgroups have larger sampling errors:
Democrats: +/- 5%
Republicans: +/- 4.5%
Independents: +/- 7%
---
Men: +/- 4%
Women: +/- 4%
---
White: +/- 3.5%
Black: +/- 9.5%
---
College Degree: +/- 4%
No College Degree: +/- 4.5%
---
Debate watchers: +/- 4%
---
Under Age 35: +/- 7%
Age 35-54: +/- 5%
Age 55+: +/- 4%
Age 65+: +/- 6%
---
Income Under $50k: +/- 5.5%
Income $50k+: +/- 4%
---
Liberal: +/- 5%
Conservative: +/- 4%
---
Dem Primary Voters: +/- 5%
GOP Primary Voters: +/- 4.5%
---
Tea Party: +/- 8.5%
---
Catholic: +/- 6%

6. Pope Francis: Please tell me whether you have a generally favorable or unfavorable opinion of... College No Watch Total Dem Rep Ind Men Women White Black Degree Degree Debate Favorable 55% 65% 46% 56% 51% 59% 58% 50% 62% 51% 55% Unfavorable 20% 11% 29% 21% 23% 17% 20% 18% 18% 21% 20% (Can't say) 10% 7% 11% 12% 11% 9% 11% 7% 10% 10% 10% Never heard of 15% 16% 14% 12% 16% 14% 12% 26% 10% 18% 15% Under Under Tea Total Age 35 35-54 55+ 65+ $50k $50k+ Lib Cons Party Favorable 55% 54% 54% 57% 54% 48% 60% 65% 46% 35% Unfavorable 20% 12% 23% 22% 26% 25% 19% 12% 29% 43% (Can't say) 10% 10% 8% 12% 12% 10% 9% 6% 13% 8% Never heard of 15% 24% 14% 9% 8% 18% 12% 16% 12% 14% 7. The Catholic Church: Please tell me whether you have a generally favorable or unfavorable opinion of... College No Watch Total Dem Rep Ind Men Women White Black Degree Degree Debate Favorable 51% 52% 51% 47% 49% 54% 52% 50% 55% 48% 51% Unfavorable 30% 30% 28% 34% 33% 27% 29% 27% 29% 30% 30% (Can't say) 14% 15% 16% 12% 13% 15% 14% 14% 13% 15% 14% Never heard of 5% 3% 5% 7% 5% 4% 4% 8% 3% 6% 5% Under Under Tea Total Age 35 35-54 55+ 65+ $50k $50k+ Lib Cons Party Favorable 51% 44% 51% 57% 55% 48% 53% 50% 52% 46% Unfavorable 30% 36% 32% 23% 21% 31% 29% 33% 28% 35% (Can't say) 14% 13% 13% 16% 21% 16% 14% 12% 17% 17% Never heard of 5% 7% 4% 4% 3% 5% 4% 4% 4% 2% 25. In the presidential primary election/caucus in [state] next year, are you more likely to vote in the Democratic or Republican primary election/ caucus for president, or are you unlikely to participate in either? College No Watch Total Dem Rep Ind Men Women White Black Degree Degree Debate Democratic Primary/ 38% 83% 3% 17% 31% 43% 32% 71% 38% 37% 38% caucus Republican Primary/ 39% 3% 84% 22% 43% 36% 47% 7% 40% 39% 39% caucus Neither 16% 11% 9% 44% 19% 14% 15% 17% 15% 16% 16% (Other/Don't know) 7% 4% 4% 17% 7% 7% 7% 5% 7% 7% 7% Under Under Tea Total Age 35 35-54 55+ 65+ $50k $50k+ Lib Cons Party Democratic Primary/ 38% 44% 36% 34% 33% 42% 34% 65% 16% 10% caucus Republican Primary/ 39% 33% 40% 43% 45% 33% 46% 12% 64% 73% caucus Neither 16% 15% 17% 15% 15% 18% 14% 18% 13% 9% (Other/Don't know) 7% 7% 7% 7% 8% 7% 6% 5% 7% 7%

26. [DEMOCRATIC PRIMARY VOTERS] I'm going to read a list of potential candidates for the 2016 Democratic nomination. Please tell me which one you would like to see as the Democratic presidential nominee. Non- College No Total Men Women White White Degree Degree Joe Biden 18% 17% 19% 17% 20% 22% 15% Lincoln Chafee - - - - - - - Hillary Clinton 44% 37% 48% 37% 54% 38% 48% Martin O'Malley 2% 1% 2% 2% 2% 2% 2% Bernie Sanders 30% 37% 25% 38% 15% 34% 26% Jim Webb 1% 1% 1% 1% 1% 1% 1% Larry Lessig *% 1% - *% 1% 1% - (Other) *% *% - *% - *% - (None of the above) 2% 3% 1% 1% 3% - 3% (Don't know) 3% 2% 4% 3% 3% 1% 4% Under Under Total Age 45 45+ $50k $50k+ Lib Dem Joe Biden 18% 17% 19% 17% 19% 13% 17% Lincoln Chafee - - - - - - - Hillary Clinton 44% 33% 52% 54% 37% 43% 45% Martin O'Malley 2% *% 3% 2% 2% 1% 1% Bernie Sanders 30% 41% 20% 20% 38% 37% 31% Jim Webb 1% 2% 1% 1% 2% 1% 1% Larry Lessig *% *% *% - 1% 1% *% (Other) *% - *% - - *% *% (None of the above) 2% 1% 3% 3% 1% 1% 2% (Don't know) 3% 4% 2% 2% 1% 3% 2% 27. [DEMOCRATIC PRIMARY VOTERS] And which Democrat would be your second choice? Non- College No Total Men Women White White Degree Degree Joe Biden 38% 34% 40% 35% 42% 33% 41% Lincoln Chafee 1% 1% 2% 1% 2% *% 2% Hillary Clinton 26% 33% 22% 25% 28% 30% 23% Martin O'Malley 3% 4% 3% 5% 1% 4% 3% Bernie Sanders 13% 12% 13% 15% 9% 16% 11% Jim Webb 2% 3% 2% 1% 4% 1% 3% Larry Lessig 1% 1% 1% 1% - *% 1% (Other) 1% *% 2% 2% *% 2% 1% (None of the above) 7% 6% 7% 8% 5% 7% 6% (Don't know) 8% 6% 9% 7% 9% 7% 9% Under Under Total Age 45 45+ $50k $50k+ Lib Dem Joe Biden 38% 31% 43% 38% 38% 42% 40% Lincoln Chafee 1% 1% 2% 3% 1% 1% 2% Hillary Clinton 26% 29% 23% 28% 26% 23% 26% Martin O'Malley 3% 4% 3% 3% 4% 4% 4% Bernie Sanders 13% 10% 15% 12% 14% 12% 12% Jim Webb 2% 3% 1% 2% 3% 2% 2% Larry Lessig 1% 1% 1% 1% 1% 1% *% (Other) 1% 1% 1% 1% 1% 2% 1% (None of the above) 7% 7% 6% 6% 7% 7% 6% (Don't know) 8% 11% 5% 6% 6% 7% 8%

28. [REPUBLICAN PRIMARY VOTERS] I'm going to read a list of potential candidates for the 2016 Republican nomination. Please tell me which one you would like to see as the Republican presidential nominee. White White College No Total Men Women Men Women Degree Degree Jeb Bush 7% 7% 6% 6% 5% 5% 8% Ben Carson 18% 18% 17% 17% 19% 22% 14% Chris Christie 5% 3% 6% 3% 5% 3% 6% Ted Cruz 8% 8% 9% 7% 10% 10% 8% Carly Fiorina 9% 8% 11% 9% 10% 9% 10% Jim Gilmore *% *% - *% - *% - Lindsey Graham - - - - - - - Mike Huckabee 3% 2% 3% 3% 3% 3% 2% Bobby Jindal - - - - - - - John Kasich 4% 3% 4% 3% 5% 6% 1% George Pataki 1% - 1% - *% - 1% Rand Paul 2% 3% 2% 3% 2% 2% 2% Marco Rubio 9% 10% 8% 10% 9% 14% 6% Rick Santorum - - - - - - - Donald Trump 26% 29% 23% 30% 23% 18% 32% (Other) 3% 4% 1% 5% 1% 2% 3% (None of the above) 1% 1% 1% 1% 1% 1% 2% (Don't know) 4% 2% 7% 2% 7% 5% 4% Under Under White Total Age 45 45+ $50k $50k+ Evan Cons Rep Jeb Bush 7% 5% 8% 11% 5% 5% 5% 6% Ben Carson 18% 18% 17% 21% 15% 21% 20% 18% Chris Christie 5% 7% 4% 6% 4% 3% 3% 5% Ted Cruz 8% 10% 7% 8% 9% 12% 10% 9% Carly Fiorina 9% 8% 10% 10% 9% 8% 10% 9% Jim Gilmore *% *% - - *% - *% *% Lindsey Graham - - - - - - - - Mike Huckabee 3% 3% 2% 1% 4% 3% 3% 3% Bobby Jindal - - - - - - - - John Kasich 4% 2% 4% 1% 5% 1% 4% 3% George Pataki 1% - 1% 2% *% - 1% 1% Rand Paul 2% 4% 1% - 3% - 2% 2% Marco Rubio 9% 9% 10% 8% 10% 8% 11% 9% Rick Santorum - - - - - - - - Donald Trump 26% 27% 25% 25% 27% 29% 22% 27% (Other) 3% 3% 3% 1% 4% 3% 3% 3% (None of the above) 1% - 2% 1% 2% 1% 1% 1% (Don't know) 4% 3% 5% 6% 3% 5% 5% 4%

29. [REPUBLICAN PRIMARY VOTERS] And which Republican would be your second choice? White White College No Total Men Women Men Women Degree Degree Jeb Bush 10% 9% 11% 8% 11% 10% 11% Ben Carson 13% 14% 13% 15% 14% 12% 15% Chris Christie 5% 6% 4% 7% 4% 7% 4% Ted Cruz 6% 7% 6% 8% 5% 5% 8% Carly Fiorina 14% 11% 17% 11% 16% 18% 11% Jim Gilmore *% 1% - 1% - 1% - Lindsey Graham - - - - - - - Mike Huckabee 5% 4% 6% 4% 5% 4% 5% Bobby Jindal 1% 1% 1% 2% 1% 3% - John Kasich 4% 5% 3% 5% 3% 4% 4% George Pataki - - - - - - - Rand Paul 4% 6% 2% 6% 2% 2% 5% Marco Rubio 10% 10% 10% 8% 11% 14% 7% Rick Santorum *% - 1% - 1% *% 1% Donald Trump 12% 14% 11% 14% 12% 10% 13% (Other) 2% 1% 2% 2% 2% 1% 2% (None of the above) 5% 6% 4% 5% 4% 4% 6% (Don't know) 8% 5% 10% 5% 10% 7% 8% Under Under White Total Age 45 45+ $50k $50k+ Evan Cons Rep Jeb Bush 10% 14% 8% 11% 11% 10% 8% 11% Ben Carson 13% 16% 12% 11% 15% 17% 15% 13% Chris Christie 5% 7% 4% 5% 6% 4% 5% 5% Ted Cruz 6% 5% 8% 4% 7% 8% 8% 7% Carly Fiorina 14% 10% 17% 13% 14% 12% 16% 15% Jim Gilmore *% 1% - - *% 1% *% *% Lindsey Graham - - - - - - - - Mike Huckabee 5% 4% 5% 7% 4% 6% 5% 5% Bobby Jindal 1% - 2% 2% 1% 1% 1% 1% John Kasich 4% 3% 5% 4% 4% 1% 4% 4% George Pataki - - - - - - - - Rand Paul 4% 7% 2% 5% 3% 7% 4% 4% Marco Rubio 10% 5% 13% 10% 9% 9% 10% 9% Rick Santorum *% - 1% - *% 1% *% *% Donald Trump 12% 15% 10% 15% 11% 11% 12% 12% (Other) 2% 2% 1% 2% 1% 2% 1% 1% (None of the above) 5% 5% 5% 3% 6% 3% 4% 4% (Don't know) 8% 6% 8% 9% 7% 7% 7% 7%

30. Regardless of how you plan to vote, who do you believe will be the next president of the United States? College No Watch Total Dem Rep Ind Men Women White Black Degree Degree Debate (Joe Biden) 4% 7% 1% 4% 4% 4% 3% 8% 4% 4% 4% (Jeb Bush) 4% 2% 5% 5% 5% 2% 4% 2% 4% 3% 4% (Ben Carson) 3% 1% 6% 3% 2% 4% 4% - 4% 3% 3% (Lincoln Chafee) - - - - - - - - - - - (Chris Christie) 1% - 1% 1% 1% *% 1% - *% 1% 1% (Hillary Clinton) 28% 52% 10% 20% 27% 30% 25% 49% 32% 26% 28% (Ted Cruz) 2% 1% 4% 1% 2% 2% 2% 2% 2% 2% 2% (Carly Fiorina) 3% 1% 5% 4% 2% 4% 3% 4% 3% 3% 3% (Jim Gilmore) - - - - - - - - - - - (Lindsey Graham) - - - - - - - - - - - (Mike Huckabee) *% - 1% - - *% *% - - *% *% (Bobby Jindal) - - - - - - - - - - - (John Kasich) 1% - 1% *% *% 1% 1% - 1% *% 1% (Larry Lessig) - - - - - - - - - - - (Martin O'Malley) *% *% *% - *% - - - *% *% *% (George Pataki) *% 1% - - - *% - 2% - *% *% (Rand Paul) - - - - - - - - - - - (Marco Rubio) 2% *% 4% 3% 3% 2% 2% 1% 2% 3% 2% (Bernie Sanders) 5% 11% 1% 4% 6% 5% 6% 4% 6% 5% 5% (Rick Santorum) - - - - - - - - - - - (Donald Trump) 20% 8% 32% 22% 22% 18% 22% 9% 17% 22% 20% (Scott Walker) *% - 1% *% 1% - *% - *% *% *% (Jim Webb) - - - - - - - - - - - (Other) *% *% *% 1% *% *% *% - *% *% *% (Don't know) 26% 17% 28% 33% 23% 27% 26% 19% 25% 26% 26% Under Under Tea Total Age 35 35-54 55+ 65+ $50k $50k+ Lib Cons Party (Joe Biden) 4% 4% 5% 3% 1% 4% 3% 6% 2% *% (Jeb Bush) 4% 4% 4% 3% 1% 4% 4% 3% 4% 4% (Ben Carson) 3% 3% 3% 4% 6% 1% 5% 2% 4% 4% (Lincoln Chafee) - - - - - - - - - - (Chris Christie) 1% 1% 1% *% 1% *% 1% 1% 1% - (Hillary Clinton) 28% 27% 29% 29% 28% 34% 25% 42% 18% 13% (Ted Cruz) 2% 2% 3% 1% 1% 2% 2% - 4% 5% (Carly Fiorina) 3% 1% 2% 5% 6% 4% 3% 2% 4% 5% (Jim Gilmore) - - - - - - - - - - (Lindsey Graham) - - - - - - - - - - (Mike Huckabee) *% - 1% - - - *% - 1% 1% (Bobby Jindal) - - - - - - - - - - (John Kasich) 1% 1% *% 1% 1% *% 1% - 1% *% (Larry Lessig) - - - - - - - - - - (Martin O'Malley) *% - *% *% - 1% - *% *% *% (George Pataki) *% - - 1% 1% 1% - 1% - - (Rand Paul) - - - - - - - - - - (Marco Rubio) 2% 1% 1% 4% 4% 1% 3% *% 4% 3% (Bernie Sanders) 5% 12% 5% 1% 1% 4% 6% 11% 1% - (Rick Santorum) - - - - - - - - - - (Donald Trump) 20% 24% 21% 16% 14% 20% 20% 13% 26% 33% (Scott Walker) *% 1% *% - - - 1% - 1% 1% (Jim Webb) - - - - - - - - - - (Other) *% 1% *% *% *% *% *% *% *% - (Don't know) 26% 18% 24% 32% 36% 22% 25% 18% 28% 30% 31. If the 2016 presidential election were held today, how would you vote if the candidates were: College No Watch Total Dem Rep Ind Men Women White Black Degree Degree Debate Democrat Hillary Clinton 46% 85% 15% 31% 39% 52% 38% 87% 48% 45% 46% Republican Donald Trump 42% 9% 75% 37% 49% 35% 49% 9% 40% 43% 42% (Other) 3% 1% 2% 10% 4% 2% 3% 2% 2% 4% 3% (Wouldn't vote) 7% 3% 7% 16% 6% 8% 8% 1% 7% 7% 7% (Don't know) 2% 1% 1% 5% 2% 2% 2% 2% 2% 2% 2% Under Under Tea Total Age 35 35-54 55+ 65+ $50k $50k+ Lib Cons Party Democrat Hillary Clinton 46% 54% 44% 43% 39% 53% 41% 73% 22% 13% Republican Donald Trump 42% 35% 44% 44% 47% 35% 47% 18% 65% 83% (Other) 3% 4% 2% 3% 3% 2% 3% 2% 3% 1% (Wouldn't vote) 7% 6% 8% 7% 7% 7% 7% 6% 9% 2% (Don't know) 2% *% 2% 3% 4% 3% 1% 1% 2% 1%

32. Which of the following potential 2016 presidential matchups would make you more worried that American democracy is in trouble? College No Watch Total Dem Rep Ind Men Women White Black Degree Degree Debate If the race were between 39% 31% 47% 39% 42% 36% 43% 26% 36% 41% 39% Democrat Hillary Clinton and Republican Jeb Bush If the race were between 53% 62% 47% 50% 50% 55% 49% 71% 57% 50% 53% Democrat Bernie Sanders and Republican Donald Trump (Wouldn't vote) 1% 1% 1% 3% 2% 1% 1% 1% 1% 1% 1% (Don't know) 7% 6% 5% 8% 6% 8% 7% 2% 6% 7% 7% Under Under Tea Total Age 35 35-54 55+ 65+ $50k $50k+ Lib Cons Party If the race were between 39% 37% 41% 38% 42% 36% 41% 33% 47% 57% Democrat Hillary Clinton and Republican Jeb Bush If the race were between 53% 56% 50% 54% 50% 55% 52% 60% 47% 36% Democrat Bernie Sanders and Republican Donald Trump (Wouldn't vote) 1% 1% 2% 1% 1% 1% 1% 1% 1% 1% (Don't know) 7% 6% 7% 8% 7% 7% 6% 6% 5% 5% 33. Democrats are planning to hold a total of six presidential debates among the candidates competing to be the Democratic Party’s nominee -- is that too many debates, too few debates or about the right number? College No Watch Total Dem Rep Ind Men Women White Black Degree Degree Debate Too many 27% 25% 30% 25% 29% 26% 28% 23% 26% 28% 27% Too few 15% 11% 17% 18% 17% 13% 15% 14% 17% 13% 15% About right 53% 61% 48% 51% 50% 57% 52% 59% 53% 54% 53% (Don't know) 5% 3% 5% 6% 5% 5% 5% 4% 4% 5% 5% Under Under Tea Total Age 35 35-54 55+ 65+ $50k $50k+ Lib Cons Party Too many 27% 17% 29% 32% 34% 24% 30% 24% 30% 30% Too few 15% 21% 12% 13% 12% 15% 14% 15% 15% 15% About right 53% 57% 55% 49% 47% 54% 53% 57% 51% 51% (Don't know) 5% 5% 4% 6% 6% 7% 3% 3% 5% 4% 34. Republicans are planning to hold at least nine presidential debates among the candidates competing to be the Republican Party’s nominee -- is that too many debates, too few debates or about the right number? College No Watch Total Dem Rep Ind Men Women White Black Degree Degree Debate Too many 46% 53% 41% 43% 45% 47% 44% 53% 46% 46% 46% Too few 6% 5% 5% 11% 6% 6% 6% 4% 6% 6% 6% About right 43% 37% 51% 41% 45% 41% 46% 35% 46% 41% 43% (Don't know) 5% 5% 2% 5% 4% 6% 4% 8% 2% 7% 5% Under Under Tea Total Age 35 35-54 55+ 65+ $50k $50k+ Lib Cons Party Too many 46% 36% 46% 53% 50% 43% 50% 53% 41% 38% Too few 6% 11% 5% 4% 2% 7% 5% 7% 6% 5% About right 43% 50% 42% 40% 43% 43% 43% 37% 50% 53% (Don't know) 5% 4% 6% 4% 5% 7% 2% 3% 3% 4%

35. Did you watch or listen to the Republican presidential candidate debates held last week at Ronald Reagan Library in California? College No Watch Total Dem Rep Ind Men Women White Black Degree Degree Debate Yes 34% 27% 44% 29% 37% 32% 36% 28% 38% 32% 34% (Yes, only the first 5% 4% 5% 6% 6% 3% 4% 6% 2% 6% 5% debate that was held earlier) (Yes, only the second 4% 2% 4% 4% 4% 3% 4% 3% 6% 2% 4% debate that was held later) (Yes, both debates) 7% 7% 9% 6% 7% 8% 8% 2% 11% 5% 7% No 49% 59% 38% 54% 45% 53% 47% 61% 43% 54% 49% (Don't know/Refused) 1% 1% *% 1% 1% *% *% - - 1% 1% Under Under Tea Total Age 35 35-54 55+ 65+ $50k $50k+ Lib Cons Party Yes 34% 28% 31% 42% 48% 28% 40% 30% 40% 53% (Yes, only the first 5% 5% 5% 4% 4% 5% 4% 5% 4% 3% debate that was held earlier) (Yes, only the second 4% 4% 4% 3% 2% 3% 4% 2% 6% 4% debate that was held later) (Yes, both debates) 7% 5% 8% 9% 10% 6% 8% 7% 9% 7% No 49% 56% 53% 42% 37% 58% 43% 55% 41% 33% (Don't know/Refused) 1% 1% *% *% - 1% *% 1% *% - 36. Based on what you have heard or read about the debate, and setting aside which candidate you are supporting, who do you think did the best job in the debates? College No Watch Total Dem Rep Ind Men Women White Black Degree Degree Debate Jeb Bush 5% 7% 3% 3% 5% 4% 4% 5% 5% 4% 5% Ben Carson 6% 5% 8% 3% 8% 4% 5% 7% 7% 6% 6% Chris Christie 2% 2% 2% 1% 3% 1% 2% 2% 3% 1% 2% Ted Cruz 1% 1% 2% 2% 2% 1% 1% 1% 2% 1% 1% Carly Fiorina 27% 21% 33% 29% 26% 28% 30% 16% 33% 23% 27% Lindsey Graham *% *% - - *% - - - *% - *% Mike Huckabee 1% - 2% - 1% 1% 1% 1% *% 1% 1% Bobby Jindal *% 1% - - 1% *% *% 1% - 1% *% John Kasich 2% 4% 1% 1% 1% 3% 2% 3% 4% 1% 2% George Pataki - - - - - - - - - - - Rand Paul 1% *% *% 2% 1% *% 1% - 1% *% 1% Marco Rubio 5% 5% 6% 4% 5% 6% 6% 3% 7% 4% 5% Rick Santorum - - - - - - - - - - - Donald Trump 14% 11% 20% 9% 18% 11% 15% 11% 9% 18% 14% Scott Walker - - - - - - - - - - - (Other) 2% 3% *% 3% 2% 2% 2% - 1% 2% 2% (None of the above) 5% 7% 4% 5% 3% 7% 5% 9% 4% 6% 5% (Don't know) 29% 34% 20% 37% 26% 32% 25% 41% 24% 33% 29% Under Under Tea Total Age 35 35-54 55+ 65+ $50k $50k+ Lib Cons Party Jeb Bush 5% 8% 3% 4% 3% 5% 4% 7% 3% - Ben Carson 6% 7% 6% 6% 5% 6% 6% 6% 7% 4% Chris Christie 2% 1% 2% 2% 1% 1% 3% 2% 2% - Ted Cruz 1% 2% 2% *% *% 1% 1% 1% 2% 4% Carly Fiorina 27% 18% 27% 33% 33% 19% 33% 25% 32% 37% Lindsey Graham *% *% - - - - *% *% - - Mike Huckabee 1% 1% 2% - - 1% 1% - 1% 3% Bobby Jindal *% 1% *% - - *% *% 1% *% - John Kasich 2% 2% 2% 3% 3% 2% 2% 3% 1% *% George Pataki - - - - - - - - - - Rand Paul 1% 1% 1% *% 1% *% 1% *% *% 2% Marco Rubio 5% 5% 3% 7% 8% 3% 6% 4% 7% 7% Rick Santorum - - - - - - - - - - Donald Trump 14% 13% 14% 15% 18% 19% 12% 12% 16% 22% Scott Walker - - - - - - - - - - (Other) 2% 1% 2% 2% 1% 3% 1% 3% 1% 1% (None of the above) 5% 5% 7% 4% 3% 5% 5% 6% 4% *% (Don't know) 29% 37% 29% 24% 25% 34% 24% 30% 24% 18%

37. Based on what you have heard or read about the debate, and setting aside which candidate you are supporting, who do you think did the worst job in the debates? College No Watch Total Dem Rep Ind Men Women White Black Degree Degree Debate Jeb Bush 7% 6% 9% 5% 12% 3% 9% 3% 5% 9% 7% Ben Carson 4% 3% 5% 2% 5% 3% 4% 6% 4% 3% 4% Chris Christie 3% 2% 4% 5% 3% 3% 3% 2% 4% 3% 3% Ted Cruz 2% 3% 1% 1% 3% 1% 1% 3% 3% 1% 2% Carly Fiorina 3% 3% 3% 3% 3% 4% 3% 3% 4% 3% 3% Lindsey Graham 1% 1% 1% 1% 2% 1% 1% 2% 1% 1% 1% Mike Huckabee 2% 2% 2% *% 1% 2% 1% 2% 2% 1% 2% Bobby Jindal 1% 1% 1% *% *% 1% 1% 1% 1% 1% 1% John Kasich 1% *% 2% 1% 1% 1% 1% *% 2% 1% 1% George Pataki 1% - 1% 2% 1% *% 1% - *% 1% 1% Rand Paul 4% 2% 8% 3% 4% 4% 5% 1% 5% 4% 4% Marco Rubio 2% 1% 2% 3% 3% *% 2% 1% 1% 2% 2% Rick Santorum *% *% *% - *% *% *% - *% *% *% Donald Trump 26% 34% 20% 22% 21% 30% 24% 30% 28% 24% 26% Scott Walker 1% 1% 1% 2% 2% 1% 2% 1% 2% 1% 1% (Other) 3% 4% 2% 3% 2% 3% 3% 1% 3% 3% 3% (None of the above) 4% 5% 4% 2% 3% 4% 4% 4% 4% 4% 4% (Don't know) 36% 33% 33% 44% 35% 36% 34% 41% 30% 39% 36% Under Under Tea Total Age 35 35-54 55+ 65+ $50k $50k+ Lib Cons Party Jeb Bush 7% 7% 8% 6% 6% 8% 7% 8% 7% 13% Ben Carson 4% 3% 5% 4% 4% 3% 5% 3% 4% 6% Chris Christie 3% 2% 4% 3% 3% 3% 3% 3% 3% 8% Ted Cruz 2% *% 1% 3% 2% 1% 3% 1% 2% - Carly Fiorina 3% 5% 3% 2% 2% 3% 4% 4% 3% 2% Lindsey Graham 1% 1% 1% 1% 2% 1% 1% *% 2% 1% Mike Huckabee 2% 1% 2% 2% 2% 1% 2% 2% 1% 2% Bobby Jindal 1% - 1% 1% 1% 2% *% 2% *% 1% John Kasich 1% *% 2% 1% 1% 1% 2% 1% 2% 6% George Pataki 1% 1% 1% *% - 1% 1% - 1% - Rand Paul 4% 2% 3% 7% 10% 2% 6% 1% 8% 5% Marco Rubio 2% 2% 2% 1% 1% 2% 1% 1% 2% - Rick Santorum *% - *% *% 1% - *% - *% - Donald Trump 26% 31% 22% 25% 24% 25% 25% 33% 21% 15% Scott Walker 1% *% 2% 2% 1% 1% 2% 1% 2% - (Other) 3% 3% 3% 3% 2% 3% 2% 4% 2% 4% (None of the above) 4% 4% 4% 3% 3% 3% 5% 4% 4% 6% (Don't know) 36% 37% 36% 35% 35% 40% 31% 32% 34% 31% 46. Regardless of how you plan to vote, which of the following better describes how you feel about Donald Trump's comments on the campaign trail? College No Watch Total Dem Rep Ind Men Women White Black Degree Degree Debate He is too mean and blunt 49% 69% 34% 42% 42% 55% 46% 65% 57% 44% 49% to be president He tells it like it is, 44% 22% 62% 50% 50% 38% 47% 26% 38% 47% 44% and we need that now in a president (Don't know) 7% 9% 4% 9% 8% 7% 6% 8% 5% 9% 7% Under Under Tea Total Age 35 35-54 55+ 65+ $50k $50k+ Lib Cons Party He is too mean and blunt 49% 54% 46% 48% 47% 47% 51% 64% 36% 20% to be president He tells it like it is, 44% 39% 47% 44% 45% 44% 45% 28% 59% 74% and we need that now in a president (Don't know) 7% 7% 7% 8% 8% 9% 5% 8% 5% 5%

47. [REPUBLICAN PRIMARY VOTERS] Since the 2014 midterm election, do you think the Republican majorities in the U.S. House and Senate have done all they could to block or reverse Barack Obama's agenda? White White College No Total Men Women Men Women Degree Degree Yes 30% 31% 30% 32% 28% 33% 28% No 66% 68% 64% 66% 66% 66% 67% (Don't know) 4% 1% 6% 2% 7% 1% 5% Under Under White Total Age 45 45+ $50k $50k+ Evan Cons Rep Yes 30% 34% 28% 32% 30% 26% 27% 30% No 66% 62% 69% 62% 67% 67% 71% 66% (Don't know) 4% 4% 4% 5% 3% 6% 3% 4% 48. [REPUBLICAN PRIMARY VOTERS] [IF NO, ASK:] And why do you think that is? Is it mainly because... White White College No Total Men Women Men Women Degree Degree They didn't really want 28% 30% 27% 30% 28% 27% 29% to block Obama's agenda. They aren't smart enough 13% 11% 15% 11% 12% 13% 13% to block Obama's agenda. They would rather fight 38% 42% 33% 40% 35% 33% 42% each other (Other/Mix) 13% 10% 15% 12% 16% 17% 10% (Don't know) 8% 7% 10% 7% 9% 10% 7% Age White Total 45+ $50k+ Evan Cons Rep They didn't really want 28% 24% 27% 35% 30% 28% to block Obama's agenda. They aren't smart enough 13% 16% 11% 13% 11% 14% to block Obama's agenda. They would rather fight 38% 39% 38% 33% 37% 38% each other (Other/Mix) 13% 14% 14% 11% 13% 11% (Don't know) 8% 7% 10% 8% 8% 8% 49. Would you say you feel betrayed by politicians from your political party, or not? College No Watch Total Dem Rep Ind Men Women White Black Degree Degree Debate Yes 51% 39% 60% 60% 53% 50% 55% 40% 50% 52% 51% No 40% 54% 36% 25% 39% 42% 37% 54% 43% 39% 40% (No party/independent) 3% 1% 1% 10% 4% 2% 3% 2% 2% 4% 3% (Don't know) 5% 6% 3% 5% 4% 6% 5% 5% 4% 6% 5% Under Under Tea Total Age 35 35-54 55+ 65+ $50k $50k+ Lib Cons Party Yes 51% 49% 49% 56% 61% 54% 50% 44% 61% 65% No 40% 44% 41% 37% 32% 37% 43% 48% 33% 31% (No party/independent) 3% 3% 4% 2% 1% 2% 3% 2% 2% 1% (Don't know) 5% 4% 6% 5% 7% 6% 4% 6% 4% 3% 50. How concerned are you that scandals would have a serious effect on Hillary Clinton's administration if she were elected president? College No Watch Total Dem Rep Ind Men Women White Black Degree Degree Debate Very concerned 40% 19% 62% 40% 42% 39% 45% 20% 41% 40% 40% Somewhat concerned 22% 28% 16% 22% 22% 22% 22% 22% 21% 23% 22% Not very concerned 15% 23% 9% 12% 13% 17% 15% 17% 17% 14% 15% Not at all concerned 20% 28% 11% 23% 20% 19% 16% 36% 20% 20% 20% (Don't know) 3% 2% 2% 3% 2% 3% 2% 6% 2% 3% 3% Under Under Tea Total Age 35 35-54 55+ 65+ $50k $50k+ Lib Cons Party Very concerned 40% 36% 37% 46% 51% 37% 44% 24% 56% 71% Somewhat concerned 22% 30% 22% 17% 17% 23% 21% 26% 18% 10% Not very concerned 15% 18% 13% 15% 9% 12% 17% 21% 9% 3% Not at all concerned 20% 14% 25% 19% 19% 24% 17% 28% 14% 13% (Don't know) 3% 2% 3% 3% 3% 4% 1% 2% 3% 3%

51. Do you think Hillary Clinton is lying about how her emails were handled while she was secretary of state? College No Watch Total Dem Rep Ind Men Women White Black Degree Degree Debate Yes 58% 31% 82% 64% 65% 52% 65% 26% 62% 55% 58% No 32% 57% 12% 25% 25% 37% 27% 58% 32% 31% 32% (Don't know) 10% 12% 6% 12% 10% 10% 8% 16% 6% 14% 10% Under Under Tea Total Age 35 35-54 55+ 65+ $50k $50k+ Lib Cons Party Yes 58% 59% 61% 55% 58% 51% 63% 40% 77% 89% No 32% 27% 33% 33% 33% 35% 30% 48% 17% 9% (Don't know) 10% 14% 6% 11% 9% 14% 7% 12% 6% 2%