Embed Size (px)
Citation preview

ABN: 44 079 902 499
10 Abbotsford Street, West Leederville, Western Australia 6007 PO Box 1386, West Leederville Perth Western Australia 6901
Tel: 61 8 9318 5600 Fax: 61 8 9238 1380 Web: www.foxresources.com.au Email: [email protected]
3 December 2020
Fox Resources Ltd Shareholder Update
Dear Shareholders,
Announcement - Fox Resources Limited
Fox Resources Limited (Fox) wishes to announce it has completed an update of the geological model and the estimate of resources on EPC 2196 coking coal tenement, at Bundaberg Queensland. As a result, the JORC Resources are now as follows:
Indicated Resources 12.6Mt of high-grade coking coal
Inferred Resources 46.4Mt of high-grade coking coal
The updated JORC Resource Model Report has been finalised, and the total JORC Resources for MDLA 3040 and EPC 2196 are as follows:
Indicated Resources 76.9Mt of high-grade coking coal
Inferred Resources 129.4Mt of high-grade coking coal
Exploration Target1 25 to 80Mt Fox owns 50% of the Bundaberg MDLA3040 and EPC 2196 tenements.
Fox advises that a Memorandum of Understanding has been signed with a mining-credentialed renewable energy developer and constructor. They will investigate and report to Fox on an operation energised by 100% renewable energy.
The auditors Grant Thornton have commenced the audit of the Financial
Statements for the period, 30 June 2020. Once the audit is finalised the financial statements will be released.
Terry Streeter
Chairman and Non-Executive Director
Model and Resource Summary
The Bundaberg North Coal Project consists of EPC 1523, EPC 2195, EPC 2196, and
MDL 3040. EPC 2195 and EPC 2196 were acquired in August 2020.
EPC 1523, MDL 3040, and EPC 2196 are held jointly 50:50 by Fox Coal Pty Ltd (a
subsidiary of Fox Resources Limited) and Zimprops Coal Pty Ltd. The project is in
the Maryborough Basin and lies approximately 8km to the north-west of the township
of Bundaberg, on the central coast of Queensland and is located near the main East
Coast railway line and good roads pass through the tenement, thereby allowing easy
access to transport the coking coal to either Gladstone or the Port of Bundaberg.
In October 2019, a revision to the existing structural and coal quality models and an
upgrade of the existing resource estimate was completed for EPC 1523 based on
data provided by an extensive drilling program completed in August 2019. With the
purchase of adjacent tenures EPC 2196 and EPC 2195 from Gen Resources, Fox
Resources Limited has commissioned ROM Resources to update these geological
models and Resource Estimates to now include EPC 2196. As no recent work has
been carried out in EPC 2195, this tenure has not been included in these latest
modelling and Resource Estimates.
No substantial exploration has been carried out in EPC 2196 since 2013 with the last
Resource Estimate generated in 2014. The data sets from EPC 1523’s 2019 model
and EPC 2196’s 2014 model (which were both to the standard of the 2012 JORC
Code) have been combined, re-correlated, remodelled, and new resource tonnages
estimated (See Figure 1)
Data and geological models generated have also formed the basis for a working
section model that was used in a Scoping Study for the project, which is currently in
progress and due for completion in December 2020.
The results of the recent exploration, modelling, and resource estimation (to the
standard of the 2012 JORC Code) (Table 1) is summarised below:
Indicated Resources of 76.9Mt of hard coking coal, (64.3Mt of which is in MDL
3040).
Inferred Resources of 129.4Mt of hard coking coal (83Mt MDL 3040, EPC
2196 46.4Mt)
Additional coal (mostly downdip), reported as an Exploration Target range of
25Mt to 80Mt (Table 2)
The 2019 drilling campaign revealed there were shallow coal intersections in addition
to the previously reported deeper Inferred Resources in the south of the tenure.
Subsequent laboratory testing confirmed that the quality of the coking coal is
outstanding with clean coal composite results giving products at 10% ash, 8.5

crucible swell number, Geisler fluidity around 1,200ddm and total dilatation and
contraction results as high as +240%.
Table 1: EPC 1523 and EPC 2196 Resource Quantities EPC Formation* Seams Inferred
Tonnage
(Mt)
Indicated
Tonnage
(Mt)
Raw
Ash
(%
adb)
Raw
Volatile
Matter
(% adb)
Raw
Crucible
Swell
Number
Raw
Total
Sulphur
(% adb)
1523 BCM GU, GL1, GL2, H1 ‘- 64.3 29.3 23.5 8.5 0.78
2196 BCM F, GU, GL1, GL2,
H1
‘- 12.6 32.8 23.9 8.5 0.83
1523 BCM F, GU, GL1, GL2,
H1
83.0 - 27.5 23.0 8.0 0.87
2196 BCM E2, F, GU, GL1,
GL2, H1, H2
46.4 - 28.4 22.9 8.5 0.69
129.4 76.9
Note: MDL3040 covers about 4/5 of the EPC1523, but none of EPC 2196. *BCM = Burrum Coal
Measures
Details of the calculations pertaining to the Inferred and Indicated Resources are
contained in Appendix 1 (JORC Table 1). Additionally, an Exploration Target1 in the
range of 25 to 80Mt was estimated (Table 2). This Exploration Target is in addition to
the estimates tabled above and was based on the same Minescape model as the
resources in Table 1, but which fell outside the limit of the masks, especially down
dip to the east, or contained upper seams.
Table 2: EPC 1523 and EPC 2196 Exploration Targets Tenement Formation Seams Exploration
Target
Range
(Mt)
Raw
Ash
(% adb)
Raw
Volatile
Matter
(% adb)
Raw Calorific
Value
Kcal/kg GAD
Raw
Crucible
Swell
Number
EPC
1523a
BCM B1, B2, E2,
E3, F, GU,
GL1, GL2
5–35 18-30 22-25 6,500–7,000 6.5-8.0
EPC
2196b
BCM B1, B2, E2,
E3, F, GU,
GL1, GL2
20-45 18-25 22-25 6,500-7,000 6.0-8.0
Total 25-80
Source: a Biggs (2019);
b Biggs (2020) *BCM = Burrum Coal Measures
1 It should be noted that the Exploration Target tonnage ranges quoted above are conceptual in nature and there has
been insufficient exploration to define a coal resource. Although a preliminary analysis was undertaken, insufficient
data exists to confidently correlate coal seams. It is uncertain whether further exploration may lead to the reporting of
a JORC-standard resource however there is some evidence to support the current exploration tonnage calculations, and
the sufficient coal thicknesses interpreted from historic drilling to warrant further investigation in some areas.

Figure 1 Location of Masks

Further drilling within EPC 2196 and potentially several west to east 2D seismic lines
in MDL 3040 are required to convert the reported Inferred and Indicated Resources
to a higher confidence level class. Any additional exploration data acquired could
also be used to support an MDL application over EPC 2196.
Appendix 1: JORC CODE 2012 Table 1
Section 1: Sampling Techniques and Data Table
Criteria/JORC Code explanation Commentary
Sampling techniques
Nature and quality of sampling (e.g. cut channels, random chips, or specific specialised industry standard measurement tools appropriate to the minerals under investigation, such as down hole gamma sondes, or handheld XRF instruments, etc). These examples should not be taken as limiting the broad meaning of sampling. Include reference to measures taken to ensure sample representivity and the appropriate calibration of any measurement tools or systems used. Aspects of the determination of mineralisation that are Material to the Public Report. In cases where ‘industry standard’ work has been done this would be relatively simple (e.g. ‘reverse circulation drilling was used to obtain 1m samples from which 3kg was pulverised to produce a 30g charge for fire assay’). In other cases, more explanation may be required, such as where there is coarse gold that has inherent sampling problems. Unusual commodities or mineralisation types (e.g. submarine nodules) may warrant disclosure of detailed information.
Samples have mostly been taken from Diamond core of 61mm diameter, and for FXBU016L in EPC 1523 triple tube large diameter core of 100mm diameter. Mostly the interval from E1 to H1 seam was cored.
In 2013-2014 Salva Resources cored from the A seam down in EPC 2196. For the higher seams chip samples have been obtained from the rotary chip drilling, except where they have been too contaminated or washed away by the high-water flows encountered in some holes. These were generally washed to CF1.45. Where core has been taken recoveries have exceeded 90%.
Sample representatively was confirmed by the comparison between the Diamond Core samples and geophysical logs.
In EPC 1523 core samples from the holes FXBU011, 13, 14, 15, 16, 18, 19, and 20 were taken and stored in a freezer and were dispatched to the Mitra PTS Laboratory in Gladstone for coal quality analysis. An RFA has been created and implemented along with a suitable analysis methodology.
The same procedure was applied to chips collected for FXBU012 and FXBU022R.
Drilling techniques
Drill type (e.g. core, reverse circulation, open-hole hammer, rotary air blast, auger, Bangka, sonic, etc) and details (e.g. core diameter, triple or standard tube, depth of diamond tails, face-sampling bit or other type, whether core is oriented and if so, by what method, etc).
In all but the 2019 program diamond core drilling was used for the twin of the initial chip hole. Standard HQ wireline core drilling was undertaken with core obtained from a diamond tail with the pre-collar drilled to approximately 250m. The pre-collar was drilled with open-hole rotary drilling.
Large Diameter core from FXBU016L was obtained by using a 4C triple-tube (i.e. 102mm diameter).
Drill sample recovery
Method of recording and assessing core and chip sample recoveries and results assessed. Measures taken to maximise sample recovery and ensure representative nature of the samples.
The core recovery was done on a drill run basis using the driller’s depths and determining the recovery percentage from the drill run length and the length of core returned. Core recovery was excellent with recovery generally >90%. The calculation of sample mass recovery was also particularly good with recoveries mostly exceeding 85% against a theoretical sample mass calculation. Overall total recovery (core

Criteria/JORC Code explanation Commentary
Whether a relationship exists between sample recovery and grade and whether sample bias may have occurred due to preferential loss/gain of fine/coarse material.
recovery x sample mass recovery) exceeded 81% for each sample analysed. For the GL1 and GL2 seams, where the initial core recovery was insufficient, these seams were redrilled.
Logging
Whether core and chip samples have been geologically and geotechnically logged to a level of detail to support appropriate Mineral Resource estimation, mining studies and metallurgical studies. Whether logging is qualitative or quantitative in nature. Core (or costean, channel, etc) photography. The total length and percentage of the relevant intersections logged.
All the samples have been geologically logged based on field observation and coding using the Australian industry standard CoalLog system.
All holes have been geophysically logged with a deviation tool (for hole deviation), gamma, density, calliper, and resistivity probes. Geophysical logging of the core hole has also been undertaken once the hole is completed. Several holes had acoustic scanner sonde run.
Geological logging is qualitative with samples of each metre collected into plastic chip trays and all samples have been photographed. All coal core has been retained and stored in a freezer prior to coal quality analysis.
The total length of the borehole has been geologically logged. Drilling deeper in the stratigraphy thoughout the project has not intersected any coal seams below the seams correlated to drill holes on adjacent tenements.
Sub-sampling techniques and sample
preparation
If core, whether cut or sawn and whether quarter, half or all core taken. If non-core, whether riffled, tube sampled, rotary split, etc and whether sampled wet or dry. For all sample types, the nature, quality, and appropriateness of the sample preparation technique. Quality control procedures adopted for all sub-sampling stages to maximise representivity of samples. Measures taken to ensure that the sampling is representative of the in situ material collected, including for instance results for field duplicate/second-half sampling. Whether sample sizes are appropriate to the grain size of the material being sampled.
The core has been sampled using coal industry standard procedures. Samples have been stored in a freezer to retain the coal quality properties prior to the analysis.
Up to 64 ply samples were taken in each hole, but typically 30 samples of chips and core were collected.
An RFA (Request for Analysis) has been generated which outlines the sample collected and the proposed sampling of plies, instructions to make up composites once ply analyses are available and finally, requests for suitable float/sink washability testing.
Quality of assay data and laboratory tests
The nature, quality and appropriateness of the assaying and laboratory procedures used and whether the technique is considered partial or total. For geophysical tools, spectrometers, handheld XRF instruments, etc, the parameters used in determining the analysis including instrument make and model, reading times, calibrations factors applied and their derivation, etc.
Both raw coal analytical sampling and clean coal composite laboratory analysis has been completed.
Geophysical logging by deviation tool, gamma, density, calliper and resistivity has been conducted on the initial hole with this to be completed on the core hole once it is completed using calibrated sondes undertaking industry standard techniques, reading times and logging speeds.
Laboratories used (Bureau Veritas, ALS, and Mitra PTS) are NATA accredited and each testing methodology adheres to the relevant Australian Standards. Deviations to the standard or local laboratory methods

Criteria/JORC Code explanation Commentary
Nature of quality control procedures
adopted (e.g. standards, blanks,
duplicates, external laboratory checks) and
whether acceptable levels of accuracy (i.e.
lack of bias) and precision have been
established.
are documented in each analysis report.
Verification of sampling and assaying
The verification of significant intersections by either independent or alternative company personnel. The use of twinned holes. Documentation of primary data, data entry procedures, data verification, data storage (physical and electronic) protocols. Discuss any adjustment to assay data.
Field explorations was conducted by Salva HDR, Xplore Resources, and GeoConsult. Their geologist conducted field logging and sampling of core and chips and also corrected data to geophysics and updated sample depths.
All partially-cored holes were HQ wireline diamond drilling (61mm) A twinned hole FXBU016L of an initial chip hole for FXBU016 was completed in EPC 1523.
Drilling was completed by Wizard Drilling, Downforce, and Gladstone and Burnett Drilling.
The geophysical logging was undertaken Walton Bore Geophysics, Geolog, Surtron.
All the field data was then provided to ROM Resources, who validated the data prior to databasing and modelling.
Location of data points
Accuracy and quality of surveys used to locate drill holes (collar and down-hole surveys), trenches, mine workings and other locations used in Mineral Resource estimation. Specification of the grid system used. Quality and adequacy of topographic control.
The borehole collar of the exploration holes was initially surveyed using a hand-held GPS. The GPS integrated for an extended period therefore the accuracy is believed to be +/- 3m in easting and northing however the elevation is not considered accurate. Final survey was carried out by Walton Borehole Geophysics using a differential GPS system. The coordinate system used was GDA94. The grid system is Map Grid of Australia (MGA) 94 zone 56. Accuracies of +/- 0.15m are quoted.
Data spacing and distribution
Data spacing for reporting of Exploration Results. Whether the data spacing, and distribution is sufficient to establish the degree of geological and grade continuity appropriate for the Mineral Resource and Ore Reserve estimation procedure(s) and classifications applied. Whether sample compositing has been applied.
Exploration drilling was completed on approximately a 1,200m spacing. ICX drilled a total of seven (7) holes in EPC 2196 and Fox Resources have drilled twenty-seven (27) holes in EPC 1523. There are insufficient holes in the project area to determine Measured Resource estimates currently, but by the end of the program there was sufficient drilling information to report Indicated and Inferred Resources. Average RMS borehole spacing for those holes used as PoO stands at 695m.
Drilling confirmed that the main target seams in the Burrum Coal Measures are the F, GU, GL1, and GL2. Individual thicknesses ranged from 0.9 to 2.46M where the GL1 and GL2 had coalesced.
Ply samples were composited on a full seam basis for raw and clean coal composite basis (washed to make a 10% clean cash product) for the F, GU, GL1, GL2 and H1 seams.
Orientation of data in relation to Drilling to date has established that the regional strike is

Criteria/JORC Code explanation Commentary
geological structure
Whether the orientation of sampling achieves unbiased sampling of possible structures and the extent to which this is known, considering the deposit type. If the relationship between the drilling orientation and the orientation of key mineralised structures is considered to have introduced a sampling bias, this should be assessed and reported if material.
about 340° (degrees) and that the exploration plan was to drill boreholes on perpendicular section lines to assess dip and variability. Dips were found to vary between 3-12° to the east, with shallower dips in the south. No major faulting was observed during the drilling program to date, although a small fault was added at the modelling stage to account for a perturbation of structure contours around FXBU003R. A small fault was intersected in FXBU020R, but the throw is estimated to be <2m.
Sample security
The measures taken to ensure sample security
The core was collected directly from the drill site by road courier who delivered it directly to the analytical laboratory. Tracking paperwork ensured efficient delivery and sample security.
Audits or reviews
The results of any audits or reviews of sampling techniques and data.
No external audits have been performed however a review of the modelling was conducted by Agricola Pty Ltd in 2018 for a 2015 Valmin Code Valuation and the model was found to be ‘fit-for-purpose’.
Section 2: Reporting of Exploration Results
Criteria/JORC Code explanation Commentary
Mineral tenement and land tenure status:
Type, reference name/number, location and
ownership including agreements or material
issues with third parties such as joint
ventures, partnerships, overriding royalties,
native title interests, historical sites,
wilderness or national park and
environmental settings.
The security of the tenure held at the time of
reporting along with any known
impediments to obtaining a licence to
operate in the area
Exploration Permit for Coal 1523 was granted to
Conarco Minerals Pty Ltd on 20th July 2009 for a term
of five (5) years and consisted of eighty-one (81) sub-
blocks. In 2014 the tenement was renewed for five (5)
years. The tenure was renewed again on the 20th July
2019 for a further five (5) years with the expiry due on
19th July 2024 (Table 3). After a series of
relinquishments, the tenure currently consists of thirty
(30) sub-blocks and covers an area of approximately
91.4km2.
Conarco Minerals Pty Ltd assigned 100% interest in
EPC 1523 to a joint venture partnership (JV) of Cliffs
Australia Coal Pty Ltd (50%), Jacaranda Coal Limited
(35%) and XLX Exploration Pty Ltd (15%). The joint
venture partnership was operated under a
management company, Currawong Coal Pty Ltd. In
December 2012, 100% interest of the tenure was sold
by the Currawong Joint Venture partnership to Fox
Resources Limited. In November 2017 Fox Resources
sold 50% share of EPC 1523 to Zimprops Coal Pty Ltd.
The company is no longer publicly listed on the
Australian Stock Exchange (ASX).
In October 2019 Fox Coal Pty Ltd and Zimprops Coal
Pty Ltd lodged an MDL application over EPC 1523 for a

Criteria/JORC Code explanation Commentary
term of five (5) years. MDL 3040 is currently awaiting
approval of grant which is expected to be finalised late
November 2020. In March 2020 Zimprops Coal Pty Ltd
purchased 10% of Fox Coal Pty Ltd.
On the 3rd August 2020 Fox Resources Limited and
Zimprops Coal Pty Ltd purchased a 50% equal share of
Gen Resources Pty Ltd who hold two (2) coking coal
tenements EPC 2196 and EPC 2195 adjacent north
and south respectively of MDL 3040 (Figure 2). EPC
2196 comprises of eight (8) sub-blocks adjacent MDL
3040 and is approximately 24km2 in area. One (1)
sub-block is covered by the Urban Restricted Area
RA384. EPC 2196 was renewed for a further five (5)
years on the 27th of November 2019 and expires on
the 24th February 2024. EPC 2195 comprises seven
(7) sub-blocks adjoining to the south of MDL 3040
however it is totally covered by restricted areas (RA’s)
and all, but one (1) sub-block is covered by restricted
area urban (RA 384). There are also two (2) restricted
areas (RA 215 Kolan Weir over one (1) sub-block and
RA 384 Urban Restricted Area over (1) sub-block)
(Figure 1) in EPC 1523. EPC 2195 expires on the 28th
April 2024. The Project area is located on the
Queensland 1:250,000 scale geological series sheet
SG56-2 Bundaberg, and on the Queensland 1:100,000
scale geological series sheet 9348 Bundaberg.
. A native title claim has been lodged over the area by
the Port Curtis Coral Coast Registered Native Title
Claimants. A Cultural Heritage Management
Agreement (CHMA) has been executed between Fox
Resources Limited and Port Curtis Coral Coast
Registered Native Title Claimants.
There are no identified cultural heritage sites within the
tenement.
There are several environmental impediments and
conditions that exist within the lease including several
endangered regional ecosystems that require a 500m
buffer around the identified sites. The accuracy or
validity of the ERE’s remains to be confirmed by
modern mapping. The existing environmental Authority
(EA) was successfully varied in March 2020 to allow
some drilling within these buffers.
The tenement is extensively covered by privately held
farmland that is used for various crops including sugar
cane and other vegetables along with small scale
farming.

Criteria/JORC Code explanation Commentary
Exploration done by other parties
Acknowledgment and appraisal of
exploration by other parties.
There has been coal exploration undertaken since the
1960s in the surrounding region which has targeted
coal within the Burrum Coal Measures. Thiess
Exploration in ATP79C (1969-CR2954) drilled core hole
76C-2 to a depth of 97.5m just outside the south-west
corner of the area now covered by EPC 2195. This
hole intersected two coal seams of 0.3m and 1.52m
thickness at depths of 51.8m and 57.6m, respectively.
No coal quality data was made available.
Target Exploration in ATP82C (1970-CR3355) drilled
sixteen (16) open and partly cored drill holes (TM
series) within the area of EPC 1523. Coal seams
between 0.21m and 1.68m thick were encountered
however these thicknesses are based on non-
geophysically logged open holes. Most drill holes
intersected two (2) thin coal seams ranging from 0.09m
to 1.58m apart. One of the cored holes, TM75K6
intersected three thin coal seams between 0.49 and
0.62m over an interval of 2.49m (Figure A2-1). The
coal quality data indicates coking coal characteristics
with the potential to be hard coking coal.
Consolidated Gold Fields in EPC 88C (1971- CR3555)
drilled three (3) open holes and two (2) core holes just
outside the north-west corner of EPC 2196. Cored
borehole CGA_3 was drilled to a depth of 67.8m
intersected three coal seams as shown in Figure A2-2.
The cumulative coal thickness is 2.44m. The coal
quality data presented in this figure demonstrates the
coking properties of the coal seams within the Burrum
Coal Measures.
Figure A2-1: Coal Quality for Borehole TM75K6
Source: modified after Target Exploration (1970)

Criteria/JORC Code explanation Commentary
The Gray King Coke Index of G2 to G3 indicates the
coal would be potentially suitable for coke manufacture.
The second core hole CGA_5 drilled only 200 metres
and down dip from CGA_3 also intersected three
relatively thin coal seams. The cumulative coal
thickness was 1.2 metres. This thickness variation was
considered by Consolidated Goldfields to be due to the
lenticular nature of the coal seams.
Coal Exploration has also been carried out by Booyan
Coal Pty Ltd (EPC 969), Waratah Coal (EPC 1268) and
TerraCom Limited (EPC 1872), where mapping, drilling
and laboratory analyses were carried out, however
tenure Final Reports detailing exploration programs
have yet to be made open file for EPC 969.
Figure A2-2: Coal Quality for Borehole CGA_3

Criteria/JORC Code explanation Commentary
Source: Modified after Consolidated Gold Fields
(1971)
Geology
Deposit type, geological setting, and style of
mineralisation.
The coal is hosted in the Cretaceous Burrum Coal
Measures. Structure in the area is dominated by the
Bundaberg Anticline, whose north-trending axis passes
to the west of the EPC.
Drill hole Information
A summary of all information material to the
understanding of the exploration results
including a tabulation of the following
information for all Material drill holes:
o easting and northing of the
drill hole collar
o elevation or RL (Reduced
Level – elevation above sea
level in metres) of the drill
hole collar
o dip and azimuth of the hole
o down hole length and
interception depth
All information relating to the boreholes including the
easting, northing, elevation, along with the total depth
of the hole is contained within Table A2-1.
Table A2-1: Borehole Collars
HOLEID EASTING NORTHING RL TOTAL DEPTH
BH76-2 422,432.00 7,251,118.00 36.65 97.54
BOO1C 412,598.00 7,266,519.00 31.32 100.00
BR1 421,784.85 7,249,905.03 43.06 144.00
BUN001P 415,139.41 7,265,286.50 10.45 348.51
BUN002P 407,183.21 7,264,019.64 38.99 347.08
BUN003P 405,589.79 7,268,240.63 45.53 299.94
BUN004P 407,116.91 7,271,701.12 35.50 350.00

Criteria/JORC Code explanation Commentary
o hole length.
If the exclusion of this information is justified
on the basis that the information is not
Material and this exclusion does not detract
from the understanding of the report, the
Competent Person should clearly explain
why this is the case.
BUN005P 405,461.21 7,254,002.85 50.19 143.00
BUN006C 415,139.35 7,265,289.71 10.26 271.51
BUN007P 406,076.82 7,244,689.54 41.68 350.00
BUN008P 416,153.55 7,266,851.99 1.47 420.00
BUN009P 414,863.90 7,265,598.23 8.55 348.00
BUN010C 414,862.02 7,265,593.42 8.83 269.95
BUN011C 416,157.21 7,266,855.71 2.72 431.64
BUN012PR
417,651.90 7,268,589.00 6.80 800.00
BUN013P 417,206.00 7,264,553.00 10.42 375.00
CGA_3 412,806.03 7,266,561.92 30.78 67.06
CGA_5 412,914.84 7,266,751.55 30.18 85.34
FX1P 418,946.73 7,258,220.58 29.80 236.00
FX2P 418,354.73 7,262,525.90 11.54 349.18
FX3P 419,012.10 7,264,283.17 24.17 468.63
FXBU001R 416,587.00 7,262,798.00 27.00 251.00
FXBU003 416,431.00 7,261,651.00 29.60 298.73
FXBU004 416,760.84 7,261,386.65 29.80 134.00
FXBU005 415,984.85 7,261,467.65 31.50 304.00
FXBU006 419,002.22 7,260,282.56 28.80 406.00
FXBU006Q
418,886.00 7,260,091.00 28.90 292.21
FXBU010 415,644.85 7,262,373.65 32.40 232.00
FXBU011 417,246.88 7,260,834.56 10.74 156.33
FXBU012 420,764.25 7,255,072.82 47.34 203.00
FXBU013 414,939.35 7,263,844.74 51.25 121.25
FXBU014 417,336.87 7,263,592.71 10.30 342.31
FXBU015 418,695.44 7,260,348.79 51.96 306.40
FXBU016 418,430.83 7,259,335.51 32.77 192.19
FXBU016L 418,435.00 7,259,340.00 32.00 177.80
FXBU017 417,645.15 7,256,742.32 22.44 60.00
FXBU018 419,624.59 7,256,462.29 9.22 192.30
FXBU019 418,711.52 7,254,149.63 27.85 84.16
FXBU020 419,418.58 7,254,493.38 30.57 138.18
FXBU020G
419,408.00 7,254,485.00 30.00 114.13
FXBU021 417,930.90 7,253,746.24 13.04 50.00
FXBU022R 422,228.84 7,254,528.19 47.33 270.00

Criteria/JORC Code explanation Commentary
FXBU023 423,818.61 7,254,604.09 47.31 343.00
TM57K5 419,237.79 7,254,437.76 37.77 121.92
TM58K5 418,924.55 7,254,274.87 38.76 85.34
TM62K5 418,552.84 7,254,095.28 40.28 60.96
TM64K5 419,605.32 7,255,239.65 36.15 152.40
TM67K5 418,497.61 7,254,731.36 30.00 64.00
TM71K6 418,122.44 7,258,128.94 30.00 140.20
TM73K6 417,512.49 7,259,723.07 31.27 128.02
TM75K6 417,760.22 7,258,162.64 34.03 74.98
Data aggregation method
In reporting Exploration Results, weighting
averaging techniques, maximum and/or
minimum grade truncations (e.g. cutting of
high grades) and cut-off grades are usually
Material and should be stated.
Where aggregate intercepts incorporate
short lengths of high-grade results and
longer lengths of low-grade results, the
procedure used for such aggregation should
be stated and some typical examples of
such aggregations should be shown in
detail.
The assumptions used for any reporting of
metal equivalent values should be clearly
stated.
Geological logging of the core generally has confirmed
the thickness of the geophysically interpreted coal
seams.
There has been only a raw coal quality model
constructed previously. Data from EPC 2196
(BUN006C, BUN010C, BUN011C) has been combined
into the existing model, and a new clean coal
composite quality model was constructed using
historical and Fox Resources holes. Seam ply data
was composited using a set of rules but generally the
composites are based on mass x thickness.
Relationship between mineralisation widths
and intercept lengths
These relationships are particularly
important in the reporting of Exploration
Results. If the geometry of the
mineralisation with respect to the drill hole
angle is known, its nature should be
reported. If it is not known and only the
down hole lengths are reported, there
should be a clear statement to this effect
(e.g ‘down hole length, true width not
known’).
The boreholes in this program were planned to be
vertical holes and based on the interpreted strike and
dip of the geological units from the drilling in the
adjacent tenement and the stratigraphic correlation
diagram presented in the previous ASX release
suggests that the true width west-northwest is
interpreted as being >95% of the down hole
intersection width. Borehole deviation tools have been
run and shown that all boreholes deviate by amounts
varying between 1-7 degrees from vertical, with most
deviations having a dip direction of northwest.
Diagrams
Appropriate maps and sections (with scales)
and tabulations of intercepts should be
included for any significant discovery being
reported These should include, but not be
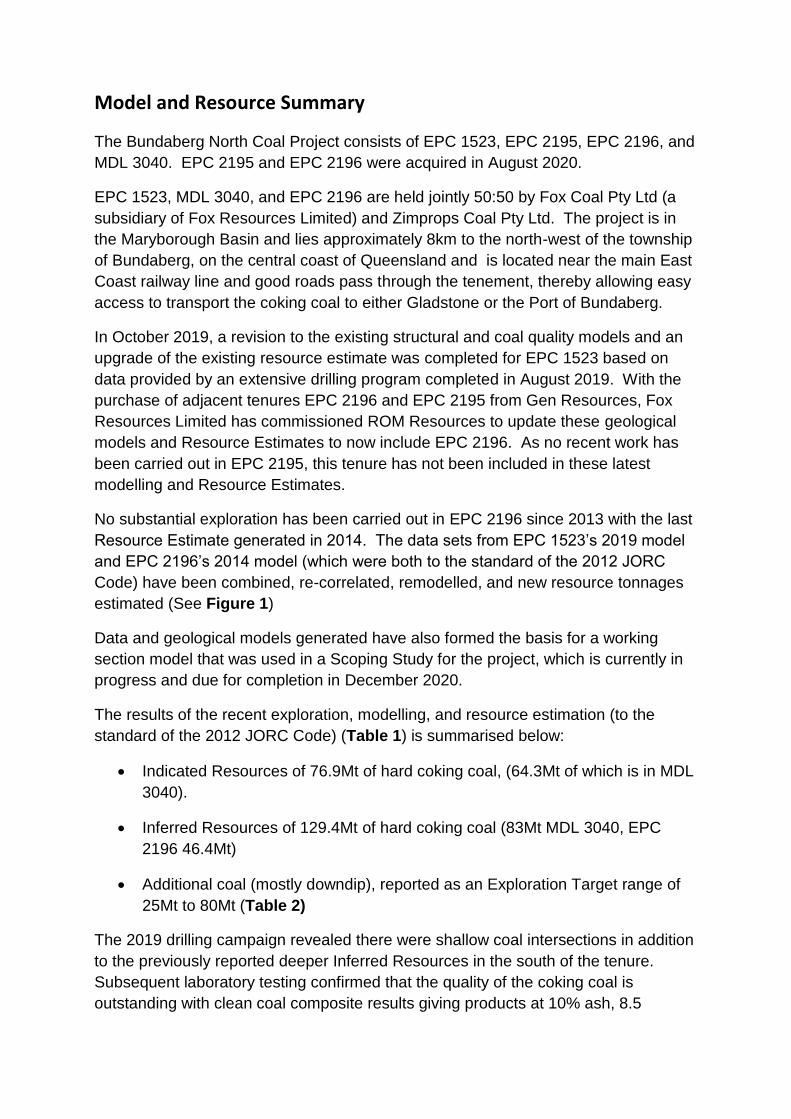
Please refer to Figure A3-1 in Section 3 for map of
Borehole Locations. Figure A2-4 shows a thickness
Plot for the GL1 seam. Figure A2-5 display contours
for the clean coal composite of Geisler fluidity for the
GL1 seam.
Criteria/JORC Code explanation Commentary
limited to a plan view of drill hole collar
locations and appropriate sectional views.
Figure A2-4 GL1 Seam – Thickness Isopach (m)
Figure A2-5 GL1 Seam – CCC Geisler Fluidity (ddm)
Criteria/JORC Code explanation Commentary
Balanced reporting
Where comprehensive reporting of all
Exploration Results is not practicable,
representative reporting of both low and
high grades and/or widths should be
practiced avoiding misleading reporting of
Exploration Results.
All exploration results within the Bundaberg area have
been reported. Most historical holes have been used in
the construction of the geological model however only
historical holes that contain coal quality analysis have
been used as Points of Observation in the resource
estimation.
Other substantive exploration data
Other exploration data, if meaningful and
material, should be reported including (but
not limited to): geological observations;
geophysical survey results; geochemical
survey results; bulk samples – size and
method of treatment; metallurgical test
results; bulk density, groundwater,
geotechnical and rock characteristics;
potential deleterious or contaminating
substances.
The modelling report (Biggs 2019) contains all the data
and assumptions used. A major dataset was provided
by the 2019 Exploration Program in EPC 1523 which
included:
1. Lithological Logging to CoalLog standards.
2. Downhole geophysics.
3. Coal quality – raw ply and clean coal
composite analyses.
4. Geotechnical analyses.
5. Desorbable gas content and composition.
6. Spontaneous combustion.
7. Water sampling (pH, EH and major cations).
Further work
The nature and scale of planned further
work (e.g. tests for lateral extensions or
depth extensions or large-scale step-out
drilling).
Diagrams clearly highlighting the areas of
possible extensions, including the main
geological interpretations and future drilling
areas, provided this information is not
commercially sensitive.
Further drilling and several 2D seismic survey lines are
required within the Bundaberg North Project to convert
the reported Inferred and Indicated resources to a
higher confidence class. Enough information existed to
create a working section model in April 2020 which has
input into mining design studies and a Scoping Study
which is inprogress.

Section 3: Estimation and Reporting of Mineral Resources
(Criteria listed in section 1, and where relevant in section 2, also apply to this
section.)
CRITERIA / JORC Code Explanation
COMMENTARY
Database integrity
Measures taken to ensure that data has not been corrupted by, for example, transcription or keying errors, between its initial collection and its use for Mineral Resource estimation purposes. Data validation procedures used.
The relevant borehole data has been loaded into a Datamine Minescape GDB database prior to modelling. Database inbuilt validation processes and pre-set parameters were applied to the dataset. All errors identified were corrected prior to loading or during the loading process to the software.
Site visits
Comment on any site visits undertaken by the Competent Person and the outcome of those visits.
Mark Biggs visited the site in 2013 for the purposes of drill planning reconnaissance. He has previously modelled coal seams in the Burrum Coal measures for other companies exploring in this area.
Geological interpretation
Confidence in (or conversely, the uncertainty of) the geological interpretation of the mineral deposit.
Nature of the data used and of any assumptions made.
The effect, if any, of alternative interpretations on Mineral Resource estimation.
The use of geology in guiding and controlling Mineral Resource estimation.
The factors affecting continuity both of grade and geology.
A methodology for modelling the deposit appropriately to meet the 2012 JORC Code was devised and involved identifying “coaly” piles out of the full geological sequence, based on the long and short–spaced down-hole geophysical density logs and assigning a composite relative density to each ply. Stringent cut-off parameters were applied to the coal plies thus:
<0.5m excluded (for reporting).
>1.75kg/m3 relative density (air dried basis) excluded.
>55% raw ash excluded.
Plies above the base of weathering excluded
>520m depth below the ground surface excluded.
From the cross correlations established (e.g. wet insitu relative density vs raw volatile matter) it is objectively possible to estimate a range of raw coal quality parameters, based on correlations of tenement laboratory data. This data was loaded into Minescape mine planning system software from which geological grid models were constructed. Validation of the compiled data, and models, was completed at the relevant stages. Initial coal quality modelling was on a raw ply basis. A full set of completed clean coal analysis were later loaded in November 2019. The geological model was progressively updated to match the existing borehole data. Modelling cut-offs applied were seam thickness greater than 0.05m and the maximum search distance was 5000m. Seam structure and thickness contours were generated using standard modelling algorithms and methodologies. Inferred masks were generated from base circles drawn 3,500m between Points of Observation, and for Indicated base circles of 1,300m diameter were used.
Dimensions
The extent and variability of the Mineral Resource expressed as length (along strike or otherwise), plan width, and depth below surface to the upper and lower limits of the Mineral Resource.
The coal extends along approximately 5,000m along strike and approximately 3,000 m perpendicular to strike with an approximate average cumulative thickness of 7m across three working sections. The depth of first coal ranges from 36 m in the west and 560 m in the east. Different levels of variability in seam thickness and raw coal quality are seen in the different seams estimated.
CRITERIA / JORC Code Explanation
COMMENTARY
Estimation and modelling techniques
The nature and appropriateness of the estimation technique(s) applied and key assumptions, including treatment of extreme grade values, domaining, interpolation parameters and maximum distance of extrapolation from data points. If a computer assisted estimation method was chosen include a description of computer software and parameters used.
The availability of check estimates, previous estimates and/or mine production records and whether the Mineral Resource estimate takes appropriate account of such data.
The assumptions made regarding recovery of by-products.
Estimation of deleterious elements or other non-grade variables of economic significance (e.g. sulphur for acid mine drainage characterisation).
In the case of block model interpolation, the block size in relation to the average sample spacing and the search employed.
Any assumptions behind modelling of selective mining units.
Any assumptions about correlation between variables.
Description of how the geological interpretation was used to control the resource estimates.
Discussion of basis for using or not using grade cutting or capping.
The process of validation, the checking process used, the comparison of model data to drill hole data, and use of reconciliation data if available.
Constraints on the Resource Estimates are as follows.
Coal seams not intruded or outside the tenement boundaries of EPC 1523 and EPC 2196.
Coal Thickness <0.5m excluded.
The Depth range of the estimation was from the base of weathering to 350m below surface.
Coal seams >55% adb from coal quality or estimated from downhole density logs (in g/cc) excluded from the calculations.
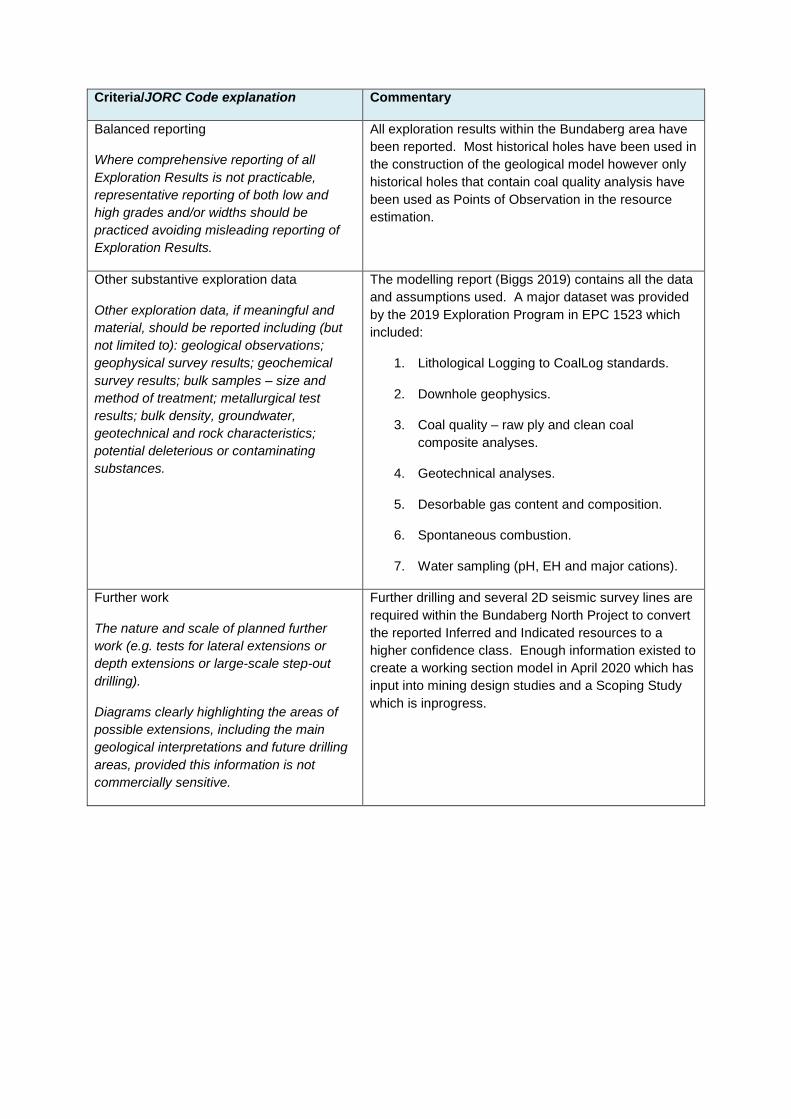
Points of Observation (Table A3-1 and Figure A3-1) were defined as those boreholes that had known surveyed positions, detailed lithological logs and coverage of the target coal seams with a suite of downhole geophysical logs that must include density in units of Kg/m
3.
Tonnages are calculated as seam area x thickness x density over the extent of the mask for the seam.
Table A3-1: Bundaberg North – Points of Observation
Borehole Easting Northing LAS CQ Lab Date
Reported
BOO1C 412598 7266519 N Y CCI 30/7/2007
BUN001P 415139.4 7265286.5 Y N - -
BUN006C 415139.4 7265289.7 Y Y BV 18/01/2013
BUN008P 416153.6 7266852 Y N - -
BUN009P 414863.9 7265598.2 Y N - -
BUN010C 414862 7265593.4 Y Y BV 22/02/2013
BUN011C 416157.2 7266855.7 Y Y BV 26/03/2013
BUN012PR 417651.9 7268589 Y N - -
BUN013P 417206 7264553 Y N - -
CGA_3 412806 7266561.9 N Y ACIRL 20/11/1970
CGA_5 412914.8 7266751.6 N Y ACIRL 20/11/1970
TM57K5 419237.8 7254437.8 N Y ACIRL 21/12/1970
TM58K5 418924.6 7254274.9 N Y ACIRL 21/12/1970
TM62K5 418552.8 7254095.3 N Y ACIRL 21/12/1970
TM64K5 419605.3 7255239.7 N Y ACIRL 21/12/1970
TM67K5 418497.6 7254731.4 N Y ACIRL 21/12/1970
TM71K6 418122.4 7258128.9 N Y ACIRL 21/12/1970
TM73K6 417512.5 7259723.1 N Y ACIRL 21/12/1970
TM75K6 417760.2 7258162.6 N Y ACIRL 21/12/1970
FXBU001 416589.23 7262799.66 Y N - -
FXBU003 417422.43 7261656.39 Y N - -
FXBU004 416651.78 7261202.53 Y N - -
FXBU005 415877.23 7261277.01 Y N - -
FXBU006Q 418886.36 7260089.65 Y Y BV 20/08/2018
FXBU010 415538.59 7262184.38 Y N - -
FXBU011 417246.88 7260834.56 Y Y Mitra PTS 20/08/2019
FXBU012 420764.25 7255072.82 Y N - -
FXBU013 414955.21 7263817.23 Y Y Mitra PTS 20/08/2019
FXBU014 417336.87 7263592.71 Y Y Mitra PTS 15/07/2019
FXBU015 418656.13 7260339.66 Y Y Mitra PTS 20/08/2019
FXBU016 418430.83 7259335.51 Y Y Mitra PTS 16/08/2019
FXBU017 417645.15 7256742.32 Y N - -
FXBU018 419665.6 7256497.1 Y Y Mitra PTS 16/08/2019
FXBU019 418711.52 7254149.63 Y Y Mitra PTS 16/08/2019
FXBU020 419432.8 7254478.75 Y Y Mitra PTS 16/08/2019
FXBU022 422228.84 7254528.19 Y Y Mitra PTS 01/08/2019
FXP1 418946.73 7258220.58 Y N - -
FXP2 418354.73 7262525.9 Y Y PREPLAB 30/10/2018
FXP3 419012.1 7264283.17 Y Y PREPLAB 31/10/2018

CRITERIA / JORC Code Explanation
COMMENTARY
Figure A3-1: Bundaberg North – New Resource Masks
Moisture
Whether the tonnages are estimated on a dry basis or with natural moisture, and the method of determination of the moisture content.
As no Moisture Holding Capacity (MHC) has yet been analysed, a derived moisture, based on coals from similar basins and rank in Australia was used.
Cut-off parameters
The basis of the adopted cut-off grade(s) or quality parameters applied.
Maximum Raw Ash Percentage - A maximum raw ash percentage of 55 %, air dried basis, has been applied to the Resource Estimate.
Mining factors or assumptions
Assumptions made regarding possible mining methods, minimum mining dimensions and internal (or, if applicable, external) mining dilution. It is always necessary as part of the process of determining reasonable
At this stage of project development there are no limiting environmental factors.
It is also too early in the evaluation process to discuss mining methods and mining dilution. However preliminary investigations suggest that a viable underground mining working section is possible from varying combinations of the GU, GL1 and GL2 seams, which infers that parting of 0.3-0.7m will be included in the working section.

CRITERIA / JORC Code Explanation
COMMENTARY
prospects for eventual economic extraction to consider potential mining methods, but the assumptions made regarding mining methods and parameters when estimating Mineral Resources may not always be rigorous. Where this is the case, this should be reported with an explanation of the basis of the mining assumptions made.
Mining by bord and pillar methods is possible; but at this early stage it is not possible to speculate on the economic, technical, or environmental aspects for potential longwall mining. A Scoping Study addressing those issues is in progress.
Metallurgical factors or assumptions
The basis for assumptions or predictions regarding metallurgical amenability. It is always necessary as part of the process of determining reasonable prospects for eventual economic extraction to consider potential metallurgical methods, but the assumptions regarding metallurgical treatment processes and parameters made when reporting Mineral Resources may not always be rigorous. Where this is the case, this should be reported with an explanation of the basis of the metallurgical assumptions made.
Washability testing suggests that for primary product yields for a 10% ash product vary between 50-65% depending upon the amount of non-coal parting material contained within the seam. A typical ash-yield curve is shown below, in Figure A3-2):
Figure: A3-2 Ash Yield Curves for FXBU011, seams GU, GL1, GL2

CRITERIA / JORC Code Explanation
COMMENTARY
Environmental factors or assumptions
Assumptions made regarding possible waste and process residue disposal options. It is always necessary as part of the process of determining reasonable prospects for eventual economic extraction to consider the potential environmental impacts of the mining and processing operation. While at this stage the determination of potential environmental impacts, particularly for a green fields project, may not always be well advanced, the status of early consideration of these potential environmental impacts should be reported. Where these aspects have not been considered this should be reported with an explanation of the environmental assumptions made.
Not applicable, too early in the project.
Bulk density
Whether assumed or determined. If assumed, the basis for the assumptions. If determined, the
Due to the lack of Total Moisture and Moisture Holding Capacity analysis for the project it was decided to use a standardised insitu (wet) relative density lookup table for each seam. These were based on averages of the air-dried laboratory analyses of relative density x 0.85 to approximate a

CRITERIA / JORC Code Explanation
COMMENTARY
method used, whether wet or dry, the frequency of the measurements, the nature, size and representativeness of the samples. The bulk density for bulk material must have been measured by methods that adequately account for void spaces (vugs, porosity, etc), moisture and differences between rock and alteration zones within the deposit.
Discuss assumptions for bulk density estimates used in the evaluation process of the different materials.
Preston and Sanders calculation of insitu relative density.
Classification
The basis for the classification of the Mineral Resources into varying confidence categories. Whether appropriate account has been taken of all relevant factors (i.e. relative confidence in tonnage/grade estimations, reliability of input data, confidence in continuity of geology and metal values, quality, quantity and distribution of the data).
Whether the result appropriately reflects the Competent Person’s view of the deposit.
Only two (2) Resource categories have been identified in the Bundaberg North deposit area due to the level of confidence in the seam structure and continuity plus the level of variability in the coal quality data.
The only seams in the tenure that exceed 1m thickness, in places are the Y2, B1, B2, B3, E3, F, GU, GL1, GL2 and H1 seams. The Y2 and B2 seams are excluded due to insufficient points and the remaining seams have less variability in their structure and continuity, and raw coal quality data, leading to a moderate to high confidence in the seam data. Notwithstanding this, distances between Points of Observations were set conservatively, especially for the Inferred Resource category, as follows:
Inferred – 3,500 m (distance between PoO's).
Indicated - 1,300m (distance between PoO's).
Audits or reviews
The results of any audits or reviews of Mineral Resource estimates.
An audit of this Resource Estimate was conducted as part of a 2015 Valmin Code Valuation carried out by Castle (2018).
Discussion of relative accuracy/ confidence
Where appropriate a statement of the relative accuracy and confidence level in the Mineral Resource estimate using an approach or procedure deemed appropriate by the Competent Person. For example, the application of statistical or geostatistical procedures to quantify the relative accuracy of the resource within stated confidence limits, or, if such an approach is not deemed appropriate, a qualitative discussion of the factors that could affect the relative accuracy and confidence of the estimate.
The statement should specify whether it relates to global or local estimates, and, if local, state the relevant tonnages, which should be
No detailed geostatistical studies have carried out yet on the Bundaberg North deposit, but nearest neighbour and other univariate statistical studies of the GL2 Floor data highlighted that the RMS nearest-neighbour spacing was 575m and that likely relative errors on the volumes calculated likely to be in the range of 30 -40%, which is consistent for Inferred Resources.
There has been no production to compare the estimate to.

CRITERIA / JORC Code Explanation
COMMENTARY
relevant to technical and economic evaluation. Documentation should include assumptions made and the procedures used.
These statements of relative accuracy and confidence of the estimate should be compared with production data, where available.