Embed Size (px)
Citation preview
FQHC Look-Alike Health Care Plan
April 28, 2010
Twyla Adams, MHS, Branch ChiefValerie Kolick, Public Health Analyst
Art Stickgold, ConsultantCharles Daly, Public Health Analyst
Department of Health and Human ServicesHealth Resources and Services
AdministrationBureau of Primary Health Care
Objectives
• To become familiar with the Clinical Measures, Quality of Care Indicators, and Outcome Measures of the Health Care Plan
• To understand how to collect and use an organization’s patient data to create a Health Care Plan
2

Reporting Reminders
• Organizations should only report on sites within their HRSA-approved FQHC Look-Alike scope of project
• The reporting year (or measurement year) is based on the prior Calendar Year, regardless of the organization’s current project period
3

4
Health Care Plan
Built around quality improvement measures which document applicants attention to clinical quality
Consists of: Three Quality of Care measures Three Outcome measures Two targeted applicant selected
measures

5
Clinical Measures
Six clinical measures form the core of the health care plan:• Early entry into prenatal care• Complete immunization of two year olds• Current Pap test for adult women• Birth weight for children of perinatal
patients• Controlled hypertension• Controlled diabetes
6
Clinical Measures
Two additional required measures are to be selected by the FQHC Look-Alike:• Behavioral health
• Includes Mental Health and Substance Abuse
• Required even for those which do not provide service
• Dental• Required even for those who do not have
dental services
Additional optional measures may be created by applicant
7
Clinical Measures
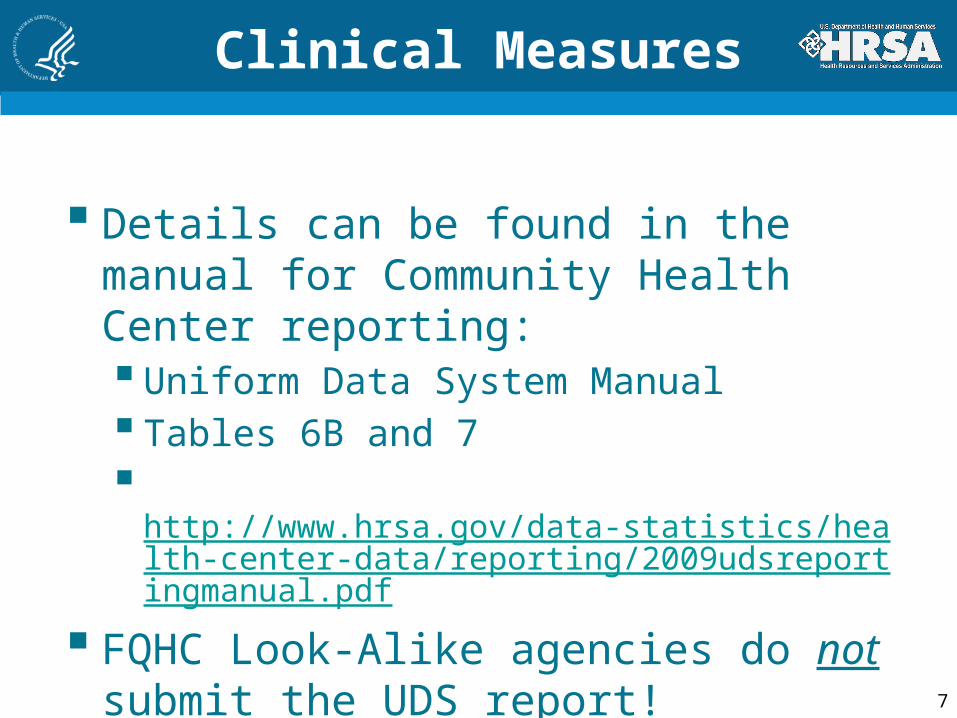
Details can be found in the manual for Community Health Center reporting: Uniform Data System Manual Tables 6B and 7
http://www.hrsa.gov/data-statistics/health-center-data/reporting/2009udsreportingmanual.pdf
FQHC Look-Alike agencies do not submit the UDS report!
8
Clinical Measures – Medical Home
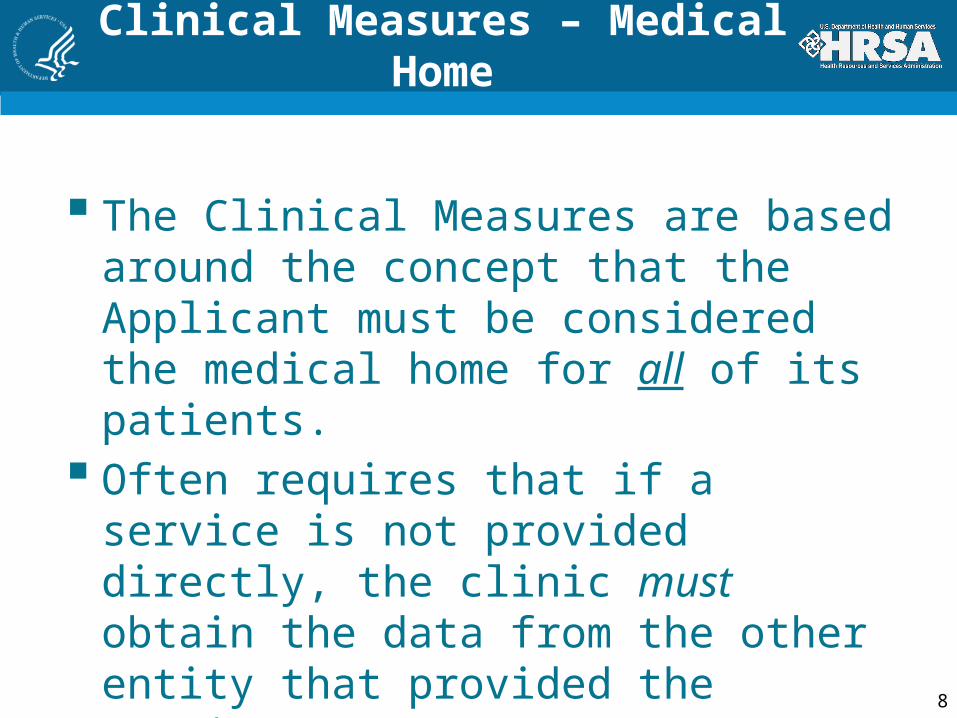
The Clinical Measures are based around the concept that the Applicant must be considered the medical home for all of its patients.
Often requires that if a service is not provided directly, the clinic must obtain the data from the other entity that provided the service.
9
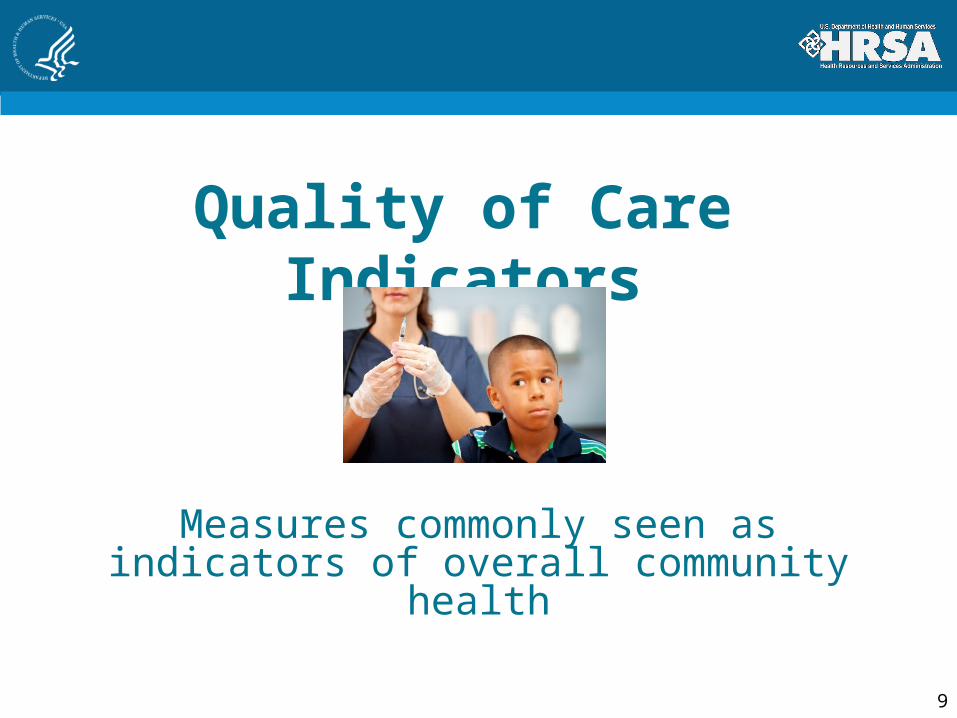
Quality of Care Indicators
Measures commonly seen as indicators of overall community health
10
Quality of Care Indicators
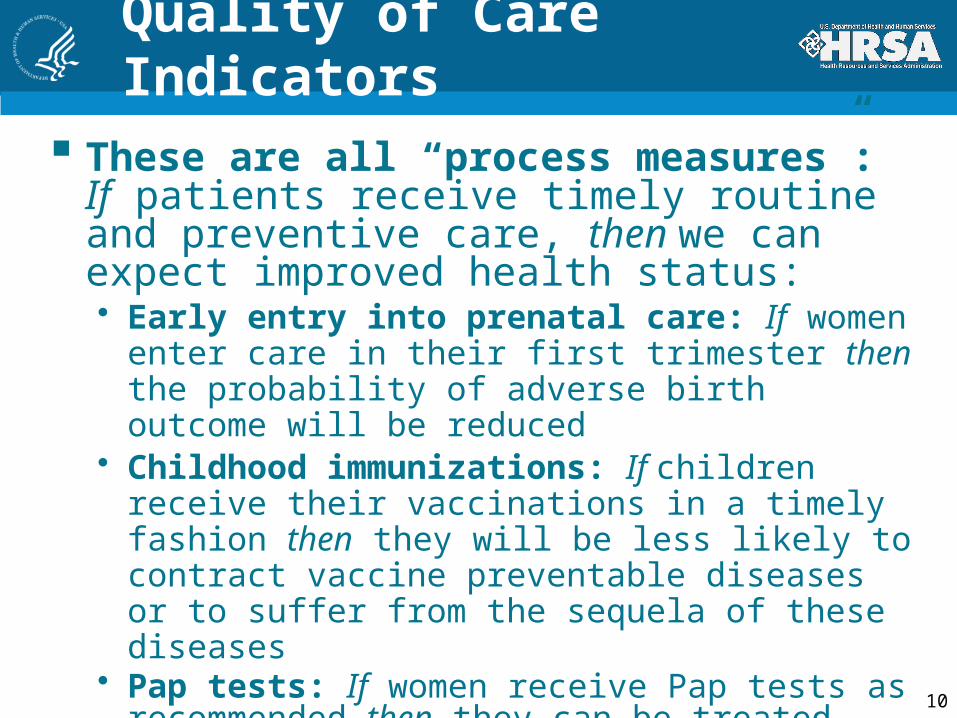
These are all “process measures”: If patients receive timely routine and preventive care, then we can expect improved health status:• Early entry into prenatal care: If women
enter care in their first trimester then the probability of adverse birth outcome will be reduced
• Childhood immunizations: If children receive their vaccinations in a timely fashion then they will be less likely to contract vaccine preventable diseases or to suffer from the sequela of these diseases
• Pap tests: If women receive Pap tests as recommended then they can be treated earlier and will be less likely to suffer adverse outcomes from HPV and cervical cancer

11
Clinical Measures –Trimester
Universe is all women who were provided perinatal services:• Measured from conception, not
LMP• “Entry” is at initial comprehensive
physical exam, not earlier points• All women with an initial visit are
included even if they drop or transfer
• Includes women who start in prior year or deliver in subsequent year as long as they were served in the reporting year.

12
Trimester of entry into care:• Compliance is considered to be
entry into care during the first trimester.
• First trimester is measured from date of conception and is DOC to DOC+13 weeks
Clinical Measures –Trimester

13
Clinical Measures – Immunization
Universe is two year olds who• Had a medical visit during 2009
•May have been before their last shots were due to be given
• Entered the practice prior to their second birthday•Even though may not have had
enough time to fully immunize
14
Compliance = Fully immunized on second birthday:• Standards are those of NQF and listed in
the UDS manual, not CDC or AAP• Shortage of any given vaccine (such as
the HIB shortage last year) may result in low numbers
• Non-compliance includes:• Lost to follow-up• Religious objections to vaccines• “Conscience” objections based on beliefs
• Immunization must be documented • Cannot accept statement from parents
Clinical Measures – Immunization

15
Required Vaccines
Fully complaint means compliant for each of 11 diseases normally vaccinated against with:• 4 DTP/DTaP, • 3 IPV, • 1 MMR, • 3 Hib, • 3 HepB, • 1VZV (Varicella) • 4 Pneumococcal conjugate
Or evidence of the disease Or allergic reaction to a vaccine or its
components ICD-9: 999.4
16
Clinical Measures – Pap Test
Universe includes:• All women who were 24 to 64 during
the measurement year• Who were seen at least once for
medical care in a clinical setting • Includes women who receive their
“women’s health services” elsewhere• Includes women who were current when
last seen, but failed to return for test.• Reported even by FQHC Look-Alikes
which refer out all or some of their Pap tests

17
Compliance: Tested in the reporting year or the prior two
years. Compliance is documented by:• A copy of a Pap test done by the FQHC Look-
Alike• Report of another provider’s findings• Not a self-report by patient
• Compliance does not include:• Lost to follow up• Documented referral without results• Statement from patient saying she is current• Patient refusal to be tested
Clinical Measures – Pap Test
18
Outcome Measures
Measures commonly seen as indicators of overall community health
19
Health Outcomes These are all “intermediate outcome
measures”: If this measurable intermediate outcome is improved, then later negative health outcomes will be less likely.• Normal Birthweight: If there are fewer low
birthweight children born, then there will be fewer children who suffer mental or physical delays or organ damage
• Controlled Hypertension: If there is less uncontrolled hypertension, then there will be less cardiovascular damage, fewer heart attacks, fewer strokes, less organ damage later in life
• Controlled Diabetes: If there is less uncontrolled diabetes then there will be fewer amputations, less blindness, less organ damage later in life

20
Outcome Measures – Birth Weight
Universe includes:• All children born to prenatal care
patients who delivered during the measurement year
• Includes women commonly lost who:•Were risked out after first visit•Were risked out during course of
treatment•Were routinely referred during 3rd
trimester•Were routinely referred for delivery

21
Outcome Measures – Birth Weight
Birth Weight:• Ideally obtained from hospital
discharge or birth certificate.•May accept mother’s report of weight
ComplianceThose children with a birth weight
equal to or greater than 2500 grams
22
Outcome Measures – Hypertension
Universe includes:• Patients 18 – 85 • Diagnosed as hypertensive
•ever – ideally look at three years of data
•but prior to June 30 in measurement year
• Seen twice in medical clinic• Includes patients who may not
have ever had a primary diagnosis of hypertension
• Includes hypertensive patients who may never have been seen for hypertension during the reporting year
23
Outcome Measures – Hypertension
Compliance:• Is based on the last recorded blood
pressure for measurement year• Patients are considered in compliance
if their BP is under 140/90 –(i.e., systolic is under 140 and diastolic is
under 90.)

24
Outcome Measures – Diabetes
Universe includes:• Patients 18 – 75 • Diagnosed as diabetic
• ever – ideally look at three years of data
• Seen twice in medical clinic• Includes patients who were not seen
with a primary diagnosis of diabetes• Includes diabetic patients who may
never have been seen for diabetic during the reporting year

25
Outcome Measures – Diabetes
Compliance is based on hemoglobin A1c (HbA1c) reading:
• Last recorded for measurement year• No measurement is coded as out of compliance –
should not be replaced• Must have test results or copy – may not accept
Patient’s understanding of their results from another provider
• Based on lab test in chart or reported to FQHC Look-Alike by another provider
• Compliant = those less than or equal to 9%• May have been done elsewhere as long as
report is recorded in chart when review is done

26
Reporting on patients:Sample or “Universe”
Sampling for the FQHC Look-Alike Clinical Measures

27
Clinical Measures Data
Data may be reported in two ways:• Report on the universe (total population
meeting criteria)• Required for both perinatal care measures• Either universe or sample is OK for other four + 2
measures• Report on a random sample of 70 patients
Neither method is considered to be preferable or superior when it comes to immunizations, Pap tests, hypertension, diabetes or the other 2
Universal reports may be based on:• A chart review of all patients meeting criteria• Automated reports from an EHR which
includes data on 100% of the center’s patients

28
Common EHR misconceptions:• Disease registries from collaboratives
(PC-DEMS, PECS) may be used as the universe• Usually excludes the very people being
looked for• EHRs may be used as soon as they are
installed.• for reporting purposes, EHR data may be
used only after the EHR has been installed for an entire calendar year – preferably for three years
• EHRs are necessary • Many if not most CHCs found using a
sample to be as easy and more accurate
Clinical Measures Data

29
Common sampling misconceptions:• Data may be sampled from just one site
• You must include data from all in-scope sites
• An equal number of charts may be pulled from each FQHC Look-Alike site or for each provider• Will bias the sample
• FQHC Look-Alikes may decide to use a sample size greater than or less than 70• For consistency we have standardized at 70
or at 100% if you have fewer than 70 in the universe
Clinical Measures Data

30
Reporting on a Sample
Unless a center is quite small it will generally report on a random sample of 70 charts:• …a part of the universe where each member
of the universe has the exact same chance of being selected as every other member of the universe.
• Reporting is simple, requiring • A numbered list of all patients in universe • Use of a web site to generate random numbers
http://www.randomizer.org/form.htm• Identification of the charts in the numbered list of
patients• Review of the identified patients

31
Getting 70 Random Numbers
Sets of numbers = 1
Numbers per set = 70
Number range = 1- “n” (enter last sequence number in your numbered list)
Unique numbers – YesSort numbers – Yes: Least to Greatest

32
Data From Other Sources
Before charts are actually pulled and reviewed, other sources may be queried for the “answer” on compliance:• EHRs, PMSs (Practice Management Systems)
• May not cover all patients or be in place for a long enough time, but may still be used to review patients and periods which are recorded
• Immunization registries maintained by the state.
• Collaborative registries which include some, but not all of the patients who meet the criteria (or which include patients who do not meet the criteria)
• Logs or other “off line” lists
33
Reviewing the Charts
Eventually, some or all charts in the sample for one or more of the measures will need to be reviewed.
With multiple locations:• All charts may be brought to a central
point• Single reviewer may travel to each site• Multiple reviewers may review at each
site
Tools are available from BPHC
Creating the FQHC Look-Alike
Health Care PlanCharles Daly, Public Health Analyst
Office of Quality and DataDepartment of Health and Human Services
Health Resources and Services Administration
Bureau of Primary Health Care
34
35
The health care plan is not a stand-alone part of the proposal or CQI plan.
It needs to be integrated into all aspects of the organization’s evaluation processes.
When designated, it is the clinical quality roadmap.
The Health Care Plan
36
Clinical Measures Reporting
There are six UDS Clinical Measures included in those to be reported by FQHC Look Alikes: Prenatal access to care Low birth weight babies Children age 2 immunizations Pap tests for adult women Diabetes HbA1c tests Hypertension blood pressure under control
Specifics of current UDS measures are at http://bphc.hrsa.gov/about/performance measures.htm

37
Health Care Plans
BPHC is now requiring these clinical measures to be included in the health care plan for FQHC Look-Alike Designation (Initial/Renewal) and Annual Recertification applications
FQHC Look-Alikes are establishing baselines and setting goals for improvement in their initial and renewal applications (5 year horizon)
FQHC Look-Alike annual recertification reports based on data, where available
BPHC staff will review submissions and progress reports
38
Setting Goals for Improvement
Demonstrate improvement over time or maintain high rate Ideally 100% of patients in compliance
with measure–NOT realistic! FQHC Look-Alike trends 330 Program grantee performance
rates (national, state) available on HRSA UDS Web site at
http://www.hrsa.gov/data-statistics/health-center-data/index.html
Initial and Renewal of Designation Applications
Baseline: Baselines are set using data from the calendar year prior to the application submission.
Goal: Goals are set to be accomplished by the end of the project period (5 Years).
Baseline and Goal Year
39
Baseline and Goal Year
Recertification Applications Baseline: Carried over from most
recent initial or renewal of designation application. If the organization has never submitted a Business Plan, the organization will create a new baseline from the prior calendar year.
Goal: Goals are set to be accomplished by the FQHC Look-Alike’s renewal of designation application due date.
40
A Word About Benchmarks…
The most important comparisons are internal
Most relevant when patient populations are similar
Benchmarks useful in setting feasible and challenging goals
Data will reveal state and national trends over time
41
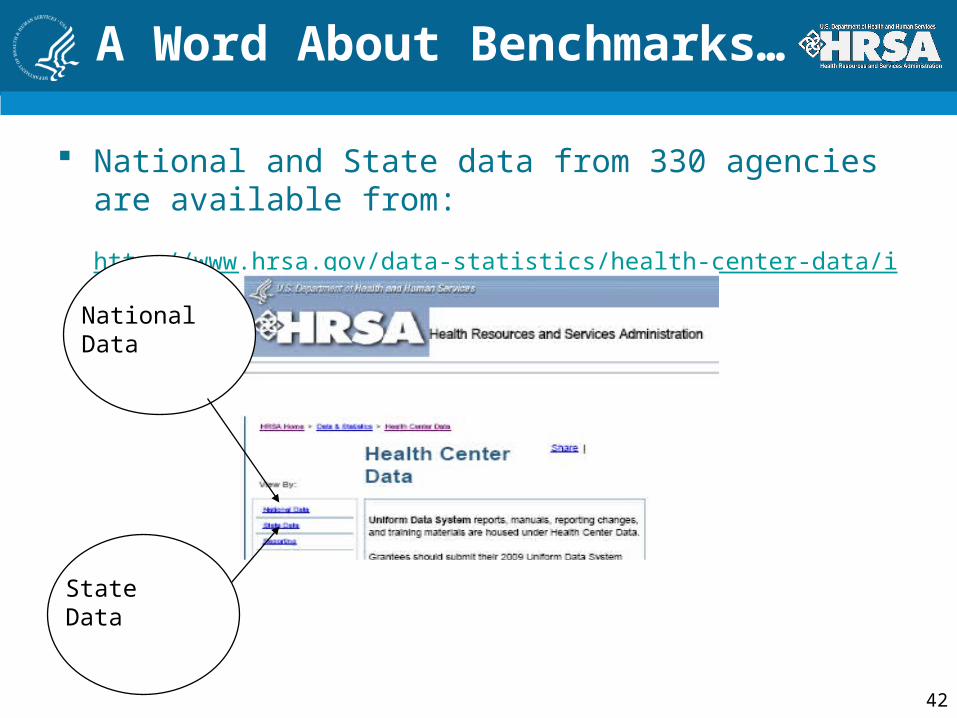
A Word About Benchmarks…
National and State data from 330 agencies are available from:
http://www.hrsa.gov/data-statistics/health-center-data/index.html
42
NationalData
StateData

43
Designation Health Care Plan Format
Performance Measure Description: Percentage of diabetic patients age 18 to 75 whose HbAlc levels are less than or equal to 9 percent Is this Performance Measure Applicable to your Organization?
Target Goal Description By End of Project Period, increase the % of adult patients age 18 to 75 years with type 1 or 2 diabetes whose most recent hemoglobin A1c (HbA1c) is ≤ 9% (under control).
Numerator Description Number of adult patients age 18 to 75 years with a diagnosis of Type 1 or Type 2 diabetes whose most recent hemoglobin A1c level during the measurement year is ≤ 9%, among those patients included in the denominator.
Denominator Description Number of adult patients age 18 to 75 years as of December 31 of the measurement year (for measurement year 2009, date of birth on or after January 1, 1934 and on or before December 31, 1991) with a diagnosis of Type 1 or Type 2 diabetes, who have been seen in the clinic at least twice during the reporting year and do not meet any of the exclusion criteria
Baseline Data Baseline Year: Measure Type: Numerator: Denominator:
Projected Data (by End of Project Period)
Data Source & Methodology Key Factor and Major Planned Action #1 Key Factor Type: [_] Contributing [_] Restricting [_] Not Applicable
Key Factor Description: Major Planned Action Description:
Key Factor and Major Planned Action #2 Key Factor Type: [_] Contributing [_] Restricting [_] Not Applicable Key Factor Description: Major Planned Action Description:
Key Factor and Major Planned Action #3 Key Factor Type: [_] Contributing [_] Restricting [_] Not Applicable Key Factor Description: Major Planned Action Description:
Comments

44
Focus Area: Name and Description
States the focus area Six pre-selected topics and two
selected by the FQHC-LA States the specific measure that will be
used
States the targeted multi-year goal A numeric target for the performance
measure Five years out or until end of project
period

45
Focus Area: Calculation
Describes the numbers that will be used to calculate the measure Numerator:
Portion of target population that is in compliance
Denominator: Description of all persons in the “universe” Criteria for the six required measures are set by BPHC and
must be used
46
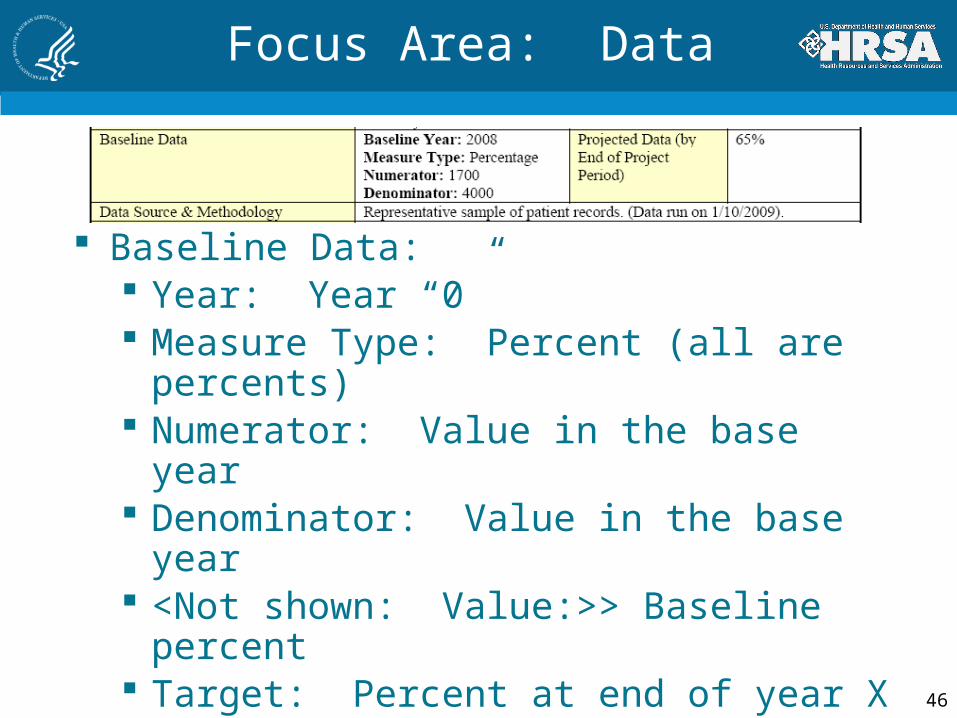
Focus Area: Data
Baseline Data: Year: Year “0” Measure Type: Percent (all are
percents) Numerator: Value in the base year Denominator: Value in the base year <Not shown: Value:>> Baseline
percent Target: Percent at end of year X (5)
Data source & Methodology Where the baseline data come from
47
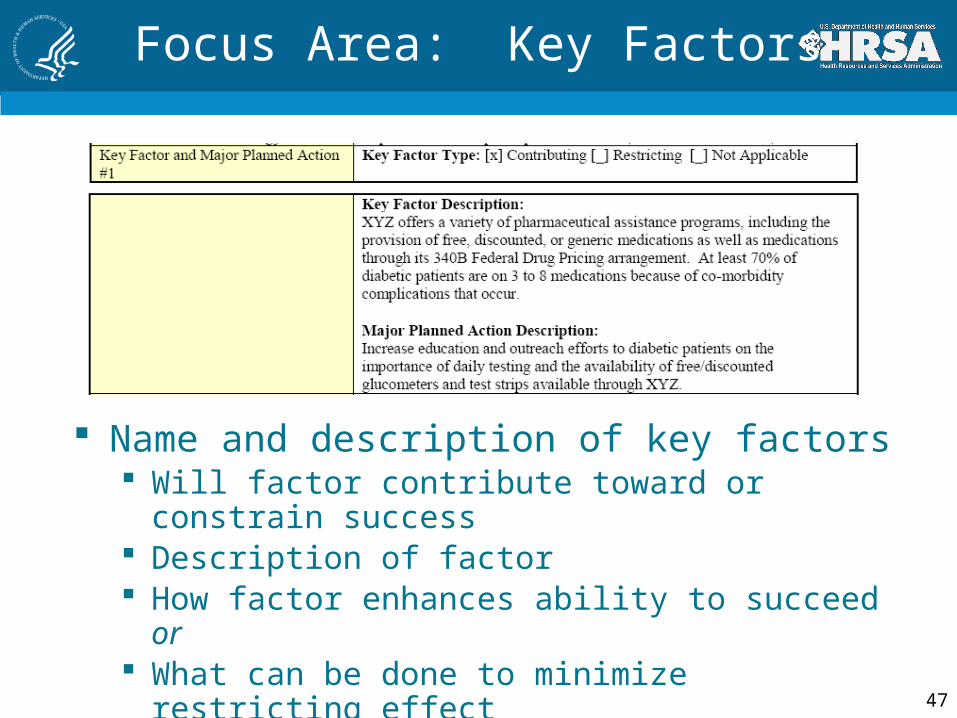
Focus Area: Key Factors
Name and description of key factors Will factor contribute toward or constrain
success Description of factor How factor enhances ability to succeed or What can be done to minimize restricting
effect
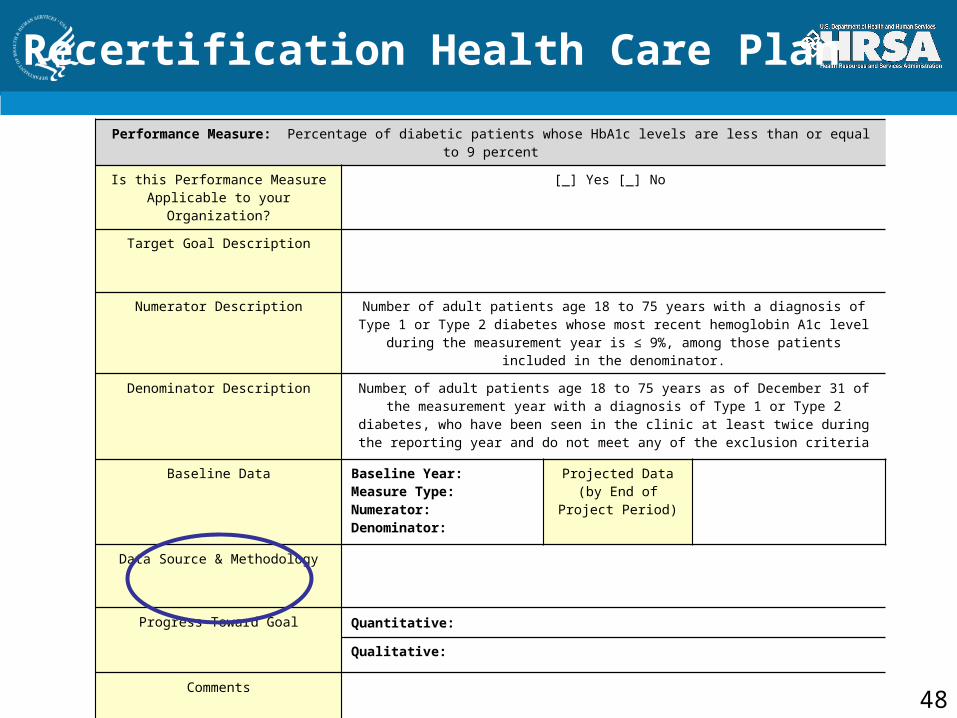
Recertification Health Care Plan
Performance Measure: Percentage of diabetic patients whose HbA1c levels are less than or equal to 9 percent
Is this Performance Measure Applicable to your Organization?
[_] Yes [_] No
Target Goal Description
Numerator Description Number of adult patients age 18 to 75 years with a diagnosis of Type 1 or Type 2 diabetes whose most recent hemoglobin A1c level during the measurement year is ≤ 9%,
among those patients included in the denominator.
Denominator Description Number of adult patients age 18 to 75 years as of December 31 of the measurement year with a diagnosis of Type 1 or Type 2 diabetes, who have been seen in the clinic at least
twice during the reporting year and do not meet any of the exclusion criteria
Baseline Data Baseline Year:Measure Type:Numerator:Denominator:
Projected Data (by End of Project Period)
Data Source & Methodology
Progress Toward Goal Quantitative:
Qualitative:
Comments
48
49
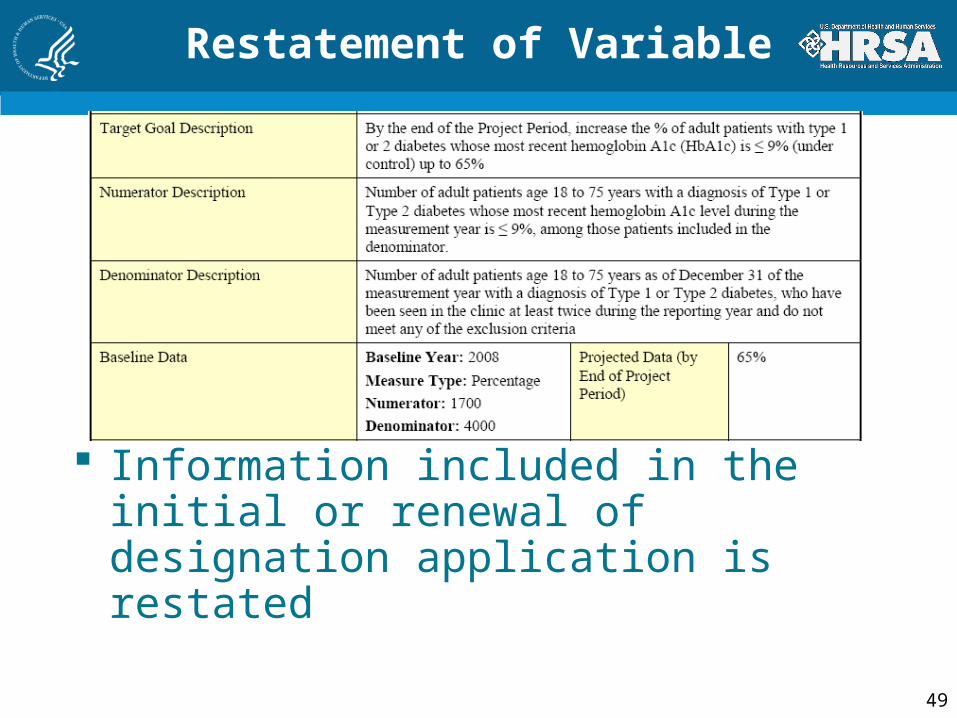
Restatement of Variable
Information included in the initial or renewal of designation application is restated
50
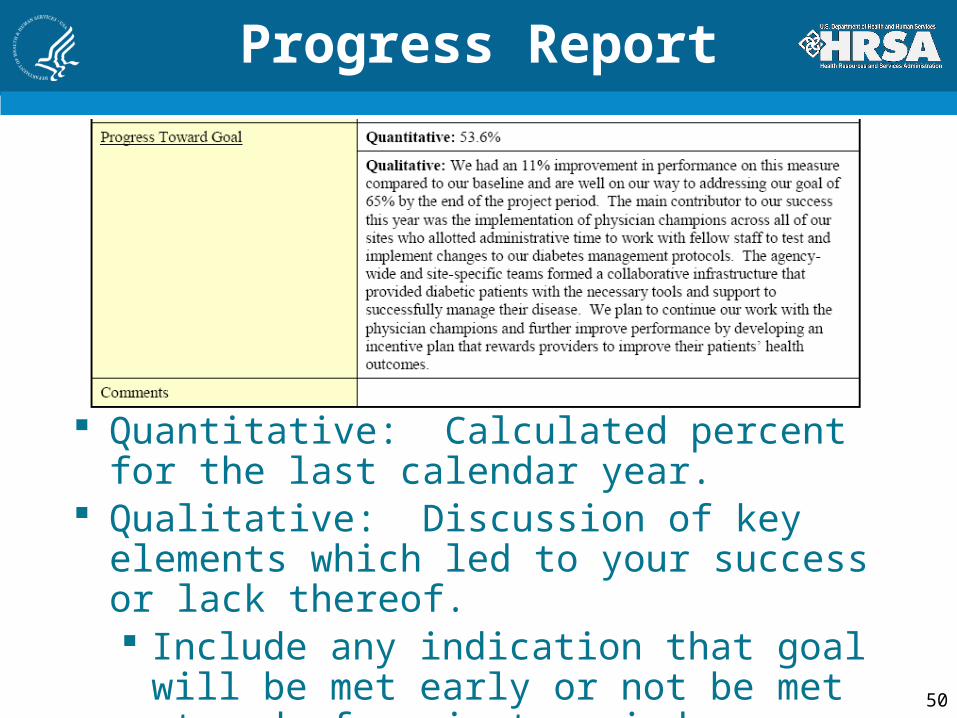
Progress Report
Quantitative: Calculated percent for the last calendar year.
Qualitative: Discussion of key elements which led to your success or lack thereof. Include any indication that goal will be
met early or not be met at end of project period
51
Recertification HCP Clinical Measures
Plans built around a QI model FQHC Look-Alikes asked to comment
on their progress toward their goals —quantitative and qualitative
Quantitative progress Report a single percent based on one
year up to 3 year trended data, if available
Qualitative progress statements recommended
52
Summary
Purpose of performance measurement is to assure and IMPROVE Quality of Care: Appropriateness of care for the
population Effectiveness of care for the
population Include health care plan goals in QI
program

Resources
• PIN 2009-06, “FQHC Look-Alike Guidance and Application”:http://bphc.hrsa.gov/policy/pin0906/
• Specifics of current UDS measures: http://bphc.hrsa.gov/about/performance measures.htm
• Web site to generate random numbers: http://www.randomizer.org/form.htm
• 330 Program grantee performance rates (national, state) :
http://www.hrsa.gov/data-statistics/health-center-data/index.html
• Uniform Data System Reporting Manual: http://www.hrsa.gov/data-statistics/health-center-data/reporting/2009udsreportingmanual.pdf
53

Contact Information
Twyla AdamsBranch Chief
Health Center Systems BranchOffice of Policy and Program
Development301.594.4300
54
Contact Information
Valerie KolickPublic Health Analyst
Health Center Systems BranchOffice of Policy and Program
Development301.594.4300
55
Questions?