Embed Size (px)
Citation preview

Mon. Not. R. Astron. Soc. 421, 132–148 (2012) doi:10.1111/j.1365-2966.2011.20262.x
FR Cnc revisited: photometry, polarimetry and spectroscopy�
A. Golovin,1† M. C. Galvez-Ortiz,2,3 M. Hernan-Obispo,4 M. Andreev,1,5,6
J. R. Barnes,3 D. Montes,4 E. Pavlenko,7 J. C. Pandey,8 R. Martınez-Arnaiz,4
B. J. Medhi,8 P. S. Parihar,9 A. Henden,10 A. Sergeev,5,6 S. V. Zaitsev1
and N. Karpov5,6
1Main Astronomical Observatory of National Academy of Sciences of Ukraine, Zabolotnogo str., 27, Kiev 03680, Ukraine2Centro de Astrobiologıa (CSIC-INTA), Ctra de Ajalvir, km 4, E-28850 Torrejon de Ardoz, Madrid, Spain3Centre for Astrophysics Research, University of Hertfordshire, College Lane, Hatfield, Hertfordshire AL10 9AB4Astrophysics Department, Physic Faculty, Universidad Complutense de Madrid, E-28040 Madrid, Spain5Terskol Branch of the Astronomy Institute of RAS, Kabardino-Balkaria Republic, 361605 Terskol, Russia6International Center for Astronomical, Medical and Ecological Research of National Academy of Sciences of Ukraine (ICAMER of NASU),Zabolotnogo str., 27, Kiev 03680, Ukraine7Crimean Astrophysical Observatory (CrAO), Nauchny, 98409 Crimea, Ukraine8Aryabhatta Research Institute of Observational Sciences (ARIES), Manora Peak, Nainital 263129, India9Indian Institute of Astrophysics, Block II, Koramangala, Bangalore 560 034, India10AAVSO, Clinton B. Ford Astronomical Data and Research Center, 49 Bay State Road, Cambridge, MA 02138, USA
Accepted 2011 November 24. Received 2011 November 24; in original form 2011 January 24
ABSTRACTThis paper is part of a multiwavelength study aimed at using complementary photometric,polarimetric and spectroscopic data to achieve an understanding of the activity process inlate-type stars. Here, we present the study of FR Cnc, a young, active and spotted star.
We performed analysis of All Sky Automated Survey 3 (ASAS-3) data for the years 2002–08and amended the value of the rotational period to be 0.826518 d. The amplitude of photometricvariations decreased abruptly in the year 2005, while the mean brightness remained the same,which was interpreted as a quick redistribution of spots. BV RC and IC broad-band photometriccalibration was performed for 166 stars in FR Cnc vicinity.
The photometry at Terskol Observatory shows two brightening episodes, one of whichoccurred at the same phase as the flare of 2006 November 23. Polarimetric BV R observationsindicate the probable presence of a supplementary source of polarization. We monitored FRCnc spectroscopically during the years 2004–08. We concluded that the radial velocity changescannot be explained by the binary nature of FR Cnc. We determined the spectral type of FRCnc as K7V. Calculated galactic space-velocity components (U,V ,W ) indicate that FR Cncbelongs to the young disc population and might also belong to the IC 2391 moving group.Based on Li I λ6707.8 measurement, we estimated the age of FR Cnc to be between 10 and120 Myr. Doppler tomography was applied to create a starspot image of FR Cnc. We optimizedthe goodness of fit to the deconvolved profiles for axial inclination, equivalent width and v sin i,finding v sin i = 46.2 km s−1 and i = 55◦. We also generated a synthetic V -band light curvebased on Doppler imaging that makes simultaneous use of spectroscopic and photometric data.This synthetic light curve displays the same morphology and amplitude as the observed one.
The starspot distribution of FR Cnc is also of interest since it is one of the latest spectraltypes to have been imaged. No polar spot was detected on FR Cnc.
Key words: stars: activity – stars: flare – stars: individual: FR Cnc – stars: rotation.
�Based on the observations made: with the 2.2-m telescope of the German–Spanish Astronomical Centre, Calar Alto (Almerıa, Spain), operated by Max-Planck-Institute for Astronomy, Heidelberg, in cooperation with the Spanish National Commission for Astronomy; with the Nordic Optical Telescope (NOT),operated on the island of La Palma jointly by Denmark, Finland, Iceland, Norway and Sweden, in the Spanish Observatorio del Roque de Los Muchachos ofthe Instituto de Astrofısica de Canarias; with the Isaac Newton Telescope (INT) operated on the island of La Palma by the Isaac Newton Group in the SpanishObservatorio del Roque de Los Muchachos of the Instituto de Astrofısica de Canarias; with the Italian Telescopio Nazionale Galileo (TNG) operated on theisland of La Palma by the Centro Galileo Galilei of the Istituto Nazionale di Astrofisica (INAF) at the Spanish Observatorio del Roque de Los Muchachosof the Instituto de Astrofısica de Canarias; with ASAS-3 survey; with robotic 0.35-m telescope at the Sonoita Research Observatory (Arizona, USA); with29-cm telescope, operated by Terskol Branch of the Astronomy Institute, Russia; with 104-cm Sampurnanand Telescope of ARIES, Nainital, India; with 2.0-mHimalayan Chandra Telescope, operated at the Indian Astronomical Observatory (Mt Saraswati, Hanle, India).†E-mail: [email protected]
C© 2012 The AuthorsMonthly Notices of the Royal Astronomical Society C© 2012 RAS
at Universidad C
omplutense de M
adrid on February 9, 2016http://m
nras.oxfordjournals.org/D
ownloaded from

FR Cnc: photometry, polarimetry and spectroscopy 133
1 IN T RO D U C T I O N
It is well known that late-type stars show magnetic activity similarto the activity of our Sun, but the physics of ‘stellar’ activity is notyet well understood. In addition, the activity level manifested bylate-type stars is much higher than that observed for the Sun.
FR Cnc (= BD+16 1753 = MCC 527 = 1ES 0829+15.9 =1RXS J083230.9+154940 = HIP 41889) was first mentioned as aprobable active star when it was identified as the optical counter-part of a soft X-ray source 1ES 0829+15.9 in the Einstein SlewSurvey. It has V = 10.43 mag, spectral type K8V, the X-ray fluxof ≈10−11 erg s−1 cm−2 (Elvis et al. 1992; Schachter et al. 1996).Lately, this object was rediscovered as an X-ray source 1RXSJ083230.9+154940 in the ROSAT All-Sky Survey with lower X-rayflux at the level of 2 × 10⁻¹² erg s−1 cm−2 (Voges et al. 1999). TheX-ray luminosity of (2–12) × 1029 erg s−1 and the ratio of X-rayto bolometric luminosity Fx/Fbol of ≥10−3.3 (Pandey et al. 2005)indicate that this object has an active corona (Schachter et al. 1996).
In the Hipparcos catalogue, this star was mentioned as an un-solved variable star with the identifier HIP 41889 and 0.17 magamplitude of variability (Perryman et al. 1997). It was classi-fied as BY Dra type star (i.e. its variability is caused by rota-tional modulation of starspots) and given the name FR Cnc byKazarovets et al. (1999). For analysis of Hipparcos observations,see Pandey et al. (2005). FR Cnc [RA(2000) = 08h32m30.s5287and Dec.(2000) = +15◦49′26.′′193] has 30.24 ± 2.03 mas parallax(Perryman et al. 1997) that implies a distance of 33 ± 2 pc and anabsolute magnitude of 7.8. The kinematics of FR Cnc suggests thatit is a very young (35–55 Myr) main-sequence star and a possiblemember of the IC 2391 supercluster, as it was shown by Pandeyet al. (2005). Upgren, Sperauskas & Boyle (2002) concluded thatFR Cnc is not a binary system, based on two measurements of theradial velocity (RV).
The presence of Ca II H&K and Hα emission lines in the spec-tra indicates high chromospheric activity in FR Cnc (Pandey et al.2002; Pandey 2003). In ‘quiescent’ state, this object manifests opti-cal variability with the dominant period 0.8267±0.0004 d due to thepresence of starspots and axial rotation (Pandey et al. 2005). In ad-dition, photometry obtained between 2005 February and April withKilodegree Extremely Little Telescope indicates FR Cnc opticalvariability with 0.827 d period (Pepper et al. 2008) when monitor-ing the Praesepe open cluster for transiting exoplanets.
The first ever detected optical flare of this object was ob-served during CCD photometry of FR Cnc on 2006 November23 at Crimean Astrophysical Observatory (Ukraine) with 38-cmCassegrain telescope and described by Golovin et al. (2007). Theflare was observed in BV RI bands (see Fig. 1). The ampli-tude reached even 1 mag in the B band and was decreasing to-wards the I band. The flare energy output in the B band was
about 1.73 × 1031 erg Å−1
and flare to quiescent flux ratio was38.63 per cent.
2 PH OTO M E T R I C O B S E RVAT I O N S
Most of the information on the photospheric activity (e.g. starspots)of BY Dra type stars comes from photometric observations. Themean brightness level is strongly dependent on the percentage ofspotted area of the surface, while changes in spot distribution overthe surface could result in changes of the amplitude of variability.FR Cnc has a short (for such class of objects) rotational period of0.8267 d. As was shown in Dorren, Guinan & Dewarf (1994), this
Figure 1. Light curve of FR Cnc on 2006 November 23 from Golovin et al.(2007): ‘the flare of FR Cnc: shifted differential light curves in B, V ,R andI bands as well as the difference check star-comparison star (“Ch” on theplot)’.
short rotational period leads us to expect large flare activity of thestar.
The detection of a flare on FR Cnc on 2006 November 23 moti-vated us to continue photometric monitoring of this object as wellas to study its archival All Sky Automated Survey 3 (ASAS-3) ob-servations [see Pojmanski (2002) for description of equipment anddata pipeline].
2.1 ASAS photometrical observations
FR Cnc was observed in V band with ASAS-3 survey during 2002December–2008 May (six observational seasons; see Fig. 2). Allthe data were split into separate data sets according to the ‘seasonalgaps’ in observations and folded with the 0.8267 d period (fromPandey et al. 2005) and represented in Fig. 3 (plotted twice forclarity). Table 1 presents the log of observations.
The initial epoch was common to calculate phases for allsix phase diagrams and was chosen arbitrary as HJD (UTC) =245 2635.726 69 (first point in data set). No evidence of flares in the
Figure 2. ASAS long-term light curve.
C© 2012 The Authors, MNRAS 421, 132–148Monthly Notices of the Royal Astronomical Society C© 2012 RAS
at Universidad C
omplutense de M
adrid on February 9, 2016http://m
nras.oxfordjournals.org/D
ownloaded from

134 A. Golovin et al.
Figure 3. ASAS-3 phase diagrams for six observing seasons. Please note that scales are the same for all plots. Vertical dashed line indicates the phase wherethe flare on 2006 November 23 was detected (see text for the explanation).
Table 1. Log of ASAS-3-observations of FR Cnc.
Year Tstart Tend Npoints
245 0000+ 245 0000+
2002–03 2635 2791 592003–04 2924 3146 622004–05 3357 3512 632005–06 3674 3881 612006–07 4091 4247 342007–08 4409 4611 56
ASAS-3 data was found. The vertical dashed line in Fig. 3 indicatesthe phase when the flare on 2006 November 23 occurred.
ASAS-3 data are not covering flare on 2006 November 23.Nearest ASAS-3 observations were done on JD 245 3881 and JD2454 4091, i.e. 181 d before and 29 d after the flare. ASAS-3 ob-
servations in 2006–07 at a phase ∼0.88 (143 d after the flare)show that FR Cnc was brighter than during the rest of the time.This probably could be related to brightening episode, whichwas detected at the same phase during Terskol observations (seeSection 2.3).
Profiles of variability as well as the amplitude of variability aredifferent from season to season, while the mean brightness re-mains constant (Vmean = 10.439 mag within the error limits ofσ = 0.017 mag). To illustrate this, we plotted the amplitude andthe mean brightness as a function of mean epoch of observa-tions (Fig. 4). An abrupt decrease of amplitude in the year 2005is clearly seen. One of the possible interpretations is the continu-ous spottedness of the star and redistribution of spots/spot groupsfrom season to season, i.e. spots did not disappear, but distributedmore uniformly over FR Cnc surface. To support this idea, notethe constancy of the mean brightness level. If spots disappear,then increase of brightness and decrease of amplitude could beexpected.
C© 2012 The Authors, MNRAS 421, 132–148Monthly Notices of the Royal Astronomical Society C© 2012 RAS
at Universidad C
omplutense de M
adrid on February 9, 2016http://m
nras.oxfordjournals.org/D
ownloaded from

FR Cnc: photometry, polarimetry and spectroscopy 135
Figure 4. Mean amplitude of variability, EW of Hα and mean brightnessof FR Cnc during the years 2002–08 (see Section 6.1 regarding Hα).
2.1.1 Periodogram analysis
The data set was searched for periodic variation of brightness (inorder to estimate with better accuracy the known rotational period)using the PERIOD04 package, developed by Patrick Lenz (Instituteof Astronomy, University of Vienna, Austria; see Lenz & Breger2005). Discrete Fourier transform (DFT) algorithm was applied forstatistical analysis. Julian dates are heliocentrically corrected. Theaverage zero-point of 10.439 mag was subtracted to prevent theappearance of additional features on the periodogram centred atfrequency 0.0.
Making a periodicity analysis of ASAS-3 photometry, we founda dominant frequency of f =1.209 895 count d−1, while, as definedby equation (1), σ (f ) = 0.000 022 (therefore, period P =0.826 518±0.000 015 d; see Fig. 5). The detected periodicity couldbe interpreted as the rotational period and it is in good agreementwith the period found by Pandey et al. (2005), but with improvedaccuracy (due to the longer time span of ASAS-3 observations). Noother periodicity of FR Cnc brightness modulations was found onthe basis of ASAS-3 observations.
The DFT routine was applied separately to each season of ob-servations as well. The obtained periodograms do not reveal anyother significant periodicity, but only the same peak as for theperiodogram for the whole time string. The dominant frequencyremains constant within the error limits of σ (f ) = 0.0003 for allsix periodograms.
2.1.2 Estimation of accuracy and reliability of the detected period
Empirical results from observational analysis (Breger et al. 1993)and numerical simulations (Kuschnig et al. 1997) have shown thatthe ratio in amplitude in the periodogram between signal andnoise should not be lower than 4.0 to give good confidence inthe detected peak. We calculated the signal-to-noise ratio (S/N)from the periodogram for the determined dominant frequency, soS/N = 6.88.
The spectral window function is important to confirm whether theobtained frequencies are real or an artefact of the window function.This was done by assigning 1 to brightness values with the sameobservation times and checking the resulting diagram. There wasno evidence of significant power at the location of the peak (Fig. 5).The dominant frequency on the spectral window is F = 1.0027with amplitude A = 0.9391, which is due to daily gaps inobservations.
Parameter uncertainties were calculated from an error matrix,which is a by-product of non-linear least-squares fitting procedure.Other types of uncertainties are those which could be calculatedfrom analytically derived formulae assuming an ideal case. Based onsome assumptions, one can derive a formula for the uncertainties infrequency and signal amplitude at this frequency. See Montgomery& Odonoghue (1999), Breger et al. (1999) and Kallinger, Reegen& Weiss (2008) for the derivation based on a monoperiodic fit. Thedetermined equation can be applied for each frequency separately:
σ (f ) =√
6
N
1
πT
σ (m)
a, (1)
σ (a) =√
2
Nσ (m), (2)
where N is the number of time points, T is the time length of thedata set, σ (m) denotes the residuals from the fit and a refers tothe signal amplitude at the particular frequency. Both ‘analytical’and ‘least-squares error matrix’ calculations give similar results:σ (f ) = 0.000022 and σ (a) = 0.0037. So, on the periodogram(Fig. 5) we plotted the 3σ (a) level (dashed line) to show that thedetected peak exceeds it significantly.
Another method for 1σ level of amplitude calculation was pro-posed for use by R. A. Fisher (see Fisher 1935, 1936), often calledthe Fisher randomization test. The idea is to take the original lightcurve and, preserving the time column, shuffle the correspondingintensities around. That destroys any coherent signal in the light
Figure 5. Periodogram of ASAS-3 data in frequency range of 1.0–1.5 and spectral window.
C© 2012 The Authors, MNRAS 421, 132–148Monthly Notices of the Royal Astronomical Society C© 2012 RAS
at Universidad C
omplutense de M
adrid on February 9, 2016http://m
nras.oxfordjournals.org/D
ownloaded from

136 A. Golovin et al.
Table 2. Log of Terskol photometric observations of FRCnc in the years 2007–08.
Year Beginning of the run End of the run(HJD) (HJD)
2007 March 245 4171.2453 245 4171.4361245 4174.3501 245 4174.4019245 4180.1863 245 4180.4691245 4182.2395 245 4182.4972245 4188.4424 245 4188.4721
2008 February 245 4498.4150 245 4498.5233245 4500.2675 245 4500.5345245 4501.1575 245 4501.5403245 4502.1681 245 4502.5870245 4503.2157 245 4503.4481245 4504.1755 245 4504.3025
curve while keeping the time sampling intact. We are left with ashuffled light curve of pure white noise. The next step is to computea DFT of this light curve which will look really noisy. The standarddeviation of the average amplitude of such a DFT is close to the 1σ
limit. We iterated this 25 times; therefore, we use the average of 25standard deviation values to determine 1σ level. This pipeline gaveus the value of σ (a) = 0.0028, which is slightly less than σ (a) from‘analytical’ and ‘least-squares error matrix’ calculations; hence, weplotted the bigger value on our periodogram to be confident.
2.2 Photometric sequence
We carried out the BV RCIC photometric calibration for 166 starsin the vicinity of FR Cnc with V magnitudes in the range 9.85–18.06 mag that could serve as comparison stars. Calibration wasdone at the Sonoita Research Observatory (Arizona, USA) us-ing a robotic 0.35-m telescope, equipped with an SBIG STL-1001XE CCD camera. A table with this photometrical sequenceis available electronically only via the AAVSO ftp-server.1 Foruser convenience, we have used the ALADIN Sky Atlas (Bonnarelet al. 2000) to align our calibration data on a DSS2/STScI POSSIIimage.2
2.3 Terskol observations
Optical B-band photometry was carried out from 2007 Marchto 2008 February at Terskol Branch of the Astronomy Institute(Russia) with a 29-cm telescope and Apogee-47 Alta CCD camera.All observations were made in the B band as the flare amplitudeis expected to increase with decreasing wavelength. The durationof each observing run varies from 2 to 7 h. See Table 2 for log ofobservations. The calibration process of the obtained frames, com-parison and check stars remains the same as described by Golovinet al. (2007).
The mean amplitudes of FR Cnc brightness variations in the B
band during the observations in the years 2007 and 2008 were 0.12and 0.13 mag, respectively. There are no peculiar features in thelight curve from the year 2008 (Fig. 6), while in the photometryobtained in the year 2007 two brightening episodes were detected,namely on 245 4180.3 and 245 4182.3 (see Fig. 7). Amplitudes inB band were 0.06 and 0.12 mag, respectively. It has to be noted that
1 ftp://ftp.aavso.org/public/calib/frcnc.dat2 http://www.mao.kiev.ua/ardb/ref/agolovin.html
Figure 6. B-band photometry at Terskol Observatory in 2008 February.
Figure 7. B-band photometry at Terskol Observatory in 2007 March. Plot-ted twice for clarity. Dotted lines denote phases when polarimetric obser-vations were done. Note an enlarged plots of brightening episodes on JD =245 4180 and JD = 245 4182.
the second episode (HJD = 245 4182.3) occurred at the same phaseas the flare of 2006 November 23 (phase = 0.88). Probably boththe events (flare on 2006 November 23 and brightening episode atphase 0.88) originated from the same long-living active regions onthe surface of FR Cnc.
3 PO L A R I M E T R I C O B S E RVAT I O N S
The BV R broad-band polarimetric observations of FR Cnc wereobtained on 2007 October 19 and 20 using TK 1024 pixel2 CCDcamera mounted on the Cassegrain focus of the 104-cm Sampur-nanand Telescope of ARIES, Nainital (India). The optical imagingpolarimetry was carried out in B, V and R (λBeff = 0.440 µm, λVeff =0.550 µm and λReff = 0.660 µm) photometric bands.
Standard stars for null polarization and for the zero-point of thepolarization position angle were taken from Schmidt, Elston &Lupie (1992). The results for standards are given in Table 3. Fromthe results, it can be concluded that obtained values of polarizationand position angles are in good agreement with Schmidt et al. (1992)within the error limit.
C© 2012 The Authors, MNRAS 421, 132–148Monthly Notices of the Royal Astronomical Society C© 2012 RAS
at Universidad C
omplutense de M
adrid on February 9, 2016http://m
nras.oxfordjournals.org/D
ownloaded from

FR Cnc: photometry, polarimetry and spectroscopy 137
Table 3. Observed polarized standard stars.
Star name Filter P ± εP (per cent) θ ± εθ (◦) P ± εP (per cent) θ ± εθ (◦)
Published data This paper
HD 25433 B 5.23 ± 0.09 134.3 ± 0.05 5.17 ± 0.21 135.6 ± 1.0V 5.12 ± 0.06 134.2 ± 0.03 5.13 ± 0.09 133.5 ± 0.8R 4.73 ± 0.05 133.6 ± 0.03 4.76 ± 0.13 132.9 ± 0.5
HD 19820 B 4.70 ± 0.04 115.70 ± 0.22 4.66 ± 0.07 115.49 ± 0.19V 4.79 ± 0.03 114.93 ± 0.17 4.76 ± 0.10 114.15 ± 0.20R 4.53 ± 0.03 114.46 ± 0.17 4.56 ± 0.17 114.18 ± 0.21
Table 4. Observed unpolarized standardstars.
Star name Filter q u
HD 21447 B 0.019 0.011V 0.037 −0.031R −0.035 −0.039
G191B2B B 0.072 −0.059V −0.022 −0.041R −0.036 0.027
Table 5. Observed BV R polarization values for FR Cnc.
Date of observation Filter Time (UT) P ± εP (per cent) θ ± εθ (◦)
2007 October 19 B 22:22:12.0 0.22 ± 0.05 57 ± 7V 22:01:45.1 0.20 ± 0.02 55 ± 2R 22:10:52.6 0.16 ± 0.05 61 ± 7
2007 October 20 B 21:25:36.6 0.26 ± 0.04 55 ± 5V 21:30:00.5 0.24 ± 0.07 54 ± 6R 21:35:48.6 0.17 ± 0.05 58 ± 7
Both the program and the standard stars were observed duringthe same night. HD 25433 and HD 19820 (= CC Cas) were used asa standard polarized stars, while HD 21447 and G 191-B2B (= HIP23692) served as standard unpolarized stars.
The results are listed in Tables 3–5, where P is the fraction of thetotal light in the linearly polarized condition and θ is the positionangle of polarization plane to the equatorial plane. It is denoted bythe normalized Stokes’ parameter q (= Q/I ), when the half-waveplate’s fast axis is aligned to the reference axis (α = 0◦), and,similarly, by the normalized Stokes’ parameter u (= U/I ), whenthe half-wave plate is at 22.◦5. For further details on used equipmentand the method of observations, refer to Medhi et al. (2007).
By dotted lines on the light curve, we indicate the phases (ϕ1 =0.16 and ϕ2 = 0.13 for 2007 October 19 and 20, respectively) whenour polarimetric observations were conducted (see Fig. 7). FR Cncwas in maximal brightness during that time.
Polarization in FR Cnc could be magnetic in origin. The degreeof polarization depends nonlinearly on the size of magnetic regions(see Huovelin & Saar 1991; Saar & Huovelin 1993). These authorshave also calculated a grid of expected degrees of polarization inUBV RI band for stars with temperature from 4000 to 7000 K andlog g from 2.0 to 4.5. We have used their results to compare ourobserved values of polarization for FR Cnc. Fig. 8 represents thedegree of polarization for FR Cnc in BV R bands. The maximumpossible degree of polarization for the total spot area of 24 per centis derived from the calculations of Saar & Huovelin (1993) for thestar corresponding to the spectral type of K5–7V and characteristicmagnetic field of 2.7 kG. These values are overplotted and repre-
Figure 8. The degree of polarization of FR Cnc as a function of wave-length. Model values of polarization for K5–7V spectral types stars (Saar &Huovelin 1993) are plotted for comparison.
sented by a solid line in Fig. 8. The observed polarization in the B
band is in good agreement with the theoretical values expected forZeeman polarization model. However, the observed polarization inV and R bands slightly exceeds the theoretical values.
Model values for K2V–K7V and K2IV–K2V spectral types ap-pear to be even lower and certainly do not match the polarization inany of observed bands. This is also observed in some other youngspotted stars (MS Ser, LQ Hya, VY Ari; see Alekseev 2003) andis probably due to the presence of a supplementary source of linearpolarization.
The predicted values of polarization due to Thompson andRayleigh scattering from inhomogeneous regions are not enough toexplain the observed polarization excess (Thompson and Rayleighscattering for the assumed spectral type supposed to be of the orderof 10−7 and 10−4 per cent, respectively; Saar & Huovelin 1993).The mechanism which can produce additional linear polarization isprobably scattering in circumstellar material (e.g. see Pandey et al.2009); on the other hand, the mentioned models are unacceptableif FR Cnc is a close binary star (Elias & Dorren 1990; Saar &Huovelin 1993; Alekseev 2003).
4 SPECTRO SCOPI C OBSERVATI ONS
A total of 58 high- and low-resolution spectra of FR Cnc have beenobtained and analysed in this work. The spectroscopic data were ob-tained during five observing runs. Details of each observing run aregiven in Table 6: date, telescope, spectrograph, CCD chip, spectralrange covered, number of orders included in each echelle spectrum,range of reciprocal dispersion, spectral resolution [determined as
C© 2012 The Authors, MNRAS 421, 132–148Monthly Notices of the Royal Astronomical Society C© 2012 RAS
at Universidad C
omplutense de M
adrid on February 9, 2016http://m
nras.oxfordjournals.org/D
ownloaded from
138 A. Golovin et al.
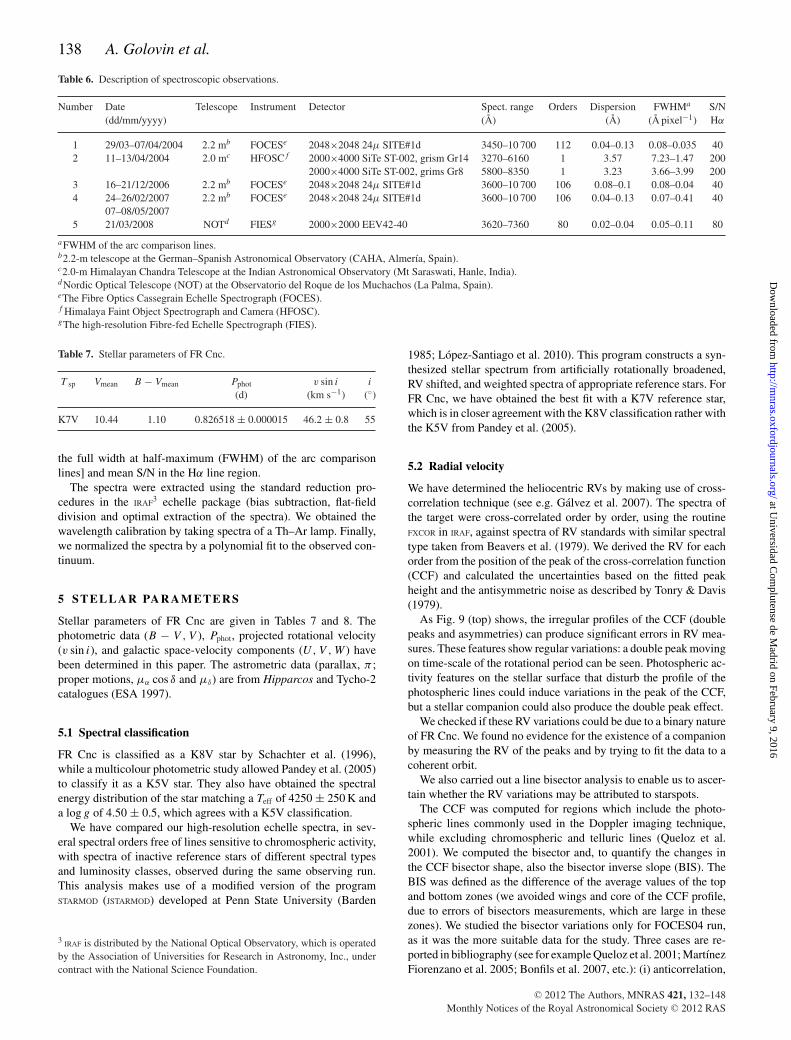
Table 6. Description of spectroscopic observations.
Number Date Telescope Instrument Detector Spect. range Orders Dispersion FWHMa S/N(dd/mm/yyyy) (Å) (Å) (Å pixel−1) Hα
1 29/03–07/04/2004 2.2 mb FOCESe 2048×2048 24μ SITE#1d 3450–10 700 112 0.04–0.13 0.08–0.035 402 11–13/04/2004 2.0 mc HFOSCf 2000×4000 SiTe ST-002, grism Gr14 3270–6160 1 3.57 7.23–1.47 200
2000×4000 SiTe ST-002, grims Gr8 5800–8350 1 3.23 3.66–3.99 2003 16–21/12/2006 2.2 mb FOCESe 2048×2048 24μ SITE#1d 3600–10 700 106 0.08–0.1 0.08–0.04 404 24–26/02/2007 2.2 mb FOCESe 2048×2048 24μ SITE#1d 3600–10 700 106 0.04–0.13 0.07–0.41 40
07–08/05/20075 21/03/2008 NOTd FIESg 2000×2000 EEV42-40 3620–7360 80 0.02–0.04 0.05–0.11 80
aFWHM of the arc comparison lines.b2.2-m telescope at the German–Spanish Astronomical Observatory (CAHA, Almerıa, Spain).c2.0-m Himalayan Chandra Telescope at the Indian Astronomical Observatory (Mt Saraswati, Hanle, India).dNordic Optical Telescope (NOT) at the Observatorio del Roque de los Muchachos (La Palma, Spain).eThe Fibre Optics Cassegrain Echelle Spectrograph (FOCES).f Himalaya Faint Object Spectrograph and Camera (HFOSC).gThe high-resolution Fibre-fed Echelle Spectrograph (FIES).
Table 7. Stellar parameters of FR Cnc.
T sp Vmean B − Vmean Pphot v sin i i
(d) (km s−1) (◦)
K7V 10.44 1.10 0.826518 ± 0.000015 46.2 ± 0.8 55
the full width at half-maximum (FWHM) of the arc comparisonlines] and mean S/N in the Hα line region.
The spectra were extracted using the standard reduction pro-cedures in the IRAF3 echelle package (bias subtraction, flat-fielddivision and optimal extraction of the spectra). We obtained thewavelength calibration by taking spectra of a Th–Ar lamp. Finally,we normalized the spectra by a polynomial fit to the observed con-tinuum.
5 ST E L L A R PA R A M E T E R S
Stellar parameters of FR Cnc are given in Tables 7 and 8. Thephotometric data (B − V , V ), Pphot, projected rotational velocity(v sin i), and galactic space-velocity components (U, V , W ) havebeen determined in this paper. The astrometric data (parallax, π ;proper motions, μα cos δ and μδ) are from Hipparcos and Tycho-2catalogues (ESA 1997).
5.1 Spectral classification
FR Cnc is classified as a K8V star by Schachter et al. (1996),while a multicolour photometric study allowed Pandey et al. (2005)to classify it as a K5V star. They also have obtained the spectralenergy distribution of the star matching a Teff of 4250 ± 250 K anda log g of 4.50 ± 0.5, which agrees with a K5V classification.
We have compared our high-resolution echelle spectra, in sev-eral spectral orders free of lines sensitive to chromospheric activity,with spectra of inactive reference stars of different spectral typesand luminosity classes, observed during the same observing run.This analysis makes use of a modified version of the programSTARMOD (JSTARMOD) developed at Penn State University (Barden
3 IRAF is distributed by the National Optical Observatory, which is operatedby the Association of Universities for Research in Astronomy, Inc., undercontract with the National Science Foundation.
1985; Lopez-Santiago et al. 2010). This program constructs a syn-thesized stellar spectrum from artificially rotationally broadened,RV shifted, and weighted spectra of appropriate reference stars. ForFR Cnc, we have obtained the best fit with a K7V reference star,which is in closer agreement with the K8V classification rather withthe K5V from Pandey et al. (2005).
5.2 Radial velocity
We have determined the heliocentric RVs by making use of cross-correlation technique (see e.g. Galvez et al. 2007). The spectra ofthe target were cross-correlated order by order, using the routineFXCOR in IRAF, against spectra of RV standards with similar spectraltype taken from Beavers et al. (1979). We derived the RV for eachorder from the position of the peak of the cross-correlation function(CCF) and calculated the uncertainties based on the fitted peakheight and the antisymmetric noise as described by Tonry & Davis(1979).
As Fig. 9 (top) shows, the irregular profiles of the CCF (doublepeaks and asymmetries) can produce significant errors in RV mea-sures. These features show regular variations: a double peak movingon time-scale of the rotational period can be seen. Photospheric ac-tivity features on the stellar surface that disturb the profile of thephotospheric lines could induce variations in the peak of the CCF,but a stellar companion could also produce the double peak effect.
We checked if these RV variations could be due to a binary natureof FR Cnc. We found no evidence for the existence of a companionby measuring the RV of the peaks and by trying to fit the data to acoherent orbit.
We also carried out a line bisector analysis to enable us to ascer-tain whether the RV variations may be attributed to starspots.
The CCF was computed for regions which include the photo-spheric lines commonly used in the Doppler imaging technique,while excluding chromospheric and telluric lines (Queloz et al.2001). We computed the bisector and, to quantify the changes inthe CCF bisector shape, also the bisector inverse slope (BIS). TheBIS was defined as the difference of the average values of the topand bottom zones (we avoided wings and core of the CCF profile,due to errors of bisectors measurements, which are large in thesezones). We studied the bisector variations only for FOCES04 run,as it was the more suitable data for the study. Three cases are re-ported in bibliography (see for example Queloz et al. 2001; MartınezFiorenzano et al. 2005; Bonfils et al. 2007, etc.): (i) anticorrelation,
C© 2012 The Authors, MNRAS 421, 132–148Monthly Notices of the Royal Astronomical Society C© 2012 RAS
at Universidad C
omplutense de M
adrid on February 9, 2016http://m
nras.oxfordjournals.org/D
ownloaded from

FR Cnc: photometry, polarimetry and spectroscopy 139
Table 8. Astrometric and kinematic parameters of FR Cnc.
π μα cos δ μδ U ± σU V ± σV W ± σW VTotal
(mas) (mas yr−1) (mas yr−1) (km s−1) (km s−1) (km s−1) (km s−1)
30.24 ± 2.03a −98.1 ± 1.6a −91.0 ± 1.5a −19.02 ± 0.62 −18.99 ± 1.08 −8.03 ± 1.58 28.05
aFrom Hipparcos and Tycho-2 catalogues (ESA 1997).
Figure 9. (Top) An example of CCF of FR Cnc in FOCES04 observing run.Irregular profiles can be seen in the peak. These irregularities can producesignificant errors in RV determination. (Bottom) The same CCF obtainedwhen we broadened the standard star to FR Cnc rotational velocity. Irregularprofiles become smoother and could be fitted with a Gaussian.
which indicates that the RV variations are due to stellar activity (byactive regions at the stellar surface like spots or plages), (ii) lack ofcorrelation, which indicates the Doppler reflex motion around thecentre of mass due to other bodies orbiting the star, (iii) correlation,which, as pointed out by Martınez Fiorenzano et al. (2005), indi-cates that the RV variations are due to light contamination from anunseen stellar companion.
As shown in Fig. 10, there is an anticorrelation between BISand RV, with a Pearson correlation coefficient (r) of −0.6851. Thisresult suggests that the RV variations of FR Cnc are due to stellaractivity variations (e.g. spots on photosphere) and not due to a binarynature. When the spectrum of the standard star was broadened to thesame rotational velocity of FR Cnc, the profiles of the CCF becamesmoother and could be fitted with a Gaussian profile (see Fig. 9,bottom).
The irregular profiles of the CCF (double peaks and asymmetries)can produce significant errors in RV measurements (see Fig. 9).These irregularities may come from photospheric activity featureson the stellar surface. They can distort the profile of the photosphericlines and induce variations in the peak of the CCF. However, thisbehaviour may be caused by the difference in rotational velocity(v sin i) between the target and standard star (see e.g. Galvez et al.2007) when the standard is a much slower rotator than the target. TheCCF is essentially the broadening function that would be appliedto the template spectrum. Use of a broadened template removeshigher moments introduced from the starspots, enabling a relativelyunbiased estimate of RV to be determined (Fig. 9). A mean RV of
Figure 10. Bisector velocity span versus RV for FOCES04 observing run.The clear negative correlation indicates that RV variations are due to stellaractivity (see Section 5.2).
17.8 ± 1.6 is obtained for the 2004 data set and is in good agreementwith the RV derived through optimization of parameters in theDoppler imaging process (Section 7), where we find Vhel = 18.6 ±0.6. Therefore, all the RVs given in this paper have been calculatedby cross-correlation with this rotational broadened spectrum of thestandard star.
In Table 9 we list, for each spectrum, the heliocentric RVs (Vhel)with their corresponding errors (σV ) obtained as weighted means ofindividual values deduced for each order in the spectra. We also listdata points from Upgren et al. (2002) for comparison.
Table 9. Radial and rotational velocities.
Run HJD Vhel ± σV v sin i
(240 0000 +) (km s−1) (km s−1)
FOCES04 53098.3713 16.95 ± 0.58 44.1 ± 1.9FOCES04 53099.3411 18.42 ± 0.57FOCES04 53099.4230 17.34 ± 0.66FOCES04 53099.4546 16.74 ± 0.69FOCES04 53100.3156 16.62 ± 0.64FOCES04 53100.3917 15.36 ± 0.56FOCES04 53101.3264 18.70 ± 0.48FOCES04 53101.4495 20.97 ± 0.55FOCES04 53102.3306 19.30 ± 0.55FOCES04 53102.4753 17.68 ± 0.55FOCES06 54086.6770 19.85 ± 0.63 37.2 ± -FOCES06 54088.5918 19.62 ± 0.45FOCES06 54091.6192 20.45 ± 0.53FOCES07a 54156.4482 19.98 ± 0.52 41.3 ± 2.7FOCES07a 54158.5625 20.41 ± 0.80FOCES07b 54228.3461 − 43.6 ± 3.2FOCES07b 54229.3496 –FIES08 54547.4408 17.82 ± 0.74 –Upgren02 51626.695 27 ± 2.3 –Upgren02 51626.730 24 ± 4.1 –
C© 2012 The Authors, MNRAS 421, 132–148Monthly Notices of the Royal Astronomical Society C© 2012 RAS
at Universidad C
omplutense de M
adrid on February 9, 2016http://m
nras.oxfordjournals.org/D
ownloaded from

140 A. Golovin et al.
Those orders which contain chromospheric features and promi-nent telluric lines have been excluded when determining the meanRV.
5.3 Rotational velocity
By using the program JSTARMOD (see Section 5.1), we have ob-tained the best fits for each observing run using v sin i values of≈35 km s−1. However, this value depends on the rotation of thestandard star which has non-zero rotation. Therefore, the obtainedvalue can only be used as an approximation.
To determine an accurate rotational velocity of this star, we madeuse of the following method (see Martınez-Arnaiz et al. 2010, fordetails). Rotational velocities, v sin i, can be written as follows (seeQueloz et al. 1998, and references therein):
σ 2rot = σ 2
obs − σ 20 =⇒ v sin i = A
√σ 2
obs − σ 20 , (3)
where A is a coupling constant which depends on the spectro-graph and its configuration. The spectrum of each of these stars wasbroadened using the program JSTARMOD from v sin i = 1 km s−1 upto 50 km s−1 and the respective CCF was calculated. A was foundfor every spectrograph by fitting the relation (v sin i)2 versus σ 2
obs.It is well known that σ0 is a function of the broadening mechanismswhich are present in the atmosphere of the star, except rotation(Melo et al. 2004). Since the broadening mechanisms are functionof the temperature and gravity, we may expect a dependence ofσ0 on the temperature. To determine this dependence, we use syn-thetic spectra with no rotational velocity computed using the ATLAS9code by Kurucz (1993) adapted to work under a Linux platform bySbordone et al. (2004) and Sbordone (2005). Once A is determinedand σ0 calibrated with the colour index (B − V ), σobs (width of theCCF of the star when correlated with itself) is measured for eachstar, v sin i can be directly calculated using the above formula (3).
In Table 9, we list, for each observing run, the averaged v sin i
value obtained. From Table 9, we estimate uncertainties of 1.9 –3.2 km s−1 based on the standard deviations as each measurementepoch. It is likely that the v sin i values vary by more than theseuncertainties since FR Cnc is very active and exhibits starspots(see Section 7) that significantly distort the rotationally broadenedabsorption lines. Moreover, while the observations taken in the year2004 cover a complete rotation cycle, those v sin i measurements atother epochs only include one to two observations and are likely toyield more biased results (i.e. depending on the location of starspotsat the observation phases). In Section 7, we model the line profileusing our Doppler imaging code, allowing for the presence of spots.The resulting fits are thus likely to give a more accurate rotationvelocity, v sin i, for FR Cnc.
5.4 Kinematics
We computed the galactic space-velocity components (U, V ,W )and their associated errors of FR Cnc using the procedure describedby Johnson & Soderblom (1987) modified by Lopez-Santiago (seeMontes et al. 2001a). This procedure uses J2000 coordinates andtakes into account correlation in the measures of Hipparcos. We useaveraged RV calculated here (18.63 ± 0.14 km s−1) and the propermotions and parallax from Hipparcos.
The obtained values of the components with its module VTotal andassociated errors are given in Table 8. The velocity components inthe (U, V ) diagram are clearly within the young disc populationboundaries (Eggen 1984a,b, 1989; Montes et al. 2001a,b), indicat-ing that the star belongs to the young disc and that it might also
belong to the IC 2391 moving group (MG), mentioned previouslyby Pandey et al. (2005), but the Eggen kinematic criteria (see Monteset al. 2001a, for details) are negative, showing that FR Cnc couldbe not a member of any MG in the young disc area.
The classical view of MGs (e.g. Eggen 1984a), i.e. they comefrom the remnant of a star-forming cloud, has been discussed inrecent years. Several studies (e.g. Famaey et al. 2007; Antoja et al.2008; Famaey, Siebert & Jorissen 2008; Zhao, Zhao & Chen 2009)seem to support a dynamic or resonant mechanism origin. Whileboth theories are feasible, we will just take into account that the per-centage of contamination of the young disc space-velocity area byold field population is high (see Lopez-Santiago, Micela & Montes2009, and references therein), and so age constraints are needed toassess if FR Cnc belongs to any of young disc MGs.
5.5 The Li I λ6707.8 line
Li I λ6707.8 spectroscopic feature is an important diagnostic toolfor assessing the age in late-type stars, since lithium is destroyedeasily by thermonuclear reactions in the stellar interior.
The spectral region of the resonance doublet of Li I at λ6708 Åis covered in all the high-resolution observations. We measured theequivalent width (EW) in seven spectra.
Due to the small value, we were not able to measure EWs di-rectly or use spectral subtraction technique. Therefore, EWs havebeen obtained using the IRAF task SBANDS, performing an integra-tion within a band of 1.6 Å centred in the lithium line (Maldonadoet al. 2010). We have obtained an averaged value of 54 mÅ. In ourhigh-resolution spectra, the Li I line is blended with Fe I 6707.4 Å.To subtract the Fe I contribution, we used the colour index relationfrom Favata et al. (1993). Therefore, we obtain the final value ofEW(Li I) to be 34 mÅ. In Fig. 11, we plot as an example, a spectraformed by co-adding the FOCES04 run spectra, and we indicatedthe position of the Li I line.
By comparing this value with stars of similar spectral type(K5–K7 with V − I = 1.3) in other MG members or clustersof a well-known age (in the same way as in fig. 3 of Lopez-Santiago
Figure 11. Spectrum in the Li I line region, resulting of co-adding the 10observed spectra of FOCES04 run in order to increase the S/N. The positionof the Li I + Fe I and Ca I are marked.
C© 2012 The Authors, MNRAS 421, 132–148Monthly Notices of the Royal Astronomical Society C© 2012 RAS
at Universidad C
omplutense de M
adrid on February 9, 2016http://m
nras.oxfordjournals.org/D
ownloaded from

FR Cnc: photometry, polarimetry and spectroscopy 141
et al. 2009), it is in agreement with being a young object between10 and 120 and compatible with being IC 2391 MG member.
5.6 Other age indicators
Ideally, further constraints on FR Cnc’s age should be calculated toconfirm its youth. Popular age approximations are for example theX-ray flux–age relation (Mamajek & Hillenbrand 2008; equationA3) or the commonly used relation between age and R
′HK index,
which measures chromospheric emission in the cores of the broadchromospheric Ca II H&K lines (see e.g. Noyes et al. 1984; Baliunaset al. 1996; Mamajek & Hillenbrand 2008). The former relation isvalid for stars with spectral types earlier than that of FR Cnc and socannot be used. Also, using the latter relation, from our Ca II H&Kfluxes (see Section 6.3 and Table 9), we obtain a log R′
HK = −3.48which is outside the validity range of the activity–age relation, butin this case, it is compatible with the young age.
6 C H RO M O S P H E R I C AC T I V I T Y I N D I C ATO R S
Both echelle and long slit spectra analysed in this work allowed us tostudy the behaviour of the different indicators from the Ca II H&Kto the Ca II IRT lines, which are formed at different atmosphericaltitudes. The chromospheric contribution to these features wasdetermined by using the spectral subtraction technique described indetail by Montes et al. (2000) and Galvez et al. (2002).
The excess emission EW of different spectral features were mea-sured in the subtracted spectra. In Table 10, we give the EW forthe Ca II H&K, Hε, Hδ, Hγ , Hβ, Hα and Ca II IRT (λλ8498, 8542,8662 Å) lines for the echelle spectra. These EWs were converted toan absolute surface fluxes by using the empirical stellar flux scalescalibrated by Hall (1996) as a function of the star colour index. Inour case, we used the B − V index and the corresponding coef-ficients for Ca II H&K, Hα and Ca II IRT, using for Hε the samecoefficients as for Ca II H&K, and derived the Hδ, Hγ and Hβ coef-ficients of flux by carrying out an interpolation between the values
of Ca II H&K and Hα. The logarithm of the obtained absolute fluxat the stellar surface (log FS) in erg cm−2 s−1 Å−1 for the differentchromospheric activity indicators is given in Table 11.
Fig. 12 shows representative observations in the Hα and Ca II
IRT λλ8498, 8542 line regions for high-resolution spectra. Fig. 13shows representative observations in Hα for low-resolution spectra.Fig. 14 shows a closer view of one spectrum from Figs 12 and 13where the emission can be better seen.
6.1 The Hα line
We analysed the Hα line region for all the spectra. This line in theobtained spectra is always observed in emission above the contin-uum (see Figs 12 and 13).
Measuring the EW of this line, we found that the EW averageof the Hα emission is quite different in every season, showingsignificant variability in time-scales of a year. EW(Hα) = 3.23 Åfor FOCES04 run, while EW(Hα) = 1.67, 1.72 and 1.87 Å forFOCES06, FOCES07a and FOCES07b, respectively, andEW(Hα) = 1.72 for the only value of FIES08 run. For the low-resolution spectra, we have an average value (in 37 spectra takenduring three consecutive nights) of EW(Hα) = 2.14 Å in HFOSC04run.
Fig. 15 shows the variation of EW versus phase (calculated withthe photometric period) in HFOSC04 run. Different symbols rep-resent different nights. The second night (triangles) shows highervalues of the Hα EWs. Top of Fig. 16 represent the variation of EWversus phase in the FOCES04 run.
Comparing the variations of Hα EW between the runs and thevariation in each run when possible, we note activity level variationson a month-long time-scale, from 1 yr to the next (see Table 10).Making the comparison with the photometry, we note a correspon-dence between marked variations in the light curve and EW(Hα).In the year 2004, both photometry and spectroscopy show a highlevel of FR Cnc activity, while it is decreasing rapidly in the year2005 and then remains on that level during our further observations.
Table 10. EW of chromospheric indicators.
EW(Å) in the subtracted spectra
Run HJD Ca II Ca II IRT
(240 0000+) K H Hε Hδ Hγ Hβ Hα λ8498 λ8542 λ8662
FOCES04 53098.3713 a a a a 0.42 1.13 2.83 0.69 0.97 0.76FOCES04 53099.3411 2.46 a a 0.62 1.10 1.32 3.50 0.73 0.92 0.71FOCES04 53099.4230 a a a a 0.40 1.44 3.80 0.77 0.94 0.81FOCES04 53099.4546 a a a a 0.46 1.10 3.15 0.91 0.97 0.75FOCES04 53100.3156 1.54 2.74 1.70 0.21 0.67 1.30 3.12 0.73 0.99 2.18FOCES04 53100.3917 1.58b 1.47 0.73 0.25 0.30 1.03 2.84 0.71 0.95 0.71FOCES04 53101.3264 a a a 0.40 0.76 1.08 2.83 0.67 0.91 0.73FOCES04 53101.4495 a a a a 0.27 1.23 3.15 0.71 0.86 0.70FOCES04 53102.3306 2.12 1.74 1.02 a 0.77 1.21 3.78 0.67 0.92 0.73FOCES04 53102.4753 a a a a a 1.40 3.34 0.77 0.89 0.74FOCES06 54086.6770 6.58c 6.82c 0.00c 0.36 0.30 0.74 1.49 0.29 0.63 0.58FOCES06 54088.5918 3.72c 4.30c 1.00c 0.26 0.73 0.50 1.93 0.59 0.53 0.66FOCES06 54091.6192 5.84c 5.39c 0.90c 0.37 0.36 0.58 1.60 0.60 0.99 0.58FOCES07a 54156.4482 9.69c 5.97c 1.40c 0.32 0.24 0.74 1.80 0.68 0.86 0.71FOCES07a 54158.5625 9.58c 3.78c 0.48c – 0.13 0.76 1.65 0.64 0.86 0.69FOCES07b 54228.3461 – – – – – – 1.87 0.79 1.03 0.77FOCES07b 54229.3496 – – – – – – 1.72 0.71 0.89 0.79
aValues not measured due to the low S/N.bValues measured with low S/N.cValues measured in the observed spectra (spectral subtraction is not applied).
C© 2012 The Authors, MNRAS 421, 132–148Monthly Notices of the Royal Astronomical Society C© 2012 RAS
at Universidad C
omplutense de M
adrid on February 9, 2016http://m
nras.oxfordjournals.org/D
ownloaded from

142 A. Golovin et al.
Table 11. Emission fluxes.
logFS
Run HJD Ca II Ca II IRT
(240 0000+) K H Hε Hδ Hγ Hβ Hα λ8498 λ8542 λ8662
FOCES04 53098.3713 a a a a 5.88 6.35 6.91 6.24 6.38 6.28FOCES04 53099.3411 6.62 a a 6.03 6.30 6.42 7.00 6.26 6.36 6.25FOCES04 53099.4230 a a a a 5.86 6.46 7.04 6.28 6.37 6.31FOCES04 53099.4546 a a a a 5.92 6.34 6.95 6.36 6.38 6.27FOCES04 53100.3156 6.41 6.66 6.46 5.56 6.08 6.41 6.95 6.26 6.39 6.74FOCES04 53100.3917 6.42b 6.39 6.09 5.63 5.73 6.31 6.91 6.25 6.37 6.25FOCES04 53101.3264 a a a 5.84 6.14 6.33 6.91 6.22 6.36 6.26FOCES04 53101.4495 a a a a 5.69 6.39 6.95 6.25 6.33 6.24FOCES04 53102.3306 6.55 6.47 6.23 a 6.14 6.38 7.03 6.22 6.36 6.26FOCES04 53102.4753 a a a a a 6.45 6.98 6.28 6.35 6.27FOCES06 54086.6770 6.74c 6.75c – 5.49 5.45 5.92 6.46 5.76 6.09 6.06FOCES06 54088.5918 6.49c 6.55c 5.92 5.36 5.84 5.75 6.57 6.06 6.02 6.11FOCES06 54091.6192 6.68c 6.65c 5.87 5.50 5.53 5.81 6.49 6.07 6.29 6.05FOCES07a 54156.4482 6.91c 6.70c 6.06 5.45 5.35 5.91 6.54 6.13 6.23 6.15FOCES07a 54158.5625 6.90c 6.50c 5.60 – 5.10 5.93 6.50 6.10 6.22 6.13FOCES07b 54228.3461 – – – – – – 6.56 6.19 6.31 6.18FOCES07b 54229.3496 – – – – – – 6.52 6.14 6.24 6.19
aValues not measured due to the low S/N.bValues measured with low S/N.cValues measured in the observed spectra (spectral subtraction is not applied).
This can be interpreted as an activity cycle of at least 4–5 yr, similarto Sun or other star activity cycles, but further follow-up is neededto confirm this. Accurate stellar activity cycle can prove useful forstudying the dynamo interface and activity cycle–rotation–spectraltype mechanisms in the stars (see e.g. Lorente & Montesinos 2005).
The persistence of Hα emission indicates that it is a very activeBY Dra system, but the vast range of variability levels make thisstar unusual and interesting for further study.
6.2 The Hβ, Hγ and Hδ lines
We can see the absorption of Hβ, Hγ and Hδ Balmer lines filledin with emission in the observed spectra. Fig. 17 plots a represen-tative subtracted spectra of these three lines in different nights ofFOCES04 run.
The variation of these lines with rotational phase and from seasonto season follows the same trend as Hα variation.
We also measured the ratio of excess emission in the Hα andHβ lines [EW(Hα)/EW(Hβ)] and the ratio of excess emissionEHα/EHβ with the correction,
EHα
EHβ
= EW(Hα)
EW(Hβ)× 0.2444 × 2.512(B−R), (4)
given by Hall & Ramsey (1992). This corrects the absolute fluxdensity in these lines for the colour difference in the components.We have obtained a mean value of EHα/EHβ ≈ 2.5. This value isin the limit between the presence of prominence-like material on orabove the stellar surface (Buzasi 1989; Hall & Ramsey 1992).
6.3 Ca II H&K and Hε
The Ca II H&K line region is included in most of the spectra, but theefficiency of the spectrograph and the CCD decreases very rapidlydue to the position of these lines at the end of the echellogram.Therefore, the obtained S/N is very low, and the normalization ofthe spectra is very difficult. In many cases, we could not measure the
EW lines, and in other we measured them in the observed spectra asit was not possible to apply the spectral subtraction for this region(see Tables 10 and 11).
Strong emission in the Ca II H&K is seen despite the low S/N.
6.4 Ca II IRT lines (λλ8498, 8542, 8662)
The three lines of the Ca II (IRT) are included in all our echellespectra. In all of them, a clear emission arising in the core of theabsorption lines is seen (see Fig. 12).
Averaged values of emission EW are EW(Ca II) = 0.74, 0.93and 0.81 Å for λλ8498, 8542, 8662 in FOCES04 run. EW(Ca II) =0.49, 0.72 and 0.61 Å in FOCES06 run. EW(Ca II) = 0.66, 0.86and 0.70 Å in FOCES07a. EW(Ca II) = 0.79, 1.03 and 0.77 Å inFOCES07b, and EW(Ca II) = 0.71, 0.89 and 0.79 Å in FIES08.
The variation of the emission in these lines is significant althoughnot as strong as in Hα (see Table 10).
Only for the FOCES04 run, we have enough data points to com-pare variations between Hα EWs and Ca II EWs. In other active stars,a clear anticorrelation is usually seen (as their emissions come fromdifferent features in the stellar surface), see e.g. stars in Arevalo& Lazaro (1999), Montes et al. (2000), Galvez et al. (2002, 2009),etc., but it is very weak in the case of FR Cnc (see Fig. 16).
In addition, we have calculated the ratio of excess emission EW,E8542/E8498, which is also an indicator of the type of chromo-spheric structure, which produces the observed emission. In solarplage values of E8542/E8498 ≈ 1.5–3 are measured, while in solarprominence the values are ≈9, the limit of an optically thin emit-ting plasma (Chester 1991). We have found a E8542/E8498 ≈ 1.3,indicating that Ca II IRT emission comes from plage-like regions.
7 D OPPLER I MAG I NG
Since FR Cnc is a rapid rotator with considerable broadeningof spectral lines, we generated an indirect starspot map usingthe Doppler Tomography of Stars (DOTS) imaging code (Collier
C© 2012 The Authors, MNRAS 421, 132–148Monthly Notices of the Royal Astronomical Society C© 2012 RAS
at Universidad C
omplutense de M
adrid on February 9, 2016http://m
nras.oxfordjournals.org/D
ownloaded from

FR Cnc: photometry, polarimetry and spectroscopy 143
Figure 12. Spectra in the Hα (left-hand side) and Ca II IRT λλ8498, 8542(right-hand side) line regions for FOCES04 observing run; clear wide andprominent emission arises over the continuum from Hα and a clear emissionin the core of the absorption line is seen in the Ca II IRT lines.
Figure 13. Sample of spectra in the Hα line region for HFOSC04 observingrun; clear emission arises over the continuum from Hα in this low-resolutionspectra.
Cameron 2001). In order to detect the line distortion due to starspotsin the high-resolution spectra, we have applied least-squares de-convolution (LSD; Donati et al. 1997; Barnes et al. 1998) to the4362–6845 Å wavelength region of FOCES04 spectra (obtained at2004 March to April). A single line, free of the effects of rotationalline blending and with high S/N is thus derived. Deconvolution is
Figure 14. A representative spectra of Figs 12 and 13, showing a zoom ofthe Hα (left-hand side) and Ca II IRT (centre) line regions for FOCES04 andHα (right) line region for HFOSC04.
Figure 15. Variation of Hα EW versus phase in HFOSC04 run. Differentsymbols represent different nights. The second night is in triangles, showinghigher values of the Hα EWs.
Figure 16. Top: variation of Hα EW versus phase in FOCES04 run. Bottom:variation of Ca II IRT EW versus phase.
carried out using a T = 2450 K model line list (VALD; see Kupkaet al. 1999, 2000) which indicates that there are 8345 lines in theselected wavelength region with normalized depths of 0.05–1.0. Re-gions around hydrogen Balmer lines, the Mg triplet and Na doubletare excluded from the deconvolution. A single line profile with amean of λ = 5460.4 Å is derived for each observed spectrum. The
C© 2012 The Authors, MNRAS 421, 132–148Monthly Notices of the Royal Astronomical Society C© 2012 RAS
at Universidad C
omplutense de M
adrid on February 9, 2016http://m
nras.oxfordjournals.org/D
ownloaded from

144 A. Golovin et al.
Figure 17. Representative subtracted spectra of Hβ, Hγ and Hδ lines indifferent nights of FOCES04 run.
mean S/N of the input spectra over the entire 4362–6845 Å wave-length region was 21.8, while the mean deconvolved line profilespossess S/N = 1008 (indicating a gain of 46.2). It should be notedthat while the profile shown in Fig. 9 (upper panel) represents thebroadening function of FR Cnc (i.e. rotational velocity plus starspotdistortions), the LSD profiles in Section 7 are deconvolved using aline list rather than a template. As such, the LSD profiles still con-tain the intrinsic stellar profile, and any distortions due to starspotswill appear to possess a lower amplitude when compared with atemplate-derived CCF.
For the imaging procedure, we used the standard star, HD 151877,to represent the local intensity profile of a slowly rotating star. Atwo-temperature model with Tphot = 4250 K and Tspot = 3000 Kwas used. The starspot image therefore represents the spot fillingfactor. Details of the Doppler imaging technique can be found inCollier Cameron (2001). We optimized the goodness of fit to the 10deconvolved profiles for heliocentric RV, axial inclination, EW andv sin i, finding Vhel = 18.6 ± 0.6, v sin i = 46.2 ± 0.8 km s−1 andi = 55◦± 5◦. The v sin i value is higher than, but still consistentwith, our mean v sin i value derived in Section 5.3. Since we hereuse all rotation phases to derive our best-fitting Doppler image, itis likely that the result is less biased than the previous results inSection 5.3 that do not take account of the presence of starspots,which affect the profile shape. Starspot distortions in the wings ofthe profiles, for instance, are likely to lead to underestimations ofv sin i when using a single spectrum, leading to a systematicallylower mean estimation of v sin i. We note, however, that our resultfor the 2004 observations is consistent with the value tabulated inTable 9 (i.e. 44.1 ± 1.9 km s−1). Fig. 18 shows the deconvolvedprofiles (and phases of observation), while Fig. 19 shows Mercatorprojections of the starspot image of FR Cnc.
The surface map in Fig. 19 (upper panel) indicates that FR Cncpossesses considerable spot coverage as suggested by the time vary-ing distortions in the deconvolved profiles in Fig. 18 (left-handpanel – spectroscopic data only). For comparison with the 2003–04(JD = 245 2934–245 3146 in Table 1) light curve presented in Fig. 3(top right), we have generated a synthetic light curve based on thespectroscopically derived image in Fig. 19 (upper panel). While weare able to recover the observed light-curve morphology, we con-siderably underestimate the amplitude (Fig. 20, upper panel). Thisis likely due, at least in part, to loss of information in the Dopplerimaging process (i.e. of the spectroscopic data) owing to resolutionand noise constraints imposed by the fitting procedure which mustoptimize both the fit and the image entropy. With higher S/N data
Figure 18. The figure shows the deconvolved profiles, with the phases ofobservation. The variation of the profile shape, due to starspots rotating intoand out of view, is clearly seen.
and spectral resolution, it is probable that more precise fitting wouldyield spot filling factors, indicating cooler spots. In addition, there isa tendency for spots close to the equator (<20◦) to be reconstructedat slightly higher latitudes than they are physically situated. This isdue to the smaller entropy penalty of placing a smaller spot awayfrom the equator as compared with a larger spot nearer the equator.The resulting spot distribution will naturally lead to predicted lightcurves with underestimated amplitudes since equatorial spots yieldhigher amplitudes.
We find a spot filling factor of 6 per cent from our spectroscopicDoppler image. This is at the lower end of the typical values (up to∼30 per cent) found for active stars by O’Neal, Saar & Neff (1996,1998) and O’Neal et al. (2004) using TiO indicators. We have there-fore reconstructed an image that also makes use of the 2003/2004V -band photometric data (e.g. see Barnes et al. 1998). It shouldbe noted that while the light-curve data span several months, thespectroscopic data were taken over only a few days. Since the pho-tometric observations taken within ±1 month of the spectroscopicdata do not show significant deviation from the photometric dataset as a whole, we made use of all photometric points. The resultingsimultaneous fits to the data are shown in Fig. 18 (right-hand panel)and Fig. 20 (bottom panel), while the reconstructed image is shownin Fig. 19 (bottom panel). Simultaneous imaging that makes useof spectroscopic and photometric data must strike a balance, suchthat reasonable fits to both data sets are achieved. We have alreadyoutlined (above) possible modest biases in an image derived from aspectroscopic fit to finite S/N. Light-curve data alone do not containsufficient information to make reliable images of single stars. Anycomplex spot structure or spot groups will be rendered simply asa single spot. Photometric imaging favours reconstruction at lowerlatitudes because a smaller spot is more easily able to reproduce theamplitude variation (and yields a lower image entropy penalty) inan observed light curve than a slightly larger spot at higher latitude.Allowing the photometric fit to more closely match the observedlight curve results in a slightly poorer fit to the spectroscopic data.The fitted light curve now closely matches the observed light curve,since more large-scale (albeit unresolved) starspot structure hasbeen recovered. This has necessitated some loss of image details(Fig. 19, lower panel) as compared to the spectroscopic reconstruc-tion alone (Fig. 19, upper panel). The filling factor is now greater at9 per cent, adding further weight to the argument that spectroscopyalone is unable to recover all starspot information. Indeed, if theresults from TiO are to be believed, there may be further unresolved
C© 2012 The Authors, MNRAS 421, 132–148Monthly Notices of the Royal Astronomical Society C© 2012 RAS
at Universidad C
omplutense de M
adrid on February 9, 2016http://m
nras.oxfordjournals.org/D
ownloaded from

FR Cnc: photometry, polarimetry and spectroscopy 145
Figure 19. Mercator projection of the starspot image of FR Cnc. A high degree of spot coverage is revealed. There are no visible spots in the phase range0.1–0.3. FR Cnc shows only mid-latitude starspots and no polar spot like other typical late K stars. The vertical lines mark the corresponding phase for 10spectra we have used for deconvolution. The right-hand plot shows how the mean effective spot area changes with latitude.
global starspot coverage on FR Cnc and all other stars that havebeen subjected to such studies.
We also carried out a bisector analysis on the LSD profiles, cal-culating the bisectors in the same way as in Section 5.2. As wehave mentioned, the LSD profiles should show a smoothing of thebisectors, reflected in the lower value of the bisector we obtainedcomparing with the original spectra. As expected, the anticorrela-tion is still seen, but here we have a strongest Pearson correlationcoefficient of r = −0.8992.
As might be expected for such an active star, FR Cnc exhibitsa high degree of spot coverage. No spots are visible in the phaserange 0.1–0.3. This agrees well with the photometric V -band lightcurve plotted for the same period (Fig. 3, 2003–04) which showsa maximum at phase ∼0.2. This contrast with a significant degreeof spotness at other longitudes is likely responsible for the highdegree of photometrical modulation seen in this star. The starspotdistribution of FR Cnc is also of interest since it is one of the latestspectral types to have been imaged. Comparison with the K5V rapidrotator LO Peg (Barnes et al. 2005) shows a significantly differentspot distribution. While LO Peg rotates more rapidly (v sin i =65.9 km s−1), showing predominantly mid-high latitude spot struc-tures and a polar spot, FR Cnc shows only mid-latitude starspots.Small-scale spot structure is expected to be variable on a day-longtime-scale, while Jeffers, Donati & Collier Cameron (2007) haveshown that the polar spot on the K0V star, AB Dor, is variable inextent over periods of years. While G and K stars such as AB Doroften show strong polar caps, no such features were seen on theM1–M2 dwarf stars HK Aqr and RE 1816+541 (Barnes & CollierCameron 2001). This change in starspot location (i.e. with latitude)may be due to a change from a convective-shell-type dynamo toa fully convective dynamo. Predominantly mid-high latitude spotsare expected to arise from a rapidly rotating solar-like dynamo(Schussler et al. 1996; Granzer et al. 2000), while a distributed dy-namo may be expected to produce spots at all latitudes. However,
only further spectroscopic time series observations of FR Cnc, witha higher cadence of observations (enabling better surface resolutionto be obtained), would reveal the long-term stability of the starspotpatterns.
8 SU M M A RY A N D C O N C L U S I O N S
We have carried out a photometric, polarimetric and spectroscopicstudy of FR Cnc.
Optical B-band photometry was carried out during 2007 Marchto 2008 February at Terskol Branch of the Astronomy Institute(Russia). There are no peculiar features in the 2008 light curve,while in the 2007 photometry two brightening episodes were de-tected. One of them occurred at the same phase as the flare of 2006November 23 (phase = 0.88) and probably indicates that both ofthese events (i.e. the flare on 2006 November 23 and the photo-metric brightening episode) originated from the same long-livingactive region on FR Cnc. The non-detection of any other flares inour photometry except 2006 November 23 implies that FR Cnc hasa low frequency of flares.
We analysed ASAS-3 photometry obtained in 2002–08 in V band.No evidence of flares in ASAS-3 data was found. The profiles ofvariability are different from season to season. The mean magnitudein V band remained the same (Vmean = 10.439 mag) during 2002–08, while the amplitude decreased abruptly in 2005. The proposedinterpretation is a redistribution of spots/spot groups over the surfaceof the star, while the total percentage of the spotted area was assumedto be constant within the error limits. A detailed periodogram studyof the ASAS-3 photometric data enabled us to derive a more accuratevalue for the period of FR Cnc. We find that P = 0.082 65 ±0.000 015 d. In addition, we also presented BV RCIC photometriccalibration of 166 stars in FR Cnc vicinity, whose V magnitude isin the range of 9.85–18.06 mag.
C© 2012 The Authors, MNRAS 421, 132–148Monthly Notices of the Royal Astronomical Society C© 2012 RAS
at Universidad C
omplutense de M
adrid on February 9, 2016http://m
nras.oxfordjournals.org/D
ownloaded from

146 A. Golovin et al.
Figure 20. Photometric light curves calculated from the surface mapsand superimposed on ASAS-3 light curve for corresponding season ofobservations.
The BV R broad-band polarimetric observations of FR Cnc havebeen obtained at ARIES in Nainital (India) at Manora Peak. Theobserved polarization in B band is well matched with the theo-retical values expected for Zeeman polarization model. However,the observed polarization in V and R bands slightly exceeds thetheoretical values, and Thompson and Rayleigh scattering frominhomogeneous regions are not enough to explain the observed po-larization excess. Therefore, the excess of linear polarization shouldcome from an additional source of polarization. Taking into accountthat we conclude that FR Cnc is not a binary, the mechanism whichcan produce additional linear polarization is probably scattering incircumstellar material distributed in an asymmetric geometry (e.g.see Pandey et al. 2009).
A total of 58 spectra of FR Cnc, which have been obtained in2004–08, were analysed in this work. Based on our spectroscopicobservations, FR Cnc was classified as K7V star. RV analysis sup-ports the single nature of FR Cnc. Anticorrelation between BIS andRV also indicates that the RV variations are due to stellar activityvariations and not due to a secondary companion.
The kinematics study, based on obtained galactic space-velocitycomponents (U,V , W ) of FR Cnc, shows that this star clearly liesin the young disc population velocity space and might also belongto IC 2391 MG, although the Eggen kinematic criteria show that FRCnc may not be a member of any MG in the young disc area. The Li I
λ6707.8 averaged EW measured is 34 mÅ, giving the spectral type
of FR Cnc; it is in agreement with being a young object between 10and 120 Myr.
The Hα line was always observed above the continuum in all theobtained spectra. Measuring the EW of this line, we found that theHα emission EW average in every season is quite different. In 2004,as with the photometry, spectroscopic indicators of chromosphericactivity show a high level of activity which decreased in 2005.The Ca II (IRT) is included in our echelle spectra. From the ratioof excess emission EW, we found that in FR Cnc, Ca II emissioncomes from plage-like regions. We noted that FR Cnc can show anactivity cycle of 4–5 yr, although further follow-up will confirm thisperiodicity.
Since FR Cnc is a rapid rotator, we generated an indirect starspotmap using the Doppler Tomography of Stars imaging code. Fromit, we derive v sin i = 46.2 ± 0.8 km s−1 and i = 55◦ ± 5◦. FR Cncbelongs to one of the latest spectral types to have been imaged withthe Doppler tomography.
We independently estimated a rotational velocity of FR Cnc dur-ing our observations using Queloz method (Section 5.3) and by theD.I. fits (Section 7). Although they are differences in the results ofthe two methods, they are consistent. In Table 7, we have put as therotational velocity of FR Cnc, the value obtained in the D.I. as it islikely more accurate.
Despite the short rotation period and its late spectral type, FRCnc shows very few flare events. It shows high level of activityas it is a young star, but an unusually short variability due to theredistribution of activity features on the stellar surface. While thisvariability is reflected in the changes of the amplitude of brightness,the mean brightness permanently is nearly constant, indicating thatthe percentage of stellar surface covered by spots is also constant.The spots location is also unusual, not showing a polar spot likeother F–K stars do but a distribution more resembling those seenin M1–M2 dwarfs. Although this may be indicative of a distributeddynamo, the mid-high latitude spot locations are more suggestiveof an interface dynamo under the action of rapid rotation. We canonly speculate as to whether FR Cnc is representative of a regimein which a convective-shell-type dynamo gives way to a fully con-vective dynamo. Polarimetric observations of the magnetic fieldby Donati et al. (2008) and Morin et al. (2008) for example sug-gest that this occurs at a later spectral type of M4, whereas otherchromospheric indicators show no obvious changes until later Mspectral types (e.g. Mohanty & Basri 2003). Further spectroscopywith a higher cadence would enable more detailed maps to be de-rived, with multiple epochs enabling the evolution of starspots tobe investigated.
AC K N OW L E D G M E N T S
AG is thankful to Drs Anju Mukadam and Paula Szkody for use-ful discussions concerning the Fisher randomization test in peri-odogram analysis, to Dr Andras Holl (Konkoly Observatory, Bu-dapest, Hungary) for valuable comments on VOTable format andhelp with converting photometric sequence to it in order to align onDSS image in ALADIN, to Nick Malygin and Dr Ludmila Pakuliakfor useful discussions and proofreading of the manuscript.
MCG acknowledges the financial support from the EuropeanCommission in the form of Marie Curie Intra European Fellow-ship (PIEF-GA-2008-220679) and the partial support by the Span-ish MICINN under the Consolider-Ingenio 2010 Programme grantCSD2006-00070: First Science with the GTC (http://www.iac.es/consolider-ingenio-gtc). MCG and JRB have also received sup-port from RoPACS during this research, a Marie Curie Initial
C© 2012 The Authors, MNRAS 421, 132–148Monthly Notices of the Royal Astronomical Society C© 2012 RAS
at Universidad C
omplutense de M
adrid on February 9, 2016http://m
nras.oxfordjournals.org/D
ownloaded from

FR Cnc: photometry, polarimetry and spectroscopy 147
Training Network funded by the European Commission’s SeventhFramework Programme. This work was partly supported by theSpanish Ministerio de Ciencia e Innovacion (MICINN), ProgramaNacional de Astronomia y Astrofisica under grants AYA2008-00695and AYA2008-06423-C03-03, and the Comunidad de Madrid underPRICIT project S2009/ESP-1496 (AstroMadrid). AG is thankful toUniversidad Complutense de Madrid for hospitality and for all theefforts and the help during his visit to Spain in 2008 July and 2009February.
This publication made use of the ALADIN interactive sky atlas,operated at CDS, Strasbourg, France (Bonnarel et al. 2000) and ofNASA’s Astrophysics Data System.
R E F E R E N C E S
Alekseev I. Y., 2003, Astron. Rep., 47, 430Antoja T., Figueras F., Fernandez D., Torra J., 2008, A&A, 490, 135Arevalo M. J., Lazaro C., 1999, AJ, 118, 1015Baliunas S. L., Nesme-Ribes E., Sokoloff D., Soon W. H., 1996, ApJ, 460,
848Barden S. C., 1985, ApJ, 295, 162Barnes J. R., Collier Cameron A., 2001, MNRAS, 326, 950Barnes J. R., Collier Cameron A., Unruh Y. C., Donati J. F., Hussain G. A.
J., 1998, MNRAS, 299, 904Barnes J. R., Cameron A. C., Lister T. A., Pointer G. R., Still M. D., 2005,
MNRAS, 356, 1501Beavers W. I., Eitter J. J., Ketelsen D. A., Oesper D. A., 1979, PASP, 91,
698Bonfils X. et al., 2007, A&A, 474, 293Bonnarel F. et al., 2000, A&AS, 143, 33Breger M. et al., 1993, A&A, 271, 482Breger M. et al., 1999, A&A, 349, 225Buzasi D. L., 1989, PhD thesis, Pennsylvania State Univ.Chester M. M., 1991, PhD thesis, Pennsylvania State Univ.Collier Cameron A., 2001, in Boffin H. M. J., Steeghs D., Cuypers J., eds,
Lecture Notes Phys., Vol. 573, Astrotomography - Indirect ImagingMethods in Observational Astronomy. Springer, Berlin, p. 183
Donati J.-F., Semel M., Carter B., Rees D. E., Collier Cameron A., 1997,MNRAS, 291, 658
Donati J.-F. et al., 2008, MNRAS, 390, 545Dorren J. D., Guinan E. F., Dewarf L. E., 1994, in Caillault J.-P., ed., ASP
Conf. Ser. Vol. 64, Cool Stars, Stellar Systems, and the Sun, Astron.Soc. Pac., San Francisco, p. 399
Eggen O. J., 1984a, AJ, 89, 1358Eggen O. J., 1984b, ApJS, 55, 597Eggen O. J., 1989, PASP, 101, 366Elias N. M., II, Dorren J. D., 1990, AJ, 100, 818Elvis M., Plummer D., Schachter J., Fabbiano G., 1992, ApJS, 80, 257ESA, 1997, ESA SP-1200, The Hipparcos and Tycho Catalogues. ESA
Publications Division, NoordwijkFamaey B., Pont F., Luri X., Udry S., Mayor M., Jorissen A., 2007, A&A,
461, 957Famaey B., Siebert A., Jorissen A., 2008, A&A, 483, 453Favata F., Barbera M., Micela G., Sciortino S., 1993, A&A, 277, 428Fisher R. A., 1935, Design of Experiments. Oliver and Boyd, EdinburghFisher R. A., 1936, J. R. Anthropol. Inst., 66, 57Galvez M. C., Montes D., Fernandez-Figueroa M. J., Lopez-Santiago J.,
De Castro E., Cornide M., 2002, A&A, 389, 524Galvez M. C., Montes D., Fernandez-Figueroa M. J., de Castro E., Cornide
M., 2007, A&A, 472, 587Galvez M. C., Montes D., Fernandez-Figueroa M. J., de Castro E., Cornide
M., 2009, AJ, 137, 3965Golovin A., Pavlenko E., Kuznyetsova Y., Krushevska V., 2007, Inf. Bull.
Var. Stars, 5748, 1Granzer T., Schussler M., Caligari P., Strassmeier K. G., 2000, A&A, 355,
1087
Hall J. C., 1996, PASP, 108, 313Hall J. C., Ramsey L. W., 1992, AJ, 104, 1942Huovelin J., Saar S. H., 1991, ApJ, 374, 319Jeffers S. V., Donati J.-F., Collier Cameron A., 2007, MNRAS, 375, 567Johnson D. R. H., Soderblom D. R., 1987, AJ, 93, 864Kallinger T., Reegen P., Weiss W. W., 2008, A&A, 481, 571Kazarovets E. V., Samus N. N., Durlevich O. V., Frolov M. S., Antipin S.
V., Kireeva N. N., Pastukhova E. N., 1999, Inf. Bull. Var. Stars, 4659, 1Kupka F., Piskunov N., Ryabchikova T. A., Stempels H. C., Weiss W. W.,
1999, A&AS, 138, 119Kupka F. G., Ryabchikova T. A., Piskunov N. E., Stempels H. C., Weiss W.
W., 2000, Baltic Astron., 9, 590Kurucz R. L., 1993, in Dworetsky M. M., Castelli F., Faraggiana R., eds,
ASP Conf. Ser. Vol. 44, Peculiar versus Normal Phenomena in A-typeand Related Stars. Astron. Soc. Pac., San Francisco, p. 87
Kuschnig R., Weiss W. W., Gruber R., Bely P. Y., Jenkner H., 1997, A&A,328, 544
Lenz P., Breger M., 2005, Commun. Asteroseismol., 146, 53Lopez-Santiago J., Micela G., Montes D., 2009, A&A, 499, 129Lopez-Santiago J., Montes D., Galvez-Ortiz M. C., Crespo-Chacon I.,
Martınez-Arnaiz R. M., Fernandez-Figueroa M. J., de Castro E., CornideM., 2010, A&A, 514, A97
Lorente R., Montesinos B., 2005, AJ, 632, 1104Maldonado J., Martınez-Arnaiz R. M., Eiroa C., Montes D., Montesinos B.,
2010, A&A, 521, A12Mamajek E. E., Hillenbrand L. A., 2008, ApJ, 687, 1264Martınez Fiorenzano A. F., Gratton R. G., Desidera S., Cosentino R., Endl
M., 2005, A&A, 442, 775Martınez-Arnaiz R., Maldonado J., Montes D., Eiroa C., Montesinos B.,
2010, A&A, 520, A79Medhi B. J., Maheswar G., Brijesh K., Pandey J. C., Kumar T. S., Sagar R.,
2007, MNRAS, 378, 881Melo C., Pasquini L., de Medeiros J. R., 2004, in Maeder A., Eenens P., eds,
Proc. IAU Symp. 215, Stellar Rotation. Astron. Soc. Pac., San Francisco,p. 455
Mohanty S., Basri G., 2003, ApJ, 583, 451Montes D. et al., 2000, A&AS, 146, 103Montes D., Lopez-Santiago J., Galvez M. C., Fernandez-Figueroa M. J.,
De Castro E., Cornide M., 2001a, MNRAS, 328, 45Montes D., Lopez-Santiago J., Fernandez-Figueroa M. J., Galvez M. C.,
2001b, A&A, 379, 976Montgomery M. H., Odonoghue D., 1999, Delta Scuti Star Newslett., 13,
28Morin J. et al., 2008, MNRAS, 390, 567Noyes R. W., Hartmann L. W., Baliunas S. L., Duncan D. K., Vaughan A.
H., 1984, ApJ, 279, 763O’Neal D., Saar S. H., Neff J. E., 1996, ApJ, 463, 766O’Neal D., Neff J. E., Saar S. H., 1998, ApJ, 507, 919O’Neal D., Neff J. E., Saar S. H., Cuntz M., 2004, AJ, 128, 1802Pandey J. C., 2003, Bull. Astron. Soc. India, 31, 329Pandey J. C., Singh K. P., Sagar R., Drake S. A., 2002, Inf. Bull. Var. Stars,
5351, 1Pandey J. C., Singh K. P., Drake S. A., Sagar R., 2005, AJ, 130, 1231Pandey J. C., Medhi B. J., Sagar R., Pandey A. K., 2009, MNRAS, 396,
1004Pepper J., Stanek K. Z., Pogge R. W., Latham D. W., DePoy D. L., Siverd
R., Poindexter S., Sivakoff G. R., 2008, AJ, 135, 907Perryman M. A. C. et al., 1997, A&A, 323, L49Pojmanski G., 2002, Acta Astron., 52, 397Queloz D., Allain S., Mermilliod J.-C., Bouvier J., Mayor M., 1998, A&A,
335, 183Queloz D. et al., 2001, A&A, 379, 279Saar S. H., Huovelin J., 1993, ApJ, 404, 739Sbordone L., 2005, Mem. Soc. Astron. Ital. Suppl., 8, 61Sbordone L., Bonifacio P., Castelli F., Kurucz R. L., 2004, Mem. Soc.
Astron. Ital. Suppl., 5, 93Schachter J. F., Remillard R., Saar S. H., Favata F., Sciortino S., Barbera
M., 1996, ApJ, 463, 747
C© 2012 The Authors, MNRAS 421, 132–148Monthly Notices of the Royal Astronomical Society C© 2012 RAS
at Universidad C
omplutense de M
adrid on February 9, 2016http://m
nras.oxfordjournals.org/D
ownloaded from

148 A. Golovin et al.
Schmidt G. D., Elston R., Lupie O. L., 1992, AJ, 104, 1563Schussler M., Caligari P., Ferriz-Mas A., Solanki S. K., Stix M., 1996, A&A,
314, 503Tonry J., Davis M., 1979, AJ, 84, 1511Upgren A. R., Sperauskas J., Boyle R. P., 2002, Baltic Astron., 11, 91
Voges W. et al., 1999, A&A, 349, 389Zhao J., Zhao G., Chen Y., 2009, ApJ, 692, L113
This paper has been typeset from a TEX/LATEX file prepared by the author.
C© 2012 The Authors, MNRAS 421, 132–148Monthly Notices of the Royal Astronomical Society C© 2012 RAS
at Universidad C
omplutense de M
adrid on February 9, 2016http://m
nras.oxfordjournals.org/D
ownloaded from