Embed Size (px)
Citation preview
1Experience / Expertise / Excellence
Taylor RobinsonPresident, PLG Consulting
January 11, 2018
Transportation and
Logistics
Frac Sand Update
2Experience / Expertise / Excellence www.plgconsulting.com
Partial Client List
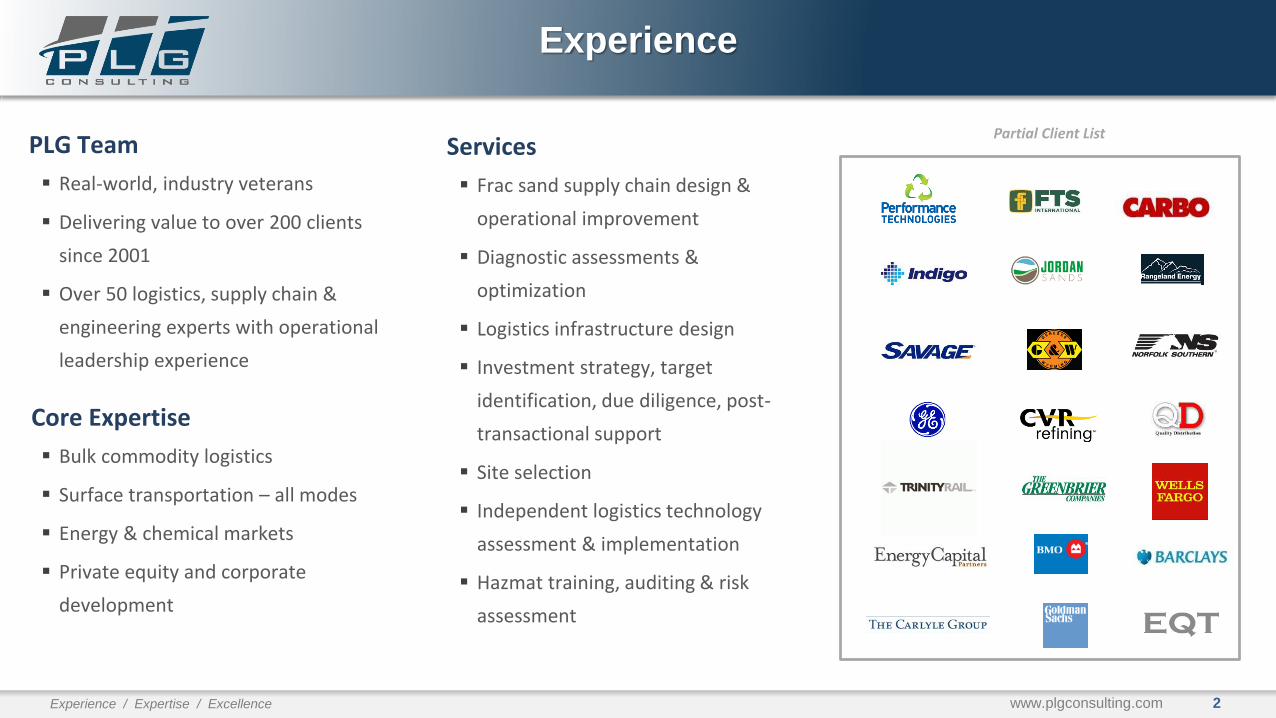
Experience
PLG Team
▪ Real-world, industry veterans
▪ Delivering value to over 200 clients
since 2001
▪ Over 50 logistics, supply chain &
engineering experts with operational
leadership experience
Core Expertise
▪ Bulk commodity logistics
▪ Surface transportation – all modes
▪ Energy & chemical markets
▪ Private equity and corporate
development
Services
▪ Frac sand supply chain design &
operational improvement
▪ Diagnostic assessments &
optimization
▪ Logistics infrastructure design
▪ Investment strategy, target
identification, due diligence, post-
transactional support
▪ Site selection
▪ Independent logistics technology
assessment & implementation
▪ Hazmat training, auditing & risk
assessment
3Experience / Expertise / Excellence
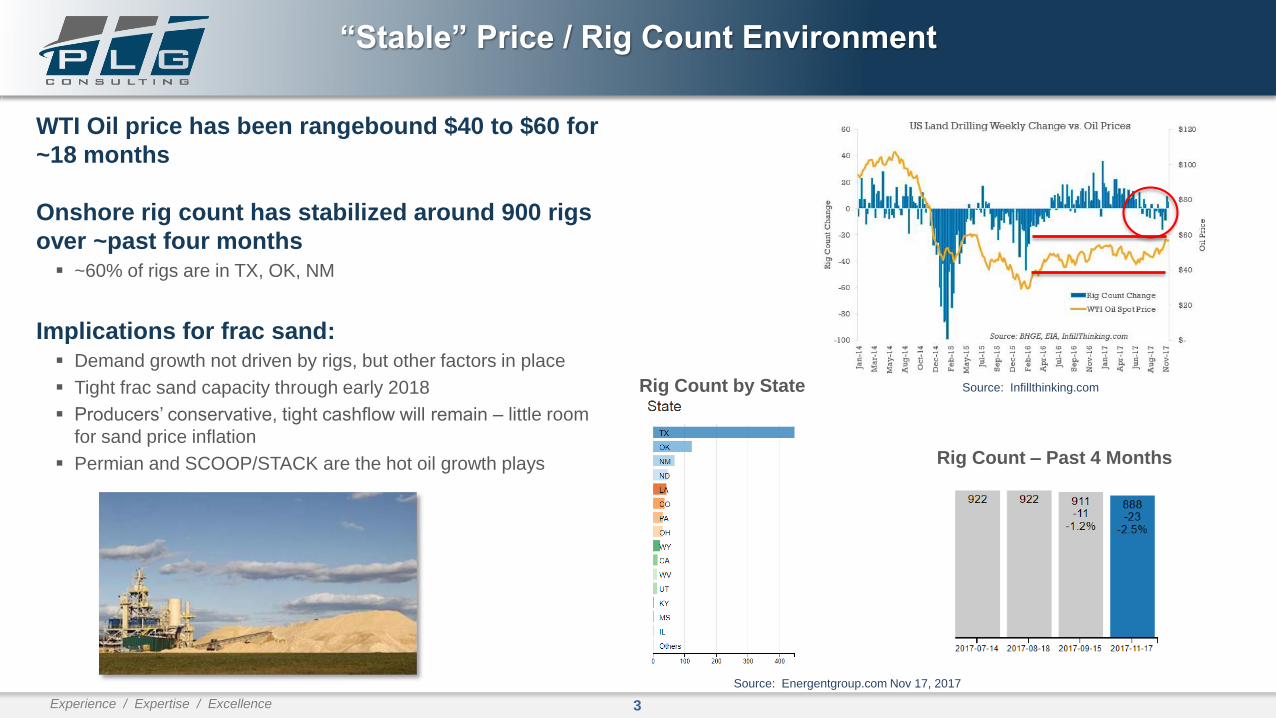
“Stable” Price / Rig Count Environment
WTI Oil price has been rangebound $40 to $60 for
~18 months
Onshore rig count has stabilized around 900 rigs
over ~past four months▪ ~60% of rigs are in TX, OK, NM
Implications for frac sand:▪ Demand growth not driven by rigs, but other factors in place
▪ Tight frac sand capacity through early 2018
▪ Producers’ conservative, tight cashflow will remain – little room
for sand price inflation
▪ Permian and SCOOP/STACK are the hot oil growth plays
Source: Infillthinking.com
Source: Energentgroup.com Nov 17, 2017
Rig Count by State
Rig Count – Past 4 Months
4Experience / Expertise / Excellence
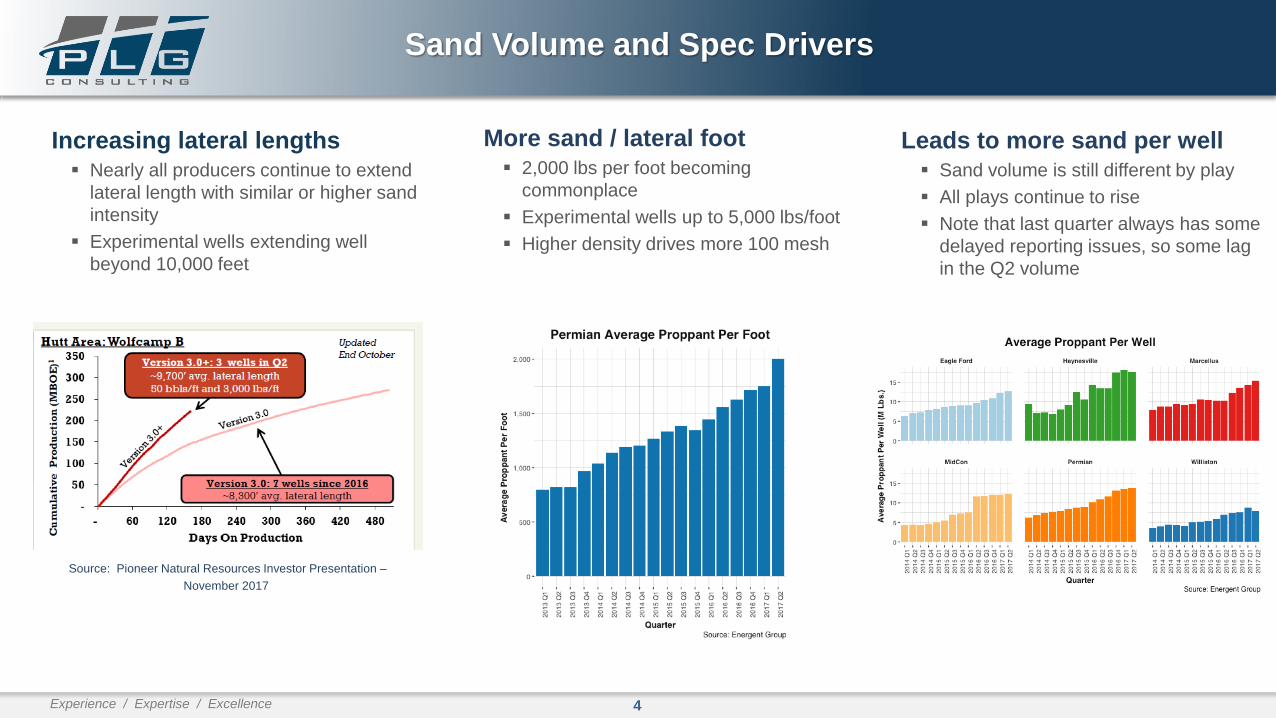
Sand Volume and Spec Drivers
Increasing lateral lengths▪ Nearly all producers continue to extend
lateral length with similar or higher sand
intensity
▪ Experimental wells extending well
beyond 10,000 feet
Source: Pioneer Natural Resources Investor Presentation –
November 2017
More sand / lateral foot▪ 2,000 lbs per foot becoming
commonplace
▪ Experimental wells up to 5,000 lbs/foot
▪ Higher density drives more 100 mesh
Leads to more sand per well▪ Sand volume is still different by play
▪ All plays continue to rise
▪ Note that last quarter always has some
delayed reporting issues, so some lag
in the Q2 volume
5Experience / Expertise / Excellence
Source: Infillthinking.com
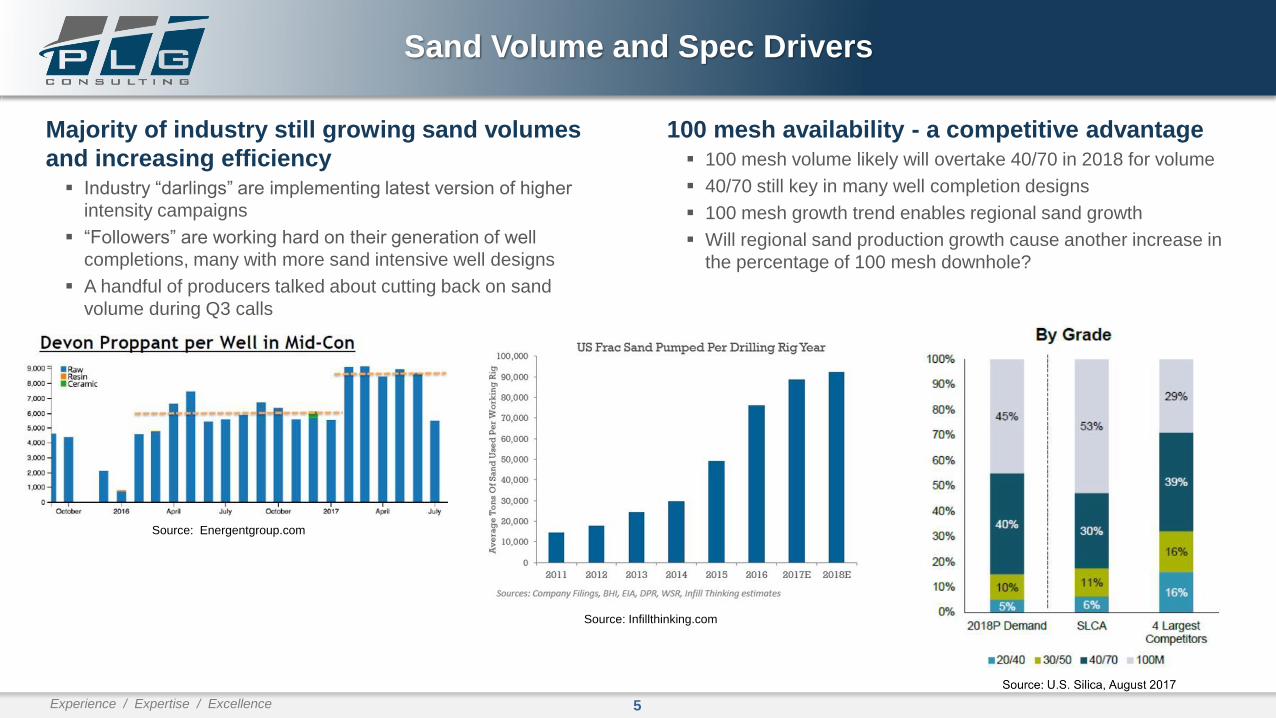
Sand Volume and Spec Drivers
Majority of industry still growing sand volumes
and increasing efficiency▪ Industry “darlings” are implementing latest version of higher
intensity campaigns
▪ “Followers” are working hard on their generation of well
completions, many with more sand intensive well designs
▪ A handful of producers talked about cutting back on sand
volume during Q3 calls
Source: Energentgroup.com
100 mesh availability - a competitive advantage▪ 100 mesh volume likely will overtake 40/70 in 2018 for volume
▪ 40/70 still key in many well completion designs
▪ 100 mesh growth trend enables regional sand growth
▪ Will regional sand production growth cause another increase in
the percentage of 100 mesh downhole?
6Experience / Expertise / Excellence
Frac Sand Supply Chain Overview
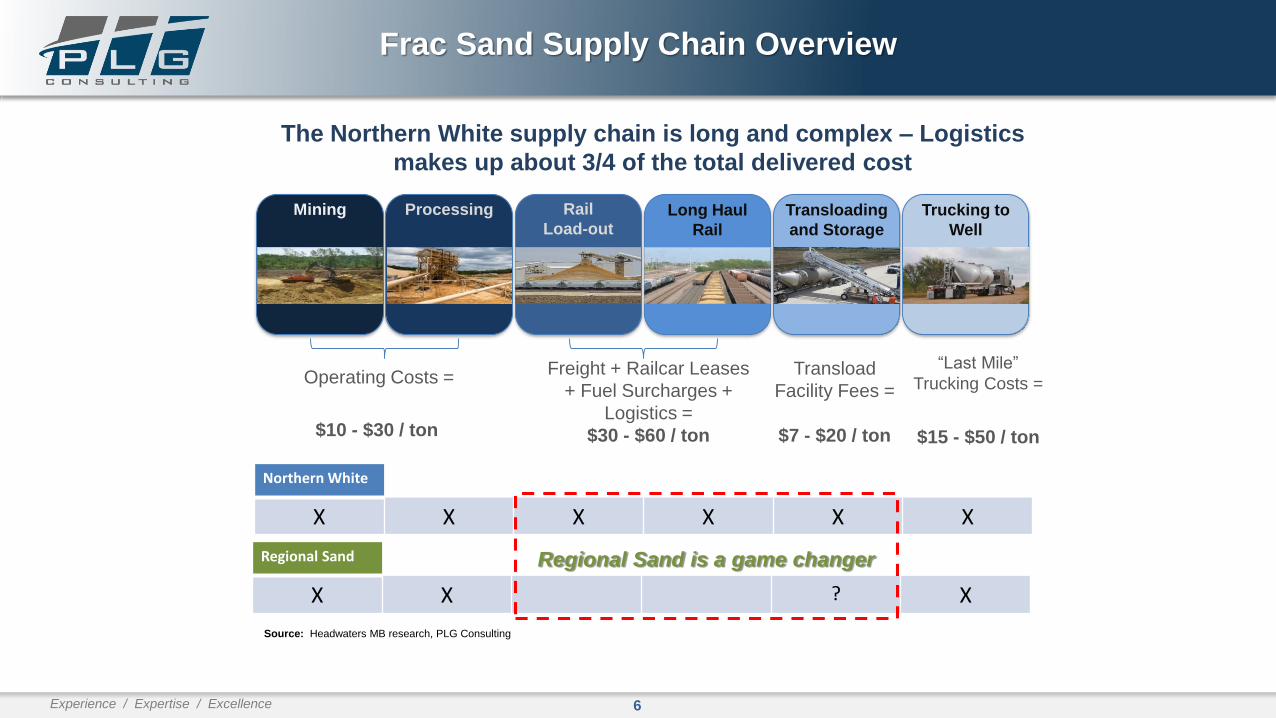
Source: Headwaters MB research, PLG Consulting
The Northern White supply chain is long and complex – Logistics
makes up about 3/4 of the total delivered cost
Operating Costs =
$10 - $30 / ton
Transload
Facility Fees =
$7 - $20 / ton
Freight + Railcar Leases
+ Fuel Surcharges +
Logistics =
$30 - $60 / ton
“Last Mile”
Trucking Costs =
$15 - $50 / ton
Mining Processing Rail
Load-outLong Haul
Rail
Transloading
and Storage
Trucking to
Well
Northern White
X X X X X X
Regional Sand
X X ? X
Regional Sand is a game changer
7Experience / Expertise / Excellence
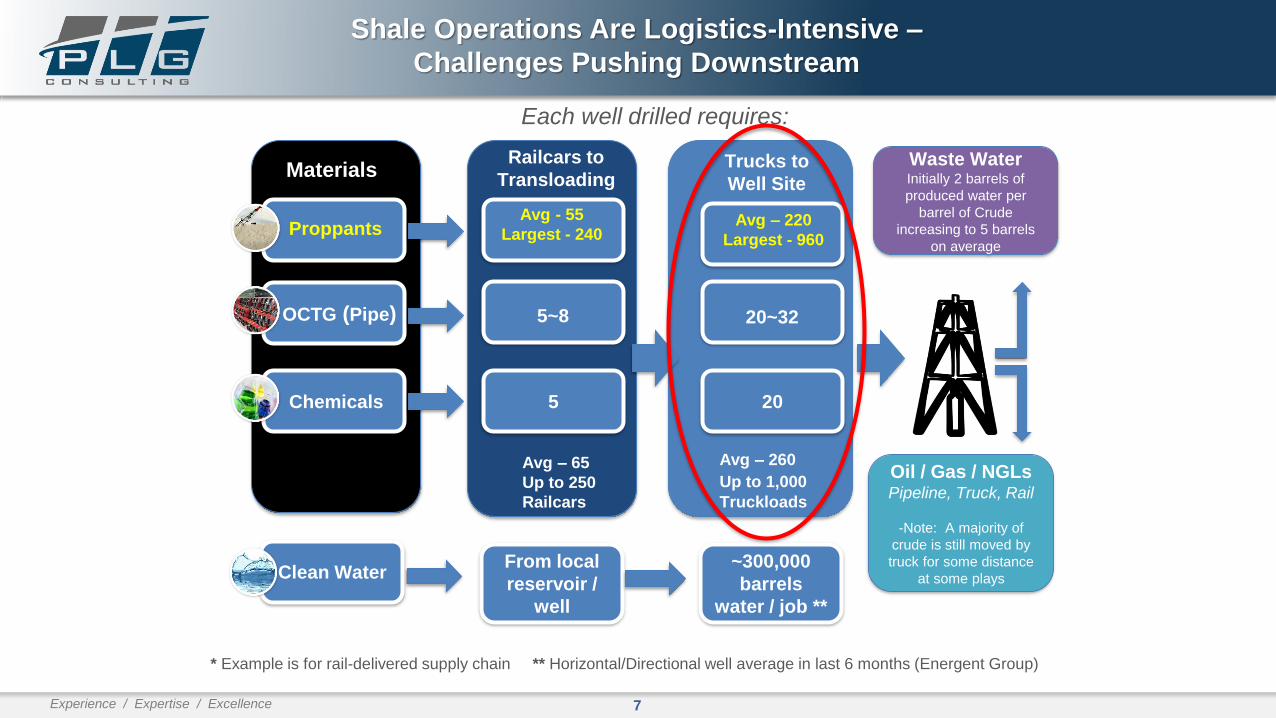
Materials
Chemicals
Clean Water
Proppants
OCTG (Pipe)
Railcars to
Transloading
5
From local
reservoir /
well
Avg - 55
Largest - 240
5~8
Trucks to
Well Site
20
~300,000
barrels
water / job **
Avg – 220
Largest - 960
20~32
Avg – 260
Up to 1,000
Truckloads
Oil / Gas / NGLsPipeline, Truck, Rail
-Note: A majority of
crude is still moved by
truck for some distance
at some plays
Waste Water Initially 2 barrels of
produced water per
barrel of Crude
increasing to 5 barrels
on average
Avg – 65
Up to 250
Railcars
* Example is for rail-delivered supply chain ** Horizontal/Directional well average in last 6 months (Energent Group)
Each well drilled requires:
Shale Operations Are Logistics-Intensive –
Challenges Pushing Downstream
8Experience / Expertise / Excellence
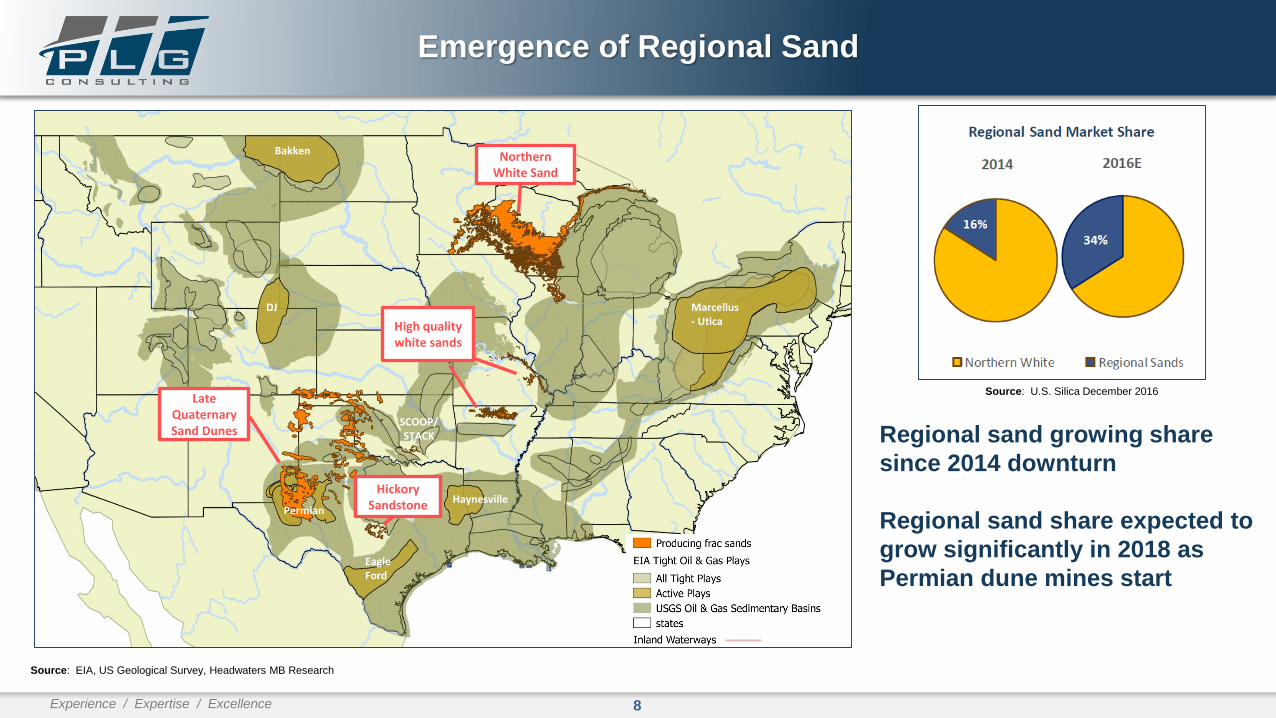
Emergence of Regional Sand
Regional sand growing share
since 2014 downturn
Regional sand share expected to
grow significantly in 2018 as
Permian dune mines start
Source: EIA, US Geological Survey, Headwaters MB Research
Northern White Sand
High quality white sands
Late Quaternary Sand Dunes
Hickory Sandstone Haynesville
Eagle Ford
Permian
DJ
Bakken
Marcellus - Utica
SCOOP/STACK
Source: U.S. Silica December 2016
9Experience / Expertise / Excellence
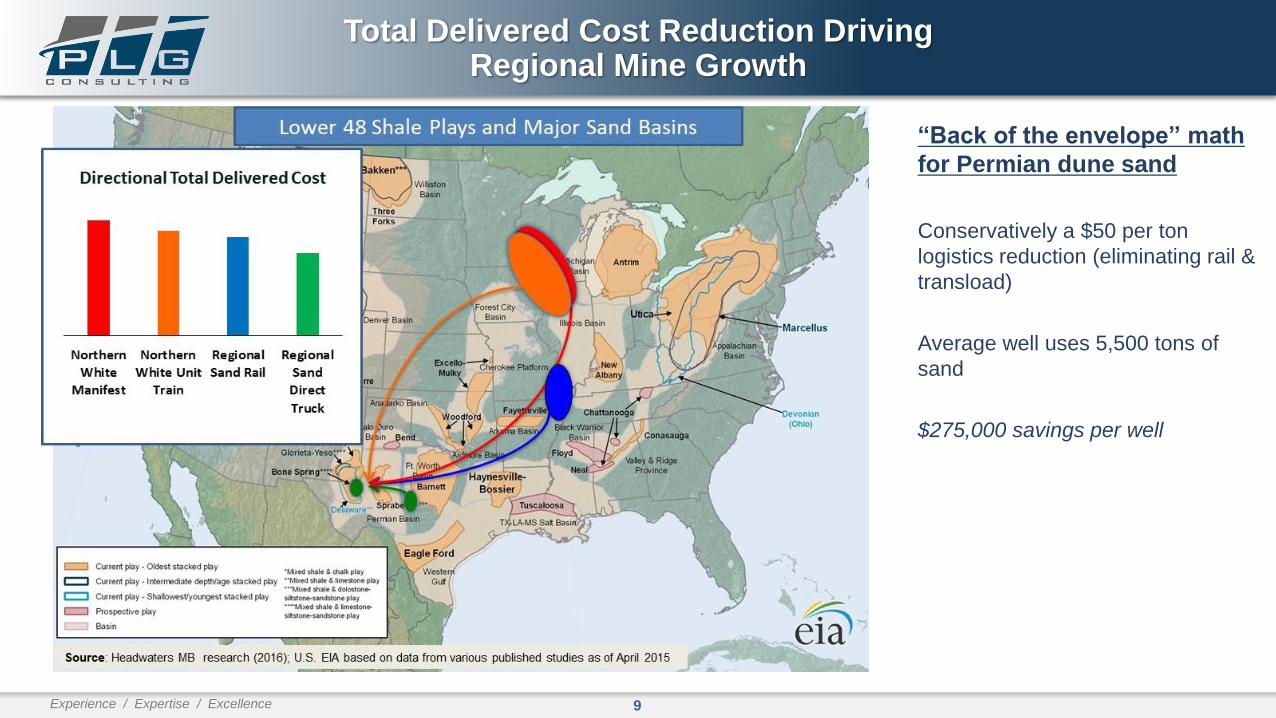
Total Delivered Cost Reduction Driving Regional Mine Growth
“Back of the envelope” math
for Permian dune sand
Conservatively a $50 per ton
logistics reduction (eliminating rail &
transload)
Average well uses 5,500 tons of
sand
$275,000 savings per well
10Experience / Expertise / Excellence
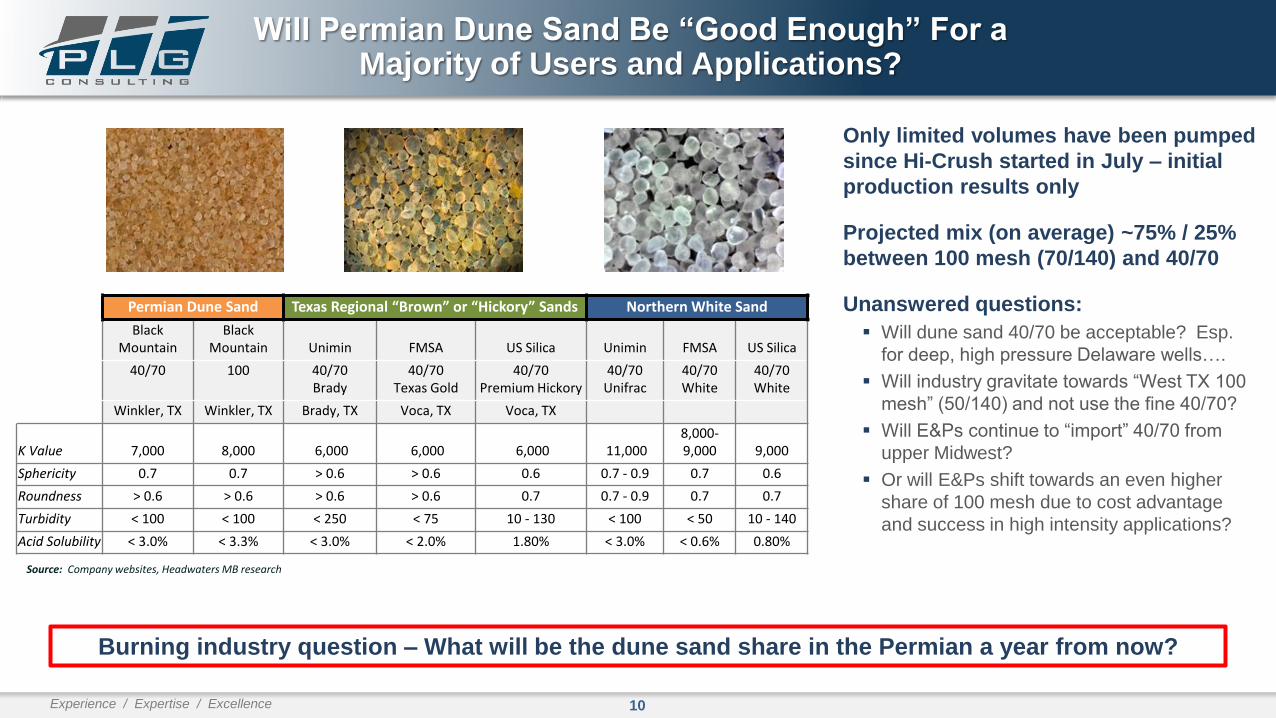
Will Permian Dune Sand Be “Good Enough” For a Majority of Users and Applications?
Source: Company websites, Headwaters MB research
Permian Dune Sand Texas Regional “Brown” or “Hickory” Sands Northern White Sand
Black Mountain
Black Mountain Unimin FMSA US Silica Unimin FMSA US Silica
40/70 100 40/70 Brady
40/70 Texas Gold
40/70 Premium Hickory
40/70 Unifrac
40/70 White
40/70 White
Winkler, TX Winkler, TX Brady, TX Voca, TX Voca, TX
K Value 7,000 8,000 6,000 6,000 6,000 11,000 8,000-9,000 9,000
Sphericity 0.7 0.7 > 0.6 > 0.6 0.6 0.7 - 0.9 0.7 0.6
Roundness > 0.6 > 0.6 > 0.6 > 0.6 0.7 0.7 - 0.9 0.7 0.7
Turbidity < 100 < 100 < 250 < 75 10 - 130 < 100 < 50 10 - 140
Acid Solubility < 3.0% < 3.3% < 3.0% < 2.0% 1.80% < 3.0% < 0.6% 0.80%
Only limited volumes have been pumped
since Hi-Crush started in July – initial
production results only
Projected mix (on average) ~75% / 25%
between 100 mesh (70/140) and 40/70
Unanswered questions:
▪ Will dune sand 40/70 be acceptable? Esp.
for deep, high pressure Delaware wells….
▪ Will industry gravitate towards “West TX 100
mesh” (50/140) and not use the fine 40/70?
▪ Will E&Ps continue to “import” 40/70 from
upper Midwest?
▪ Or will E&Ps shift towards an even higher
share of 100 mesh due to cost advantage
and success in high intensity applications?
Burning industry question – What will be the dune sand share in the Permian a year from now?
11Experience / Expertise / Excellence
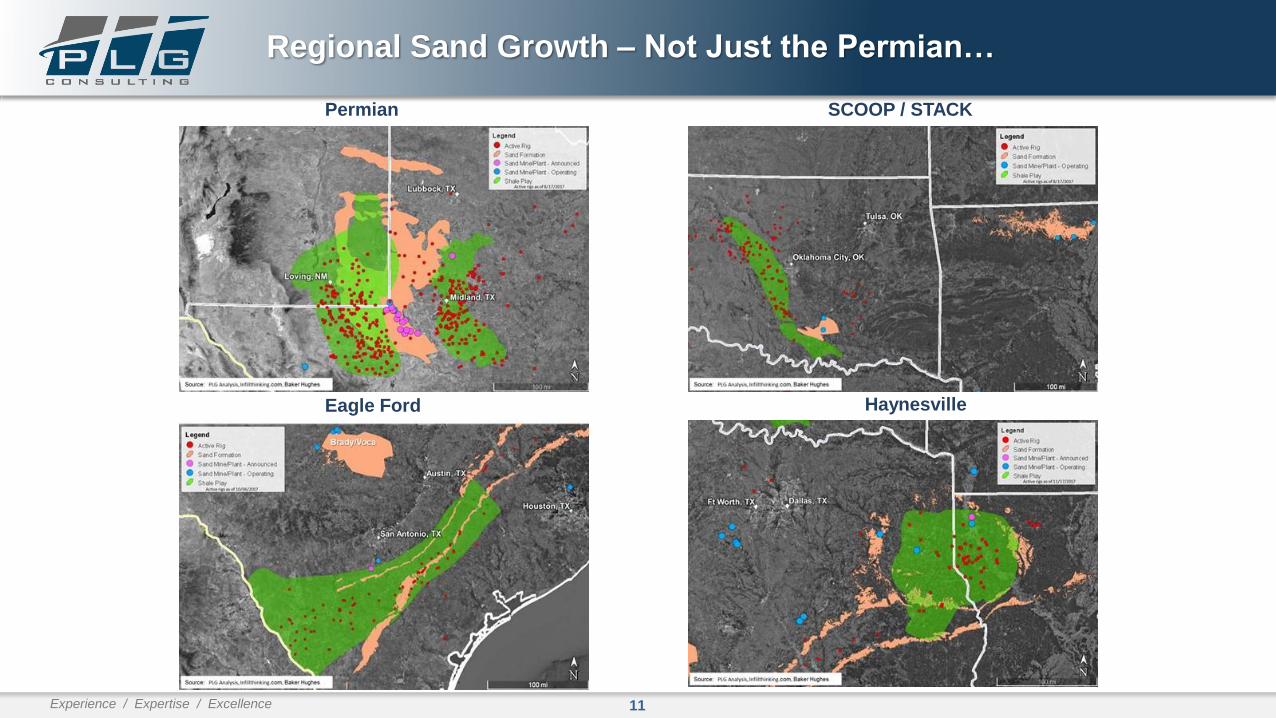
Regional Sand Growth – Not Just the Permian…
Eagle Ford
Permian SCOOP / STACK
Haynesville
12Experience / Expertise / Excellence
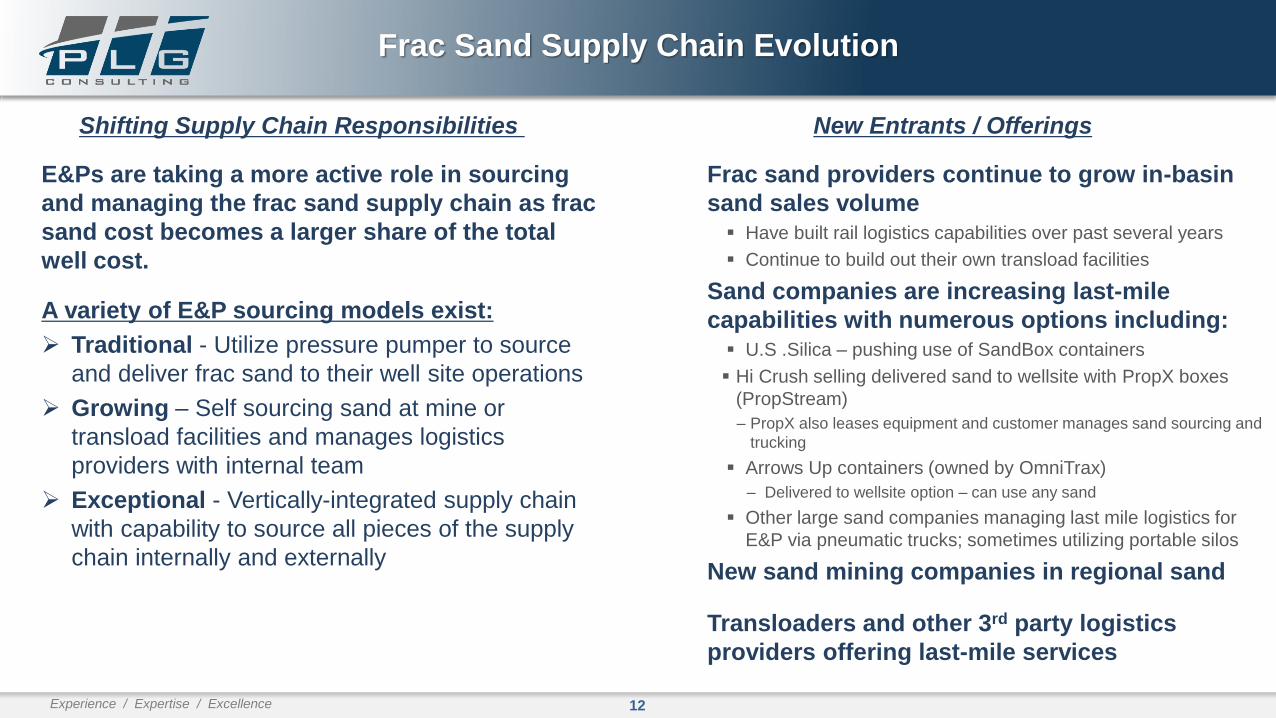
Frac Sand Supply Chain Evolution
E&Ps are taking a more active role in sourcing
and managing the frac sand supply chain as frac
sand cost becomes a larger share of the total
well cost.
A variety of E&P sourcing models exist:
➢ Traditional - Utilize pressure pumper to source
and deliver frac sand to their well site operations
➢ Growing – Self sourcing sand at mine or
transload facilities and manages logistics
providers with internal team
➢ Exceptional - Vertically-integrated supply chain
with capability to source all pieces of the supply
chain internally and externally
New Entrants / OfferingsShifting Supply Chain Responsibilities
Frac sand providers continue to grow in-basin
sand sales volume▪ Have built rail logistics capabilities over past several years
▪ Continue to build out their own transload facilities
Sand companies are increasing last-mile
capabilities with numerous options including:▪ U.S .Silica – pushing use of SandBox containers
▪ Hi Crush selling delivered sand to wellsite with PropX boxes
(PropStream)
‒ PropX also leases equipment and customer manages sand sourcing and
trucking
▪ Arrows Up containers (owned by OmniTrax)
‒ Delivered to wellsite option – can use any sand
▪ Other large sand companies managing last mile logistics for
E&P via pneumatic trucks; sometimes utilizing portable silos
New sand mining companies in regional sand
Transloaders and other 3rd party logistics
providers offering last-mile services
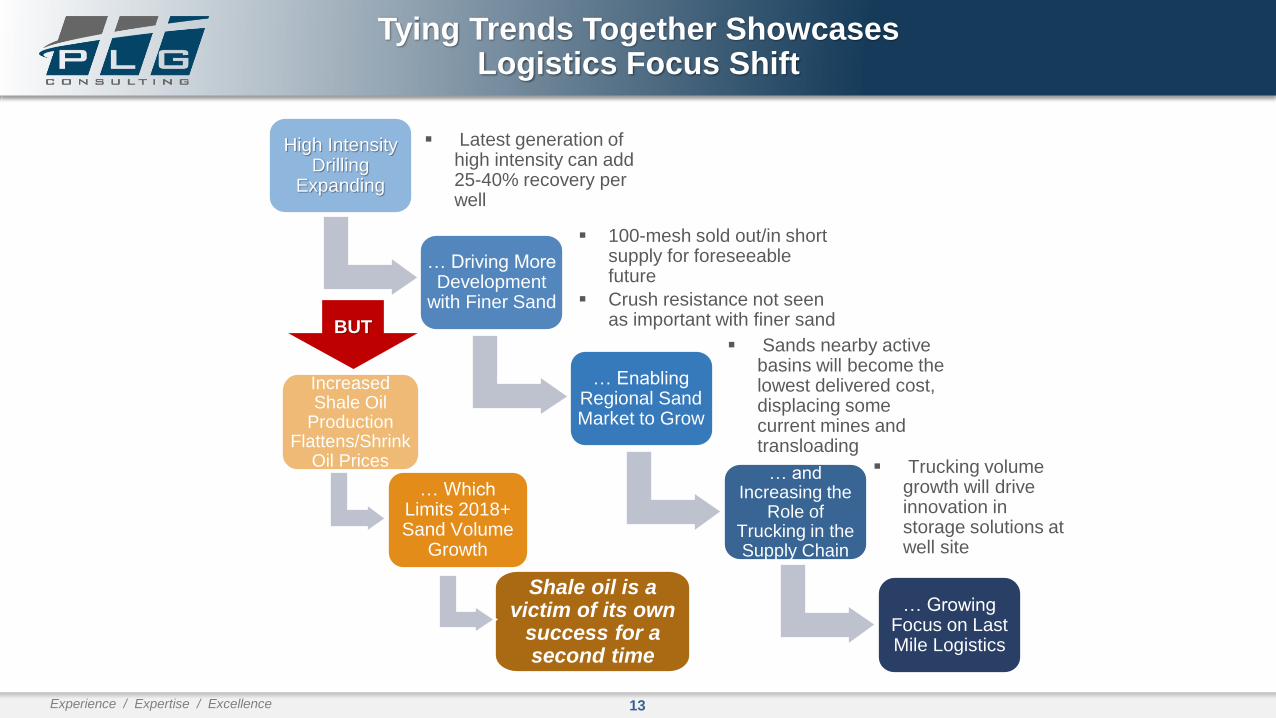
13Experience / Expertise / Excellence
High Intensity Drilling
Expanding
… Driving More Development
with Finer Sand
… Enabling Regional Sand Market to Grow
… and Increasing the
Role of Trucking in the Supply Chain
▪ Latest generation of high intensity can add 25-40% recovery per well
▪ Sands nearby active basins will become the lowest delivered cost, displacing some current mines and transloading
▪ Trucking volume growth will drive innovation in storage solutions at well site
… Growing Focus on Last Mile Logistics
▪ 100-mesh sold out/in short supply for foreseeable future
▪ Crush resistance not seen as important with finer sand
Increased Shale Oil
Production Flattens/Shrink
Oil Prices
… Which Limits 2018+ Sand Volume
Growth
Shale oil is a victim of its own
success for a second time
BUT
Tying Trends Together Showcases Logistics Focus Shift
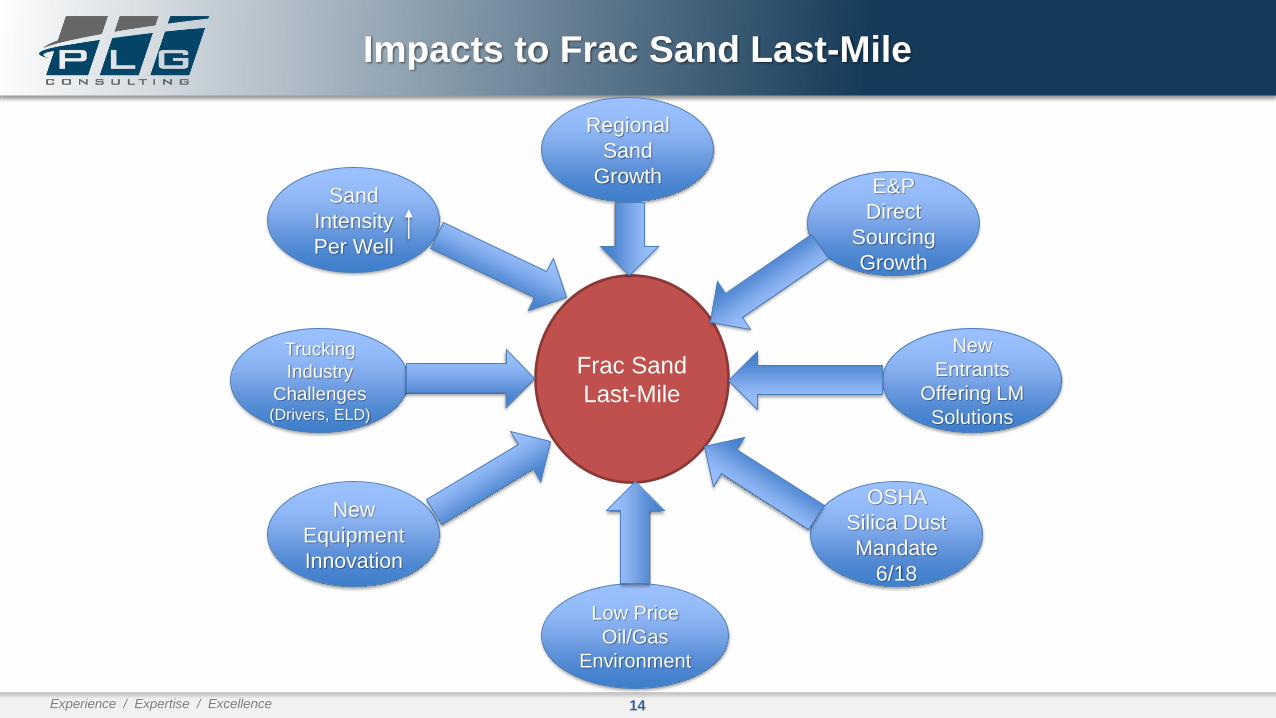
14Experience / Expertise / Excellence
Impacts to Frac Sand Last-Mile
Sand
Intensity
Per Well
Regional
Sand
Growth
Trucking
Industry
Challenges (Drivers, ELD)
New
Equipment
Innovation
New
Entrants
Offering LM
Solutions
E&P
Direct
Sourcing
Growth
OSHA
Silica Dust
Mandate
6/18
Low Price
Oil/Gas
Environment
Frac Sand
Last-Mile
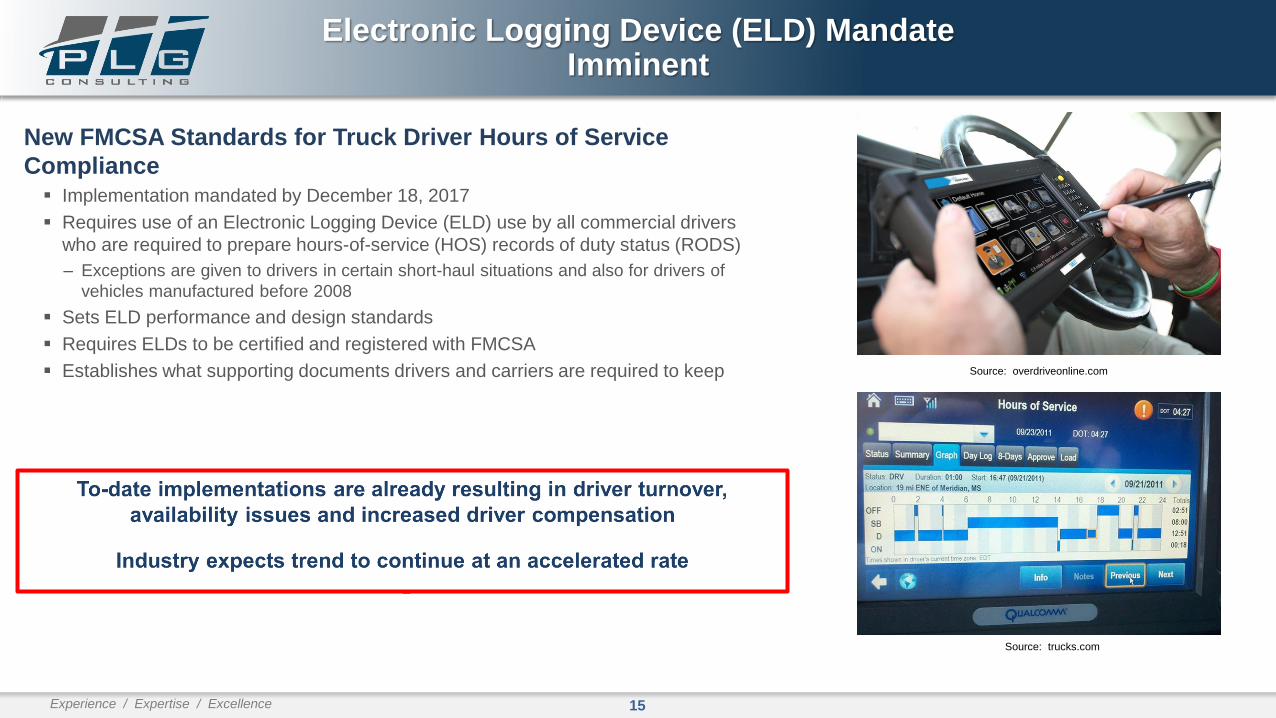
15Experience / Expertise / Excellence
New FMCSA Standards for Truck Driver Hours of Service
Compliance▪ Implementation mandated by December 18, 2017
▪ Requires use of an Electronic Logging Device (ELD) use by all commercial drivers
who are required to prepare hours-of-service (HOS) records of duty status (RODS)
‒ Exceptions are given to drivers in certain short-haul situations and also for drivers of
vehicles manufactured before 2008
▪ Sets ELD performance and design standards
▪ Requires ELDs to be certified and registered with FMCSA
▪ Establishes what supporting documents drivers and carriers are required to keep Source: overdriveonline.com
Electronic Logging Device (ELD) Mandate Imminent
Source: trucks.com
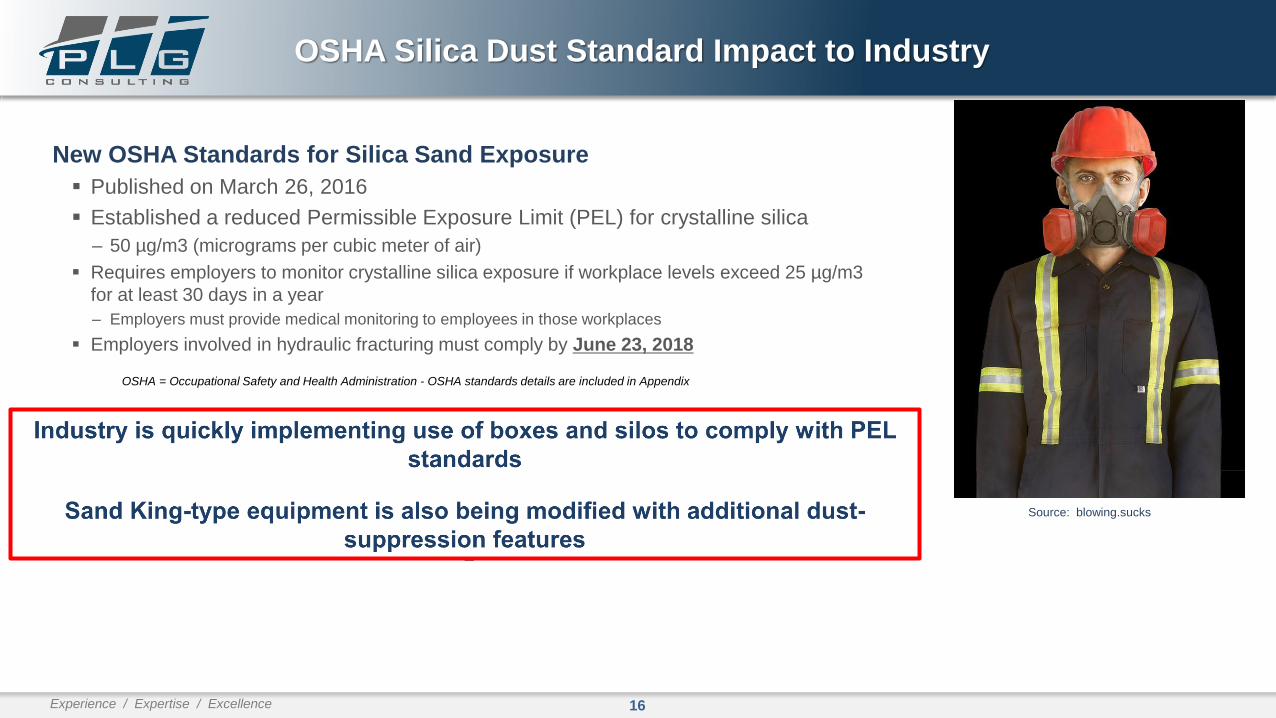
16Experience / Expertise / Excellence
OSHA Silica Dust Standard Impact to Industry
New OSHA Standards for Silica Sand Exposure
▪ Published on March 26, 2016
▪ Established a reduced Permissible Exposure Limit (PEL) for crystalline silica
‒ 50 µg/m3 (micrograms per cubic meter of air)
▪ Requires employers to monitor crystalline silica exposure if workplace levels exceed 25 µg/m3
for at least 30 days in a year
‒ Employers must provide medical monitoring to employees in those workplaces
▪ Employers involved in hydraulic fracturing must comply by June 23, 2018
OSHA = Occupational Safety and Health Administration - OSHA standards details are included in Appendix
Source: blowing.sucks
17Experience / Expertise / Excellence
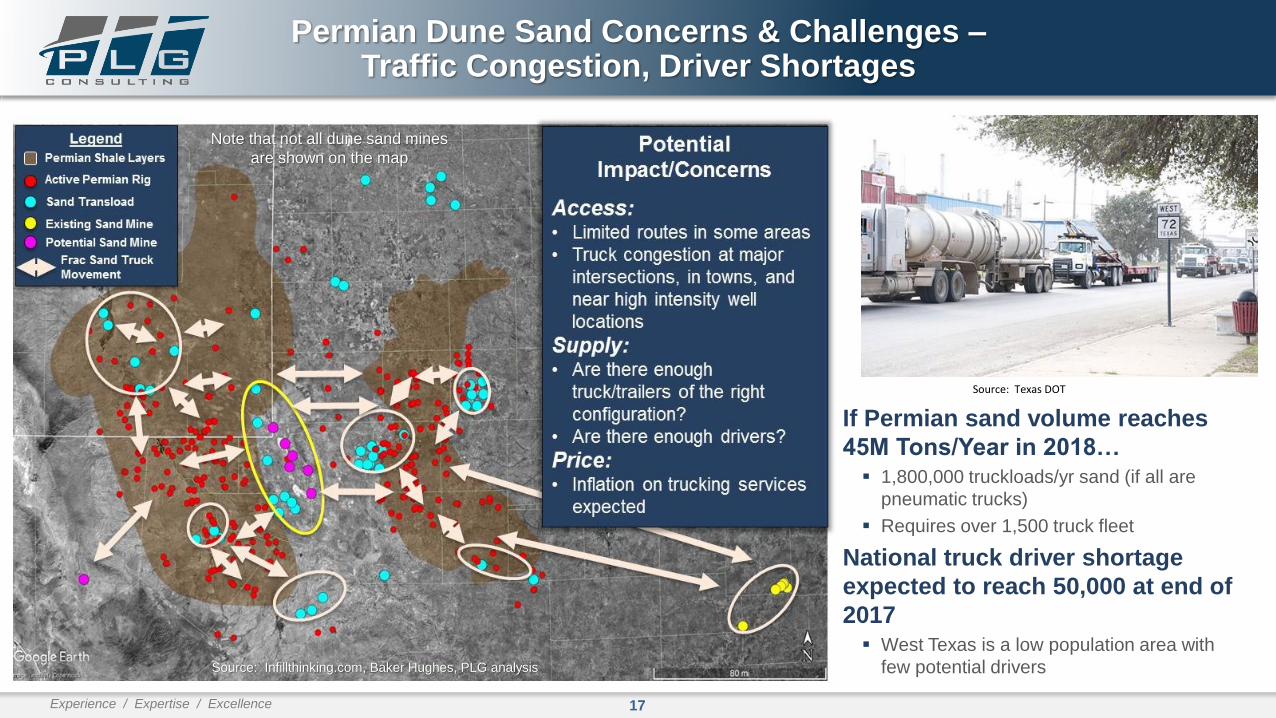
Permian Dune Sand Concerns & Challenges –Traffic Congestion, Driver Shortages
If Permian sand volume reaches
45M Tons/Year in 2018…▪ 1,800,000 truckloads/yr sand (if all are
pneumatic trucks)
▪ Requires over 1,500 truck fleet
National truck driver shortage
expected to reach 50,000 at end of
2017▪ West Texas is a low population area with
few potential drivers
Source: Texas DOT
Source: Infillthinking.com, Baker Hughes, PLG analysis
Note that not all dune sand mines
are shown on the map
18Experience / Expertise / Excellence
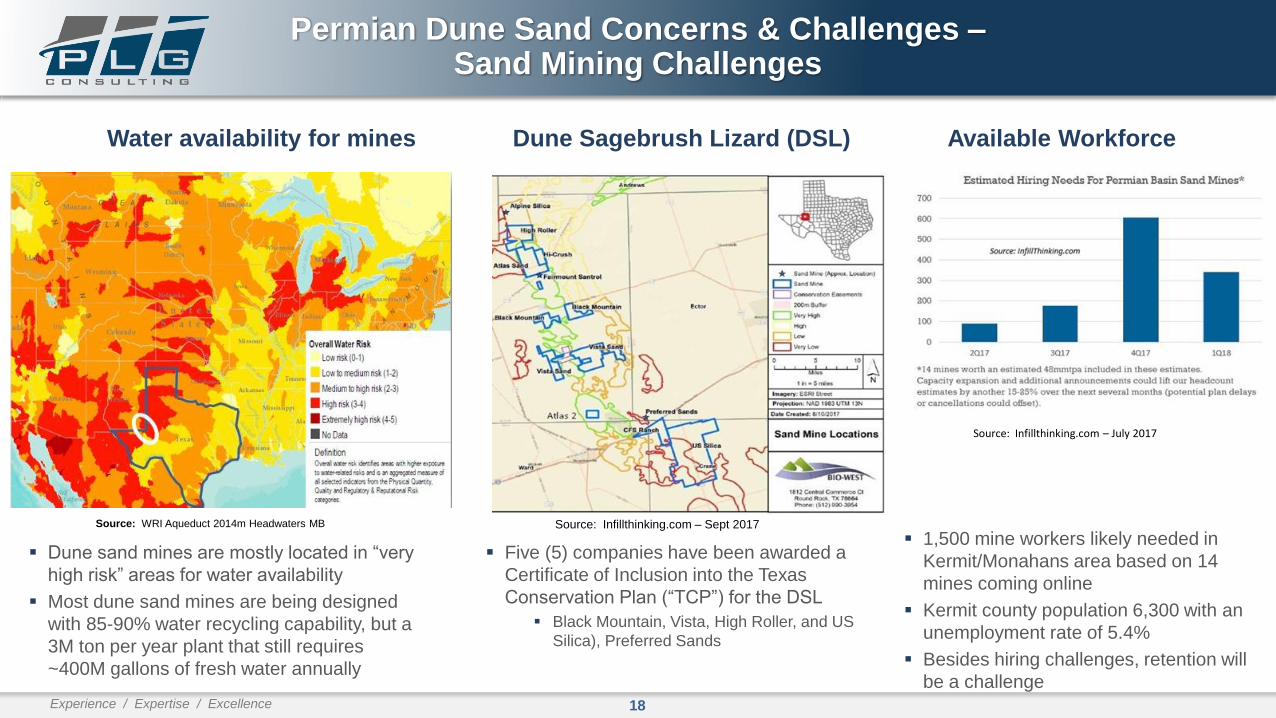
Source: WRI Aqueduct 2014m Headwaters MB
Water availability for mines Dune Sagebrush Lizard (DSL)
Source: Infillthinking.com – Sept 2017
Source: Infillthinking.com – July 2017
Permian Dune Sand Concerns & Challenges –Sand Mining Challenges
Available Workforce
▪ Dune sand mines are mostly located in “very
high risk” areas for water availability
▪ Most dune sand mines are being designed
with 85-90% water recycling capability, but a
3M ton per year plant that still requires
~400M gallons of fresh water annually
▪ Five (5) companies have been awarded a
Certificate of Inclusion into the Texas
Conservation Plan (“TCP”) for the DSL
▪ Black Mountain, Vista, High Roller, and US
Silica), Preferred Sands
▪ 1,500 mine workers likely needed in
Kermit/Monahans area based on 14
mines coming online
▪ Kermit county population 6,300 with an
unemployment rate of 5.4%
▪ Besides hiring challenges, retention will
be a challenge
19Experience / Expertise / Excellence
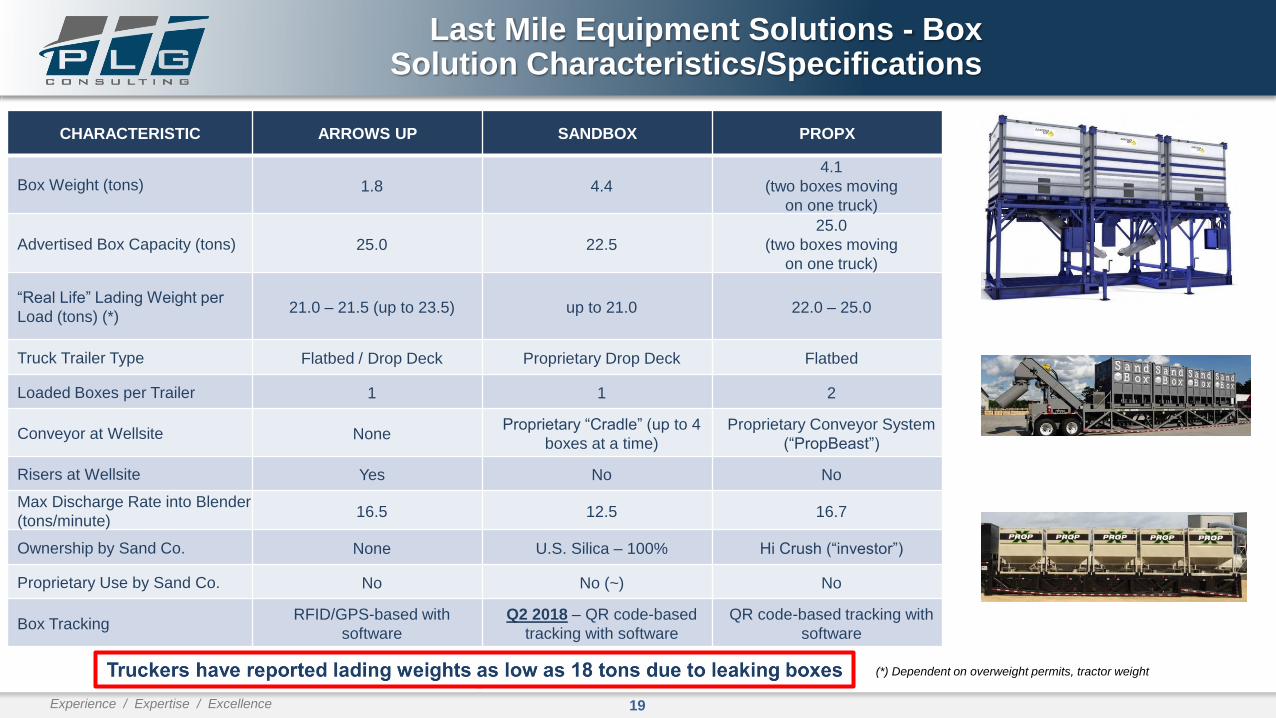
Last Mile Equipment Solutions - Box Solution Characteristics/Specifications
CHARACTERISTIC ARROWS UP SANDBOX PROPX
Box Weight (tons) 1.8 4.4
4.1
(two boxes moving
on one truck)
Advertised Box Capacity (tons) 25.0 22.5
25.0
(two boxes moving
on one truck)
“Real Life” Lading Weight per
Load (tons) (*)21.0 – 21.5 (up to 23.5) up to 21.0 22.0 – 25.0
Truck Trailer Type Flatbed / Drop Deck Proprietary Drop Deck Flatbed
Loaded Boxes per Trailer 1 1 2
Conveyor at Wellsite NoneProprietary “Cradle” (up to 4
boxes at a time)
Proprietary Conveyor System
(“PropBeast”)
Risers at Wellsite Yes No No
Max Discharge Rate into Blender
(tons/minute)16.5 12.5 16.7
Ownership by Sand Co. None U.S. Silica – 100% Hi Crush (“investor”)
Proprietary Use by Sand Co. No No (~) No
Box TrackingRFID/GPS-based with
software
Q2 2018 – QR code-based
tracking with software
QR code-based tracking with
software
(*) Dependent on overweight permits, tractor weight

20Experience / Expertise / Excellence
Last Mile Equipment Solutions - Portable Silo Solution Characteristics/Specifications
CHARACTERISTICPROPELL
(Sandstorm)SOLARIS
FB INDUSTRIES
(Titan)
Silo Size (tons) 275 205 190, 280
Silo Configuration(s) 3-pack, 6-pack, custom 6-pack 6-pack
Truck Type Pneumatic, Bottom Dump
Pneumatic
(Bottom Dump under
development)
Pneumatic,
Bottom Dump (December
2017)
Conveyor InterfaceProprietary Conveyor System
(“VectorBelt”)Proprietary Conveyor System
Proprietary Conveyor System
(“Cobra”)
Max Discharge Rate into Blender
(tons/minute)10.0 11.5 16.5
Sand Co. Relationship None None None
Local Sand Management
SoftwareYes Yes Yes
21Experience / Expertise / Excellence
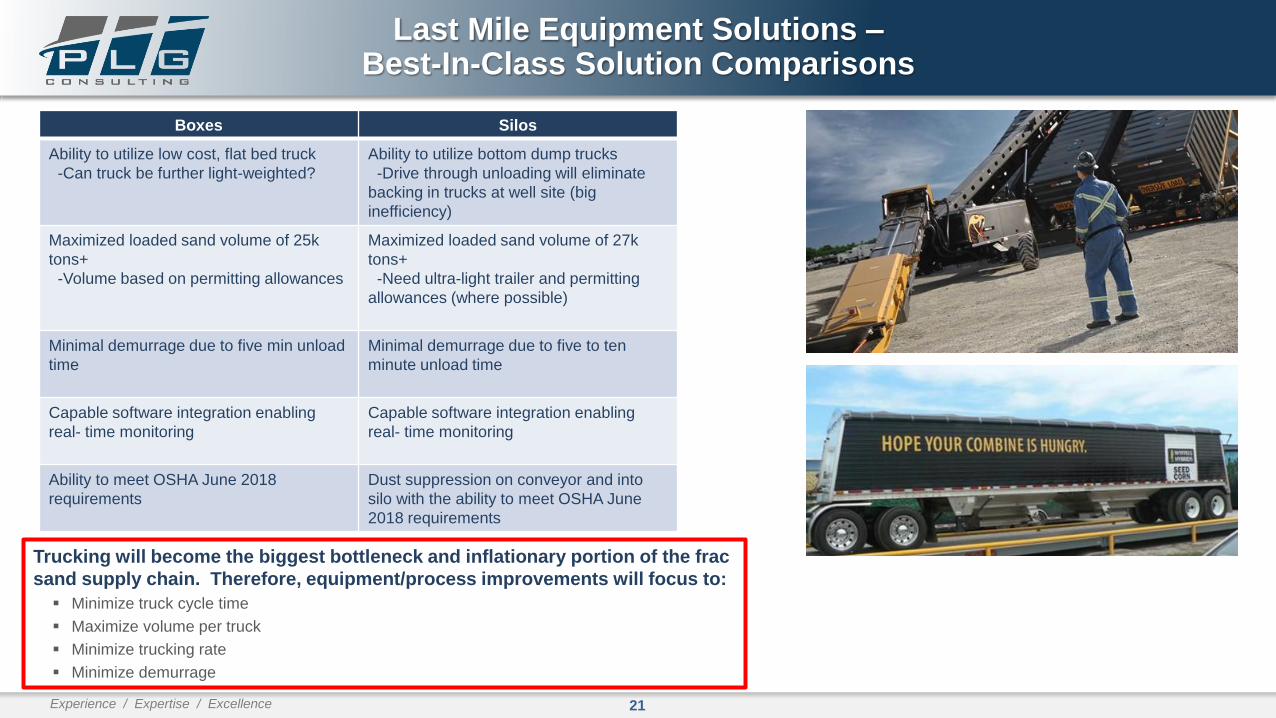
Last Mile Equipment Solutions –Best-In-Class Solution Comparisons
Trucking will become the biggest bottleneck and inflationary portion of the frac
sand supply chain. Therefore, equipment/process improvements will focus to:
▪ Minimize truck cycle time
▪ Maximize volume per truck
▪ Minimize trucking rate
▪ Minimize demurrage
Boxes Silos
Ability to utilize low cost, flat bed truck
-Can truck be further light-weighted?
Ability to utilize bottom dump trucks
-Drive through unloading will eliminate
backing in trucks at well site (big
inefficiency)
Maximized loaded sand volume of 25k
tons+
-Volume based on permitting allowances
Maximized loaded sand volume of 27k
tons+
-Need ultra-light trailer and permitting
allowances (where possible)
Minimal demurrage due to five min unload
time
Minimal demurrage due to five to ten
minute unload time
Capable software integration enabling
real- time monitoring
Capable software integration enabling
real- time monitoring
Ability to meet OSHA June 2018
requirements
Dust suppression on conveyor and into
silo with the ability to meet OSHA June
2018 requirements
22Experience / Expertise / Excellence
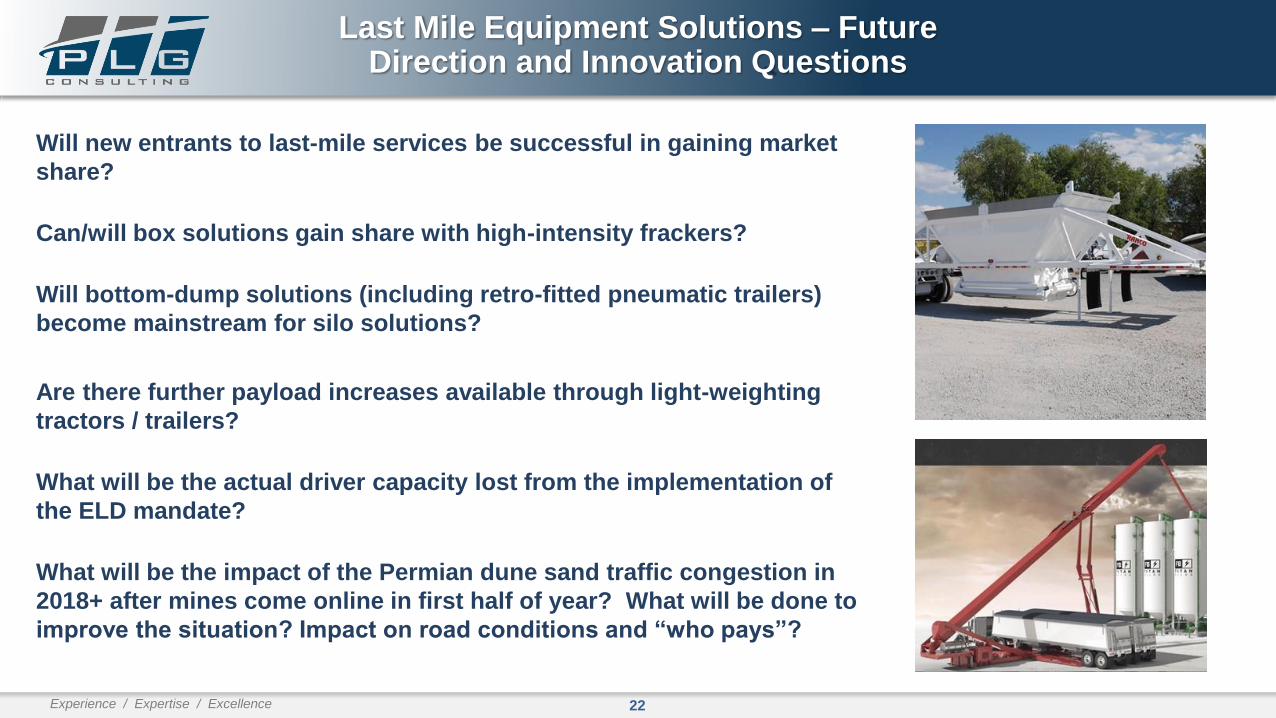
Last Mile Equipment Solutions – Future Direction and Innovation Questions
Will new entrants to last-mile services be successful in gaining market
share?
Can/will box solutions gain share with high-intensity frackers?
Will bottom-dump solutions (including retro-fitted pneumatic trailers)
become mainstream for silo solutions?
Are there further payload increases available through light-weighting
tractors / trailers?
What will be the actual driver capacity lost from the implementation of
the ELD mandate?
What will be the impact of the Permian dune sand traffic congestion in
2018+ after mines come online in first half of year? What will be done to
improve the situation? Impact on road conditions and “who pays”?
23Experience / Expertise / Excellence
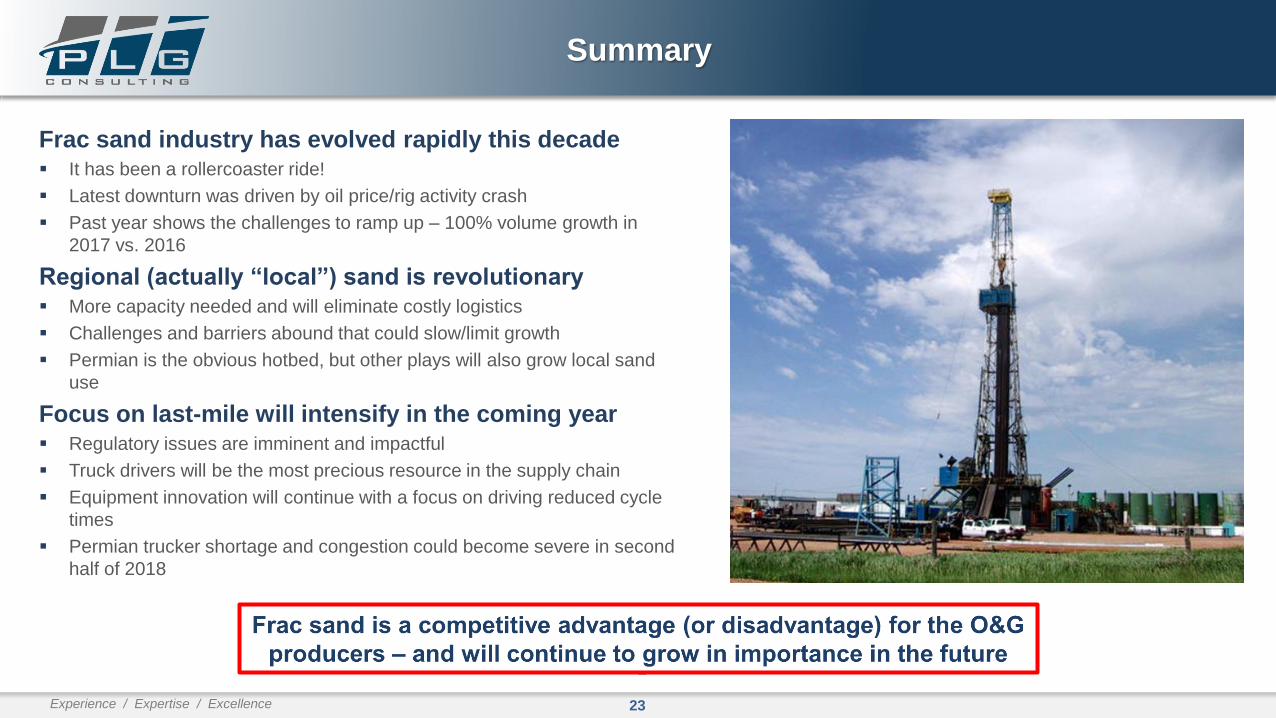
Summary
Frac sand industry has evolved rapidly this decade▪ It has been a rollercoaster ride!
▪ Latest downturn was driven by oil price/rig activity crash
▪ Past year shows the challenges to ramp up – 100% volume growth in
2017 vs. 2016
Regional (actually “local”) sand is revolutionary▪ More capacity needed and will eliminate costly logistics
▪ Challenges and barriers abound that could slow/limit growth
▪ Permian is the obvious hotbed, but other plays will also grow local sand
use
Focus on last-mile will intensify in the coming year▪ Regulatory issues are imminent and impactful
▪ Truck drivers will be the most precious resource in the supply chain
▪ Equipment innovation will continue with a focus on driving reduced cycle
times
▪ Permian trucker shortage and congestion could become severe in second
half of 2018
24Experience / Expertise / Excellence
Thank You!
For follow up questions and information, please
contact:
Taylor Robinson
President
PLG Consulting
https://plgconsulting.com/
+1 (508) 982-1319 | [email protected]
And thanks to our
friends for their help :Energent Group
Infillthinking.com
Headwaters MB