Embed Size (px)
Citation preview

FRACTURE BEHAVIOR OF CPM lOV
by
Raymond C. Luken. Jr.
Thesis submitted to the Graduate Faculty of the Virginia Polytechnic Institute and State University
in partial fulfillment of the requirements for the degree of
MASTERS OF SCIENCE
in
Materials Engineering
APPROVED:
R. E. Swanson. Chairman
M. R. Louthan. Jr. N. E. Dowling
March. 1987
Blacksburg. Virginia

FRACTURE BEHAVIOR OF CPM 10V
by
Raymond C. Luken, Jr.
Committee Chairman: R. E. Swanson
Materials Engineering
(ABSTRACT)
The effect of three heat treatments on plane-strain
fracture toughness CK 1c), fatigue crack growth rate (da/dN),
and tensile behavior of a commercial powder metal alloy, CPM
10V, was investigated. Fracture toughness was increased by
increasing the tempering temperatures and decreased by
increasing the austenitizing temperature. These changes
were related to changes in yield strength and the resulting
crack tip plastic zone sizes. Fracture toughness resulting
from any of the three heat treatments was inversely related
to the hardness. Fatigue crack growth followed the Paris
Law for some portion of the curve and crack growth expo-
nents, n, were virtually unchanged by the heat treatment.
The linear portion of the growth curve was shifted to higher
stress intensity ranges for heat treatments yielding higher
fracture toughness. Fatigue crack growth behavior in the
high growth region was determined mainly by the fracture
toughness of the specific heat treatment.

Acknowledgements
The author would like to express his gratitude to his
advisor, Dr. R. E. Swanson, for his patience and understand-
ing.
Thanks are also extended to:
--Drs. M. R. Louthan, Jr. and N. E. Dowling for their
guidance throughout this investigation.
--Nagaraja Iyyer, Derome Dunn, Robert Brown, and Kathy
Dennis for their technical assistance.
--the staff and students of the Materials Engineering
Department for their support and friendship.
Finally, the author would like to thank his parents for
all their encouragement and support.
iii

Table of Contents
I. Introduction . . . . . . . . . . . . . . . . . . . . . . . . . . . . . . . . . . . . . . . . . A. Tool Steel Development ............................. B. Micro- and Macrosegregation ........................ C. Powder Metallurgy (PIM)
D. CPM Process . . . . . . . . . . . . . . . . . . . . . . . . . . . . . . . . . . . . . E. CPM Advantages . . . . . . . . . . . . . . . . . . . . . . . . . . . . . . . . . . . . . F. Fracture Behavior of Tool Steels ...................
1. The Effects of Austenitizing Temperature
2. The Effects of Grain Size . . . . . . . . . . . . . . . . . . . . . . . 3. The Effects of Retained Austenite Content
4. The Effects of Tempering Temperature
5. The Effects of Carbide Size and Distribution
G. CPM 10V . . . . . . . . . . . . . . . . . . . . . . . . . . . . . . . . . . . . . . . . . . . . H. CPM 10V Application . . . . . . . . . . . . . . . . . . . . . . . . . . . . . . . . I. Objective of Investigation .........................
II. Materials and Methods . . . . . . . . . . . . . . . . . . . . . . . . . . . . . . . A. Materials and Characterization of Structure
1. Materials . . . . . . . . . . . . . . . . . . . . . . . . . . . . . . . . . . . . . . . 2. Heat Treatment
3. Specimen Designation
4. Metallographic Preparation
5. Carbide Distribution . . . . . . . . . . . . . . . . . . . . . . . . . . . .
iv
2
4
6
6
1 0
1 1
1 3
14
15
1 8
20
21
24
25
25
25
26
27
28
29

6. X-Ray Analysis for Retained Austenite
7. Hardness ........................................
B. Mechanical Properties
1. Tensile Test
30
3 1
32
32
2. Plane Strain Fracture Toughness (Kic) Test •••••• 32
a. Precracking 32
b. Plane Strain Fracture Toughness (Kic) Determina-
ti on 34
i. K1 c Te sting . • . . . • . • . . . . . . . . . • . • • . . • . • • • • . 34
ii. Load versus Load-Line Displacement Curve
Analysis
3. Fatigue Crack Growth Rate (da/dN) Test
a. Precracking
b. da/dN Determination
i. da/dN Testing
ii. da/dN and Stress Intensity Range ( !:¥..)
Calculations
4. Fractography
III. Results . . . . . . . . . . . . . . . . . . . . . . . . . . . . . . . . . . . . . . . . . . . . A. Metallography
B. Hardness
C. Tensile Test
D. Fracture Toughness
v
34
35
35
36
36
37
38
39
39
43
44
45

E. Fatigue Crack Growth Rate
F. Fractography
IV. Discussion
A. Carbide Distributions
B. Hardness and Strength
c. Toughness . ........................................ . D. Fatigue
v. Conclusion . . . . . . . . . . . . . . . . . . . . . . . . . . . . . . . . . . . . . . . . . . .
References . . . . . . . . . . . . . . . . . . . . . . . . . . . . . . . . . . . . . . . . . . . . . .
Tables . . . . . . . . . . . . . . . . . . . . . . . . . . . . . . . . . . . . . . . . . . . . . . . . . .
Figures
Appendix
. . . . . . . . . . . . . . . . . . . . . . . . . . . . . . . . . . . . . . . . . . . . . . . . .
A. Secant Program Determination
for Fatigue Crack Growth Rate
47
48
50
51
56
59
63
66
67
73
82
109
Appendix B. Fatigue Crack Growth Data ••••••••••••••••••• 111
Vita .......••..•.....•••••...........•.••.•.......••... . 124
vi

I. Introduction
A. Tool Steel Development
The performance potential of a tool steel depends upon
both its alloy content and carbide content. The presence of
undissolved carbides in the matrix of a tool steel leads to
improvements in wear resistance. Wear resistance generally
improves with both increasing volume fraction and hardness
of the carbides [1-3]. The hardness and volume fraction of
carbides present in a tool steel are controlled through
alloying. The addition of alloying elements increases the
volume fraction of undissolved carbides in the hardened mat-
rix. Vanadium forms the hardest and most wear resistant
carbide of the carbide-forming elements generally found in
high alloy tool steels [3-5]. Vanadium is followed in
decreasing order of effectiveness by tungsten. molybdenum.
chromium. and iron.
Alloying elements are also added to plain carbon tool
steel to promote:
1. greater strength in large sections 2. less distortion in hardening 3. higher toughness at the same hardness 4. greater hardness and strength at elevated
temperatures 5. corrosion resistance.
1

2
These improvements. with the exception of corrosion resis-
tance. are achieved primarily through alterations of the
hardening and tempering characteristics and the type and
volume fraction of carbide phase of the tool steel [4].
Corrosion resistance is achieved through chromium additions
which. under oxidizing conditions. forms a protective film .
that significantly affects the corrosion rate.
B. Micro- and Macrosegregation
Development of conventionally produced high alloy tool
steels has been severely limited by problems associated with
segregation. especially segregation of carbides. These
problems, which will be discussed later. are generally
intensified with increasing alloy content. The application
of powder or particle metallurgy (P/M) processing to these
steels has provided an effective means of controlling
segregation problems (1,3,6-10].
When steel is molten, the alloying elements are gener-
ally dissolved and uniformly distributed throughout. The
alloying elements are generally more soluble in the liquid
state than the solid state [9]. This difference in solubil-
ity can lead to a segregation of the alloying elements in
the solidified ingot. Segregation is manifested on both a
macroscale and a microscale. Macrosegregation refers to

3
changes in the average composition of the steel (e.g •• ingot
pattern. center segregation. inverse segregation) that occur
across the ingot cross section. Microsegregation refers to
localized compositional variations (e.g. • interdendritic
segregation. coring of dendrites) that occur across each
grain of the ingot. [6]
The extent to which segregation occurs depends upon the
rate of solidification of the alloy steel. If the cooling
rate is high. little time is available for macrosegregation
to occur. In this case segregation is not exceptionally
harmful because the segregate is well distributed and can
readily be broken up by hot working [4]. If on the other
hand. the cooling rate is sufficiently slow. appreciable
segregation of the alloying elements takes place. This
segregation can be reduced by hot working, but some evidence
of segregation may remain [6].
High alloy steels c~ntain very large amounts of carbides
of the different alloying elements present [4]. These car-
bides are formed from the melt as eutectic mixtures of
austenite and carbide. The amount of carbide present varies
directly with the cross sectional size of the ingot [6].
Large ingots require longer periods of time for solidifica-
tion and as a consequence the amount of carbide segregate
increases.

4
Carbide segregation has a tendency to cause [7.8]:
1. distortion after heat treatment 2. lowered toughness 3. nonuniform hardness 4. variability in grinding characteristics.
Consequently. carbide segregation is undesirable in terms of
both product performance and consistency. Several process-
ing methods have been used to minimize segregation in con-
ventional ingots. Some of the methods used are: vacuum arc
remelting. electroslag remelting. stirring of the solidify-
ing melt. and the use of solidification nucleants. However.
one of the more widely accepted means for decreasing segre-
gation is P/M processing.
C. Powder Metallurgy (P/M)
Significant refinements in the macrostructure and
microstructure of tool steels are also possible by means of
P/M processing. Macro- and micros eg rega t ion a re virtually
eliminated and the characteristics of carbides in the micro-
structure are appreciably changed [6]. These refinements
are made regardless of the size of the final mill product.
Refinements in the macrostructure are attributed to the vast
differences in solidification rates between prealloyed pow-
der particles and conventional cast ingots [6-9]. Powder
particles solidify quickly with the extent of segregation

5
being limited by the maximum powder particle dimensions.
When the prealloyed powder particles are consolidated the
resultant macrostructure is more homogeneous than the corre-
sponding ingot. Conversely. conventional ingots may take an
hour or more to solidify. particularly in large sized
ingots. resulting in marked s eg rega t ion on the macro scale
[6].
The difference in the solidification rates also has
significant effects on the size and distribution of the
microconstituents that form during solidification of the
melt. Micros eg rega t ion. as measured by the dend ri tic a rm
spacing. is significantly reduced by means of P/M process-
ing. Carbides in the P/M tool steels are small. spherical.
and uniformly distributed. The carbides in the P/M product
contrast greatly with the blocky. angular. clustered car-
bides in conventional ingot metallurgy (I/M) tool steels.[6]
Crucible Specialty Metals Division. Colt Industries.
introduced the world's first commercial production of tool
st e e 1 s by PIM in 19 7 0 [ 7] • Since then. several other P/M
processes have been developed for high alloy tool steel pro-
duction [12-14]. These processes are applied to the produc-
tion of existing tool steel compositions as well as to new
alloy compositions. The Crucible Particle Metallurgy (CPM)
process and its inherent advantages over conventionally pro-

6
duced tool steels will now be discussed because of its rele-
vance to this thesis.
D. CPM Process
The CPM process incorporates the following steps [8]
1. melting of prealloyed charge of desired composition
2. gas atomizing of the molten metal by high pressure nitrogen
3. drying. screening. and blending of the powder 4. charging of powder into mild steel cans 5. heating. vacuum outgassing. and sealing
of the powder-filled cans 6. hot isostatic compacting 7. reheating and hot working to various
mill product forms (bar. rod. wire) on conventional mill facilities.
Since full density is obtained following hot isostatic com-
paction. it is not necessary to hot work the product to
enhance its properties [l].
E. CPM Advantages
CPM tool steels offer definite advantages over their
conventional counterparts in several regards [3.6-10]:
1. superior grindability in the hardened condition
2. improved toughness of tools 3. faster response to hardening heat
treatment

7
4. greater cross-sectional uniformity of hardness
5. more uniform size change (less out-of-roundness) as a result of hardening heat treatment.
These advantages stem from the fine uniformly distrib-
uted carbide populations inherent in the CPM process.
Grinding with abrasive wheels commonly follows the heat
treatment of tool steels. The ease of grinding. or grinda-
bility is therefore a significant cost component of tool
steel production [6]. Grindability is measured in terms of
the ratio of volume of tool steel removed to the volume of
abrasive grinding wheel lost. CPM tool steels have signi-
ficantly higher grinding ratios than conventional tool
steels [8]. This improvement in grindability occurs because
the fine uniformly distributed carbides in CPM tool steels
are more readily removed from the grinding surface than the
massive clustered carbides in conventional steel [10].
Bend fracture strength and impact toughness are gener-
ally used as measures of tool steel toughness [4]. Bend
fracture strength [3.15] and impact toughness [3] have been
observed to inc re as e wit h de c re as in g g rain s i z e • Neumeyer
and Kasak [15] showed that in both CPM and conventional tool
steels finer primary carbides resulted in a smaller grain
size after heat treatment.· Two reasons for this observed
decrease in austenite grain size were postulated. Fi rs t.

8
since carbide-ferrite interfaces are effective sites for
austenite formation. and since these sites are more numerous
in steels with fine carbide populations. austenite nucle-
ation rate is increased for fine carbide distributions. More
austenite grains are formed and the resulting grain size is
smaller. Second. carbide particles act as barriers to grain
boundary migration during further heating into the austeni-
tizing range. Finer primary carbide distributions result in
smaller interparticle spacings (for a given volume fraction
of carbides). The smaller interparticle spacings restricts
grain growth to smaller sizes. assuming the particles do not
go into solution. The inherently finer carbide size in CPM
products are therefore responsible for improved toughness.
Short austenitizing times during hardening treatments
are desirable because they prevent excess grain growth.
oxidation. and dee a rburiza ti on which adversely af feet t col
properties and performance. The small primary carbides in
CPM tool steels provide a greater interfacial area between
the carbides and the surrounding matrix. This enables the
alloying elements to diffuse more rapidly into the matrix
for hardening. The CPM tool steels are therefore able to
respond more rapidly to hardening. reaching full tempered
hardness after shorter austenitizing times. [6. 8]
Variations in hardness across the diameter of a conven-

9
tional ingot reflect both coarseness of carbides and solidi-
fication segregation patterns inherent in conventional tool
steels (8). These variations become more pronounced as the
cross sectional size of the ingot increases. Segregation is
virtually eliminated in CPM tool steels regardless of cross
sectional size. The fine uniformly distributed carbides in
CPM tool steels lead to uniform hardness across the diame-
ter.
During the hardening heat treatment, tool steels undergo
phase transformations resulting in dimensional changes. In
conventional tool steels these changes tend to be nonuniform
in nature with the extent of nonuniformity increasing with
increasing product cross section. This nonuniformity is
related to the severity of ingot segregation and to a non-
uniform hot working pattern (16). CPM tool steels exhibit
more uniform size changes after hardening. This improvement
is related largely to the uniform microstructure and random
crystallographic orientation of the CPM products [ 10] •
Dimensional stability reduces the need for grinding after
the final heat treatment, resulting in economic savings.
The minimization of grinding also alleviates the possibility
of surface damage due to grinding stress.

10
F. Fracture Behavior of Tool Steels
The application of fracture mechanics testing to high
hardness (50-70 HRC) tool steels is relatively recent. and
the volume of literature is scant [17-32]. One of the rea-
sons for this paucity of literature is the difficulty in
fatigue precracking of brittle materials [ 21] • During
fatigue cracking of brittle materials unstable crack propa-
gation may occur upon crack initiation unless the available
elastic energy is either decreased or the crack runs into an
opposing stress field. In fatigue precracking unstable
crack propagation can be prevented by decreasing the load
range. but this decrease is often to a level where crack
initiation is impossible. Harris and Dunegan [33] developed
a method for initiating precracks in beryllium by forcing a
edge into a machined notch using an impact load (Figure 1).
This method has been validated for high hardness steels by
Eriksson [21]. Unstable crack propagation is arrested by
transversely loading in compression a small circular area
ahead of the notch tip. When the stress pulse and moving
crack generated by the impact load reach the compressive
zone the crack opening stress is reduced by the compressive
stress. Eriksson reports that this method of precracking of
brittle materials results in considerably shorter precrack-
ing times (10 minutes versus 8 hours). Eriksson further

11
reported that for the materials he tested, the fracture
toughness data were found to be independent of the type of
precracking used. Several other investigators [19,24,27,28]
have tried this impact technique and their fracture tough-
ness results were found to be consistent with results from
fatigue precracked specimens of the same material.
Most of the fracture toughness data available for high
hardness tool steels have been obtained from investigations
of high speed tool steels [17-31]. These investigations
have primarily been concerned with the effects of the fol-
lowing variables upon fracture behavior:
1. austenitizing temperature 2. prior austenite grain size 3. retained austenite content 4. tempering temperature 5. carbide size and distribution.
These effects will be described below.
1. The Effects of Austenitizing Temperature
When tool steels are heated above their eutectoid tem-
perature (Ac 1 ) ferrite and carbide phases begin to go into
solid solution and austenite nucleates at carbide-ferrite
interfaces [4,11]. As the austenitizing temperature is
raised, increased dissolution of the ferrite and carbide
phases results in more nucleation of austenite grains and

12
the growth of exsisting austenite grains. At some temper-
ature above Ac 1 , depending upon the rate of heating, all the
ferrite will be consumed and the austenite grains will imp-
inge upon one another, forming the initial austenite grain
structure. At this point in the transformation, the
microstructure consists of undissolved carbides in a matrix
of austenite.
Further increases in austenitizing temperature results
in two simultaneous carbide reactions: (1) increased disso-
lution of the carbides, and (2) increased agglomeration of
the large carbides [27 ,31]. These agglomerated carbides
have been observed along prior austenite grain boundaries
and at grain boundary triple points of AISI M2 high-speed
steel, and have been related to the decrease in fracture
toughness occurring with increased austenitizing tempera-
tures [27].
Accompanying a decrease in volume fraction of primary
carbides is an increase in the alloy composition of the
austenite matrix. Increased alloy content in the austenite
matrix, especially carbon, results in higher as-quenched
hardnesses. Several investigators [17-21,23,29] have
observed decreases in fracture toughness with increases in
hardness resulting from increases in austenitizing temera-
tures. At hardness levels above 50 HRC, in verse rel a-

13
tionships between fracture toughness and hardness were
observed [19.21.29). Increases in yield strength [29) and
fatigue crack growth resistance [20) were also observed with
inc re as es in austenitizing temperatures. Increases in
fracture toughness may be obtained at the expense of tool
steel hardness by deliberately underhardening the tool steel
[ 4] •
2. The Effects of Grain Size
Increased austenitizing times and temperatures decrease
the quantitiy of primary carbides [29.34). Carbide par-
ticles serve to inhibit grain growth by acting as obstacles
to grain boundary motion. Dissolution of carbide particles
reduces the number of carbides available for pinning the
grain boundaries. and grain growth occurs. The tendency for
grain growth increases markedly with austenitizing temper-
ature and to a lesser extent with time. except near the
liquidus temperature [ 4] • Investigators have attributed
decreases in impact toughness [19). bend fracture strength
[ 15] • and fatigue crack initiation resistance [23) to
increases in prior austenite grain size. At least one
investigator [18] attributed an increase in fracture tough-
ness to an increase in prior austenite grain size.

14
3. The Effects of Retained Austenite Content
Typically. tool steels in the as-hardened condition may
contain 15-30% retained austenite depending upon the speci-
fie alloy composition and the austenitizing temperature [5].
Alloying elements influence the quantity of retained auste-
nite primarily through their effect on the martensite
transformation range. M "martensite start" s and Mf "marten-
site finish" temperatures. All substitutional alloying
elements commonly used in tool steels. with the exceptions
of cobalt and aluminum. lower the Ms and Mf temperatures
(4.11]. Lower
percentages of
M s and
retained
temperatures promote higher
austenite following quenching.
provided the Mf temperature is lower than the final quench
temperature. The relative strengths of alloying elements in
lowering these temperatures in decreasing order of effec-
tiveness are: carbon. manganese. chromium. molybdenum.
tungsten. and silicon [ 4] • The effectiveness of
elements in lowering M s and depends heavily
alloying
upon the
degree of dissolution of these elements prior to quenching.
Higher austenitizing temperatures enable more complete alloy
solution. resulting in increased amounts of retained aus-
tenite upon quenching (18.19.35-40]. Carbide forming alloy
additions
actually
(chromium. molybdenum. tungsten. vanadium) may
raise M s temperatures by decreasing the
15
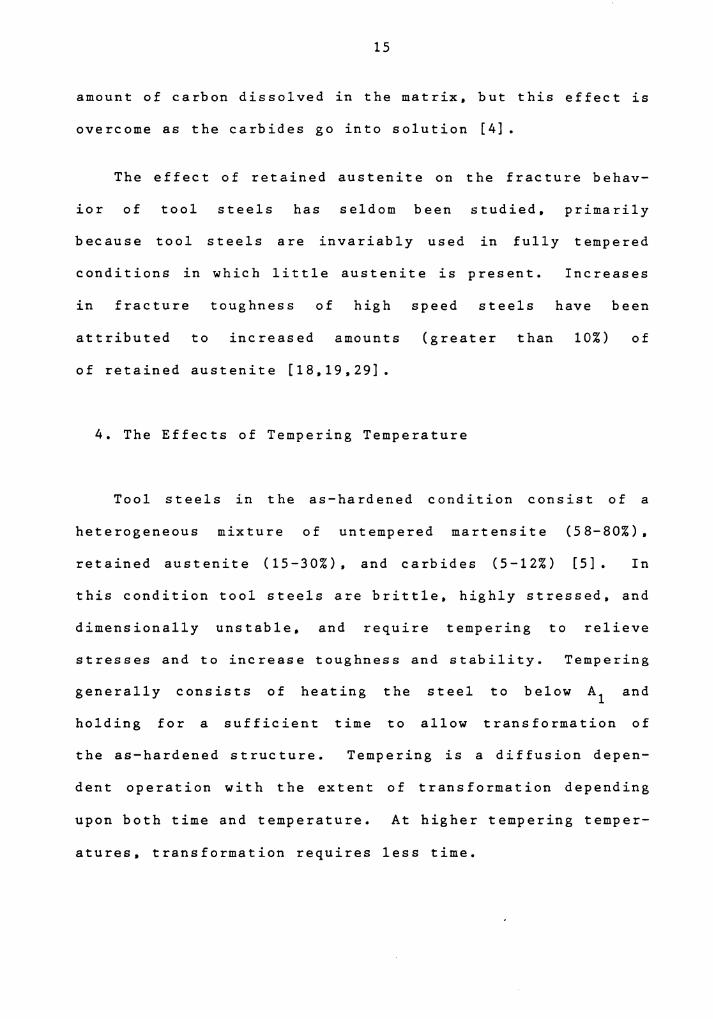
amount of carbon dissolved in the matrix, but this effect is
overcome as the carbides go into solution [4].
The effect of retained austenite on the fracture behav-
ior of tool steels has seldom been studied, primarily
because tool steels are invariably used in fully tempered
conditions in which little austenite is present.
in fracture toughness of high speed steels
attributed to increased amounts (greater than
of retained austenite [18,19,29].
4. The Effects of Tempering Temperature
Increases
have been
10%) of
Tool steels in the as-hardened condition consist of a
heterogeneous mixture of untempered martensite (58-80%),
retained austenite (15-30%), and carbides (5-12%) [5]. In
this condition tool steels are brittle, highly stressed, and
dimensionally unstable, and require tempering to relieve
stresses and to increase toughness and stability. Tempering
generally consists of heating the steel to below A1 and
holding for a sufficient time to allow transformation of
the as-hardened structure. Tempering is a diffusion depen-
dent operation with the extent of transformation depending
upon both time and temperature. At higher tempering temper-
atures, transformation requires less time.

16
Transformation upon tempering of the as-hardened struc-
ture of high alloy secondary hardening steels occurs in
several stages [4,5,11].
mat ion, room temperature
In the initial stage of transfor-
0 to 270 C, the body-centered tetra-
gonal untempered martensite decomposes to body-centered
cubic martensite with the rejection of carbon as epsilon
carbide (Fe 2 • 4 c). At temperatures around 300-400°C, the
epsilon carbide disappears with the appearance of cementite
(Fe 3 c) which nucleates at lath boundaries and prior auste-
nite grain boundaries [11]. This initial stage of transfor-
mation is accompanied by a slight drop in hardness and a
0.2% decrease in specific volume [4].
The next stage of transformation occurs in the temper-
0 ature range 400-565 C. This stage involves the dissolution
of a portion of the cementite and precipitation of complex
alloy carbides (secondary carbides), either w2 c, Mo 2 c, or
MC, from the tempered martensite accompanied by pronounced
precipitation hardening. High speed steels tempered at
their secondary hardening peak temperatures experience
decreases in fracture toughness [20,23]. Retained austenite
remains stabilized up to temperatures of 425-540°C where
"conditioning" of the austenite occurs enabling it to trans-
form to untempered martensite upon cooling [4]. The process
of "conditioning" was first described by Cohen [41]. Cohen
speculated that conditioning was related to the precipita-

17
tion of complex alloy carbide particles in the adjacent mar-
tensite. The precipitation of carbides from the martensite
possibly sets up a concentration gradient between the auste-
nite and martensite. causing diffusion of carbon and possi-
bly other alloy elements from the austenite to the marten-
site. The depletion of carbon and other alloying elements
from the austenite raises the M temperature and permits s
transformation of the austenite to untempered martensite
upon cooling. This newly formed martensite is brittle and
highly stressed must be retempered to minimize stresses and
decrease brittleness.·
The transformation of conditioned austenite to marten-
site upon cooling is usually the last stage of transforma-
t ion enc o u n t e red in co mm e r c i a 1 t em p e ring of t o o 1 s t e e 1 s •
If either insufficient tempering times or temperatures are
employed. only partial transformation of the retained auste-
nite may occur. In this case. a second tempering operation
may be necessary to ensure complete transformation of the
retained austenite to untempered martensite. The newly pro-
duced martensite formed during the transformation of the
remaining austenite should then be tempered a third time to
minimizes stresses and decrease brittleness.
Investigators have observed decreases in hardness
[17.19.20.22-24.27-29] and strength [23] and increases in

18
elongation (22.23]. fracture toughness (17.19.20.22-24.
27-29] and fatigue crack growth resistance (24] for high
speed steels tempered above their secondary hardening peak
temperatures. One investigator [18] observed that tem-
pering temperatures had no effect on Kic as long as the
final tempered hardness remained constant.
5. The Effects of Carbide Size and Distribution
The presence of undissolved carbides in the matrix of
tool steels is important because of their contributions to
wear resistance and softening at elevated temperatures.
Unfortunately. carbide particles can adversely affect the
mechanical properties of the tool steel depending upon the
size. distribution. and degree of segregation of the car-
bides. Several investigators [18.19.22-24.27.29-31] have
discussed the effect(s) of carbides upon the mechanical
properties of high speed steels.
Carbide particles serve as initiation sites for voids.
which can then link up through plastic deformation of the
matrix. Previous studies have shown that increased primary
carbide volume fractions. (V ) • lead to decreased fracture v c
toughness (18.19.29]. As (V ) increases. the mean free v c
distance between the particles decreases. Voids formed
ahead of the crack tip can then link up with less plastic

19
deformation of the matrix. accounting for the observed
decrease in fracture toughness with increasing ( v ) v c
At hardness levels below 600HV (55 HRC). crack propaga-
t ion was observed to p roe eed preferentially along carbide
stringers [ 2 7] • At hardness levels in excess of 600HV
(55HRC). fracture toughness has been observed to be insensi-
tive to carbide segregation [22-24.27.29.30]. Insensitivity
to carbide distribution at high hardness has been attributed
to decreases in plastic zone size [24.27.29]. A crack
"reacts to carbides in its vicinity only as far as the plas-
tic zone centered around the crack tip extends." [27] Crack
propagation is expected to be "insensitive" to carbides when
the size of the plastic zone is smaller than interparticle
spacing [28.29]. At high hardness values the plastic zone
is no longer large enough to span the distance between
stringers. and crack propagation becomes "insensitive" to
the carbides. In this case. fracture toughness is believed
to be controlled by properties of the matrix [22-24 0 27.29].
In summary, carbide particles may play an active role in
the initiation of fracture in tool steels. but at the high
hardness levels (55-65 HRC) normally employed in tool steels
subjected to attrition by wear, matrix properties appear to
control the fracture process.
20
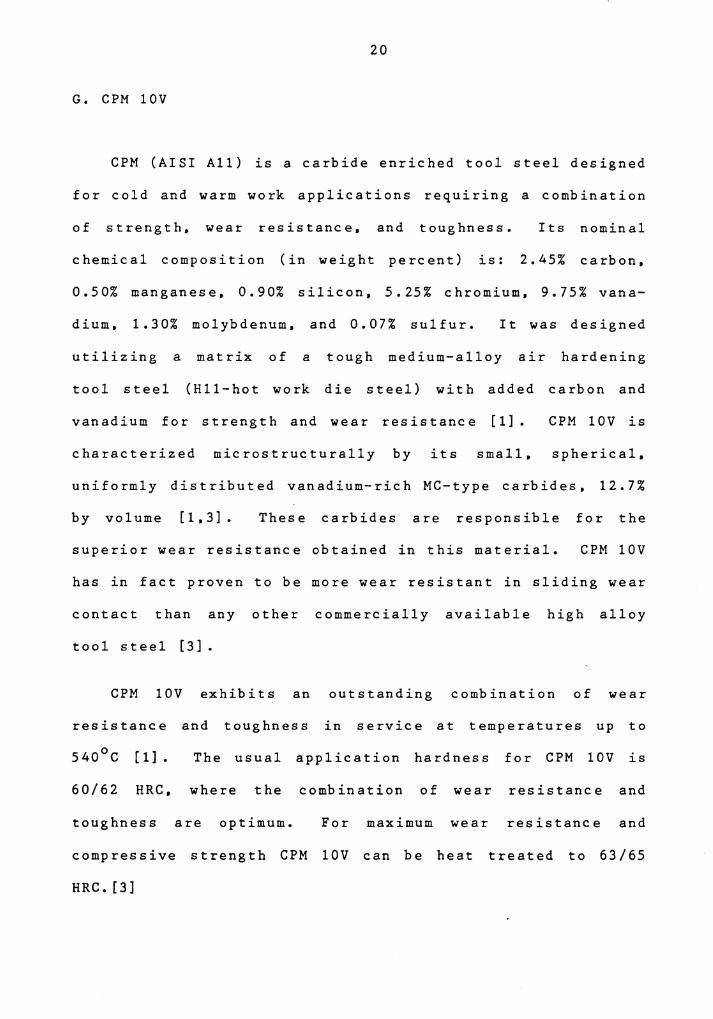
G. CPM lOV
CPM (AISI All) is a carbide enriched tool steel designed
for cold and warm work applications requiring a combination
of strength. wear resistance. and toughness. Its nominal
chemical composition (in weight percent) is: 2.45% carbon.
0.50% manganese. 0.90% silicon. 5.25% chromium. 9.75% vana-
dium. 1.30% molybdenum. and 0.07% sulfur. It was designed
utilizing a matrix of a tough medium-alloy air hardening
tool steel (Hll-hot work die steel) with added carbon and
vanadium for strength and wear resistance [l]. CPM lOV is
characterized microstructurally by its small. spherical.
uniformly distributed vanadium-rich MC-type carbides. 12.7%
by volume [1.3]. These carbides are responsible for the
superior wear resistance obtained in this material. CPM lOV
has in fact proven to be more wear resistant in sliding wear
contact than any other commercially available high alloy
tool steel [3].
CPM lOV exhibits an outstanding combination of wear
resistance and toughness in service at temperatures up to
540°C [l]. The usual application hardness for CPM lOV is
60/62 HRC. where the combination of wear resistance and
toughness are optimum. For maximum wear resistance and
compressive strength CPM lOV can be heat treated to 63/65
HRC. [3]

21
H. CPM lOV Application
A current application of CPM lOV is tooling for mixing
and extrusion of filled plastics. Screws and kneading ele-
ments (Figure 2) used in the processing of filled plastics
are exposed to severe thermal. mechanical. and chemical con-
ditions. As a consequence. minimum material requirements
for these components include:
1. strength 2. toughness 3. fatigue resistance 4. wear resistance 5. corrosion resistance.
Plastics are processed at elevated temperatures (e.g ••
0 0 315 C-nylon. 400 C-polyester). Components used to process
plastics must therefore possess adequate strength at ele-
vated temperatures to prevent distortion or fracture. Sin-
ce screws and kneading elements operate inside rigid bar-
rels. they are not subjected to high bending stresses. The
critical strength requirement in these components is resis-
tance to torque [42]. Neglecting stress concentrations and
sudden shock loadings. materials possessing higher strengths
are more resistant to torque.
Components used in the processing of filled plastics
must also possess adequate toughness to resist fracture.
Toughness. from a fracture mechanics viewpoint. refers to

22
the ability of a material to carry load or deform plasti-
cally in the presence of a notch without fracturing [43].
In screws and kneading elements notches may occur intention-
ally (e.g •• keyways, small fillets, sharp corners) or acci-
dentally (e.g. 1 grinding scratches, gouges, cracks). Mate-
rials with high toughness are desirable, but increased
toughness is generally associated with an attendant loss in
strength and wear resistance.
Screw and kneading elements are essentially rotating
shafts subjected to torsional loading. One of the primary
causes of failure in shafts is fatigue [44]. Fatigue gen-
erally initiates at highly stressed regions (stress raisers)
subjected to cyclic stresses. These stress raisers may be
either mechanical (e.g., small fillets, sharp corners, key-
ways) or metallurgical (e.g. 1 quench cracks, inclusions,
carbides). Once fatigue cracks are initiated, they propa-
gate until the remaining uncracked cross section can no
longer tolerate the imposed loads and fractures. Fatigue
resistance is therefore a very important property to con-
sider when selecting a material for screw and kneading ele-
ments applications.
Screws and kneading elements are also exposed to condi-
tions of extreme wear. Wear on these components is gener-
ally attributed to either abrasive wear or adhesive wear

23
[2.42]. Many materials used to fill plastics such as cal-
cium carbonate. glass fibers. and titanium dioxide pigments
are hard. Abrasive wear occurs as hard particles either
slide or roll under pressure across the component's surface.
This results in the displacement of metal from the wearing
surface by the cutting action of the particles. The rate of
abrasive wear decreases with increasing matrix hardness and
increasing size. hardness. and volume fraction of primary
carbides [2].
Adhesive wear [44] occurs when the screw and kneading
element surfaces slide against the barrel under pressure.
Microscopic asperities on the opposing surfaces bond under
the highly localized pressure at the sliding interfaces.
These bonds are subsequently fractured by sliding forces
resulting in transfer of metal from one surface to the
other. Loose particles may also be formed in this process
contributing to abrasive wear. Adhesive wear resistance
increases with increasing MC-type primary carbide content
[45.46]. Small primary carbide size reduces adhesive wear
of the mating surface [40.44.45].
When plastics are overheated they degrade and release
corrosive chemicals. subjecting the screws and kneading
elements to chemical attack [42]. A typical example is the
release of hydrochloric acid when PVC degrades. Corrosive

24
chemicals can also be released by: polycarbonates. fluoro-
carbons. flame retarding materials. fiber sizing agents and
many other materials. Chemical attack can combine with
abrasive wear to significantly affect wear rate by a process
known as corrosive wear. Components used in the processing
of filled plastics must therefore possess adequate corrosion
resistance through either alloy additions or surface modifi-
cations (plating. chemical or vapor deposition. hard surfac-
ing. etc.).
I. Objective of Investigation
Tooling manufacturers usually develop proprietary heat
treatments based upon field performance. In such cases. the
detailed role of microstructural variables on the field
performance is not well understood. This prevents con-
trolled refinements in heat treatments to optimize perfor-
mance in other applications. The objective of this inves-
tigation was to determine the relationship between strength.
fracture toughness. fatigue crack growth resistance. and
hardness of CPM lOV resulting from three proprietary heat
treatments. The effects of these heat treatments upon
wear and corrosion resistance are the subject of an ensuing
investigation.

II. Materials and Methods
A. Materials and Characterization of Structure
1. Materials
Annealed CPM lOV tool steel manufactured by Crucible
Speciality Metals Division. Colt Industries. was provided by
Windward International in the forms of 10.3 cm (4.0 in)
diameter forged bar and 1.27 cm x 1.27 cm (0.5 in x 0.5 in)
rolled square bar. Nominal chemical composition of CPM lOV
is given in Table 1 [3].
Compact tension (CT) specimens were machined from the
round bar in accordance with American Society for Testing
and Materials (ASTM) Standard E 399-83 [47]. The CT speci-
mens were machined in both longitudinal (C-L) and radial
(C-R) orientations (Figure 3). Specimen thickness (B) was
6.35 mm (0.25 in) with the width (W) of the specimen. as
measured from the load line. being 50.80 mm (2.0 in) (Figure
4) •
Tensile specimens were machined from the square bar in
accordance with ASTM Standard E 8-83 [48]. The specimens
were 6.35 mm (0.25 in) in diameter with a gage length of
25.40 mm (1.0 in) (Figure 5).
25

26
2. Heat Treatment
Three different heat treatments (Table 2) were utilized
in this investigation. The heat treatments can be summa-
rized in terms of temperatures used: A(low austenitize, high
temper): B(low austenitize, low temper): and C(high auste-
nitize, low temper). Each heat treatment was applied to
fourteen CT specimens, seven from each of the two orienta-
tions, and three tensile specimens. These heat treatments
were performed by Windward International, formerly Williams
Manufacturing Company, located in Wytheville, Virginia.
After the specimens we re mac bin ed, they we re wrapped,
along with shredded newspaper, in stainless steel foil. (The
newspaper was added to minimize oxidation during heat treat-
ment.) The wrapped specimens were then stress relieved at
593°C for 2 hours. The stress relieved specimens were
removed from the furnace and allowed to cool to room temper-
ature while still in the foil. The wrapped specimens were
0 then placed in a furnace at 845 C and preheated for 1 hour.
The furnace control was then turned to the desired austeni-
tizing temperature, either 955°C or 1010°c. The specimens
remained in the furnace for either 0.75 hour at 955°C or
0.50 hour at 1010°c. The specimens were then removed from
the furnace. unwrapped, separated, and placed on a steel
rack where they were allowed to cool to room temperature in

27
still air.
The unwrapped specimens were then triple tempered at 2
hours per temper. The tempering operation involved placing
the specimens in a furnace regulated at various tempera-
tures, ranging from 510°C to 595°C, as shown in Table 2.
The specimens were removed from the furnace after each tem-
per and allowed to cool to handling temperature before the
next temper. After the tempering operation. the surfaces of
the specimens were lightly ground to approximately a 15
micron finish using silicon carbide paper. Temperatures for
austenitizing and tempering typically varied by less than
±5 °c.
3. Specimen Designation
In order to differentiate between each CT specimen, a
simple identification scheme was adopted. Each specimen was
identified by a three part code (e.g. LA-1). The first part
of the code identified the CT specimen crack orientation,
either longitudinal (L) or radial (R). The second part
of the code designated the specimen heat treatment. either
A, B. or C. The third part of the code identified the spe-
cimen number, either 1, 2, 3. or 4.
The tensile specimens were identified using a two part

28
code (e.g. A-1). The first part of the code designated the
specimen heat treatment. either A. B. or C. The second part
identified the specimen number. either 1. 2. or 3.
Identification codes for the specimens used in fracture
toughness. fatigue crack growth rate. and tensile testing
are provided in Table 3.
4. Metallographic Preparation
Samples for metallographic examination were cut from the
fractured toughness specimens as shown in Figure 6. A
sample was also cut from fatigue crack growth rate specimen
RB-3 because of the anomalous behavior of the radial
oriented fracture toughness specimens from heat treatment B.
This behavior will be explained later. Standard metallo-
graphic practices were observed for mounting. grinding. and
polishing of the samples. Vilella's reagent. nital. picral.
super picral. and aqueous picric acid were used to etch the
microstructure. Microstructures were observed and photogra-
phed using an ausJENA Neophot 21 metallograph.

29
5. Carbide Distribution
Quantitative metallography was used to determine the
carbide volume fraction, (Vv)c• and the mean free distance
between carbides ). of the samples prepared for metallo-
graphic examination.
The point count method, utilizing an open square grid
(Figure 7), was used to calculate (V ) v c [ 49] • The grid
dimensions were selected so that not more than one grid
point fell on a carbide and that the grid spacing was close
to the spacing of the carbides. (V ) was determined by v c
superimposing the grid over enlarged photomicrographs and
counting the number of intersections of the grid points with
the carbides. Those points that appeared to fall on the
boundary of a carbide were counted as one half. The grid
was randomly placed over each photomicrograph 30 times.
(V ) was calculated by dividing the number of carbide-grid v c
intersections (Pc) by the total number of test points (Pt) 1
The term). is defined as the mean edge-to-edge distance
along random straight lines between all possible pairs of
carbides and is determined using the relationship:
A. = 1 - (V ) v c
30
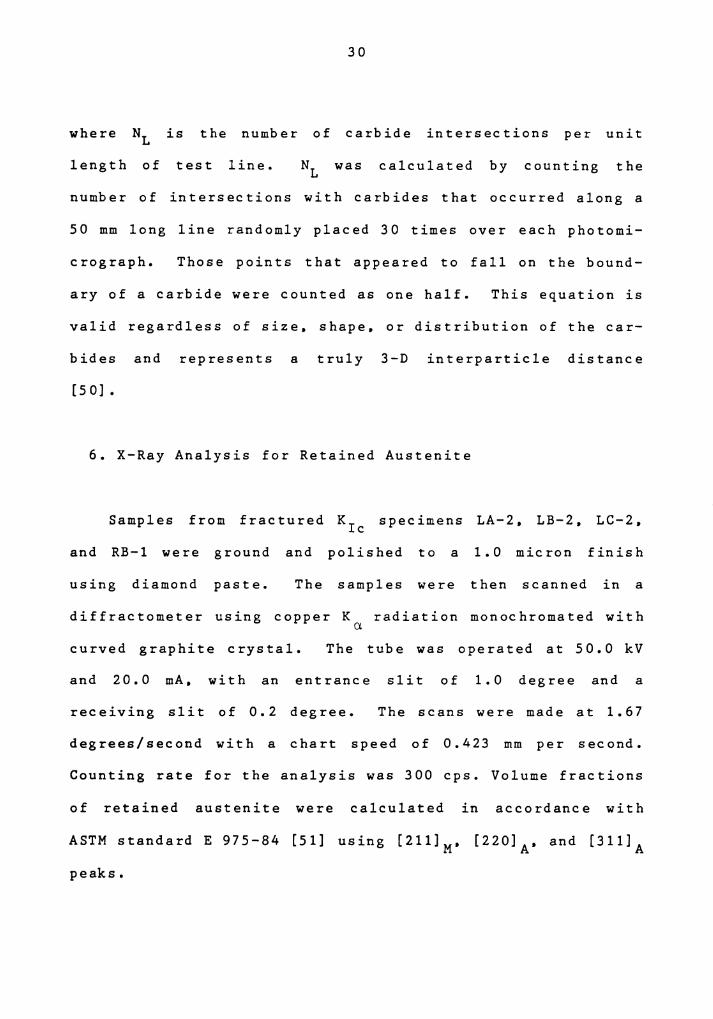
where NL is the number of carbide intersections per unit
length of test line. N1 was calculated by counting the
number of intersections with carbides that occurred along a
50 mm long line randomly placed 30 times over each photomi-
crograph. Those points that appeared to fall on the bound-
ary of a carbide were counted as one half. This equation is
valid regardless of size. shape. or distribution of the car-
bides and represents a truly 3-D interparticle distance
[5 O] •
6. X-Ray Analysis for Retained Austenite
Samples from fractured Kic specimens LA-2. LB-2. LC-2.
and RB-1 were ground and polished to a 1.0 micron finish
using diamond paste. The s am pl es we re then scanned in a
diffractometer using copper K radiation monochromated with a curved graphite crystal. The tube was operated at 50.0 kV
and 20.0 mA. with an entrance slit of 1.0 degree and a
receiving slit of 0.2 degree. The scans were made at 1.67
degrees/second with a chart speed of 0.423 mm per second.
Counting rate for the analysis was 300 cps. Volume fractions
of retained austenite were calculated in accordance with
ASTM standard E 975-84 [51] using [211]M. [220]A. and [311]A
peaks.

31
7. Hardness
Microhardness measurements of CPM lOV were made on a
LECO DM-400 hardness tester using a Vickers indenter with a
load of 500 grams. The samples previously prepared for
metallographic examination were repolished to a 1. 0 micron
finish and used for microhardness evaluation. Ten Vickers
hardness measurements were made on each sample and the
results were averaged. Hardness conversions from Vicker 1 s
hardness values (HV) to Rockwell C hardness values (HRC)
were made utilizing an ASTM hardness conversion table for
non-austenitic steels (52].

32
B. Mechanical Properties
1. Tensile Test
Tensile tests were performed at 0 room temperature (20 C)
in accordance with ASTM Standard E 8-83 [48]. Special grips
were designed to hold the tensile specimens during testing
(Figure 8). Three tensile specimens from each heat treat-
ment were tested. Tensile specimens were tested on a MTS 880
servohydraulic testing machine operating under stroke con-
t rol at a rate of -3 4.23x10 mm per second. Load versus
load-line displacement curves were recorded on a Hewlett
Packard 7045B X-Y recorder.
2. Plane Strain Fracture Toughness (Kic) Test
a. Precracking
Fatigue precracking was done in accordance with ASTM
Standard E 399-83 [47] with one exception, which will be
discussed in Section D of the Results. Two CT specimens
from each heat treatment were fatigue precracked prior to
fracture toughness testing. Fatigue precracking was per-
formed on a MTS 880 servohydraulic testing machine operating
under load control. Fatigue crack growth was measured with

33
the aid of a Gaertner 40X magnification traveling micro-
scope. Crack observation was enhanced by polishing the
faces of the CT specimens to a 1.0 micron finish and using
oblique illumination.
Initial attempts to initiate precracking at the machined
notches were unsuccessful using a maximum stress intensity
(K ) max of 13.7 MPa•m 112 even after 10 6 cycles. Crack
initiation was aided by cutting pseudo-chevron notches (Fig-
ure 9) at the bases of the machined notches using a Buehler
Isomet 11-1180 low speed saw.
Fatigue p rec racking of the CT specimens from heat
treatments A. B. and C was initiated at maximum applied
loads (P ) of 3.34 kN. 3.34 kN. and 2.67 kN. max The speci-
mens were cycled at a frequency of 30 Hz using a sinusoidal
tension-to-tension cycle. with minimum-to-maximum load
ratios not exceeding 0.025. P values were stepwise max
reduced after crack extensions of predetermined lengths
(Figure 10) in an
of 13.7 MPa•m 112 •
treatments A. B.
The reductions in
attempt to maintain constant K values max
13.7 MPa•m 112 • and 12.0 MPa•m 112 • for heat
and c. respectively during precracking.
p did not exceed 20%. The terminal max
values of p were 2.22 kN. 1. 7 8 kN • and 1. 7 8 kN • for heat max
treatments A. B. and c. respectively. Resulting average
precrack length values (a). measured from the load lines.

34
were approximately 2.54 cm. yielding a/W ratios of 0.50.
b. Plane-Strain Fracture Toughness (Kic) Determination
i. Kic Testing
Kic testing was done at room temperature (20°C) in
accordance with ASTM standard E 399-83 [47]. Testing was
carried out on a MTS 880 servohydraulic testing machine
operating under load control. Final fracturing of the
specimen was accomplished by loading at a constant rate of
-3 2.12x10 mm per second until fracture occurred. Load
versus load-line displacement curves were obtained through
the use of a Hewlett Packard 7045B X-Y recorder.
ii. Load versus Load-Line Displacement Curve Analysi.s
In order to establ:ish that valid Kic values had been
determined for each test. it was necessary to first calcu-
late a conditional result. KQ. This involved constructions
on the load versus load-line displacement curves recorded
during fracture toughness testing. values were deter-
mined for each specimen in accordance with ASTM Standard E
399-83 [47]. If both the specimen thickness and crack
2 length exceeded 2.5(KQ/crys> • where crys is the 0.2% offset

35
yield strength. then KQ was equal to Krc·
3. Fatigue Crack Growth Rate (da/dN) Test
a. Precracking
Fatigue precracking was done in accordance with ASTM
standard E 647-83 [53]. Two CT specimens from each heat
treatment were fatigue precracked prior to fatigue crack
growth rate testing. Fatigue precracking was performed on a
MTS 880 servohydraulic testing machine operating under load
control. Fatigue crack growth was measured with the aid of
a Gaertner 40X magnification traveling microscope. Polish-
ing of the faces of the CT specimens to a 1.0 micron finish
and the use of oblique illumination were found to enhance
crack observation. Reference marks were scribed on the spe-
cimens at 5.1 mm intervals perpendicular to the direction of
crack propagation. These marks were made to ensure that
potential measuring errors due to accidental movement of the
traveling microscope did not occur.
Failure to initiate precracking at the machined notches
was also encountered in precracking of the fatigue speci-
mens. This problem was remedied by using pseudo-chevron
notches. as discussed in Section I.1.

36
Fatigue precracking of the CT specimens from heat
treatments A. B. and C was initiated at P values of 3.34 max kN. 3.11 kN and 2.67 kN respectively. The specimens were
cycled at a frequency of 30 Hz using a sinusoidal tension-
to-tension cycle. with minimum-to-maximum load ratios not
exceeding 0.033. P values were stepwise reduced after max
measurable crack extensions. The reductions in P did not max exceed 20%. The terminal values of P were 1.60 kN. 1.42 max
kN. and 1.33 kN. In general. fin al p rec rack lengths (a)
were 1.91 cm for heat treatments A and C and 1.98 cm for
heat treatment B. Corresponding average K values for max
heat treatments A. B. and C were 7 .64 1/2 MPa •m • 7.03 1/2 1/2 MPa•m • and 6.32 MPa~m • respectively.
b. da/dN Determination
i. da/dN Testing
da/dN testing was done at room temperature (20°C) in
accordance with ASTM standard E 647-83 (53]. Testing was
carried out on a MTS 880 servohydraulic testing machine
operating under load control. The CT specimens were cycled
at 30 Hz using a sinusoidal tension-to-tension cycle. Each
specimen was tested at a constant range of load (6P). where
b.P = P - P with P. = 44.48 N for all three heat max min• min

37
treatments. P values for test specimens from heat treat-max
ments A. B. and C were 1.69 kN. 1.42 kN. and 1.38 kN respec-
tively. The minimum-to-maximum load ratios were 0.026.
0.031. and 0.032 for heat treatments A. B. and c. respec-
tively. Released tension loading was chosen in preference
to fully reversed loading to prevent the fatigue specimens
from slipping out of the pin and clevis fixtures. The final
K values during precracking did not exceed the initial max
K values for which test data was obtained. Crack length max
measurements were made within the following ASTM recommended
intervals [53]:
a < 0.04W for 0.25 < a/W < 0.40 a < 0.02W for 0.40 ( a/W ( 0.60 a < O.OlW for a/W >-0.60.-
ii. da/dN and Stress Intensity Range (~) Calculations
A f t e r c om p 1 e· t ion o f fat i g u e c rack g row t h t es t in g • t he
fracture surfaces were examined at the crack termination
points to determine the extent of through crack curvature
(tunneling). Three-point through-thickness average crack
lengths were calculated in accordance with Section 8.2.2 of
ASTM E 399-83 [47]. The differences between the optically meas-
ured crack lengths and the calculated average crack lengths
were the crack curvature corrections. Whenever one of the
crack curvature corrections resulted in a greater than 5%

38
difference in stress intensity at the crack termination,
this correction was employed when analyzing the data.
Values of da/dN were determined from the crack length
versus elapsed cycles (a versus N) data. The "a" versus "N"
data were processed via the secant method utilizing the com-
puter program provided in Appendix A.
The terminal crack length values and the crack length
values generated during the execution of the above program
were used to calculate (6K) corresponding to a given crack
growth rate. The expression used to calculate 6K was [53]:
PC 2 + a) 6K=~~~~~~~-[0.886 +4.64a -13.32a2 +14.72a3 -5.6a4 J.
where a = a/W. Computations of 6K were also made utilizing
the computer program provided in Appendix A.
4. Fractography
Fracture surfaces of the tested fracture toughness spe-
cimens were sputter coated with gold and examined using a
JEOL JSM-35C scanning electron microscope operated at 15kV
in the secondary electron imaging mode. Both the fatigue
p r e c r a c k r e g i on s a n d t h e o ·v e r 1 o a d r e g i on s we r e e x am i n e d a t
magnifications up to 5000X.

III. Results
A. Metallography
The microstructures of all three heat treatments were
comprised of small (0.5-4 micron diameter). uniformly dis-
tributed carbides in a matrix of tempered martensite (Figure
11). Small inclusions, likely manganese sulfides [4]. 1-10
microns in length were also observed in the microstructures
(Figure 12). These inclusions were elongated in the longi-
tudinal direction (i.e. parallel to the bar axis). Except
for the orientation of the sulfides, microstructures of the
radially and longitudinally oriented specimens were similar.
No evidence of retained austenite was detected via x-ray
diffraction in any of the three heat treatments.
One exception to the microstructural details described
above was found for the radially oriented specimens from
heat treatment B. which had small (0.5-4 micron diameter).
uniformly distributed carbides in a matrix of tempered mar-
tensite and ferrite (Figure 13). The ferrite phase was
identified from the diffraction peaks generated for retained
austenite determination. The amount of ferrite present in
the microstructure of RB-1 appeared to be greater than the
amount of ferrite in specimen RB-2. Small inclusions,
likely manganese sulfides [4]. ranging in size from 1-10
39

40
microns were also observed in the microstructures. No evi-
dence of retained austenite was detected in specimen RB-1.
The presence of ferrite in the two radially oriented
fracture toughness specimens from heat treatment B can be
explained with the aid of an Time-Temperature-Transformation
diagram (T-T-T curve). A T-T-T curve for CPM lOV austenit-
ized at 1150°C (2100°F) is shown in Figure 14 [55]. The
T-T-T curve shows the times required for austenite to start
and complete transformation to its respective products dur-
ing cooling at a constant temperature. This diagram is of
limited quantitative value when considering transformation
of continuously cooled specimens. but due to the unavaila-
bility of a continuous cooling diagram (C-T curve) the T-T-T
curve can be used to obtain qualitative information.
Another limitation of this T-T-T curve is the fact that it
was produced from samples heated to a higher austenitizing
temperature than heat treatment B {955°c (1750°F)}. Higher
austenitizing temperatures result in a greater dissolution
of alloy elements in the matrix. which subsequently affect
the locations of the transformation curves upon cooling. In
general. higher austenitizing temperatures raise the eutec-
toid transformation (Arl) temperatures. lower the martensite
start (M ) temperatures. and shift the pearlite (A+F+C) s
transformation curves to the right (i.e. to longer times)
[4.5]. The Arl transformation temperature of heat treatment

41
B would then be expected to be lower than the temperature
indicated in Figure 14 and the M s temperature would be
expected to be higher. The nose of the pearlite curve would
also be expected to have shifted to the left (i.e. to
shorter times).
Following the 955°c austenitizing treatment the CT
specimens were taken out of the furnace. removed from their
protective stainless steel foil. separated. and allowed to
air cool on a steel grating. If the assumption is made that
the specimens were either not separated or only partially
separated. then it is possible that at least two of the
specimens were cooled at a slower rate than the rest of the
specimens. This slower rate of cooling may have allowed the
specimens to pass through the nose of the pearlite transfor-
mation curve before proceeding through the bainite (not
rep resented) and ma rt ens it e transformation reg ions. Upon
subsequent tempering. the pearlitic structure transformed to
spheroidite and the bainitic and martensitic structures
transformed to their tempered structures. as shown in Figure
13.
X-ray analysis indicated that MC type vanadium carbides
were the only type of carbides in the tempered condition. in
agreement with the findings of Crucible Specialty Metals
[5 4] • Volume fractions (V ) v c and mean interparticle

42
spacings A for the carbides are shown in Table 4. Differ-
ences in (V ) and A for heat treatments A, B, and C were v c
not shown to be statistically significant. Specimen orien-
tation appeared to have little if any effect on either
(V ) or A , regardless of the heat treatment. v c
Prior austenite grain boundaries could not be etched to
reveal prior austenite grain sizes in the quenched and tem-
pered specimens. Vilel la's reagent and super p ic ral we re
reportedly used by Crucible Specialty Metals to reveal prior
austenite grain size in as-quenched CPM lOV [54]. These
etchants were found to be ineffective in resolving prior
austenite grain boundaries in these heat treated specimens.
In addition to these etchants, nital, picral, and saturated
aqueous picric acid were found to be ineffective. Prior
austenite grain boundaries are reportedly difficult to rev-
eal in high-carbon steels when a second phase constituent
does not outline the grain boundaries (4,56]. If the auste-
nite has been made homogeneous then the precipitation of
carbides at austenite grain boundaries upon cooling is
highly probablei however, if homogenization has not been
achieved and large amounts of undissolved carbide particles
remain, then carbide precipitation will take place on the
carbides and not the grain boundaries [4]. In the event
that carbide networks did surround the grain boundaries in
the as-quenched steel, tempering of the steel could conceiv-

43
ably result in dissolution of those networks. This could
explain why prior austenite grain boundaries were not
observed in the quenched and tempered specimens. Reported
Snyder-Graff [57] intercept grain sizes for as-quenched CPM
lOV austenitized at temperatures ranging from 955°C to
0 1010 C ranged from 18-20 [56].
B. Hardness
Hardness data are presented in Table 5. Hardness values
for the two radially ·oriented fracture toughness specimens
from heat treatment B were significantly lower than all
other measured values. These lower hardness values are the
result of the presence of ductile ferrite in the microstruc-
tures. occurring as the result of the error in heat treat-
ment described in Section A. The hardness of specimen RB-1.
372 HV500 (38 HRC). was probably lower than the hardness of
specimen RB-2. 400 Hv500 (41 HRC). because of the presence
of a larger amount of ferrite. Any further comparison of
fracture toughness values for the three heat treatments will
exclude these anomalous values. Hardness values increased
from heat treatment A to B to C as shown in Figure 15. Spe-
cimen orientation appeared to have little effect on the
hardness. regardless of the heat treatment.
Rockwell C hardness values are converted from Vickers hard-

44
ness values and as such represent at best approximate val-
ues. Kim (18], in his analysis of AISI M2 and VASCO-MA
steels found that conversion from Vickers hardness to Rock-
well C hardness via the conversion table found in ASTM E
140-78 (52] resulted in overestimations of hardness. Kim
found that Vickers hardness values could be related to
Rockwell C hardness values using the relationship:
ln [HV I 111.0] HRC =
0.0315
Converted Rockwell C hardness values, utilizing the above
relationship, have been included in Table 5.
C. Tensile Test
Stress-strain curves characteristic of heat treatments
A, B, and C are shown in Figure 15. Tensile properties are
summarized in Table 6 •. Very little scatter exists within
the data of each heat treatment. In general, strength
(both cr and UTS) increased from heat treatment A to B to ys
C, while engineering plastic strain (epl) decreased as shown
in Figure 16.

45
D. Fracture Toughness
Load versus load-line displacement curves for heat
treatments A, B, and C are shown in Figure 17. In all tests
performed the peak load P equaled PQ, the 5% secant line max
intersect load. The resulting fracture toughness data are
shown in Table 7.
Fracture toughness values for the two radially oriented
specimens from heat treatment B were significantly higher
than all other measured values. The reason for this
inc re as e is 1 ikely related to inc re as ed crack tip b 1 un ting
resulting from the presence of ductile ferrite in these
microstructures. Any further comparison of fracture tough-
ness values for the three heat treatments will exclude these
anomalous values.
For heat treatment A, the average fracture toughness
(Kic) value of longitudinally oriented specimens was approx-
• 1 2 MPa • m112 1mate y higher than the radially oriented
specimens. This difference is believed to be due to data
scatter and not the result of crack plane orientation. If
Kic was affected by crack plane orientation, Kic values of
longitudinal specimens should be lower due to the presence
of axisymmetric oriented inclusions. Fracture toughness
values of radial specimens was essentially the same as for

46
longitudinal specimens from heat treatment C. Kic values
decreased from heat treatment A to B to C as shown in Figure
16.
As mentioned earlier, plane-strain fracture toughness
tests were performed in accordance with ASTM Standard E
399-83 with one exception. ASTM procedure specifies that
during the terminal stage of precracking, last 2.5%, the
specimen should be loaded at a maximum stress intensity,
K f(max)• such that K f(max) does not exceed 60% This
stipulation is made to assure that the plastic zone size
during the final fatigue cycle is less than the plastic zone
size during the actual Kic test. High Kf(max) values can
blunt the fatigue crack too much leading to unconservative
values
from heat
74% K re·
[58,59].
treatments A,
respectively;
Terminal K max values
B. and C were 70% Krc•
therefore, terminal
for specimens
66% Kic, and
K values max
exceeded ASTM specifications. However, because of the low
ductility of these specimens, effects of crack tip blunting
on fracture toughness values are believed to be negligible.
The absence of a "stretch zone" between the fatigue precrack
region and the ductile overload region (Figure 18) further
supports this assumption.

47
E. Fatigue Crack Growth Rate
Fatigue crack growth rate data for each specimen is
provided in Appendix B. Fatigue crack propagation thresh-
olds, 6Kth' usually taken as da/dN = 10-lO m/cycle [64] were
not achieved.
The rate of fatigue crack growth as a function of stress
intensity range for specimens from heat treatment A is shown
in Figure 19. At low stress intensity levels, approximately
1/2 MPa· m , 8 fatigue crack growth rates were approximately
-9 10 m/cycle, approaching near threshold stress intensities.
As stress intensities increased, 1/2 8.3-19.4 MPa•m , fatigue
crack growth rates could be characterized by the Paris-
Erdogan relationship da/dN = A(&)n. Values of A, included
for completeness, and n are shown in Table 8. Variations in
the values of n, 3.04-4.44, are attributed to the normal
scatter of fatigue data. At stress intensities in excess of
1/2 20 MPa•m , fatigue crack growth rates rose very rapidly,
indicating that K!c controlled crack growth at high rates.
The rate of fatigue crack growth as a function of stress
intensity range for specimens from heat treatment B is shown
in Figure 20. Fatigue crack growth rates approaching 6Kth
were not achieved as in heat treatment A. At stress inten-
sities ranging from 7.5-14.8 MPa·m112 fatigue crack growth

48
rates obeyed the Paris-Erdogan relationship. Values of A
and n are shown in Table 8. Values of n varied from 3.96 to
4.55. At stress intensities in excess 1/2 of 15 MPa-m • crack
growth rate rose rapidly, indicating that Kic controlled
crack growth at higher growth rates.
The rate of fatigue crack growth as a function of stress
intensity range for specimens from heat treatment C is shown
in Figure 21. F at i g u e c rack g row t h r a t es a p p r o a c hi n g 6K t h
were not achieved as is heat treatment A. At stress inten-
sities ranging from 6.7-12.6 MPa-m 112 fatigue crack growth
rates obeyed the Paris-Erdogan relationship. Values of A
and n are shown in Table 8. Values of n varied from 3.95 to
4. 85. At stress intensities in excess of 13 MPa 0 m112 • crack
growth rose rapidly, indicating that Kic controlled crack
growth at higher growth rates.
F. Fractography
Scanning electron microscopy (SEM) showed that fracture
of the uniaxial tensile specimens proceeded by complex
transgranular paths as shown in Figure 22. Fracture sur-
faces where characterized by cleavage facets. tear ridges.
and voids associated with the carbides. Fracture topogra-
phies were similar for all three heat treatments, indicating
that carbide particles may have played a dominant role in

49
fracture propagation.
SEM observations of the fractured Kic specimens revealed
that fracture proceeded by complex transgranular paths as
shown in Figure 23. Fracture morphology was characterized
by quasi-cleavage facets, tear ridges, and voids associated
with the carbides. Fracture surfaces of heat treatments A
and B were more tortuous than heat treatment C. Fracture
surfaces of all Kic specimens were less tortuous than the
tensile fracture surfaces.
Fatigue crack propagation in the power law regime pro-
ceeded in a transgranular fashion as shown in Figure 24.
Fracture topography was characterized by carbides, micro-
voids, and planar facets. Ductile tearing, associated with
the carbide particles in the toughness specimens was less
pronounced in the fatigue specimens.
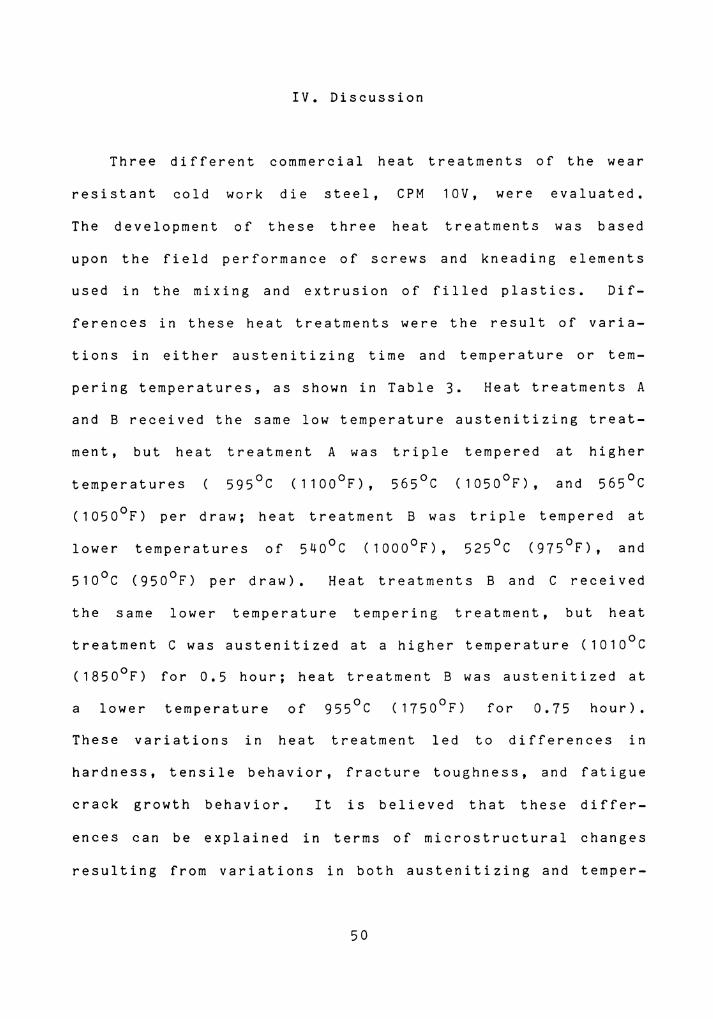
IV. Discussion
Three different commercial heat treatments of the wear
resistant cold work die steel, CPM 1 OV, were evaluated.
The development of these three heat treatments was based
upon the field performance of screws and kneading elements
used in the mixing and extrusion of filled plastics. Dif-
ferences in these heat treatments were the result of varia-
tions in either austenitizing time and temperature or tern-
pering temperatures, as shown in Table 3. Heat treatments A
and 8 received the same low temperature austenitizing treat-
ment, but heat treatment A was triple tempered at higher
temperatures 595°c ( 11 oo 0 F), 565°C ( 1050°F), and 565°C
( 1050°F) per draw; heat treatment 8 was triple tempered at
lower temperatures of 540°C ( 1000°F), 525°C (975°F), and
510°c (950°F) per draw). Heat treatments 8 and C received
the same lower temperature tempering treatment, but heat
treatment C was austenitized at a higher temperature (1010°C
(1850°F) for 0.5 hour; heat treatment B was austenitized at
a lower temperature of 955°c (1750°F) for 0.75 hour).
These variations in heat treatment led to differences in
hardness, tensile behavior,
crack growth behavior. It
fracture toughness, and fatigue
is believed that these differ-
ences can be explained in terms of microstructural changes
resulting from variations in both austenitizing and temper-
50

51
ing treatments.
A. Carbide Distributions
Microstructures of all three heat treatment were com-
prised of small (0.5-4 micron diameter) carbide particles
uniformly distributed in a matrix of tempered martensite.
Carbide volume fractions were approximately the same
(17-18%) for all three heat treatments. despite changes in
both austenitizing and tempering temperatures. A higher
austenitizing temperature is expected to enhance dissolution
of the primary carbides resulting in a decrease in the car-
bide volume fraction. Moreover. increases in tempering tem-
peratures are expected to result in an increase in the car-
bide volume fraction. This apparent contradiction can be
explained in terms of the inherent nature of both the pri-
mary and secondary carbides present in CPM lOV.
Qualitative information concerning the types of car-
bides present in CPM lOV in the annealed condition is not
available in the literature. Three types of carbides con-
ceivably could exist in CPM lOV in the annealed state: MC.
M6 c.
the
The letter M is
carbide contains more than
used here to
one metallic
indicate
alloying
that
ele-
ment. Most metallic alloying elements are at least slightly
soluble in each of these carbides. MC is a vanadium-rich

52
carbide which resists dissolution at temperatures below
1200°c and persists up until temperatures approaching the
melting point [4]. CPM lOV reportedly contains 12. 7% by
volume of MC type carbide [1,3]. M6 C is a tungsten- or
molybdenum-rich carbide that can contain moderate amounts of
vanadium and chromium [4]. In the case of CPM lOV, M6 c
would likely be a molybdenum-rich carbide. M6 C carbides
resist dissolution at temperatures below 1040°C, but
continued heating above 1040°C results in a steady decrease
in carbide volume fraction [4]. M23 c6 is a chromium-rich
carbide with a large solubility for iron and a somewhat
smaller solubility for tungsten and molybdenum.
carbides are almost entirely dissolved by 104o0 c [4].
Upon heating the annealed steel to 955°C (1750°F) for
0.75 hour a large percentage of the M23 c6 carbides are
expected to have entered into solid solution, while dissolu-
tion of M6 C and MC type carbides is expected to be minimal.
Heating the annealed steel to 1010°C (18S0°F) for 0.5 hour
is expected to result in additional dissolution of the M23 c 6
type carbides, but dissolution of M6 C and MC type carbides
is again expected to be minimal. The as-quenched micro-
structures are therefore expected to consist primarily of
MC and M6 C type carbides which are resistant to dissolution
at both the low and high austenitizing temperatures.

53
Diffraction peaks for MC type carbides were recorded
during the x-ray diffraction scan for retained austenite in
quenc bed and tempered CPM lOV. Howe v e r , d if fr act ion peaks
for M6 C and M23 c6 type carbides were absent, in agreement
with observations made by Crucible Specialty Metals (55].
The absence of M23 c6 type carbides might be expected due to
their high rates of dissolution at the temperatures
employed, but M6 c type carbides should not have dissolved
appreciably. M6 c type carbides apparently were not present
in the annealed structure; however, x-ray analysis of an
annealed piece of CPK lOV was not performed. Primary car-
bide populations of the three heat treatments must therefore
be comprised of MC type carbides. Since MC type carbides
resist dissolution at temperatures below 1200°c. primary
carbide populations of the three heat treatments should be
similar.
U · · h range 400°-565°c, pon tempering in t e temperature
precipitation of secondary carbides from the tempered mar-
tensite matrix occurs (4,5,11]. As the tempering tempera-
ture is raised, secondary carbide populations increase until
the secondary hardening peak temperature is reached. Beyond
the secondary hardening peak temperature, carbide coales-
cence occurs. Increased precipitation of secondary carbides
occurs in secondary hardening tool steels austenitized at
higher temperatures. This increase can be attributed to

54
increases in matrix alloy composition resulting from higher
austenitizing temperatures. In vanadium-rich tool steels,
MC type carbides precipitate upon tempering [4]. These car-
bides are typically very fine, 50-500 ~ in diameter [19,32,
57]. It is believed that at the magnifications used for
quantitative metallography, 1000X, these carbides were not
resolvable. Therefore, differences in secondary carbide
populations resulting from changes is both austenitizing
and tempering temperatures could not be detected.
Carbide volume fractions determined in this investiga-
tion must therefore represent primary carbide populations.
Under the assumption that MC type carbides are the only car-
bides present in the quenched and tempered specimens, as
supported by x-ray diffraction and Crucible Specialty Metals
[55], how can carbide volume fractions exceed the patented
quantity of MC type carbides (12.7% by volume) [1,3] present
in CPM 10V? At least two possible explanations for this
deviation exist: (1) M23 c 6 and M6C type carbides were
present in the quenched and tempered specimens, but went
undetected, (2) point counting resulted in an overestimation
of carbide volume fraction.
M23 c 6 carbides have been shown to dissolve entirely in
high speed tool steels at temperatures in excess of 1090°c
[4]. The austenitizing temperatures employed in this inves-

55
tigation were 150-250°C lower than this. and some of the
M23 c6 carbides are expected to remain undissolved. Con-
versely. M6 c carbides would not be expected to dissolve
appreciably until temperatures in excess of 1040°c. some
30-85°C higher than the austenitizing temperatures employed.
If the lower limit of detectability of each carbide phase by
x-ray diffraction was 1-2% by volume. then carbide volume
fractions of 17-18% are plausible.
The second explanation assumes that overestimations of
carbide volume fraction resulted from field choice. Due to
the small carbide size (0.5-4 micron diameter) high magnifi-
cat ion (1 OOOX) was required. at the expense of field size.
in order to clearly discern the carbides from the matrix.
In addition. photomicrographs had to be taken and enlarged
before quantitative metallography could be performed: there-
fore. only one field was used for point counting. If the
carbides were not uniformly distributed as assumed. then
field choice could result in either over- or underestimation
of the carbide volume fraction. High carbide volume frac-
tions may have resulted from overestimation. but it is
unlikely that field choice would overestimate for each con-
dition.

56
B. Hardness and Strength
Hardness measurements were taken using a Vicker's
indenter under a load of 500 grams. Indentations typically
included 15-25 carbides; therefore, hardness values were
representative of the composite material and not just the
matrix. Since differences between fracture and yield
strength were small, changes in hardness can be related to
changes in strength [60]. A high austenitizing temperature
in combination with low tempering temperatures (Heat Treat-
ment C), resulted in high hardness and strength. Con-
versely, a low austenitizing temperature in combination with
high tempering temperatures (Heat Treatment A), resulted in
low hardness and strength. A low austenitizing temperature
in combination with low tempering temperatures resulted in
intermediate hardness and strength. Differences in hardness
and strength can be rationalized in terms of the effects of
austenitizing and tempering temperatures on secondary har-
dening.
Secondary hardening involves the precipitation of an
alloy carbide from the tempered martensite at tempering tem-
peratures in the range 400-565°C, accompanied by pronounced
precipitation hardening [4,5]. In the case of high vanadium
tool steels, MC type carbides are responsible for secondary
hardening [4]. The shape of a tempering curve characteris-

57
tic of highly alloyed tool steels in which secondary harden-
ing is produced. is shown in Figure 24 [4.5.11]. Hardness
is shown to increase with increasing tempering temperatures
above 400°C up
hardness drops
until its peak hardness temperature. where
off rapidly. The increase in hardness is
associated with increased precipitation of the secondary
carbides. while the rapid decrease is due to coalescence of
the precipitates [ 4] • Higher austenitizing temperatures
shift the secondary hardening peak to higher hardnesses and
slightly higher tempering temperatures [4.5]. High austeni-
tizing temperatures enhance dissolution of primary carbides;
thereby increasing the matrix alloy composition. More alloy
is available for precipitation upon subsequent tempering.
resulting in more secondary carbide particles and higher
hardnesses.
CPM lOV austenitized at 1066°C exhibits a secondary
hardening peak at a tempering temperature of 510°C [55].
The austenitizing temperatures utilized in this investiga-
tion (955°C and 1010°C) were lower than this; therefore.
secondary hardness peak hardnesses and temperatures of all
three heat treatments are expected to be lower.
In heat treatment A. characterized by a low austenitiz-
ing temperature and high tempering temperatures. tempering
temperatures were in excess of the anticipated peak harden-

58
ing temperature. At these temperatures the precipitate par-
ticles began to coalesce and hardness and strength
decreased.
Heat treatment B is characterized by a low austenitizing
temperature and low tempering temperatures. It has the same
secondary hardening peak hardness as heat treatment A. but
because tempering temperatures are about the same as the
anticipated secondary hardening peak temperature. loss of
hardness and strength due to precipitate particle coales-
cence is not as pronounced as in heat treatment A.
In heat treatment c. characterized by a high austenitiz-
ing temperature and low tempering temperatures. the higher
austenitizing temperature resulted in a higher secondary
hardening peak hardness than in heat treatment A. Tempering
temperatures were slightly higher than the anticipated sec-
ondary hardening peak temperature. and loss of hardness and
strength due to precipitate particle coalescence was also
not as pronounced as in heat treatment A. As a result.
hardness and strength of heat treatment C was higher than
heat treatment A.
59
C. Toughness
Crack plane orientation had little affect on Kic values
of the heat treated CT specimens. This was expected because
of the uniform nature of the carbide distributions and the
absence of large inclusions in CPM lOV. If the presence of
the axisymmetric oriented inclusions had affected toughness,
Kic would have been lower in the longitudinal orientation
than in the radial orientation, which was not observed.
Values of Kic decreased going from heat treatment A to B to
C, indicating that the high tempering temperature produced
the highest fracture toughness and the high austenitizing
temperature produced the lowest fracture toughness.
SEM examination of the fracture surfaces of the Kic
surfaces revealed that fracture proceeded by complex trans-
granular fracture modes. The fracture surfaces of all three
heat treatments contained ductile dimples and some quasi-
cleavage facets, as shown in Figure 23. Quasi-cleavage
involves the formation of several small cleavage facets at
dispersed carbides in the tempered martensite, which are
then joined by ductile tearing [63] Dimpled rupture is
initiated by the formation of voids, as a result of decohe-
sion of the particle/matrix interface or as the result of
particle failure [58]. Cracked carbides were not observed
on the fracture surfaces of the Kic specimens; therefore,

60
carbide/matrix interface decohesion is believed to be the
primary mode of void formation. This is supported by the
presence of carbide particles in many of the ductile
dimples.
In general. Kic decreases with increasing yield strength
[58.59]. This observation can be rationalized in terms of
inc re as ing stresses at the carbide particle interfaces
within the plastic zone. As the yield strength increases.
more interfaces of smaller particles are likely to fail,
resulting in a higher density of voids [61,62]. Higher void
densities can more readily link up in a less tortuous frac-
This results in a lower value of Kic"
supporting this is shown in Figure 23 for heat treatment C
ture path. Evidence
which has a lower Kic and features a less tortuous fracture
surface than heat treatment A and B.
Analogous to the above explanation for decreasing Kic
with increasing yield strength is an explanation based upon
plastic zone size. Plastic zone size is calculated using
the relationship [59]:
r y
= _1 ( Kic) 2 6 TI a ys
Plastic zone size is a function of both Kic and yield
strength. Inc re as es in yield strength and/or dee re as es in

61
Kic can result in decreases in plastic zone size. Cal cu-
lated plastic zone sizes for the heat treated Kic specimens
are presented along with specimen hardness in Table 9. At a
low hardness (heat treatment A) I plastic zone size is
approximately twice the size of the plastic zone at higher
hardnesses (heat treatments A and B). Assuming a spherical
plastic zone and an average carbide particle diameter of 1
micron, the approximate number of particles present in the
plastic zone are 270, 30, and 12 for heat treatments A, B.
and C, respectively. (Note: The assumption of an average
carbide particle diameter of 1 micron was made solely for
comparative purposes. In reality, carbide particle diame-
ters ranged in sizes from approximately 0.5-4 microns.)
Heat treatment A has a diffuse plastic zone ahead of the
crack tip. as emphasized by plastic zone size and also the
number of particles contained within the plastic zone.
Stresses at the carbide/matrix interfaces are not sufficient
to cause decohesion at the smaller particles. and crack pro-
pagation must proceed by ductile tearing between the nearest
void and the crack tip. Thus 1 an inc re as e in energy is
required for unstable crack propagation, i.e. the crack
resistance (K 1 c) is higher. Conversely. heat treatment C
has a very small plastic zone ahead of the crack tip.
Because of this small plastic zone size and the small number
of carbide particles. stress is concentrated at the car-

62
bide/matrix interfaces, promoting microvoid nucleation at
smaller particles. Higher void densities result, and as was
the case for materials with higher yield strength, higher
void densities result in lower values of Kic"
In heat treatment B, the plastic zone size is slightly
larger than in heat treatment c. Based upon the current
model, Kic values of specimens from this heat treatment
should be comparable to those of heat treatment C, as is the
case. However, fracture topography is more characteristic
of heat treatment A (Figure 23a,b). Apparently, the
stresses are insufficient to cause decohesion at the same
size carbides as in heat treatment C, but sufficient to
cause decohesion at carbides smaller than in heat treatment
A.
In our study, Kic was shown to decrease linearly with
increasing hardness (Figure 26) • Several investigators
(18-20,29] of high speed tool steels have observed similar
inverse relationships between Kic and hardness at hardnesses
in excess of 600HV (55HRC). Reasons for this inverse rela-
tionship between Kic and hardness at high hardness levels
were not given. In the case of heat treated CPM lOV, frac-
ture modes of all three heat treatments are the same: pri-
marily ductile rupture with some quasi-cleavage. Differ-
ences in fracture topography are the result of increasing

63
void densities at higher hardnesses and not the result of
changes in fracture mode. Therefore. changes in hardness
are not expected to result in drastic changes in Krc·
D. Fatigue
Crack plane orientation had little effect on the value
of fatigue crack growth exponent. n. This was expected
because of the uniform nature of the carbide distributions
and the absence of large inclusions in CPM lOV. In addi-
tion. values of n were virtually unchanged for the various
conditions tested. Average values of n for the various heat
treatments did increase slightly with increasing hardness.
but scatter in the data precluded any conclusions based upon
these average values. Previous studies [20.22.23.29] of
high alloy tool steels showed that n increased with increas-
ing hardness. but these tests were performed at higher hard-
ness levels.
Fracture surfaces of the fatigue specimens consisted
primarily of planar transgranular facets as shown in Figure
24. Debonded carbides and voids from which the carbides had
been removed were evident. A limited amount of plastic
deformation existed around the carbides. Broek [58] states
that second phase particle.s are not expected to influence
crack growth rates until crack growth rates exceed 10-3

64
mm/cycle. At crack propagation rates in excess of 10-3
mm/cycle. particles ahead of the crack tip may either cleave
or loose coherency with the matrix due to increased stress
concentration at the crack tip. This results in the forma-
tion of voids. which may link up by ductile tearing. result-
ing in higher crack growth rates.
Crack propagation rat es encountered in this invest iga-
tion were -4 10 mm/cycle and lower during the linear portion
of fatigue crack growth. Evidence of debonded carbides and
microvoids on the fracture surfaces indicates that stresses
were sufficient at these crack growth rates to cause decohe-
sion of the carbides with the matrix. Ductile tearing
existing between some of these voids may have locally facil-
itated fatigue crack growth. but it is not expected to have
affected the overall crack growth rate. Lou and Averbach
[23] postulated that fatigue crack propagation rates
depended upon the strength and ductility of the matrix.
Differences in strength and ductility existed for the vari-
ous heat treatments. but these differences were apparently
not sufficient to affect crack growth rates.
The linear portion of the fatigue curves (i.e. the Paris
region). shifted to higher stress intensity ranges with
increasing fracture toughness as shown in Figure 27. How-
ever. changes in fracture toughness did not result in sig-

65
nificant differences in fatigue crack growth rate. Appar-
ently. factors affecting fracture toughness. primarily mat-
rix strength and ductility. did not have a significant
effect on crack growth rate under the conditions tested. As
stress intensities approached the Kic values of the respec-
tive heat treatments. crack growth rates rose sharply. This
indicates that crack growth at high rates was mainly con-
trolled by the fracture toughness.

V. Conclusions
The experimental and analytical investigation of the behav-ior of CPM lOV has demonstrated the following:
1. The fracture toughness of the alloy is decreased as the austenitizing temperature is increased. This effect is caused by the increased yield strength and the resulting decreased plastic zone size at the crack tip.
2. The fracture toughness of the alloy austenitized at 955°C was increased by increasing the tempering temperatures. This effect is also caused by the role of yield strength in determining crack tip plastic zone size.
3. The fracture toughness which results from any of the three heat treatments is inversely related to the hard-ness. Again. this relationship results because the strength increases and plastic zone size decreases as the hardness increases.
4. Fatigue crack growth for all three heat treatments fol-lowed the Paris Law for some portion of the curve and crack growth rate exponents. n. were virtually unchanged by the heat treatment.
5. The linear portion of the growth curve was shifted to higher stress intensity ranges for heat treatments yiel-ding higher fracture toughness.
6. Fatigue crack growth behavior was determined mainly by the specific heat treatment.
66
in the high growth region fracture toughness of the

References
1. A. Kasak and E.J. Dulis. "Powder-Metallurgy Tool Steels." Powder Metallurgy. 1978. no. 2. pp. 114-123.
2. K.G. Budinski. "Wear of Tool Steels." Wear of Materials 1977. International Conference on Wear of Materials. St. Louis. Missouri. April 25-28. ASME. pp. 100-109.
3. Robert B. Dixon. "Advances in the Development of Wear-Resistant High-Vanadium Tool Steels for Both Tooling and Non-Tooling Applications." 1982 ASM Metals Congress. St. Louis. Missouri. October 23-28. ASM Paper No. 8201-085.
4. G. Roberts and R. Cary. Tool Steels. 4th edition. Metals Park. Ohio: ASM. 1980.
5. Robert Wilson. Metallurgy and Heat Treatment of Tool Steels. London: McGraw Hill Publishing Company. 1975.
6. A. Kasak. G. Steven. and T.A. Neumeyer. "High-Speed Tool Steels by Particle Metallurgy. SAE Paper 720182. 1972.
7. J.J. Obrzut. "PM Tool Steels Come Out Swinging." Iron Age. January 14. 1971. pp. 51-53.
8. E.J. Dulis and T.A. Neumeyer. "New and Improved High-Steel Tool Steels by Particle Metallurgy." Progress in Powder Metallurgy. vol. 28 •• Proceedings 1972 National Powder Metallurgy Conference. pp. 71-76.
9. C.L. Kobrin. "Tool Steels Take the Powder Route." Iron Age. December 7. 1967. pp. 51-53.
10. E.J. Dulis. "High Speed Tool Steels by Particle Metal-lurgy." Powder Metallurgy for High Performance Applica-tions. Proceedings of 18th Sagamore Army Materials Conference. August 31 - September 3. 1971. pp. 317-329.
11. Robert E. Reed-Hill. Physical Metallurgy Principles. 2nd edition. Monterey. California: Brooks/Cole Engineering Division. 1973.
12. P. Hellman. "The ASEA-STORA Process [of Producing High-Speed Steel by Powder Metallurgical Techniques." Iron and Steel. Special Edition. 1970. pp.49-52.
67

68
13. R.G. Shephard, J.D.P. Harrison, and L.E. Russel, "The Fabrication of High-Speed Tool Steel by Ultrafine Powder Metallurgy," Powder Metallurgy, vol. 16(32), 1973, pp. 200-219.
14. L.R. Olsson. V. Lampe, and H. Fischmeister, "Direct Forging of High-Alloy Steel Powders to Bar Stock." Powder Metallurgy, vol. 17(34), 1974, pp. 347-362.
15. T.A. Neumeyer and A. Kasak. "Grain Size of High-Speed Tool Steels." Metallurgical Transactions, vol. 3, 1972. PP• 2281-2287.
16. G. Steven. "Nonuniform Size Changes of High Speed Steels During Heat Treatment." Trans. ASM, vol. 62, 1969, p. 130.
17. A.R. Johnson. "Fracture Toughness of AISI M2 and AISI M7 High-Speed Steels." Metallurgical Transactions A, Volume BA, June 1977, pp. 891-897.
18. Chongmin Kim. A.R. Johnson. and W.F. Hosford, "Fracture Toughness of AISI M2 High-Speed Steel and Corresponding Matrix Tool Steel." Metallurgical Transactions A, Volume 13A, September 1982, pp. 1595-1605.
19. S.C. Lee and F.J. Worzala. "Fracture Behavior of AISI M2 High Speed Tool Steel." Metallurgical Transactions A, Volume 12A, August 1981, pp. 1477-1484.
20. G. Berry and M.J. Kadhim Al-Tornachi. "Toughness and Toughness Behavior of Two High-Speed Steels," Metals Technology, June 1977. pp.289-295.
21. Kjell Eriksson, "Fracture Toughness of Hard High-Speed Steels, Tool Steels and White Cast Iron," Scandinavian Journal of Metallurgy, (2), 1973, pp. 197-203.
22. J.A. Rescalvo and B.L. Averbach. "Fracture and Fatigue in M-50 and 18-4-1 High Speed Steels," Metallurgical Transactions A, Volume lOA, September 1979,pp.1265-1271.
23. Bingzhe Lou and B.L. Averbach, "Fracture Toughness and Fatigue Behavior of Matrix II and M-2 High Speed Steels." Metallurgical Transactions A, Volume 14A, Sep-tember 1983, pp. 1889-1898.
24. C.S. Wright, A.S. Wroniki, and M.M. Rebbeck, "Strength and Toughness of T-42 High-Speed Steel." Metals Tech-nology, Volume 11. May 1984, pp. 181-188.
69
25. Hakan Johansson and Roger Sandstrom. "Fracture Behavior and Fracture Toughness of M2 High Speed Steel." Mate-rials Science and Engineering. 36. 1978. pp.175-180.
26. Hakan Johansson and Roger Sandstrom. "Elevated Temper-ature Fracture Toughness and Critical Flaw Analysis of a Powder Metallurgical High Speed Steel." Materials Science and Engineering. 34. 1975. pp. 165-169.
27. H.F. Fischmeister and L.R. Olsson. "Fracture Toughness and Rupture Strength of High Speed Steel." Cutting Tool Materials [Proc. Conf.]. Ft. Mitchell. KY. 15-17 Septem-ber 1980. Metals Park. Ohio: American Society for Metals. pp.111-131.
28. L.R. Olsson and H.F. Fischmeister. "Fracture Toughness of Powder Metallurgy and Conventionally Produced High-Speed Steels." Powder Metallurgy. 1978. No. 1. pp. 13-28.
29. S.A. Horton andf H.C. Child. "Relationship Between Structure and Fracture Behavior in 6W-5Mo-2V Type High-Speed Steel." Metals Technology. Volume 10. July 1983. pp. 245-256.
30. M.E. Bush and R. Ward. "High-Speed Steels for Cold For-ming Tools." Metallurgia and Metal Forming. January 1974. pp. 17-22.
31. E. Tekin. "Microstructural Aspects of Fracture in High Speed Steels." Microstructural Science. Volume 10. 1982. pp.151-171.
32. K. Firth and R.D. Garwood. "Fractography and Fracture Toughness of 5%Cr-Mo-V Ultra-High-Strength Steels." Fracture Toughness of High-Strength Materials: Theory and Practice. !SI Publication 120. London: !SI. 1970. pp. 81-89.
33. D.O. Harris and M.L. Dunegan. "Fracture Toughness of Beryllium." Journal of Materials. Volume 3. 1968. pp. 59.
34. D.J. Blickwede. M. Cohen. and G.A. Roberts. "The Effect of Vanadium and Carbon on the Constitution of High Speed Steel." Transactions of the ASM. Volume 42. 1950, pp. 1161-1196.
35. D. Webster, "Increasing the Toughness of the Martensitec Stainless Steel AFC77 by Control of Retained Austenite

70
Content." Transactions of the ASM. Volume 61. 1968. pp. 816-828.
36. G.Y. Lai. W.E. Wood. R.A. Clark. V.F. Zackay. and E.R. Parker. "The Effect of Austenitizing Temperature on the Microstructure and Mechanical Properties of As-Quenched 4340 Steel." Metallurgical Transactions A. Volume 5. July 1974. pp. 1663-1670.
37. Gareth Thomas. "Retained Austenite and Tempered Marten-site Embrittlement." Metallurgical Transactions A. Vol-ume 9A. March 1978. pp. 439-450.
38. R.M. Horn and R.O. Ritchie. "Mechanics of Tempered Mar-tensite Embrittlement in Low Alloy Steels." Metallurgi-cal Transactions A. Volume 9A. August 1978. pp. 1039-105 3.
39. G.Y. Lai. "Short Communications: On High Fracture Toughness of Coarse-Grained AISI 4130 Steel." Materials Science and Engineering. Volume 19. May 1975. pp. 153-15 6.
40. Karl-Heinz Zum Gahr. "The Influence of Thermal Treat-ments on Abrasive Wear Resistance of Tool Steels." z. Metallkde .• 68. 1977. pp. 783-791.
41. M. Cohen and P.K. Koh. "The Tempering of High Speed Steel." Transactions of the ASM. Volume 27. 1939. p. 1015.
42. Spirex Corporation. Youngstown. Ohio. [Pamphlet].
43. S.T. Rolfe and J.M. Barsom. Fracture and Fatigue Control in Structures: Applications of Fracture Mechanics. Englewood Cliffs. New Jersey: Prentice Hall. Inc. 1977.
44. Metals Handbook: Failure Analysis and Prevention. 8th edition. vol. 10. Metals Park. Ohio: ASM. 1975.
45. A. Kasak and T.A. Neumeyer. "Observations on Wear of High-Hardness Steels." Wear. 14. 1969. pp. 445-454.
46. G. Steven and J.P. Catlin. "A Controlled Dry Wear Test for High Hardness Tool Steels." Journal of Materials. vol. 1(2). June 1966. pp. 293-313.

71
47. ASTM E 399-83, "Standard Test Method for Plane-Strain Fracture Toughness of Metallic Materials." 1984 Annual Book of ASTM Standards. American Society for Testing and Materials, 1984, vol. 3.01. pp. 519-553.
48. ASTM E 8-83. "Standard Methods of Tension Testing of Metallic Materials." 1984 Annual Book of ASTM Standards. American Society for Testing and Materials. 1984. vol. 3.01. pp.130-150.
49. ASTM E 562-83. "Standard Practice for Determining Volume Fraction By Systematic Manual Point Count." 1984 Annual Book of ASTM Standards. American Society for Test-ing and Materials. 1984. vol. 3.03. pp. 518-524.
50. Metals Handbook: Metallography. Structures and Phase Diagrams. 8th edition, vol. 8. Metals Park, Ohio: ASM, 1973.
51. ASTM E 975-84. "Standard Practices for X-Ray Determina-tion of Retained Austenite in Steels With Near Random Crystallographic Orientation," 1984 Annual Book of ASTM Standards, American Society for Testing and Materials. 1984, vol. 3.03, pp. 787-794.
52. ASTM E 140-83 1 "Standard Hardness Conversion Tables for Metals," 1984 Annual Book of ASTM Standards. American Society for Testing and Materials, 1984. vol. 3.01, P. 301.
53. ASTM E 647-83 1 "Standard Test Method for Constant-_ 8 Load-Amplitude Fatigue Crack Growth Rates Above 10 m/Cycle." 1984 Annual BooK of ASTM Standards. American Society for Testing and Materials. 1984. vol. 3.01, pp. 519-553.
54. John Hauser, Crucible Specialty Metals Division, Colt Industries, personal communication, March 1987.
55. "Crucible Data Sheet." Issue #4. Crucible Specialty Metals Division, Colt Industries. Syracuse, New York.
56. Robert Dixon. Crucible Specialty Metals Division, Colt Industries, personal communication, November 1986.
57. R.W. Snyder and H.F. Graff, "Study of Grain Size in Har-dened High Speed Steel~" Metal Progress. April 1938, p. 377.
58. D. Broek. Elementary Fracture Mechanics, Leyden: Noord-

72
hoft International Publishing, 1974.
59. J.F. Knott, Fundamentals of Fracture Mechanics, New York: Halsted Press, 1979.
60. G.E. Dieter, Mechanical Metallurgy. 2nd Edition, McGraw Hill, Inc.: New York, New York, 1976, p.370.
61. H.L. Ewalds and R.J.H. Wanhill, Fracture Mechnaics, Edward Arnold (Publishers) Ltd.: London, UK, 1984.
62. A.S. Tetelman and A.J. McEvily, Jr. 1 Fracture of Struc-tural Materials, John Wiley and Sons, Inc.: New York, New York, 1967.
63. I. LeMay and C. Bagnall, "Brittle Fracture and Fracto-graphy," Microscopy. Fractography and Failure Analysis [Confrence Proceedings]. 3-4 August 1986. Boston, Mass ••
64. R.C. Brown and N.E. Dowling, "Automatic Decreasing Stress-Intensity Fatigue Crack Growth Rate Testing Using Low-Cost Circuitry," ASTM STP 738, American Society for Testing and Materials: Philadelphia. PA •• 1981. pp.58-69.

*
TABLE 1: * Nominal Chemical Composition
of CPM lOV
Carbon Manganese Silicon Chromium Vanadium Molybdenum Sulfur
weight percent
73
2.45 0. 5 0 0.90 5.25 9.75 1. 30 0.07

74
TABLE 2: THERMAL TREATMENTS OF CPM-lOV
----~------------~----------------------~-------~---
TREATMENT A TEMPERATURE ( OC) TIME (hr)
Preheat 845 1. 0 Austenitize 955 0.75
Triple Temper Draw ill 595 2.0 Draw i/2 565 2.0 Draw ii 3 565 2.0
TREATMENT B
Preheat 845 1. 0 Austenitize 955 0.75
Triple Temper Draw ill 540 2.0 Draw ii 2 5 25 2.0 Draw 113 510 2.0
TREATMENT c Preheat 845 1. 0 Austenitize 1010 0.5
Triple Temper Draw 111 540 2.0 Draw 112 5 25 2.0 Draw 113 510 2.0
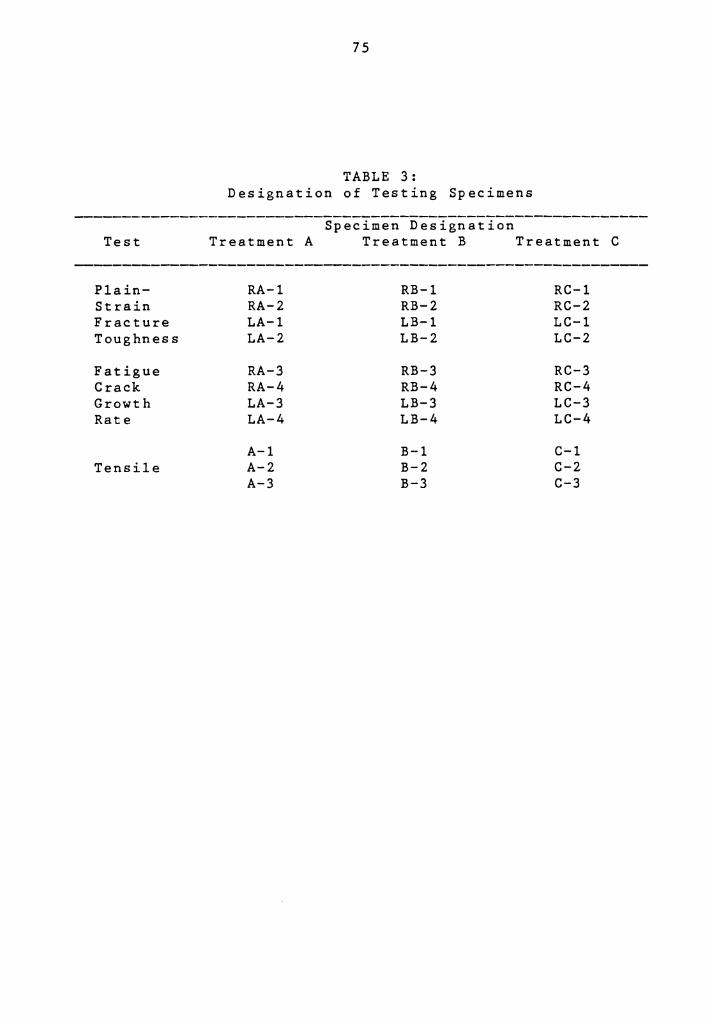
75
TABLE 3: Designation of Testing Specimens
Specimen Designation Test Treatment A Treatment B Treatment C
Plain- RA-1 RB-1 RC-1 Strain RA-2 RB-2 RC-2 Fracture LA-1 LB-1 LC-1 Toughness LA-2 LB-2 LC-2
Fatigue RA-3 RB-3 RC-3 Crack RA-4 RB-4 RC-4 Growth LA-3 LB-3 LC-3 Rate LA-4 LB-4 LC-4
A-1 B-1 C-1 Tensile A-2 B-2 C-2
A-3 B-3 C-3

1
76
TABLE 4: Carbide Distributions for Heat
Treated CPM 10V
Specimen
RA-1 RA-2 LA-1 LA-2
RB-1 2 RB-2 2 RB-3 3 LB-1 LB-2
RC-1 RC-2 LC-1 LC-2
( v ) v c
%
18.9 ±2.16 17.5 ±1.95 18.7 ±1.46 18.3 ±1.81
18.0 ±1.63 15.4 ±2.06 17.2 ±2.13 15.5 ±1.48 1 7 • 0 ± 1 • 9 1
16.7 ±2.03 18.5 ±1.47 17.1 ±1.72 15.9 ±2.10
18.4 +2.1
4 16.6 :t2.2
17.1 :t2.2
µm
4 • 1 5 5 • 1 2 4.25 4.62
4.74 6.43 4.76 5.46 4. 9 3
5.07 4.99 4.97 5.07
2 mean values based upon 30 samples 3 specimens subjected to heat treatment anomally 4 fatigue crack growth rate specimen
excludes specimens RB-1 and RB-2 from mean

77
TABLE 5: Hardness Values for Heat Treated CPM lOV
Specimen HV500 Hardnrss
HRC HRC 2
~~----~--~--~----------------------------------RA-1 524.2 50.8 49.3 RA-2 517. 1 50.3 48.9 LA-1 5 21. 2 5 0. 5 49.1 LA-2 499.5 49.1 47.8
RB-1 3 372.0 38.0 38.4 RB-2 3 399.4 40.7 40.7 RB-3 4 602.1 55.4 53.7 LB-1 611. 4 55.9 54.2 LB-2 626.6 56.7 55.0
RC-1 693.5 59.9 5 8. 2 RC-2 707.5 6 0. 5 5 8. 8 LC-1 703.3 60.3 5 8. 6 LC-2 688.9 59.7 5 8. 0
~ converted hardness values using ASTM table (52] converted hardness values using Kim's relationship
3 ( 18] 4 low hardness values due to heat treatment anomally
fatigue crack growth rate specimen

78
TABLE 6: Tensile Test Properties for Heat Treated CPM lOV
---~------~-----------------~-~-----~--~----~-----~-0.2 Pct Offset Fracture Plastic Strain Specimen Yield Strength Strength e pl Epl
MP a ksi MP a ksi % %
----~~~-------------~-------~--------------------------A-1 1592.7 231. 0 1654.7 240.0 3.44 3.38 A-2 1398.2 202.8 1628.5 236.2 3.14 3.09 A-3 1445.1 209.6 1663.7 241. 3 3. 01 2.97
B-1 1729.2 25 0. 8 1975.3 286.5 1. 80 1. 7 8 B-2 1734.7 25 1. 6 1966.4 285.2 1. 86 1. 84 B-3 1751.9 25 4. 1 1995.3 289.4 1. 84 1. 82
C-1 1741.7 25 3. 4 2185.6 317.0 1. 84 1. 82 C-2 1924.3 2 7 9. 1 2176.7 315.7 1. 43 1.42 C-3 1931.2 280.1 2229.7 323.4 1. 7 2 1. 71

79
TABLE 7: Plane Strain Fracture Toughness (K 1c)
for Heat Treated CPM lOV
~------------------K~~-~~--------(K~:r:~~------
s p e c i men Mp 1/2 (k .. 1/2) MP 1/2 (k .. 1/2) a·m si·in a·m si·in
~=1-------21:05----119:16)-~~-~---------~-----
RA - 2 20.31 (18.48) 21.59 (19.65) LA-1 22.05 (20.07) LA-2 22.96 (20.90)
RB-1 1 • 2 39.04 (35.53) RB-2 1 34.65 (31.35) (16.44) 3 LB-1 18.06 (16.44) LB-2 18.06 (16.44)
RC-1 16.06 (14.62) RC-2 16.33 (14.86) 16.32 (14.85) LC-1 16.48 (15.00) LC-2 16.39 (14.92)
1 2 high K1 values due to heat treatment anomally
K1 vaIGe underestimated 3 ex§ludes specimens RB-1 and RB-2 from mean

80
TABLE 8: Fatigue Crack Growth Characterization
for Heat Treated CPM 10V
Specimen A 1/2 n da/dN(m/cycle) = A(wKI MPa·m )
A n n avg
RA-3 -12 3.59 2.16x1o_ 13 RA-4 2.41x10_12 4.44 LA-3 5.97x1o_ 12 3. 1 6 LA-4 8.88x10 3.04
3.56 :t0.63
RB-3 -13 4.55 4.95x10_ 13 RB-4 9.22x10_ 12 4 • 1 4 LB-3 1.79x10_ 12 3.96 LB-4 1.10x10 4.06
4.18 "!0.26
RC-3 -12 4. 1 2 1.43x10_ 13 RC-4 2.64x10_ 13 4.85 LC-3 7.37x10_ 12 4 • 5 1 LC-4 1.89x10 3.95

81
TABLE 9: Carbide Interparticle Spacing Versus
Plastic Zone Size
Specimen HV500 \( µm) r ( µm) y
~--------~~--------------~~--~------~~~~ RA-1 524.2 4.15 10.8 RA-2 517.1 5.12 10.0 LA-1 521.2 4. 25 11. 8 LA-2 499.5 4.62 12.8
1 RB-1· -----RB-2 1 -----LB-1 611. 4 5.46 5.72 LB-2 626.6 4.93 5.72
RC-1 693.5 5.07 3.93 RC-2 707.5 4.99 4.06 LC-1 703.3 4.97 4.14 LC-2 688.9 5.07 4.09
1 excluded due to heat treatment anomally

/ /
/
Figure 1. Precracking technique by Impact Method.
82

Figure 2.
83
Screw (upper) and kneading element (lower) used in the manufacturing of reinforced plastics.
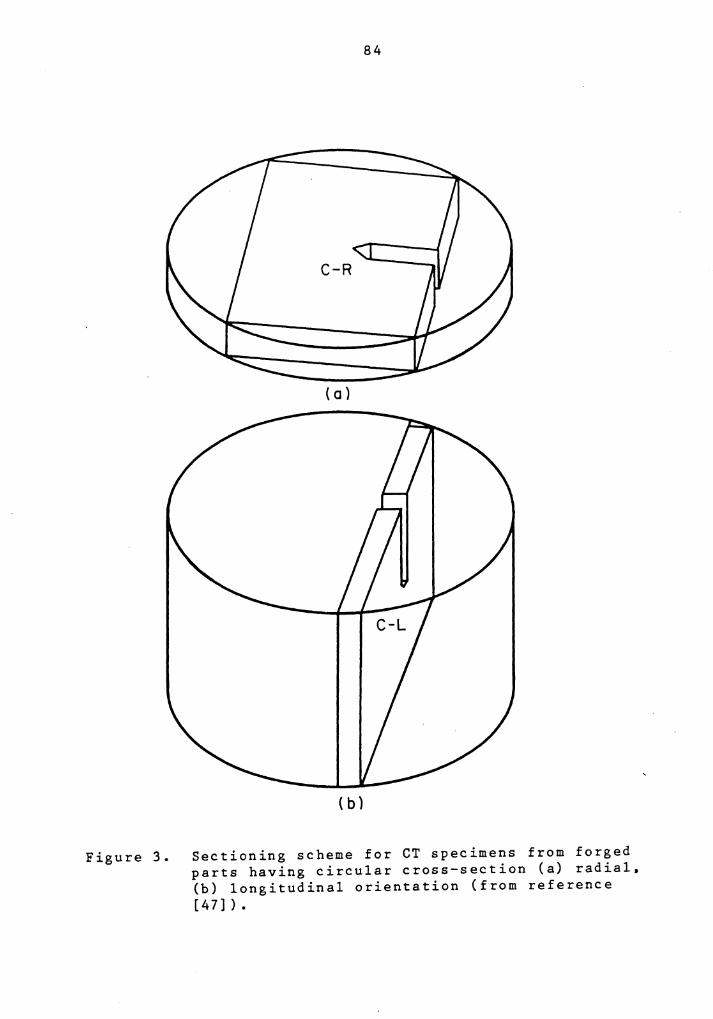
84
C-R
(a)
( b)
Figure 3. Sectioning scheme for CT specimens from forged parts having circular cross-section (a) radial, (b) longitudinal orientation (from reference [47]).

------------~ fo.250
±0.001
85
8 --
8 0.500 - r-±0.02
2.00±0.01 -1 2.50±0.02
0.55 ±0.01
0.55 ±0.01
Figure 4. Compact tension specimen configuration and dimensions.
r 1.20
±0.01
1.20 ±0.01
l

86
6.25 ±0.03
I W---13
mm
25mm
13 mm ,... _________ 75 _________ ..
mm
t 13
mm t
mm
Figure 5. Standard round machined tension test specimen for P/M parts (from Reference [5 2]) •

Figure 6.
87
0
Surface Tested for Hardness
Sectioning scheme of fracture toughness specimens for microhardness determina-tion.

Figure 7.
88
• • • • • • • • • • • • • • •
_L. • • • • 2 cm 1· • • • •
--12cm~
Open square grid used for the determina-tion of ~arbide distributions.
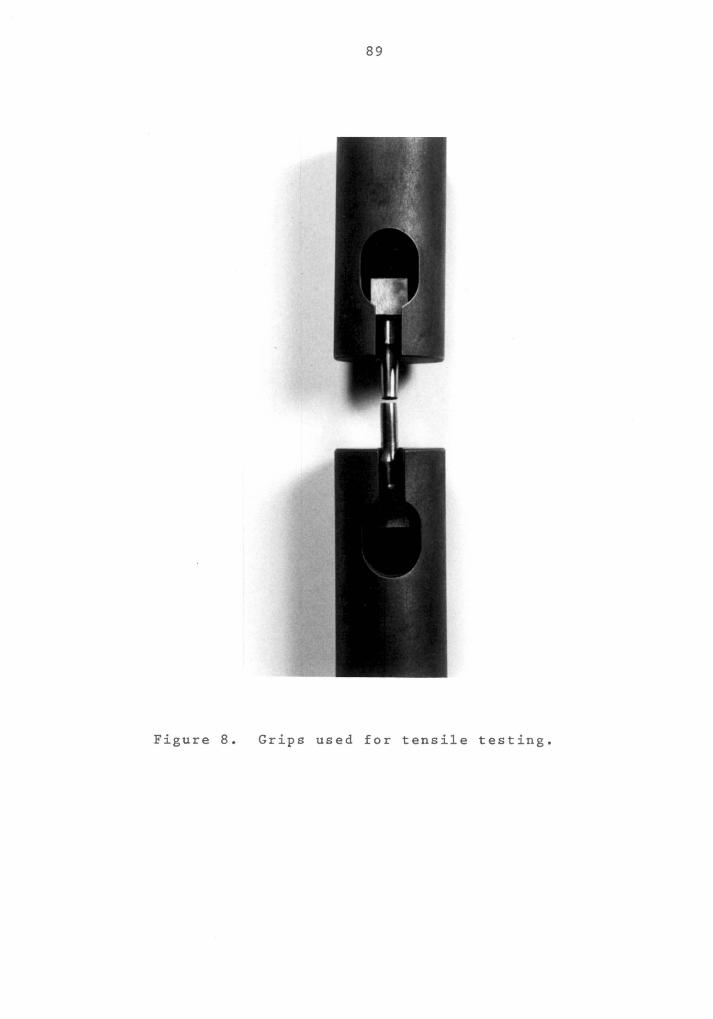
89
Figure 8. Grips used for tensile testing.

90
Saw Tooth 0 ~< 0
- ~
3.2 mm-1
11 Machined
It Notch Saw cut~
notch
Figure 9. Saw notched (0.4mm) compact tension specimen.

91
1.0
0.8
-
4.5
4.0
3.5 -z .:it:
~ 3.0-
.:it: - 0.6 "'O 0
"'O 0 0 ..J 0.5
0.4
0.3
0.2 End of
0.1 Machined Notch
2.5 .3 r-= 2.0 13.7 MPavm .
End of Precrocking for Toughness
1.0
0.5
0.0'--_.... _ __. __ ..&--_--1-_--1.,_--J.__ ____ ~
0.25 0.30 0.35 0.40 0.45 0.50 a/w
Figure 10. Fatigue precrack loading scheme for compact tension specimens from heat treatments A. B, and C.

92
Figure 11. Microstructures of CPM lOV: thermal treatments (a) A. (b) B. and (c) C.

93
Figure 12. Manganese sulfide inclusions [4] in microstructure of heat treated CPM lOV.

94
Figure 13. Microstructures of CPM lOV specimens sub-jected to heat treatment anomally, (a) RB-1, (b) RB-2 (etch: Super Picral).

95
TIT Curve
160 0
150 0
140 0
1300
1200
1100
1000
t 900
" :; ;< 800 Q; .. E ~ 700
600
500
400
300
200
Grade: CPM 10V Austen1lizing Temperalure· 2100°F/ 10 min Cri11cal (Ac 1) Temperature: 1540°F Prior Cond1t1on: Annealed
Ac=1540F
A
Ms=330F
Seconds 11 I I
A· Auslernle F- Ferrite C· C•rb•oe M-MttrtP.nslle
~~ --I/ v
I A .. F ... c
""l'--o ...
. -· -Minules 11 I I
~
......... F + C ...... I
I"'---..,
Hours 11 I I
11122 3. 56 110 1520 30 H 60 11/22 3. 56 110 •5 20 JO •S 60 11122 3. 56 a 10 15 20 JO •s 60
Time
Figure 14. TTT curve (2100°C)
for CPM lOV austenitized at 1150°C for 10 minutes (from Reference [55]).

96
Figure 15. Stress versus strain curves characteristic of heat treatments A. B. and C.

HARDNESS
0.2 °/o crys
UTS
ep1
n (Crack Growth) Exponent
97
t 98 HV500 85 HV500 A (6HRC) Bf (4HRC) C
A f 260 MPa 8 t 130 MPa c
A f 330 MPa B f 220 MPa C
A ! I .4 % B l 0. 2 °/o C
A !4MPovm9l2MPav'm c
A f 0.6 8 t 0.4 c
Figure 16. Mean deviations in mechanical properties of CPM lOV as a function of heat treatment.

98
Displacement (mm)
0.8 0.25 0.50 0.75 1.00
3.5
0.7 3.0
0.6 2.5 -~ 0.5 z
.¥ .¥ 2.0 - -a
0 -a 0.4 0 0 ...J 0
...J 1.5
0.3
1.0 0.2
0.1 0.5
0.0 I 0.02 0.03 0.04 Displacement (in)
Figure 17. Load versus displacement curves character-· istic of heat treatments A, B 1 and C.

99
Figure 18. Transition zone between fatigue pre-crack region (top) and overload region (bottom) of specimen from heat treat-ment A.

100
~K, MPo 0Ti 6 7 8 9 10 15 20 25
10- 3
0 Q)
06 u 10-5 >-u
' 0 c: 0 00 z l':.Jp ""O 10-4 ....... 0
oO~ Q)
""O (.) .. 02;0 >-Q) (.) - ~Qii] ' 0 E a::
10-6 f:)O E .r:. .. - b# z ~ ""O 0
' '-(!;) 0
""O .lll:
!':.# (.) 10-5 0
Specimen '-u 0 RA-3
Q) 0 RA-4 :J
~ Ct 0 LA-3 - 6 LA-4 0 10-7 LL
0
5 6 7 8 9 10 15 20 25
A I ternating Stress Intensity, ~ K, ksi ./TO
Figure 19. Crack growth rate as a function of stress inten-sity for heat treatment A.

101
~K. MPo ..fiTI 6 7 8 9 10 15 20 25
0 10-3
D Q) 6 u 10-5 >-u 0 ....... c::
z OR "O 0 D 10-4 ....... 0 0 "O 6 .. Q) -0 a::
10-6 .s::. -~ 0 '-
(.!)
.:.:. u 10-5 0 '- Specimen u
0 RB-3 G> D RB-4 ::J Ct 0 LB-3 - 6 LB-4 0
10-1 LL
5 6 7 8 9 10 15 20 25 Alternating Stress Intensity, ~K, ksi ../In"'
Figure 20. Crack growth rate as a function of stress intensity for heat treatment B.
Q)
u >-u ....... E E z "O ....... 0
"O

102
~K,MPav'iTI
6 7 8 9 10 15 20 25
Q,)
10-5 u >-u
........ c: 0 z Q)
u -c ~ 10-4 >-........ u
0 ........ -c o~o E
Q,) E - o~ !} -0 z c::: 10-6 oi6o -c ........ .c 0 -~ -c
0 L.
(!)
~
o~ u 10-5 0 Specimen L. u 0 RC-3
~ Q,) 0 RC-4 ::J 0 LC-3 C' - 6 LC-4 ~ 10-1 0
5 6 7 8 9 10 15 20 25 Alternating Stress Intensity, ~K, ksi .Jin
Figure 21. Crack growth rate as a function of stress intensity for heat treatment C.

103
Figure 22. Fractography of tensile specimens: CPM lOV thermal treatments (a) A, (b) B and (c) C.

Figure 23.
104
Plane strain overload fracture surfaces of CPM lOV: thermal treatments (a) A. (b) B. and (c) C.

Figure 24.
105
Fractography of fatigue crack growth in power law regime: CPM lOV. thermal treatments (a) A. (b) B. and (c) C.

106
(oc) I 00 200 300 400 500 600
en en 64 Q) c:
"'CJ '-c 60 ::c u Q) 56 ~ ~ (,) 0 a:: 52
48
AS 200 400 600 800 1000 1200 1400 quenched
Tempering Temperature (°F)
Figure 25. Typical hardening curve characteristic of secondary hardening tool steels (Teledyne Vasco: from Reference [4]).

23
22
21
-~ 20 c
Q.. ~ -u 19
M ~
18
17
16
500 550
107
Heat Treatment 0 A D 8 6 c
600 650 700
Hardness (HV500 )
Figure 26. Plane-strain fracture toughness as a function of hardness.

108
~K, MPa../iTI
6 7 8 9 10 15 20 25
Q)
(.) 10-5 >-(.)
....... c
z A "C 10-4 ....... c Q)
"C (.) .. >-Q) (.) - ....... c E 0::
10-6 E ~ - z ~ "C 0 ....... ...
(!) c "C
.>I! u 10-5 c ... u CD :J Ct ·--~ 10-1
5 6 7 8 9 10 15 20 25 Alternating Stress Intensity, ~K, ksi ./Til
Figure 27. Crack growth as a function of stress intensity in the Paris law regime for heat treatments A, B, and C.

Appendix A.
Secant Program for Fatigue Crack Growth Rate Determination
DIMENSION A(lOO),N(lOO),APRIME(lOO),DADN(lOO), *DELK ( 100)
DIMENSION ID(lO) INTEGER TYPE REAL N
C FOR COMPUTER PROMPT UNITl? ENTER FILENAME C FOR COMPUTER PROMPT UNIT2? ENTER FILENAME.PRN
5 FORMAT(lx,'PLEASE ENTER INPUT FILE FOR'/ *' UNITl AND OUTPUT FILE FOR UNIT2. '/)
WRITE(*,5) OPEN(l,FILE=' ') OPEN(2,FILE=' I ,STATUS='NEW')
10 FORMAT(/A4,9H SPECIMEN,5X,2HB=,F6.3,5H IN. ,5X,2HW=, *F6.3,5H IN. ,5X,3HAN=,F6.3,5H IN. )
15 FORMAT(lHl, 1 SECANT METHOD FOR DETERMINING DA/DN') 20 FORMAT(/6H PMIN=,F6.3,4HKIPS,5X,5HPMAX=,F6.3,4HKIPS,
*5X,2HR=,F6.3,5X,10HTEST FREQ=,F6.2,3HHZ.) 22 FORMAT(/7H TEMP.=,F4.0,1HF.5X,12HENVIRONMENT=,A15//) 30 FORMAT(A4,F5.1,F8.3,A4) 35 FORMAT(////llH SPEC. NO. ,9A4,A4,10X,14H NO. POINTS =
*,I3) 40 FORMAT(4(F6.4,F9.0)) 50 FORMAT(9A4,A4,2I6) 55 FORMAT(/2X,7H CYCLES,6X,8HA(MEAS.),3X,10HA(AVERAGE),
*4X,4HDELK,6X,5HDA/DN) 60 FORMAT(F6.3,F6.3,F6.1,F6.3,F6.3,F6.3)
200 FORMAT(//) 205 FORMAT(2X,F8.0,2X,F8.3,5X,F8.3,4X,F8.2,3X,E8.3) 207 FORMAT(2X,F8.0,2X,F8.3)
READ(l,50,END=lOOO) (ID(I),I=l,10),NPTS,TYPE READ(l,60) PMIN,PMAX,F,B,W,AM
C KIND=CT,CCT, ETC ..• READ(l,30)ENV,TEM,YS,KIND RE AD ( 1 • 4 0 ) ( A (I ) • N (I ) • I = 1, NP T S WRITE(*.15) WRITE(*,35) (ID(II). II=l,10),NPTS WRITE(*,lO)KIND,B,W,AM R=PMIN/PMAX WRITE(*,20)PMIN,PMAX,R,F WRITE(*,22)TEM,ENV
109

WRITE(*.55) WRITE(*.200) DO 210 I=l.NPTS A(I)=A(I) + AM
210 CONTINUE DELTAP=PMAX-PMIN NPTS=NPTS-1 DO 300 I=l.NPTS J=I+l APRIME(I)=(A(J)+A(I))/2 ALPHA=APRIME(I)/W
110
DADN(I)=(A(J)-A(I))/(N(J)-N{I)) DELK(I)=(DELTAP*(2.0+ALPHA)*(0.886+4.64*ALPHA-13.32*
*ALPHA**2.0+14.72*ALPHA**3.0-5.6*ALPHA**4.0))/ *(B*SQRT(W)*SQRT(l-ALPHA)**3.0)
WRITE(2.205)N(I).A(I).APRIME(I).DELK(I),DADN(I) 300 CONTINUE
NPTS=NPTS+l WRITE(2,207)N(NPTS),A(NPTS) WRITE(*.207)N(NPTS).A(NPTS)
1000 STOP END

Appendix B.
Fatigue Crack Growth Data
SPECIMEN: RA-3 NUMBER POINTS = 16
CT SPECIMEN B = 0. 25 0 IN. W = 2.007 IN. AN = 0.500 IN.
PMIN = 0.010 KIPS. PMAX = 0.380 KIPS. R = 0.026
TEST FREQUENCY = 30.000 HZ.
TEMPERATURE = 70.0°F ENVIRONMENT = AIR
CYCLES A(MEAS.) A(AVERAGE) DELK DA/DN
o. .747 . 7 5 8 7.17 .119E-06 180034. .769 . 7 85 7.43 .147E-06 403347. .801 .824 7.82 .157E-06 684000. • 846 • 85 6 8.16 .195E-06 787048. .866 • 87 8 8.42 .248E-06 887146. .891 • 9 03 8.71 .250E-06 987248. .916 .939 9.17 .454E-06
1091115. .963 .979 9.73 .408E-06 1171181. .995 1.021 10.36 .627E-06 1251273. 1. 046 1. 07 9 11. 39 .947E-06 1322026. 1.113 1.148 12.84 .140E-05 1372888. 1.184 1. 202 14.20 .149E-05 1397100. 1.220 1.246 15.51 .256E-05 1417351. 1.272 1.281 16.73 .194E-05 1427173. 1.291 1. 3 21 18.30 .500E-05 1439398. 1. 35 2
111

112
SPECIMEN: RA-4 NUMBER POINTS = 16
CT SPECIMEN B = 0. 25 0 IN. W = 2.006 IN. AN = 0.500 IN.
PMIN = 0.010 KIPS. PMAX = 0.380 KIPS. R = 0.026
TEST FREQUENCY = 30.000 HZ.
TEMPERATURE = 70.0°F
CYCLES A(MEAS.) A(AVERAGE)
o. .748 • 7 51 100000. .753 .761 203250. .769 .775 303060. .780 • 7 8 8 453138. .796 .800 553023. .805 .815 703048. .824 .830 803035. .837 .841 909500. • 846 . 85 2
1010173. • 85 8 .865 1110000. • 87 3 • 885 1267524. .896 .906 1375949. .916 .928 1478500. .940 .954 1578575. .967 . 97 8 1650548. .989
ENVIRONMENT = AIR
DELK DA/DN
7. 11 .470E-07 7.20 .156E-06 7.33 .llOE-06 7.46 .105E-06 7.59 .941E-07 7.73 .126E-06 7.89 .126E-06 8.01 .883E-07 8.13 .117E-06 8.27 .150E-06 8.50 .150E-06 8.76 .182E-06 9.03 .234E-06 9.37 .268E-06 9.71 .302E-06

113
SPECIMEN: RA-4 NUMBER POINTS = 13
CT SPECIMEN B = 0. 25 0 IN. W = 2.006 IN. AN = 0.500 IN.
PMIN = 0.010 KIPS. PMAX = 0.360 KIPS. R = 0.028
TEST FREQUENCY = 30.000 HZ.
TEMPERATURE = 70.0°F
CYCLES A(MEAS.) A(AVERAGE)
1650548. .989 .999 1700000. 1.008 1.021 1750011. 1. 033 1.063 1850162. 1. 092 1.115 1901146. 1.137 1.159 1941955. 1.182 1. 202 1972000. 1. 222 1. 23 2 1982650. 1.242 1. 251 1991000. 1. 261 1. 271 2006100. 1. 281 1. 301 2011500. 1. 320 1. 330 2015000. 1.340 1. 352 2017052. 1. 365
ENVIRONMENT = AIR
DELK DA/DN
9.48 .390E-06 9.82 .504E-06
10.50 .586E-06 11.46 .881E-06 12.41 .109E-05 13.45 .134E-05 14. 27 .185E-05 14.86 .236E-05 15.50 .130E-05 16.54 .730E-05 17.70 .563E-05 18.67 .120E-04

114
SPECIMEN: LA-3 NUMBER POINTS = 26
CT SPECIMEN B = 0. 25 0 IN. W = 2.006 IN. AN = 0.500 IN.
PMIN = 0.010 KIPS. PMAX = 0.380 KIPS. R = 0.026
TEST FREQUENCY = 30.000 HZ.
TEMPERATURE = 70.0°F
CYCLES A(MEAS.) A(AVERAGE)
o. .777 . 7 86 300064. .795 .801 400073. .807 .811 500063. .816 . 825 625185. • 835 • 83 7 726500. .840 . 85 0 807620. . 860 . 87 0 898478. .880 .893 998074. .907 .925
1098116. .944 .962 1198065. .981 1.009 1298193. 1. 03 7 1. 051 1348079. 1. 066 1.086 1399533. 1.107 1.129 1441120. 1. 151 1 • 17 1 1478074. 1. 191 1. 211 1506695. 1.231 1.242 1518138. 1. 25 3 1.263 1528886. 1.273 1.283 1538038. 1.294 1. 3 03 1545657. 1. 311 1.321 1552079. 1. 331 1.340 1557442. 1. 350 1.362 1562182. 1. 37 5 1. 384 1565700. 1. 393 1. 397 1566175. 1. 401
ENVIRONMENT = AIR
DELK DA/DN
7.45 .603E-07 7.59 .114E-06 7.69 • 87 OE-07 7.84 .156E-06 7. 97 .444E-07 8.10 • 25 OE-06 8.33 .219E-06 8.60 .273E-06 9.00 .366E-06 9.49 .376E-06
10.19 .558E-06 10.89 .579E-06 11. 54 .799E-06 12.42 .106E-05 13.41 .109E-05 14.48 .139E-05 15.41 .190E-05 16.09 .183E-05 16.82 .231E-05 17. 5 6 .234E-05 18.33 .307E-05 19.17 .345E-05 20.22 .527E-05 21.35 .526E-05 22.09 .162E-04

115
SPECIMEN: LA-4 NUMBER POINTS = 18
CT SPECIMEN B = 0. 25 0 IN. W = 2.007 IN. AN = 0.500 IN.
PMIN = 0.010 KIPS. PMAX = 0.380 KIPS. R = 0.026
TEST FREQUENCY = 30.000 HZ.
TEMPERATURE = 70.0°F
CYCLES A(MEAS.) A(AVERAGE)
0. . 7 8 8 .799 100045. .810 .837 286250. .865 . 87 7 386100. .888 .904 486065. .920 .943 586100. .965 .984 646100. 1. 002 1.015 696110. 1.027 1.047 747667. 1.066 1.083 797795. 1.100 1.125 847106. 1.150 1. 17 7 887093. 1. 204 1. 218 907136. 1.232 1.249 927190. 1.266 1.280 937162. 1.294 1. 310 947092. 1. 3 25 1. 334 952050. 1.343 1.367 956218. 1.391
ENVIRONMENT = AIR
DELK DA/DN
7.56 .217E-06 7.96 .297E-06 8.40 .232E-06 8.73 .321E-06 9.22 .449E-06 9.79 .620E-06
10.27 .500E-06 10.80 .745E-06 11.46 .690E-06 12.32 .lOlE-05 13.54 .134E-05 14.66 .141E-05 15.61 .168E-05 16.68 .284E-05 17.82 .311E-05 18.86 . 3 69E-05 20.44 .114E-04

116
SPECIMEN: RB-3 NUMBER POINTS = 15
CT SPECIMEN B = 0. 25 0 IN. W = 2.006 IN. AN = 0.500 IN.
PMIN = 0.010 KIPS. PMAX = 0.320 KIPS. R = 0.031
TEST FREQUENCY = 30.000HZ.
TEMPERATURE = 70.0°F
CYCLES A(MEAS.)
o. .792 150313. • 810 349922. • 839 522325. .874 660088. .913 747940. .937 847930. • 971 936627. 1. 018 987419. 1.057
1032430. 1. 083 1075816. 1. 13 4 1095091. 1.164 1115000. 1.191 1135037. 1. 263 1137414. 1. 3 3 8
ENVIRONMENT = AIR
A(AVERAGE) DELK DA/DN
.801 6.36 .120E-06 .
.824 6.56 .144E-06 • 85 6 6. 85 .204E-06 .893 7.21 .282E-06 .925 7.53 .278E-06 .954 7.86 .339E-06 .994 8.35 .527E-06
1. 03 7 8.92 .772E-06 1.070 9.41 .587E-06 1.109 10.04 .117E-05 1. 149 10.78 .153E-05 1.17 7 11. 3 6 .136E-05 1.227 12.52 .360E-05 1.300 14.64 .315E-04

117
SPECIMEN: RB-4 NUMBER POINTS = 18
CT SPECIMEN B = 0. 25 0 IN. W = 2.005 IN. AN = 0.500 IN.
PMIN = 0.010 KIPS. PMAX = 0.320 KIPS. R = 0.031
TEST FREQUENCY = 30.000 HZ.
TEMPERATURE = 70.0°F
CYCLES A(MEAS.) A(AVERAGE)
o. .816 .831 212364. .845 .862 417718. .880 . 894 586801. • 9 09 .920 686447. .931 .945 793373. • 95 8 .974 892535. .989 1.009 997566. 1.029 1.057
1095773. 1. 085 1.099 1135502. 1. 112 1.135 1185490. 1. 15 7 1.17 2 1209850. 1. 186 1.204 1233410. 1.222 1.233 1243490. 1.243 1. 25 3 1253508. 1.263 1.280 1263492. 1.296 1.308 1268475. 1. 320 1. 333 1270030. 1. 346
ENVIRONMENT = AIR
DELK DA/DN
6.62 .137E-06 6.91 .169E-06 7.22 .171E-06 7.49 .223E-06 7.76 .254E-06 8.10 .311E-06 8. 5 4 .377E-06 9.21 .571E-06 9.88 .695E-06
10. 5 3 .902E-06 11.26 .119E-05 11. 99 .153E-05 12.69 .207E-05 13.23 .197E-05 14.01 .336E-05 14.93 .474E-05 15. 81 .167E-04

118
SPECIMEN: LB-3 NUMBER POINTS = 21
CT SPECIMEN B = 0. 25 0 IN. W = 2.005 IN. AN = 0.500 IN.
PMIN = 0.010 KIPS. PMAX = 0.320 KIPS. R = 0. 031
TEST FREQUENCY = 30.000 HZ.
TEMPERATURE = 70.0°F
CYCLES A(MEAS.) A(AVERAGE)
0. .776 .792 278549. .809 • 825 454272. .842 • 861 638587. .880 .897 764871. .913 .933 893885. • 95 2 .970 988975. .987 1. 010
1074669. 1. 034 1. 056 1131641. 1.079 1. 089 1161190. 1.099 1.106 1181199. 1.113 1.124 1201159. 1.134 1.141 1211127. 1.148 1.157 1221239. 1.165 1.175 1232746. 1.184 1.192 1242156. 1.200 1. 209 1252155. 1. 218 1.229 1262169. 1.240 1.247 1267129. 1. 254 1.266 1272145. 1. 279 1.292 1275509. 1. 306
ENVIRONMENT = AIR
DELK DA/DN
6.29 .118E-06 6. 5 8 .192E-06 6.90 .206E-06 7.25 .262E-06 7.63 .302E-06 8.05 .362E-06 8. 5 6 .548E-06 9.21 .792E-06 9.72 .673E-06
10.01 .730E-06 10.32 .105E-05 10.65 .138E-05 10.95 .169E-05 11. 3 2 .164E-05 11. 71 .171E-05 12.10 .177E-05 12.60 .224E-05 13.07 .270E-05 13.60 .494E-05 14.40 .815E-05

119
SPECIMEN: LB-4 NUMBER POINTS = 19
CT SPECIMEN B = 0.250 IN. W = 2.006 IN. AN = 0.500 IN.
PMIN = 0.010 KIPS. PMAX = 0.320 KIPS. R = 0.031
TEST FREQUENCY = 30.000 HZ.
TEMPERATURE = 70.0°F
CYCLES A(MEAS.) A(AVERAGE)
0. .822 • 83 8 2 45 612. • 85 3 . 871 427197. .889 .913 639752. .937 • 9 49 746391. .962 .983 852577. 1.005 1.028 935990. 1. 051 1.062 980495. 1. 07 3 1.088
1024248. 1.102 1.113 1053844. 1.123 1. 13 3 1078056. 1.142 1.153 1097870. 1.164 1.174 1117855. 1.185 1.202 1145353. 1.220 1.230 1155760. 1.240 1.261 1174802. 1.281 1.296 1181921. 1. 311 1. 316 1186853. 1. 3 21 1. 345 1190507. 1. 370
ENVIRONMENT = AIR
DELK DA/DN
6.68 .126E-06 6.99 .197E-06 7.41 .225E-06 7.80 .231E-06 8.21 .408E-06 8. 7 9 .548E-06 9.28 .512E-06 9.69 .656E-06
10. 11 .713E-06 10.47 .772E-06 10.86 • ll 2E-05 11.30 .103E-05 11. 92 .127E-05 12.59 .193E-05 13.42 .219E-05 14. 5 0 .409E-05 15.17 .217E-05 16.26 .133E-04

120
SPECIMEN: RC-3 NUMBER POINTS = 14
CT SPECIMEN B = 0. 25 0 IN. W = 2.007 IN. AN = 0.500 IN.
PMIN = 0.010 KIPS PMAX = 0.310 KIPS. R = 0.032
TEST FREQUENCY = 30.000 HZ.
TEMPERATURE = 70.0°F
CYCLES A(MEAS.) A(AVERAGE)
o. .778 .789 160000. .BOO .814 331700. .828 .839 481139. . 85 0 .865 621009. .880 .898 731926. .915 .930 831085. . 945 .964 932200. .983 1.004
1012999. 1.025 1.038 1063500. 1. 051 1.07 2 1117200. 1. 092 1.115 1166898. 1.137 1.163 1200359. 1.189 1.199 1220179. 1. 209
ENVIRONMENT = AIR
DELK DA/DN
6.06 .138E-06 6.26 .163E-06 6.47 .147E-06 6.70 .214E-06 7.01 .316E-06 7.34 .303E-06 7.71 .372E-06 8.19 .519E-06 8.63 .523E-06 9.12 .765E-06 9.81 .903E-06
10.69 .154E-05 11. 44 .102E-05

121
SPECIMEN: RC-4 NUMBER POINTS = 15
CT SPECIMEN B = 0. 25 0 IN. W = 2.008 IN. AN = 0.500 IN.
PMIN = 0.010 KIPS. PMAX = 0.320 KIPS. R = 0.031
TEST FREQUENCY = 30.000 HZ.
TEMPERATURE = 70.0°F
CYCLES A(MEAS.) A(AVERAGE)
0 . .759 .770 194548. • 7 81 .794 388684. .807 .821 553723. . 83 6 .848 716036. • 860 .862 734966. .863 .893 962318. .923 • 95 8
1169757. .993 1.021 1274865. 1.049 1. 05 9 1300005. 1.069 1.077 1320000. 1.084 1.095 1340000. 1.105 1. 13 2 1380083. 1.160 1.189 1400032. 1.219 1.225 1406813. 1. 23 0
ENVIRONMENT = AIR
DELK DA/DN
6.10 .113E-06 6.29 .132E-06 6.52 .175E-06 6.76 • 15 OE-06 6.89 .158E-06 7.19 .262E-06 7.89 .338E-06 8.68 .538E-06 9.22 .807E-06 9.49 .740E-06 9.78 .103E-05
10.44 .137E-05 11. 60 .295E-05 12.42 .170E-05

122
SPECIMEN: LC-3 NUMBER POINTS = 22
CT SPECIMEN B = 0. 25 0 IN. W = 2.006 IN. AN = 0.500 IN.
PMIN = 0.010 KIPS. PMAX = 0.310 KIPS. R = 0.032
TEST FREQUENCY = 30.000 HZ.
TEMPERATURE = 70.0°F
CYCLES A(MEAS.) A(AVERAGE)
0. 91543.
224916. 312402. 478947. 581237. 682080. 782118. 832228. 930021.
1017761. 1067141. 1117283. 1157608. 1187094. 1207026. 1227040. 1232010. 1237022. 1242014. 1247018. 1247241.
.753
.769
.788
.808
. 83 6 • 85 8 .880 .911 .921 .946 .988
1.015 1.047 1. 07 5 1. 113 1.143 1. 183 1.192 1.208 1.223 1. 25 0 1.269
.761 • 7 7 8 .798 .822 .847 .869 . 895 .916 .933 .967
1.002 1. 031 1. 061 1.094 1.128 1. 163 1.188 1.200 1. 215 1.236 1.260
ENVIRONMENT = AIR
DELK
5.84 5.97 6.13 6.33 6.54 6. 7 4 6.99 7.20 7.38 7.75 8.17 8.55 8.97 9.48
10.06 10. 7 2 11.22 11.49 11.84 12.35 12.96
DA/DN
.178E-06
.139E-06
.238E-06
.166E-06
.214E-06
.218E-06
.309E-06
.196E-06
.262E-06
.480E-06
.543E-06
.644E-06
.689E-06
.130E-05
.150E-05
.201E-05
.179E-05
.311E-05
.292E-05
.544E-05
.879E-04

123
SPECIMEN: LC-4 NUMBER POINTS = 16
CT SPECIMEN B = 0.249 IN. W = 2.007 IN. AN = 0. 5 0 0 IN.
PMIN = 0.010 KIPS. PMAX = 0.310 KIPS. R = 0. 03 2
TEST FREQUENCY = 30.000 HZ.
TEMPERATURE = 70.0°F
CYCLES A(MEAS.) A(AVERAGE)
0. 300060. 507552. 657773. 792329. 892396. 975969.
1070273. 1121687. 1147800. 1167055. 1191261. 1221014. 1241100. 1251058. 1259037.
• 7 8 2 • 83 2 • 87 2 .903 .937 .969 .999
1.045 1.080 1.098 1. 115 1.145 1. 17 5 1.209 1.221 1.232
• 807 • 85 2 • 887 .920 • 95 3 .984
1.022 1. 062 1.089 1.106 1. 13 0 1.160 1.192 1.215 1.227
ENVIRONMENT = AIR
DELK
6.22 6.61 6.94 7.26 7.62 7.98 8.45 9.02 9.42 9.70
10.11 10.67 11.33 11.86 12.14
DA/DN
.167E-06
.191E-06
.206E-06
.256E-06
.323E-06
.355E-06
.485E-06
.692E-06
.678E-06
.867E-06
.125E-05
.lOOE-05
.170E-05
.125E-05
.138E-05

The vita has been removed from the scanned document