Embed Size (px)
Citation preview

55 OPPtimal E&D Pty Ltd
Resources & Faults
Benefits of Fracture
Extraction Workflows
Calibration
Resource Development
Optimisation / Case
Studies
Conclusions
Fracture Imaging from Seismic –
New Improved Resource Recovery Techniques
Victory comes from finding
opportunities in problems !
Sun Tzu
56 OPPtimal E&D Pty Ltd
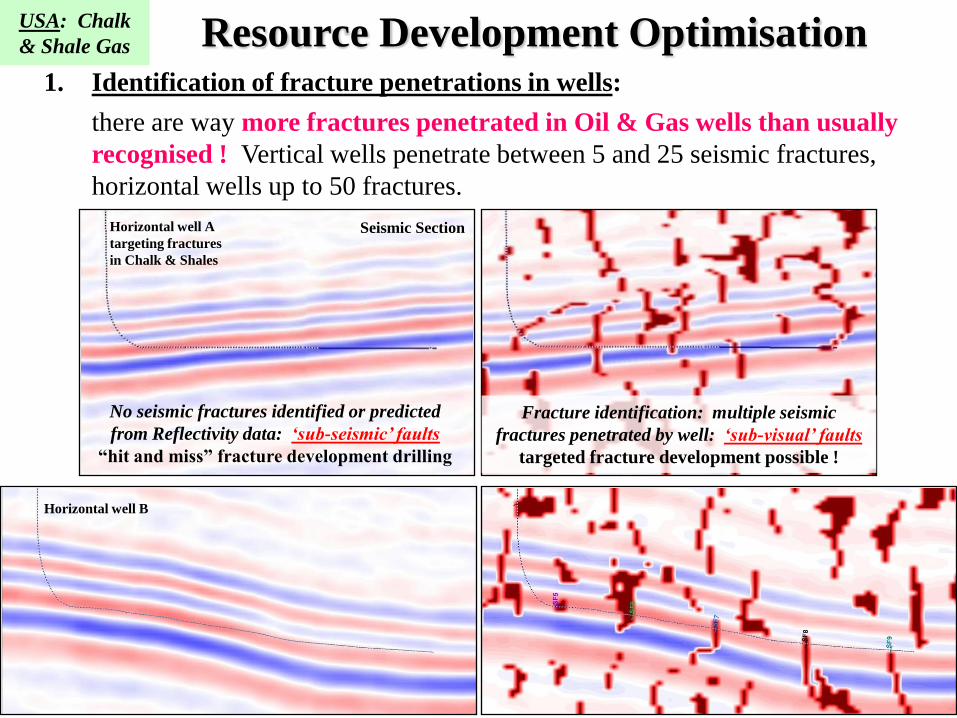
Resource Development Optimisation
Horizontal well A
targeting fractures
in Chalk & Shales
No seismic fractures identified or predicted
from Reflectivity data: ‘sub-seismic’ faults
“hit and miss” fracture development drilling
Fracture identification: multiple seismic
fractures penetrated by well: ‘sub-visual’ faults
targeted fracture development possible !
Seismic Section
Horizontal well B
1. Identification of fracture penetrations in wells:
there are way more fractures penetrated in Oil & Gas wells than usually
recognised ! Vertical wells penetrate between 5 and 25 seismic fractures,
horizontal wells up to 50 fractures.
USA: Chalk
& Shale Gas

57 OPPtimal E&D Pty Ltd
CF
1
CF
2
CF
3
CF
4
CF
5
CF
6
CF
7
CF
8
CF
9
CF
10
CF
11
CF
12
CF
13
CF
14
CF
15
C
F1
6
CF
17
CF
18
CF
19
C
F2
0
CF
21
CF= Correlation Fault
(from Spectral GR correlation)
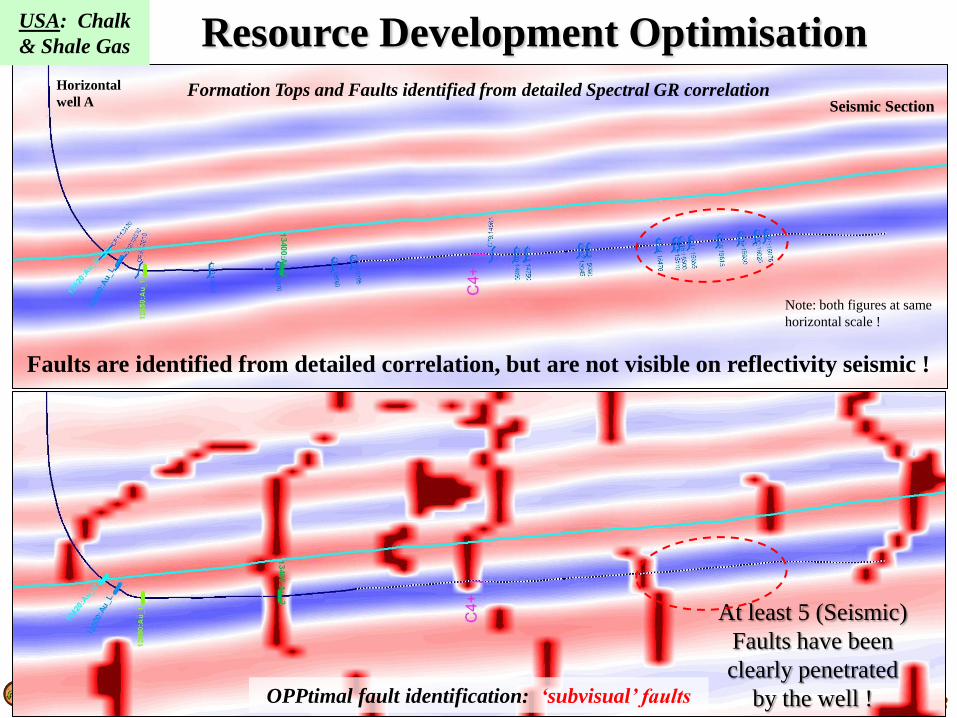
Formation Tops and Faults identified from detailed Spectral GR correlation
Faults are identified from detailed correlation, but are not visible on reflectivity seismic !
Horizontal
well A
Perforations
Note: both figures at same
horizontal scale !
Seismic Section
Geological
Cross-section
Resource Development Optimisation USA: Chalk
& Shale Gas
58 OPPtimal E&D Pty Ltd
OPPtimal fault identification: ‘subvisual’ faults
At least 5 (Seismic)
Faults have been
clearly penetrated
by the well !
Formation Tops and Faults identified from detailed Spectral GR correlation
Faults are identified from detailed correlation, but are not visible on reflectivity seismic !
Horizontal
well A
Note: both figures at same
horizontal scale !
OPPtimal fault identification: ‘subvisual’ faults
At least 5 (Seismic)
Faults have been
clearly penetrated
by the well !
Seismic Section
Resource Development Optimisation USA: Chalk
& Shale Gas

59 OPPtimal E&D Pty Ltd
Seismic
Fault 9
Time
Slice
Seismic Fault 9: coincides with fault identified from
Client’s detailed Spectral GR correlation ! Well enters
reservoir after intersecting a (seismically visible) fault.
Seismic Fault 9
and Top Reservoir
CF
1
CF
2
CF
3
CF
4
CF
5
CF
6
CF
7
CF
8
CF
9
CF
10
CF
11
CF
12
CF
13
CF
14
CF
15
C
F1
6
CF
17
CF
18
CF
19
C
F2
0
CF
21
Seismic
Fault 8 Seismic
Fault 9
Seismic
Fault 10
Seismic
Fault 11
Seismic
Fault 12
C4+ Gas Shows:
Perforations
Seismic
Fault 8.5
CF= Correlation
Fault
(from Spectral GR
correlation)
SE NW
Seismic
Section
Resource Development Optimisation USA: Chalk
& Shale Gas

60 OPPtimal E&D Pty Ltd
Challenge: Location and prediction of sweet spots / productivity.
Outcome: Visualisation of fault & fracture networks at very high resolution. Found direct links
between fault penetrations in wells and hydrocarbon shows/productivity. Proper 3D
fault imaging allows evaluation of reservoir connectivity (lat./vert.) and productivity.
Gas show onset at exact location where
horizontal well drills through fault
Time
Slice
Seismic faults penetrated by
horizontal well are often
interconnected. Tracer data has
shown that horizontal wells are in
communication along fracture
networks visualised by OPPtimal
methods.
Seismic
Section
Resource Development Optimisation USA: Chalk
& Shale Gas

61 OPPtimal E&D Pty Ltd
Reflect.
High
Confidence (larger faults)
High
Resolution (larger +
smaller faults)
Seismic
Section
1. Identification of fracture penetrations in wells (contd.): seismic fractures
often show good to excellent matches with borehole image fractures, fluid
losses and well productivity.
Resource Development Optimisation Middle East:
Fractured Carbonate

62 OPPtimal E&D Pty Ltd Vertical Section
A B
C
Challenge: Location and prediction of fault & fracture networks from seismic – where are „sweet
spots‟ in the reservoir ?
Outcome: Image log fracture density appears related to relative orientation of wellbore to seismic
fracture zones – higher image log fracture density when drilling parallel or sub-parallel
to seismic fractures ! Detailed well planning can increase fracture intersections !
Losses 2 high confidence
Losses 1 high confidence
Horizontal Section
A B C
fracture
fissure
high-angle feature
losses
Resource Development Optimisation Middle East:
Fractured Carbonate

64 OPPtimal E&D Pty Ltd
Fracture clusters/swarms observed on
image logs (A, B, C) are interpreted to be
related to fracture corridors.
Fracture extractions indicate that image
log fracture density is primarily related
to the relative orientation of a wellbore
to seismic fractures. Higher image log
fracture densities are encountered when
drilling parallel or sub-parallel to
seismic fractures ! This means that
detailed well planning can increase
fracture intersections !
Fracture Corridor in
fluvial sandstone. [Dwarwick Head,
Thurso, UK]
Fracture
Corridor in
Carbonates. [Petit el al 2002]
Fracture Corridor [North of Petra, Jordan]
Well Review: Fracture Corridor „C‟ Middle East: Fractured Carbonate
65 OPPtimal E&D Pty Ltd
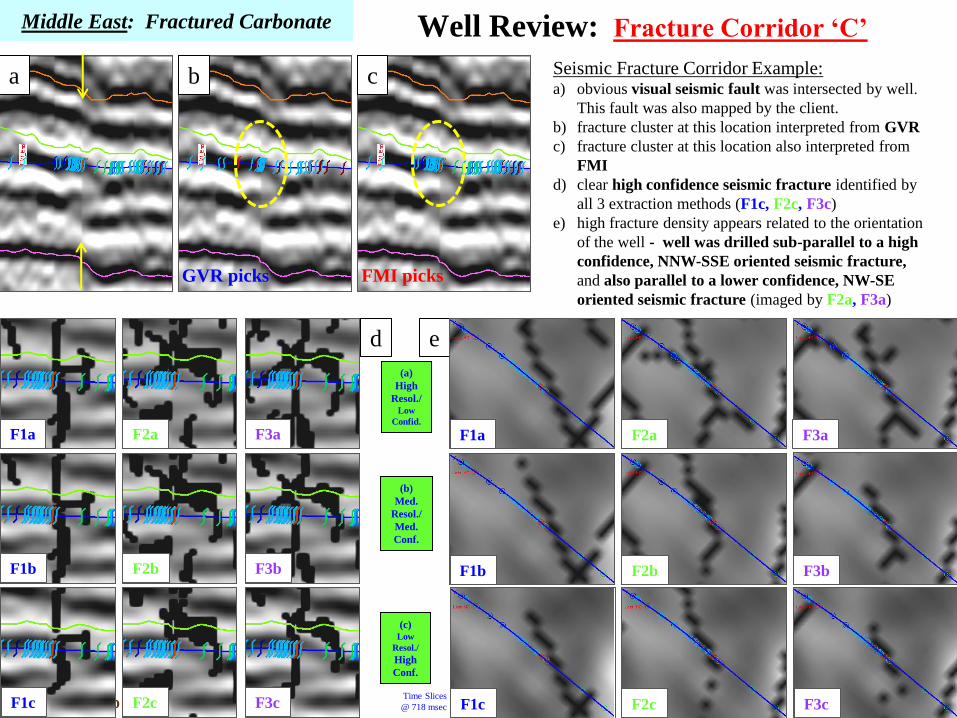
Well Review: Fracture Corridor „C‟
Seismic Fracture Corridor Example: a) obvious visual seismic fault was intersected by well.
This fault was also mapped by the client.
b) fracture cluster at this location interpreted from GVR
c) fracture cluster at this location also interpreted from
FMI
d) clear high confidence seismic fracture identified by
all 3 extraction methods (F1c, F2c, F3c)
e) high fracture density appears related to the orientation
of the well - well was drilled sub-parallel to a high
confidence, NNW-SSE oriented seismic fracture,
and also parallel to a lower confidence, NW-SE
oriented seismic fracture (imaged by F2a, F3a)
a
GVR picks
b
FMI picks
c
F1a
F1b
F1c
F2a
F2b
F2c
F3a
F3b
F3c
d
(a)
High
Resol./ Low
Confid.
(b)
Med.
Resol./
Med.
Conf.
(c) Low
Resol./
High
Conf.
e
F3a
F3b
F3c
F2a
F2b
F2c
F1a
F1b
F1c Time Slices
@ 718 msec
Middle East: Fractured Carbonate

66 OPPtimal E&D Pty Ltd
Fracture corridors vary in length
and size. A large fracture corridor
might be 10m wide, 100m high
and a kilometre long. This
fracture corridor is up to 10m
wide with no vertical
displacement but with many
small fractures. [Algeria, Bush 2010].
Match between strike of image log fracture and seismic fracture !
(a)
High
Resolution / High+Medium
+Low
Confidence
F1a
F2a
F3a F3a
F2a
F1a
Section Time
Slice
All three
methods
pick up a
NNW-SSE
striking
seismic
fracture ! W
ell
D
Well Review: Fracture Corridor „C‟ Middle East: Fractured Carbonate

67 OPPtimal E&D Pty Ltd
2. Better understanding of links between fracture penetrations and previous
drilling, mining and/or production issues:
links between fractures and drilling/mining observations or Non-Productive Time:
wellbore stability/integrity, break outs, total well losses, mine roof collapse,
lost circulation, gas kicks, outbursts, local stress variation, geomechanics
links between fractures and HC shows (boundaries/baffles, fluid conduits, productivity)
Resource Development Optimisation
F3c Lower
resolution
High
confidence
Loss Zone 3 Loss Zone 2
F3a High
resolution Lower
Confidence
Time slices with horizontal wells, image log fractures & losses
Losses possibly linked to:
• losses linked to high confidence/larger throw fault (F3c) !
• losses at intersection point of 2 fault trends !
• drilling parallel/sub-parallel to fault plane !
Gas show onset at exact location where
horizontal well drills through (seismically
identified) fracture
Seismic
Section
Well lost due
to drilling into
previously
unidentified
fracture
Seismic
Section

69 OPPtimal E&D Pty Ltd
2. Better understanding of links between fracture penetrations and previous
drilling, mining and/or production issues (contd.):
links between fractures and production behaviors:
flow enhancement, natural fracture networks, mine gas drainage, present-day
stress influence on productivity
water/gas channelling, boundaries/baffles, compartmentalization, seam offsets
High resolution High confidence
Well drilled into
previously
unidentified
(karstified) fault =
oil-filled cavity
Resource Development Optimisation
Time
Slice
Water channelling in
wells explained
Seismic
Section
Visualising
compartments
in fields
Larger fractures Larger+smaller fractures
Time
Slice
Larger fractures& Reflect.