Embed Size (px)
Citation preview
Fracture Liaison Service Database Leading FLS improvement: secondary fracture prevention in the NHS
Annual report October 2017Data from January to December 2016
In association with: Commissioned by:
Fracture Liaison Service Database (FLS-DB) annual report. October 2017
Leading FLS improvement: secondary fracture prevention in the NHS This report was prepared by the members of the Fracture Liaison Service Database (FLS-DB) project team. M Kassim Javaid, FLS-DB clinical lead Chris Boulton, FFFAP programme manager Catherine Gallagher, FLS-DB and Falls project coordinator Andrew Judge, Nuffield Department of Orthopaedics, Rheumatology and Musculoskeletal Sciences (NDORMS), University of Oxford Naomi Vasilakis, FLS-DB and Falls project manager Data analysis by the NDORMS, University of Oxford The FLS-DB data collection webtool is provided by Crown Informatics (http://crowninformatics.com) Falls and Fragility Fracture Audit Programme The FLS-DB is commissioned by the Healthcare Quality Improvement Partnership (HQIP) and managed by the Royal College of Physicians (RCP) as part of the Falls and Fragility Fracture Audit Programme (FFFAP), alongside the National Audit of Inpatient Falls (NAIF) and the National Hip Fracture Database (NHFD). FFFAP aims to improve the delivery of care for patients who have falls or sustain fractures through effective measurement against standards and feedback to providers. Healthcare Quality Improvement Partnership The Healthcare Quality Improvement Partnership (HQIP) is led by a consortium of the Academy of Medical Royal Colleges, the Royal College of Nursing and National Voices. Its aim is to promote quality improvement, and in particular to increase the impact that clinical audit has on healthcare quality in England and Wales. HQIP hosts the contract to manage and develop the National Clinical Audit and Patient Outcomes Programme (NCAPOP). Its purpose is to engage clinicians across England and Wales in systematic evaluation of their clinical practice against standards and to support and encourage improvement in the quality of treatment and care. The programme comprises more than 30 clinical audits that cover care provided to people with a wide range of medical, surgical and mental health conditions. The Royal College of Physicians The Royal College of Physicians (RCP) is a registered charity that aims to ensure high-quality care for patients by promoting the highest standards of medical practice. It provides and sets standards in clinical practice, education and training; conducts assessments and examinations; quality assures external audit programmes; supports doctors in their practice of medicine; and advises the government, the public and the profession on healthcare issues. Citation for this report: Royal College of Physicians. Fracture Liaison Service Database (FLS-DB) annual report. Leading FLS improvement: secondary fracture prevention in the NHS. London: RCP, 2017. Copyright All rights reserved. Applications for the copyright owner’s written permission to reproduce significant parts of this publication (including photocopying or storing it in any medium by electronic means and whether or not transiently or incidentally to some other use of this publication) should be addressed to the publisher. Brief extracts from this publication may be reproduced without the written permission of the copyright owner, provided that the source is fully acknowledged. Copyright © Healthcare Quality Improvement Partnership 2017 ISBN 978-1-86016-688-4 eISBN 978-1-86016-689-1 Royal College of Physicians 11 St Andrews Place, Regent’s Park, London NW1 4LE www.rcplondon.ac.uk Registered charity no 210508
© Healthcare Quality Improvement Partnership 2017 1
Fracture Liaison Service Database (FLS-DB) annual report. October 2017
Contents
Foreword by the National Osteoporosis Society 4
Patient perspectives 5
Introduction 6
Executive summary 7
FLS performance summary 9
National performance against KPIs: summary 14
Results 18
KPI 1 Data completeness 18 KPIs 2 and 3 Identification 19 KPI 4 Time to FLS assessment (investigation) 21 KPI 5 Time to DXA (investigation) 23 KPI 6 Falls assessment and KPI 8 Strength and balance training 25
KPI 7 Bone therapy recommended as inappropriate 28 KPI 9 Monitoring contact 12–16 weeks post fracture 29 KPI 10 Commenced bone therapy by 16 weeks post fracture 29 KPI 11 Adherent to bone therapy at 12 months post fracture 29
FLS-level results 31
References 62
Appendices 63
Appendix A – Participating FLSs 63 Appendix B – Non-participating trusts and organisations 65 Appendix C – Structure and governance 68
2 © Healthcare Quality Improvement Partnership 2017
Fracture Liaison Service Database (FLS-DB) annual report. October 2017
Document purpose To disseminate results on the quality of service provision for secondary fracture prevention in England and Wales and highlight areas for improvement.
Title Fracture Liaison Service Database (FLS-DB) annual report. Leading FLS improvement: Secondary fracture prevention in the NHS
Author Royal College of Physicians Publication date October 2017 Target audience NHS staff in fracture care multidisciplinary teams, hospital managers,
chief executives, commissioners and fragility fracture researchers Description This report provides the second benchmark for the performance of FLSs
at the patient level and demonstrates the step change in engagement and quality improvement in England and Wales.
Related publications • Fracture Liaison Service Database (FLS-DB) clinical audit. FLSforward: identifying high-quality care in the NHS for secondaryfracture prevention. London: RCP, 2017.
• Fracture Liaison Service Database (FLS-DB) facilities audit. FLSbreakpoint: opportunities for improving patient care following afragility fracture. London: RCP, 2016.
• Secondary fracture prevention: first steps to a national audit.Fracture Liaison Service Database (FLS-DB): feasibility studysummary report. London: RCP, 2015.
• Effective secondary prevention of fragility fractures: clinicalstandards for fracture liaison services. National OsteoporosisSociety, 2014.
• Falling standards, broken promises: report of the national audit offalls and bone health in older people 2010. London: RCP, 2011.
Contact [email protected]
© Healthcare Quality Improvement Partnership 2017 3
Fracture Liaison Service Database (FLS-DB) annual report. October 2017
Foreword by the National Osteoporosis Society
The National Osteoporosis Society hears far too often from people with osteoporosis about the devastating effects that fractures have on their lives and their families.
As the chief executive of the only UK-wide charity that supports people living with osteoporosis and the health professionals who care for them, I am delighted to be supporting this second report from the Fracture Liaison Service Database (FLS-DB).
With people living longer and often living with multiple long-term illnesses, it is vital that we make the prevention of fragility fractures an absolute priority for all health services.
It is heartening to see that, 6 months on from the first report, the NHS has engaged with the fragility fracture health agenda: as more services get involved in the audit, there is improved data collection and improved standards of care. This is due to the dedication of the NHS staff who work tirelessly to provide support and care for people who are living with osteoporosis.
These audits and reports are vital for providing information and evidence of the effectiveness of the services. This is incredibly important for supporting the charity’s work to help prevent further fractures and support people to live well with osteoporosis.
The charity is encouraged by these results and it hopes they will inspire others to become involved and to use the results to help influence change both locally and nationally. The FLS-DB is a critical component for our work to continually improve the standards of osteoporosis services and raise awareness of the condition among the public and health professionals.
There is much more work to do, but this is a very promising start.
Thank you to everyone who has contributed to the audit and to the team at the Falls and Fragility Fracture Audit Programme (FFFAP) for their work to compile the report.
Claire Severgnini Chief executive, National Osteoporosis Society
4 © Healthcare Quality Improvement Partnership 2017
Fracture Liaison Service Database (FLS-DB) annual report. October 2017
Patient perspectives
Thoughts from a patient
At 80 years old, my mother was diagnosed with osteoporosis. Spinal fractures were identified as the cause of the persistent back pain that she had been experiencing. Over the next 8 years she suffered a fractured foot and a broken hip from which she never fully recovered, as she died 8 months later.
I have seen how devastating osteoporosis and in particular hip fractures can be. The loss of mobility and independence leads to frustration and depression; these are aspects of the condition that are perhaps forgotten when only the financial costs to the overstretched health and social care services are considered.
I have come to realise how little awareness of osteoporosis there is among the general public. A common misconception appears to be that osteoporosis is something that just happens to some old ladies. There seems to be a lack of knowledge regarding how lifestyle choices can help maintain good bone health, the significance of family history and how nagging back pains could be the result of undiagnosed spinal fractures. There appears to be a need for a major awareness campaign to inform the public. Greater awareness would perhaps lead to a demand for earlier identification of those who are at risk.
I recently asked my GP whether, with my medical history and in light of my mother’s osteoporosis, I should consider over-the-counter supplements. She was astonished that I had not already been investigated because it seems that, on paper, I should immediately be on medication. I’m not sure who should have been carrying out any investigations, but I suspect that if I hadn’t raised the subject I may at some point have been presenting with a fracture at A&E. Instead I am now scheduled for a dual-energy X-ray absorptiometry (DXA) scan.
Thanks to the excellent work carried out by the National Osteoporosis Society, we know that one in two women and one in five men over the age of 50 will break a bone as the result of osteoporosis. With early diagnosis, it is possible to start treatment that will help to reduce future fractures. Yet despite our ageing population and the potential related costs of osteoporosis to the health service, we have no screening programme for this potentially life-changing condition. Currently, if you are lucky, your osteoporosis will be picked up when you suffer your first fracture but, surprisingly, this timely intervention can be something of a postcode lottery, as not every area has a fracture liaison service (FLS). If the FLS provision is to be the first defence of the health services against escalating costs that result from fractures caused by osteoporosis, these services must be staffed and funded to run effectively.
The work of the FLS-DB audit team must be applauded and supported, as they strive to ensure that every FLS delivers the same recognised high-quality care everywhere in the country.
Iona Price Patient and carer representative
© Healthcare Quality Improvement Partnership 2017 5
Fracture Liaison Service Database (FLS-DB) annual report. October 2017
Introduction
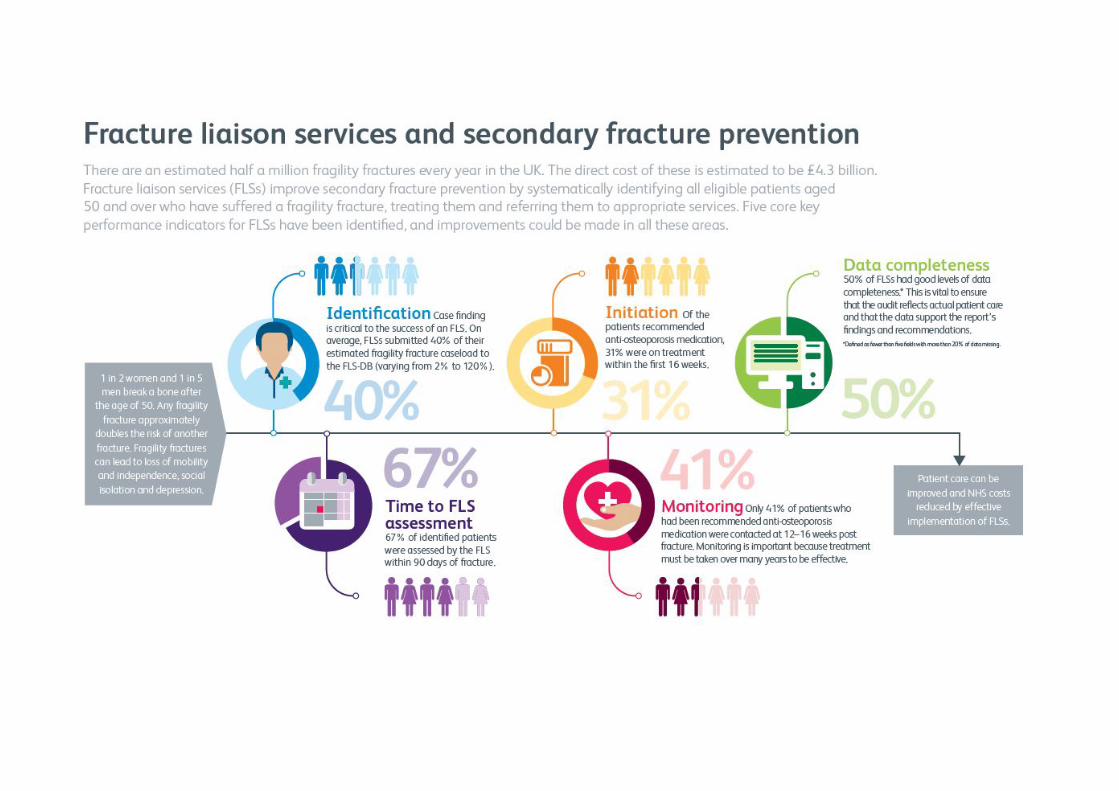
This report considers the quality of service provision for secondary fracture prevention. It is a modern-day tragedy that, after sustaining a fragility fracture, most people are unaware that they may have osteoporosis or that the NHS should provide effective assessment and management to reduce their risk of suffering other further fractures. As a result of the ageing demographic, secondary fracture prevention is a priority for health services at both the local and national levels. Providing effective secondary fracture prevention to all eligible patients would prevent almost 54,000 fractures within the first 5 years.1 This is a substantial risk reduction at the population level.
In 2010, the Royal College of Physicians (RCP) audited the quality of the clinical care delivered to patients who had fallen and fractured a bone and had been seen in a hospital emergency department (A&E).2 Only 32% of patients with a non-hip fracture received an adequate fracture risk assessment and just 28% were established on anti-osteoporosis medications within 12 weeks. Of these, the percentages were much lower for those who were not admitted to hospital. The Department of Health (DH) subsequently incentivised primary care services to initiate these treatments for relevant patients, but by the end of the first year of this scheme, fewer than one in five patients were receiving the treatments.3 These results are consistent with others that suggest that good clinical practice for these patients requires a systematic approach that encompasses case finding, assessment, initiation and monitoring of treatment – in other words, an FLS.
In January 2016, the FLS-DB started to collect web-based continuous data on patients aged 50 and over who were diagnosed with a fragility fracture. In April 2017, the first FLS-DB report was published. It examined data from the first 6 months of the FLS-DB (patients who suffered a fracture between January and June 2016). The key finding from that report was that high-quality service delivery is achievable by FLSs but that the quality varied nationally.
This second report contains data on the first 12 months of the FLS-DB (patients diagnosed with a fragility fracture between January and December 2016). This report examines how, in a short time frame, the FLSs in the NHS have engaged with the audit and improved the quality of data collection and case finding.
We are grateful for the hard work of the many NHS professionals in England and Wales who have contributed to the FLS-DB, and we recognise that the findings of this report will be challenging for many FLSs. The aim of this audit is to guide FLSs to prioritise quality improvement within their service in order to ensure that each FLS in the NHS is effective and delivers its service efficiently.
6 © Healthcare Quality Improvement Partnership 2017
Fracture Liaison Service Database (FLS-DB) annual report. October 2017
Executive summary
Any fragility fracture approximately doubles the risk of another fracture (ie a secondary fracture). An FLS aims to reduce the risk of the next secondary fractures by systematically identifying those who are at high risk of another fracture and providing treatment to reduce the risk of this happening. Therefore, FLSs improve secondary fracture prevention by systematically identifying to an appropriate service, and treating, all eligible patients aged 50 and over who have suffered a fragility fracture.
Since the first FLS-DB report, an additional 11 FLSs are participating in this audit and 42,589 patient records are included in this report. However, over 100 trusts and local health boards (LHBs) and centres did not participate in the audit, so we are unable to demonstrate the quality of secondary fracture prevention for their patients even if an FLS was present. The vast majority of trusts and LHBs that did not provide data do not have an active FLS.
There is growing confidence in the value of using the audit to improve the quality of secondary fracture prevention. A growing number of FLSs are achieving quality in a number of key performance indicators (KPIs). This is an opportunity to share learning and good practice.
Key findings
1 Although participation in the FLS-DB has improved, national coverage of secondary fracture prevention by FLSs remains inadequate.
2 There have been substantial improvements in data quality. No audit question has more than 50% of data missing.
3 There has been an improvement in the number of patients who receive a falls assessment (40% compared with 32% in the first report).
4 Of the estimated number of fragility fracture patients, 40% were submitted to the FLS-DB with six FLSs now submitting at least 80% of their expected case load.
5 Overall, 67% of patients were assessed by an FLS within 90 days of their fracture. 6 In total, 43% of patients were assessed with a DXA scan within 90 days of their fracture. 7 Monitoring remains a concern. Although there has been an improvement, only 41% of
patients who were prescribed anti-osteoporosis medication had monitoring contact documented within the audit.
Key recommendations
All FLSs should submit data to the FLS-DB. NHS foundation trusts are required to participate in National Clinical Audit and Patient Outcomes Programme (NCAPOP) audits that are relevant to the services that they provide as part of their NHS contract. Those services that are not currently participating should implement an urgent action plan to address this.
FLSs that participated in the report should:
• prioritise reviewing their methods of identifying patients and their monitoring pathway aspart of their service improvement programme develop a service improvement plan toaddress other key areas where they failed to meet adequate standards of performance
• review their performance using their own live run charts, which are available on the FLS-DBwebtool (http://fffap.org/fls/flsweb.nsf) and share their data with their trust board / LHBand clinical commissioning group (CCG).
© Healthcare Quality Improvement Partnership 2017 7
Fracture Liaison Service Database (FLS-DB) annual report. October 2017
Chief executives and hospital trust boards that have an FLS should:
• review their local findings and ask FLSs to provide evidence of how they are participating inthis mandatory national audit, prioritising service improvement, and support their deliveryof this.
Chief executives and hospital trust boards that do not have an FLS should:
• recognise that secondary fracture prevention provides an opportunity to reduce activity inA&E and trauma units, and to reduce non-elective admissions and length of stay
• use the opportunity of sustainability and transformation partnership (STP) planning toconsider the coverage of secondary fracture prevention across the region, to ensure that allrelevant patients have access to an FLS.
Commissioners and LHBs should:
• review this report’s findings: CCGs that do not have an FLS should actively support a projectplan so that they can implement a service in 2017/18
• align the KPIs for their FLS(s) with the KPIs that are detailed in this report, to reduceduplication and improve transparency.
8 © Healthcare Quality Improvement Partnership 2017
Fracture Liaison Service Database (FLS-DB) annual report. October 2017
FLS performance summary
A set of 11 KPIs were chosen by our multidisciplinary advisory group (Appendix C), which includes patient representation. All the KPIs are based on National Institute for Health and Care Excellence (NICE) technology assessments and guidance on osteoporosis and the National Osteoporosis Society (NOS) clinical standards for FLSs. FLSs should aim to deliver these KPIs as part of their service. The following five KPIs are particularly indicative of good practice.
Five core KPIs
KPI 1 Data completeness The number of non-mandatory fields with >20% non-mandatory missing data
KPI 2 Identification – all fragility fractures The percentage of fragility fracture patient records that were submitted to the FLS-DB compared with the local expected case load
KPI 4 Time to FLS assessment The percentage of patients who were assessed by the FLS within 90 days of their fracture
KPI 9 Monitoring contact 12–16 weeks post fracture The percentage of patients who were followed up by 12–16 weeks post fracture
KPI 10 Commenced bone therapy by 16 weeks post fracture The percentage of patients who had commenced (or were continuing) anti-osteoporosis medication by 16 weeks post fracture.
Six additional KPIs
KPI 3 Identification – spinal fractures The percentage of patients with a spine fracture as the primary fracture site whose data were submitted to the FLS-DB
KPI 5 Time to DXA The percentage of patients who received a DXA scan within 90 days of their fracture
KPI 6 Falls assessment The percentage of patients who had been referred or recommended for, or had received, a falls assessment
KPI 7 Bone therapy recommended as inappropriate The percentage of patients for whom a treatment recommendation was recorded as ‘clinical decision not to treat or inappropriate’
KPI 8 Strength and balance training The percentage of patients who had attended a strength and balance class within 16 weeks of their fracture
KPI 11 Adherent to a prescribed anti-osteoporosis drug 12 months after their fracture The percentage of patients who had confirmed adherence to a prescribed anti-osteoporosis drug at 12 months post fracture.
© Healthcare Quality Improvement Partnership 2017 9
Fracture Liaison Service Database (FLS-DB) annual report. October 2017
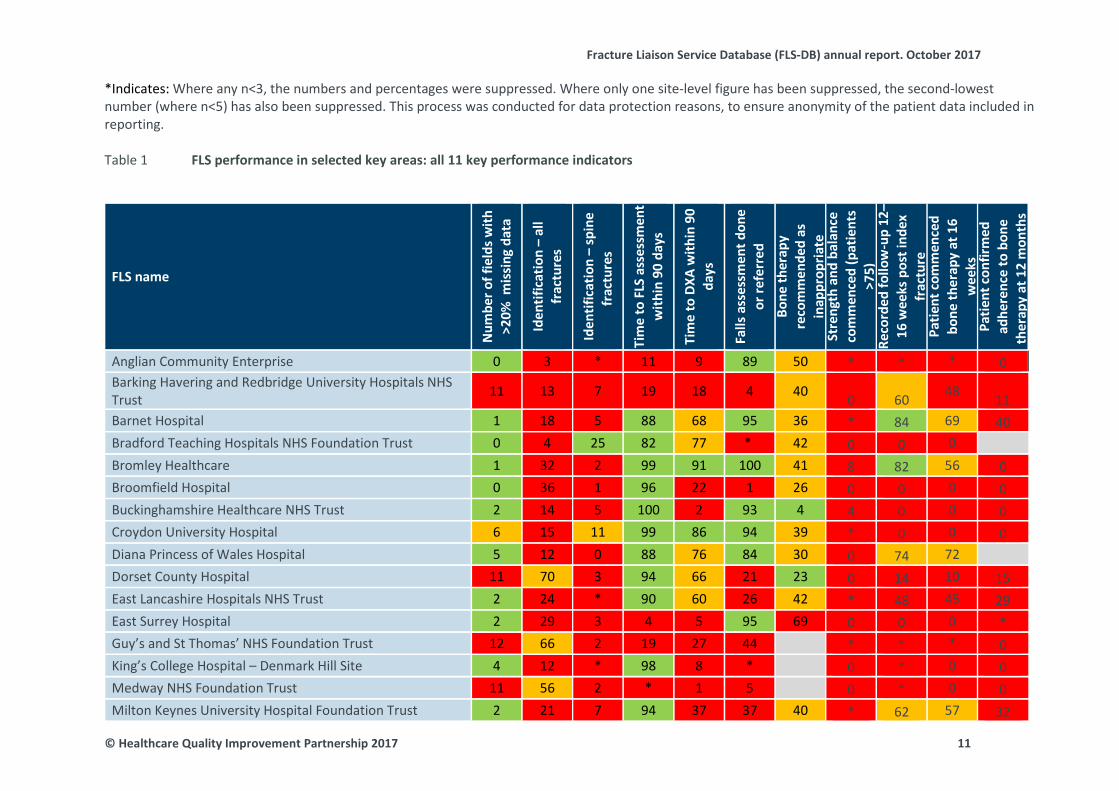
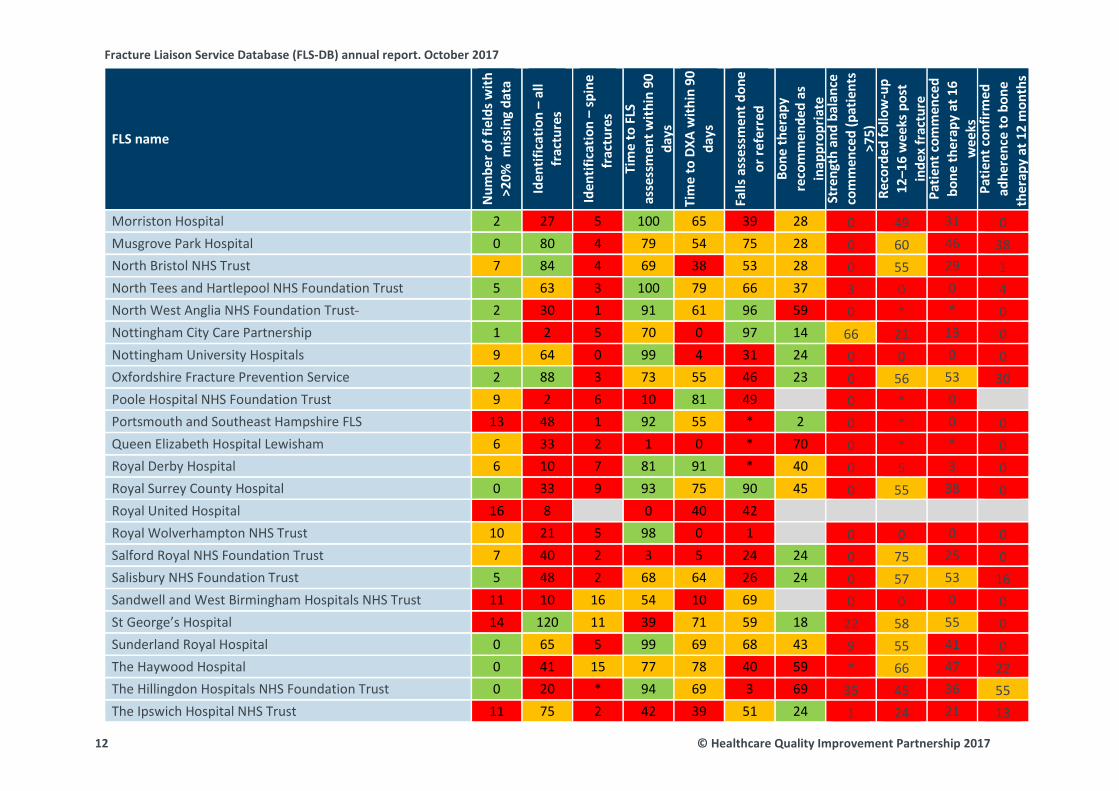
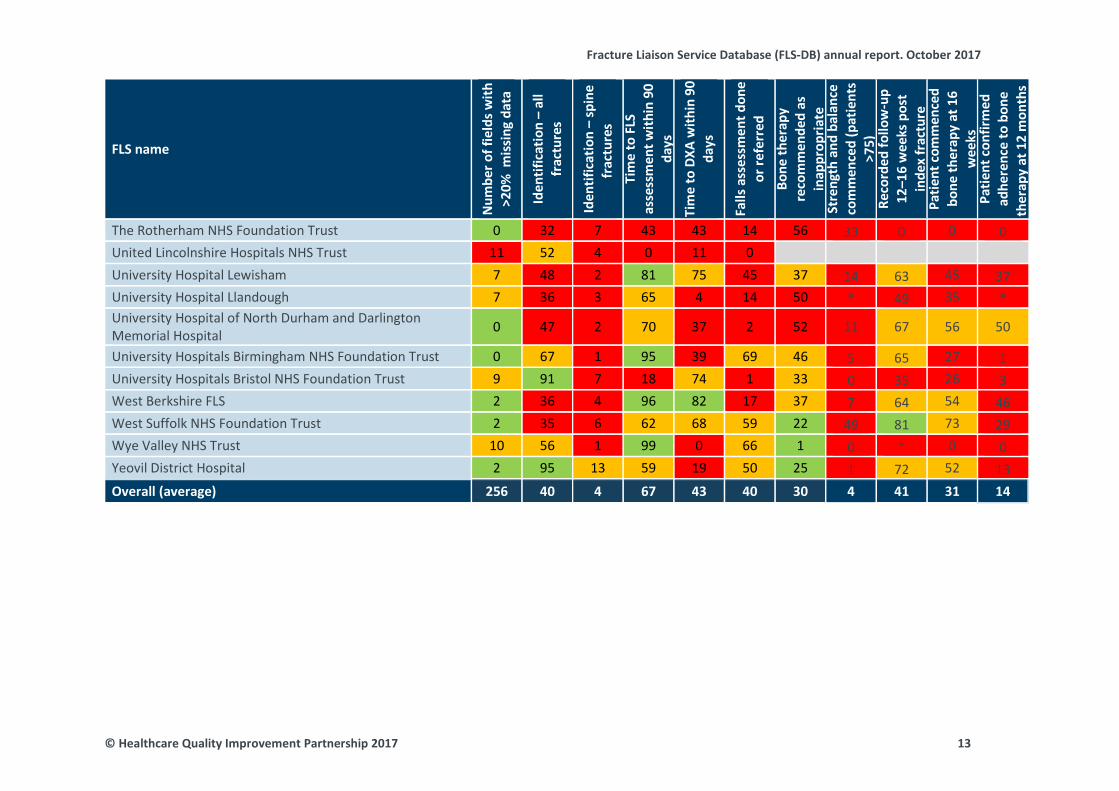
Some FLSs are meeting key aspects for secondary fracture prevention. Overall, 11 summary standards represent performance indicators across the secondary prevention pathway and two FLSs scored green on four or more fields. Unless otherwise indicated, we chose to use colour coding to demonstrate the specific proportions of FLSs that were achieving the specified standard: 0–49% (red), 50–79% (amber) and 80–100% (green).
10 © Healthcare Quality Improvement Partnership 2017
Fracture Liaison Service Database (FLS-DB) annual report. October 2017
*Indicates: Where any n<3, the numbers and percentages were suppressed. Where only one site-level figure has been suppressed, the second-lowestnumber (where n<5) has also been suppressed. This process was conducted for data protection reasons, to ensure anonymity of the patient data included in reporting.
FLS performance in selected key areas: all 11 key performance indicators Table 1
FLS name
Num
ber o
f fie
lds w
ith
>20%
mis
sing
dat
a
Iden
tific
atio
n –
all
frac
ture
s
Iden
tific
atio
n –
spin
e fr
actu
res
Tim
e to
FLS
ass
essm
ent
with
in 9
0 da
ys
Tim
e to
DXA
with
in 9
0 da
ys
Falls
ass
essm
ent d
one
or re
ferr
ed
Bone
ther
apy
reco
mm
ende
d as
in
appr
opria
te
Stre
ngth
and
bal
ance
co
mm
ence
d (p
atie
nts
>75)
Re
cord
ed fo
llow
-up
12–
16 w
eeks
pos
t ind
ex
frac
ture
Pa
tient
com
men
ced
bone
ther
apy
at 1
6 w
eeks
Pa
tient
con
firm
ed
adhe
renc
e to
bon
e th
erap
y at
12
mon
ths
Anglian Community Enterprise 0 3 * 11 9 89 50 * * * 0 Barking Havering and Redbridge University Hospitals NHS Trust 11 13 7 19 18 4 40 0 60 48 11 Barnet Hospital 1 18 5 88 68 95 36 * 84 69 40 Bradford Teaching Hospitals NHS Foundation Trust 0 4 25 82 77 * 42 0 0 0 Bromley Healthcare 1 32 2 99 91 100 41 8 82 56 0 Broomfield Hospital 0 36 1 96 22 1 26 0 0 0 0 Buckinghamshire Healthcare NHS Trust 2 14 5 100 2 93 4 4 0 0 0 Croydon University Hospital 6 15 11 99 86 94 39 * 0 0 0 Diana Princess of Wales Hospital 5 12 0 88 76 84 30 0 74 72 Dorset County Hospital 11 70 3 94 66 21 23 0 14 10 15 East Lancashire Hospitals NHS Trust 2 24 * 90 60 26 42 * 48 45 29 East Surrey Hospital 2 29 3 4 5 95 69 0 0 0 * Guy’s and St Thomas’ NHS Foundation Trust 12 66 2 19 27 44 * * * 0 King’s College Hospital – Denmark Hill Site 4 12 * 98 8 * 0 * 0 0 Medway NHS Foundation Trust 11 56 2 * 1 5 0 * 0 0 Milton Keynes University Hospital Foundation Trust 2 21 7 94 37 37 40 * 62 57 32
© Healthcare Quality Improvement Partnership 2017 11
Fracture Liaison Service Database (FLS-DB) annual report. October 2017
FLS name
Num
ber o
f fie
lds w
ith
>20%
mis
sing
dat
a
Iden
tific
atio
n –
all
frac
ture
s
Iden
tific
atio
n –
spin
e fr
actu
res
Ti
me
to F
LS
asse
ssm
ent w
ithin
90
days
Ti
me
to D
XA w
ithin
90
days
Falls
ass
essm
ent d
one
or re
ferr
ed
Bone
ther
apy
reco
mm
ende
d as
in
appr
opria
te
Stre
ngth
and
bal
ance
co
mm
ence
d (p
atie
nts
>75)
Re
cord
ed fo
llow
-up
12–1
6 w
eeks
pos
t in
dex
frac
ture
Pa
tient
com
men
ced
bone
ther
apy
at 1
6 w
eeks
Pa
tient
con
firm
ed
adhe
renc
e to
bon
e th
erap
y at
12
mon
ths
Morriston Hospital 2 27 5 100 65 39 28 0 49 31 0 Musgrove Park Hospital 0 80 4 79 54 75 28 0 60 46 38 North Bristol NHS Trust 7 84 4 69 38 53 28 0 55 29 1 North Tees and Hartlepool NHS Foundation Trust 5 63 3 100 79 66 37 3 0 0 4 North West Anglia NHS Foundation Trust 2 30 1 91 61 96 59 0 * * 0 Nottingham City Care Partnership 1 2 5 70 0 97 14 66 21 13 0 Nottingham University Hospitals 9 64 0 99 4 31 24 0 0 0 0 Oxfordshire Fracture Prevention Service 2 88 3 73 55 46 23 0 56 53 30 Poole Hospital NHS Foundation Trust 9 2 6 10 81 49 0 * 0Portsmouth and Southeast Hampshire FLS 13 48 1 92 55 * 2 0 * 0 0 Queen Elizabeth Hospital Lewisham 6 33 2 1 0 * 70 0 * * 0 Royal Derby Hospital 6 10 7 81 91 * 40 0 5 3 0 Royal Surrey County Hospital 0 33 9 93 75 90 45 0 55 38 0 Royal United Hospital 16 8 0 40 42 Royal Wolverhampton NHS Trust 10 21 5 98 0 1 0 0 0 0 Salford Royal NHS Foundation Trust 7 40 2 3 5 24 24 0 75 25 0 Salisbury NHS Foundation Trust 5 48 2 68 64 26 24 0 57 53 16 Sandwell and West Birmingham Hospitals NHS Trust 11 10 16 54 10 69 0 0 0 0 St George’s Hospital 14 120 11 39 71 59 18 22 58 55 0 Sunderland Royal Hospital 0 65 5 99 69 68 43 9 55 41 0 The Haywood Hospital 0 41 15 77 78 40 59 * 66 47 22 The Hillingdon Hospitals NHS Foundation Trust 0 20 * 94 69 3 69 35 45 36 55 The Ipswich Hospital NHS Trust 11 75 2 42 39 51 24 1 24 21 13
12 © Healthcare Quality Improvement Partnership 2017
Fracture Liaison Service Database (FLS-DB) annual report. October 2017
FLS name
Num
ber o
f fie
lds w
ith
>20%
mis
sing
dat
a
Iden
tific
atio
n –
all
frac
ture
s
Iden
tific
atio
n –
spin
e fr
actu
res
Ti
me
to F
LS
asse
ssm
ent w
ithin
90
days
Ti
me
to D
XA w
ithin
90
days
Falls
ass
essm
ent d
one
or re
ferr
ed
Bone
ther
apy
reco
mm
ende
d as
in
appr
opria
te
Stre
ngth
and
bal
ance
co
mm
ence
d (p
atie
nts
>75)
Re
cord
ed fo
llow
-up
12–1
6 w
eeks
pos
t in
dex
frac
ture
Pa
tient
com
men
ced
bone
ther
apy
at 1
6 w
eeks
Pa
tient
con
firm
ed
adhe
renc
e to
bon
e th
erap
y at
12
mon
ths
The Rotherham NHS Foundation Trust 0 32 7 43 43 14 56 33 0 0 0 United Lincolnshire Hospitals NHS Trust 11 52 4 0 11 0 University Hospital Lewisham 7 48 2 81 75 45 37 14 63 45 37 University Hospital Llandough 7 36 3 65 4 14 50 * 49 35 * University Hospital of North Durham and Darlington Memorial Hospital 0 47 2 70 37 2 52 11 67 56 50
University Hospitals Birmingham NHS Foundation Trust 0 67 1 95 39 69 46 5 65 27 1 University Hospitals Bristol NHS Foundation Trust 9 91 7 18 74 1 33 0 35 26 3 West Berkshire FLS 2 36 4 96 82 17 37 7 64 54 46 West Suffolk NHS Foundation Trust 2 35 6 62 68 59 22 49 81 73 29 Wye Valley NHS Trust 10 56 1 99 0 66 1 0 * 0 0 Yeovil District Hospital 2 95 13 59 19 50 25 1 72 52 13 Overall (average) 256 40 4 67 43 40 30 4 41 31 14
© Healthcare Quality Improvement Partnership 2017 13
Fracture Liaison Service Database (FLS-DB) annual report. October 2017
National performance against KPIs: summary
KPI Standard/rationale Discussion Recommendation
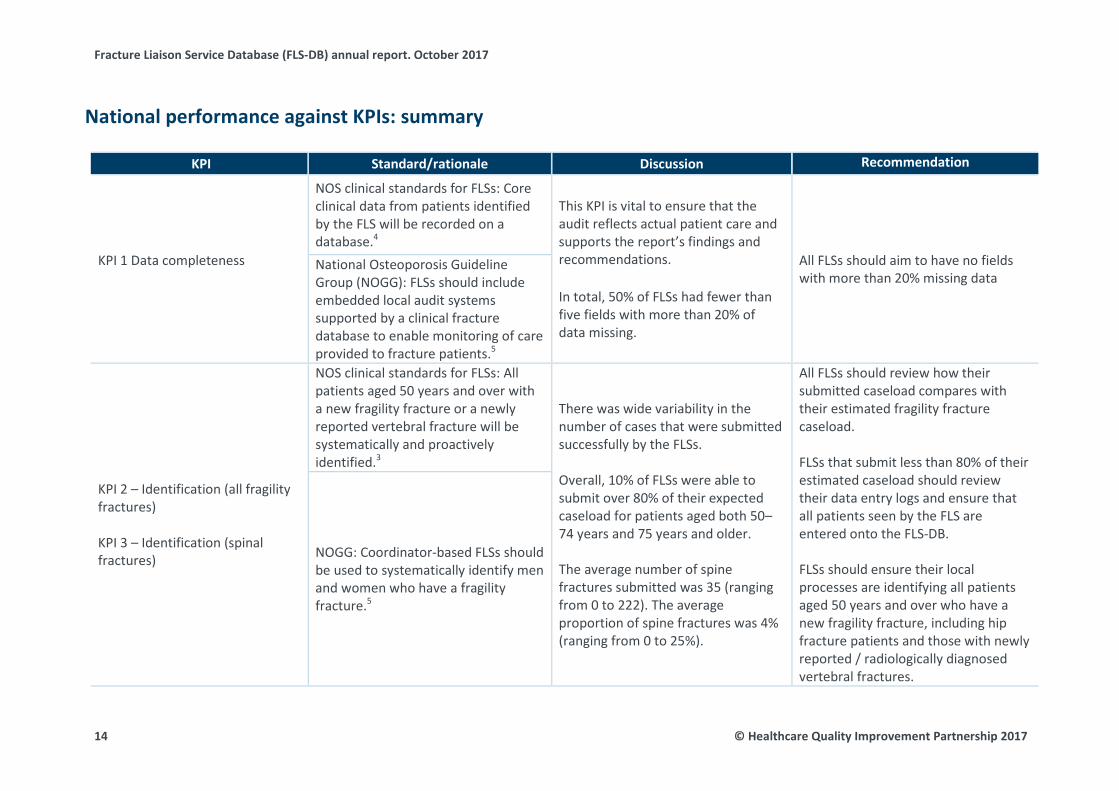
KPI 1 Data completeness
NOS clinical standards for FLSs: Core clinical data from patients identified by the FLS will be recorded on a database.4
This KPI is vital to ensure that the audit reflects actual patient care and supports the report’s findings and recommendations.
In total, 50% of FLSs had fewer than five fields with more than 20% of data missing.
All FLSs should aim to have no fields with more than 20% missing data
National Osteoporosis Guideline Group (NOGG): FLSs should include embedded local audit systems supported by a clinical fracture database to enable monitoring of care provided to fracture patients.5
KPI 2 – Identification (all fragility fractures)
KPI 3 – Identification (spinal fractures)
NOS clinical standards for FLSs: All patients aged 50 years and over with a new fragility fracture or a newly reported vertebral fracture will be systematically and proactively identified.3
There was wide variability in the number of cases that were submitted successfully by the FLSs.
Overall, 10% of FLSs were able to submit over 80% of their expected caseload for patients aged both 50–74 years and 75 years and older.
The average number of spine fractures submitted was 35 (ranging from 0 to 222). The average proportion of spine fractures was 4% (ranging from 0 to 25%).
All FLSs should review how their submitted caseload compares with their estimated fragility fracture caseload.
FLSs that submit less than 80% of their estimated caseload should review their data entry logs and ensure that all patients seen by the FLS are entered onto the FLS-DB.
FLSs should ensure their local processes are identifying all patients aged 50 years and over who have a new fragility fracture, including hip fracture patients and those with newly reported / radiologically diagnosed vertebral fractures.
NOGG: Coordinator-based FLSs should be used to systematically identify men and women who have a fragility fracture.5
14 © Healthcare Quality Improvement Partnership 2017

Fracture Liaison Service Database (FLS-DB) annual report. October 2017
KPI Standard/rationale Discussion Recommendation
KPI 4 – Time to FLS assessment
NOS clinical standards for FLSs: Patients will have a bone health assessment, and their need for a comprehensive falls risk assessment will be evaluated within 3 months of the incident fracture.3
Overall, 67% of patients were assessed by an FLS within 90 days of their fracture. Half of FLSs were able to assess over 80% of their patients within 90 days of the index fracture.
All FLSs should review their average time from fragility fracture diagnosis to FLS assessment. FLSs that are not able to assess at least 80% of their patients within 90 days of their fracture should consider reviewing their patient pathways and develop a local service improvement plan.
FLSs should check that the date of contact is recorded in the local patient data record. In many cases, this will be the same as the date of assessment.
KPI 5 – Time to DXA
NOS clinical standards for FLSs: Patients will have a bone health assessment within 3 months of an incident fracture.3
Overall, 68% of patients aged 50–74 had a DXA ordered or recommended, or had undergone a DXA in the previous 2 years. Approximately 20% of patients aged 75 years and over were recommended to have a DXA (ranging from 0% to 99%).
All FLSs should review their average time from fragility fracture diagnosis to DXA. FLSs that are not able to provide DXA assessment within 90 days of the fragility fracture diagnosis for at least 80% of their patients should review their current patient pathways and develop a local service improvement plan. FLSs that are under-resourced for DXA assessment should work with their local commissioners to develop a business case for improved services, including reviewing the DXA requirement for those with a fragility fracture who are aged 75 years and over.
© Healthcare Quality Improvement Partnership 2017 15

Fracture Liaison Service Database (FLS-DB) annual report. October 2017
KPI Standard/rationale Discussion Recommendation If time to DXA is a quality issue, prioritisation should be given to those who are aged 50–74.
KPI 6 – Falls assessment
NOS clinical standards for FLSs, NOGG, NICE CG161, NICE QS86, BOA The care of patients with fragility fracture: Older people who present for medical attention because of a fall or have reported recurrent falls in the past year should be offered a multifactorial falls risk assessment.4–8
Overall, 40% of patients received or were referred for a falls risk assessment.
FLSs that are not routinely performing or referring for falls risk assessments should review their current clinical pathway and liaise with other FLSs that are able to meet these criteria to develop a local service improvement plan.
KPI 7 – Bone therapy recommended as inappropriate
NOS clinical standards for FLSs, NOGG, NICE TA161 and NICE QS149: Patients who are at increased risk of further fracture will be offered appropriate bone-protection treatments.4,5,9,10
Despite there being a single set of NICE guideline documents, interpretation and implementation is variable.
Anti-osteoporosis medication was considered to be inappropriate for 30% patients (ranging from 0% to 70%).
FLSs with a very low or very high proportion of recommendations that treatment is inappropriate should review their clinical pathways.
KPI 8 – Strength and balance training
NICE CG161, NICE QS86: Older people who report a fall should be considered for strength and balance training.6,7 Overall, 4% of fracture patients aged
75 and over (prescribed anti-osteoporosis medication or referred for further clinical opinion or to their GP) had started strength and balance training by 16 weeks post fracture.
Falls interventions should be funded and monitored with the same rigour as FLSs and better national performance indicators are needed to identify effective and efficient falls pathways as they relate to patients seen within an FLS.
FLSs should engage with their strength and balance class groups to improve communication and uptake.
NOGG: Regular weight-bearing exercise should be advised, tailored according to the needs and abilities of the individual patient.5
16 © Healthcare Quality Improvement Partnership 2017
Fracture Liaison Service Database (FLS-DB) annual report. October 2017
KPI Standard/rationale Discussion Recommendation
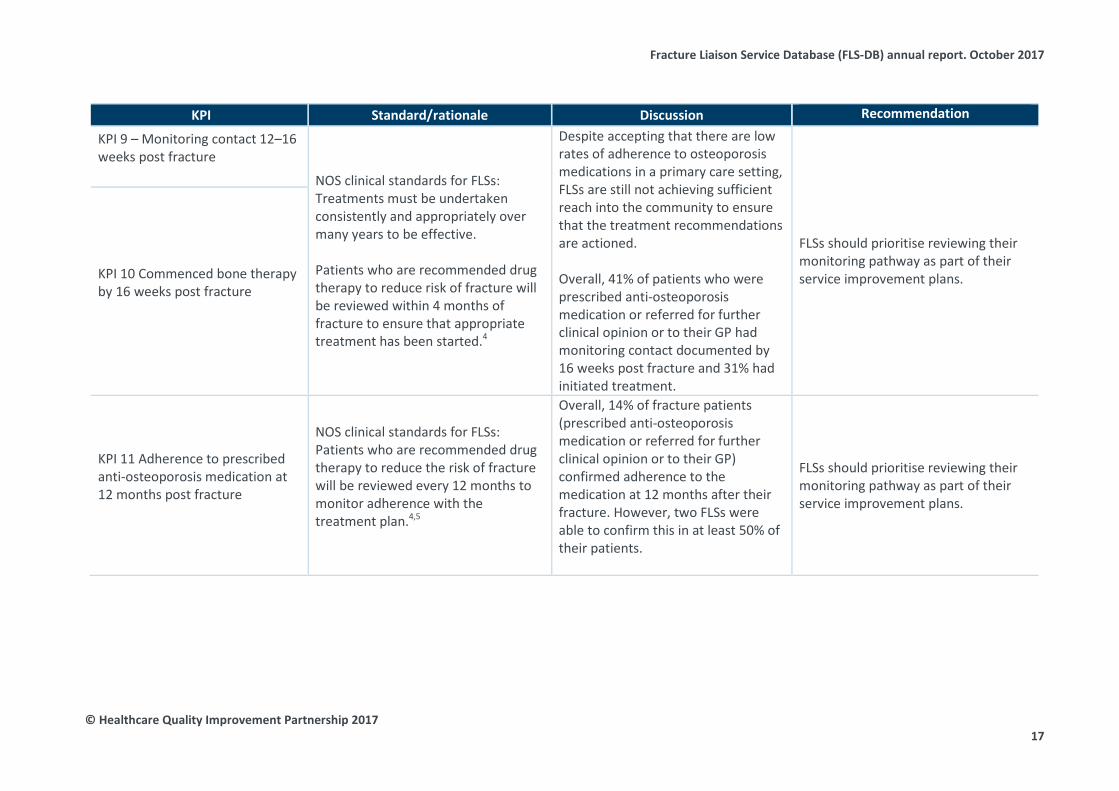
KPI 9 – Monitoring contact 12–16 weeks post fracture
NOS clinical standards for FLSs: Treatments must be undertaken consistently and appropriately over many years to be effective.
Patients who are recommended drug therapy to reduce risk of fracture will be reviewed within 4 months of fracture to ensure that appropriate treatment has been started.4
Despite accepting that there are low rates of adherence to osteoporosis medications in a primary care setting, FLSs are still not achieving sufficient reach into the community to ensure that the treatment recommendations are actioned.
Overall, 41% of patients who were prescribed anti-osteoporosis medication or referred for further clinical opinion or to their GP had monitoring contact documented by 16 weeks post fracture and 31% had initiated treatment.
FLSs should prioritise reviewing their monitoring pathway as part of their service improvement plans. KPI 10 Commenced bone therapy
by 16 weeks post fracture
KPI 11 Adherence to prescribed anti-osteoporosis medication at 12 months post fracture
NOS clinical standards for FLSs: Patients who are recommended drug therapy to reduce the risk of fracture will be reviewed every 12 months to monitor adherence with the treatment plan.4,5
Overall, 14% of fracture patients (prescribed anti-osteoporosis medication or referred for further clinical opinion or to their GP) confirmed adherence to the medication at 12 months after their fracture. However, two FLSs were able to confirm this in at least 50% of their patients.
FLSs should prioritise reviewing their monitoring pathway as part of their service improvement plans.
© Healthcare Quality Improvement Partnership 2017 17
Fracture Liaison Service Database (FLS-DB) annual report. October 2017
Results
KPI 1 Data completeness
Standards
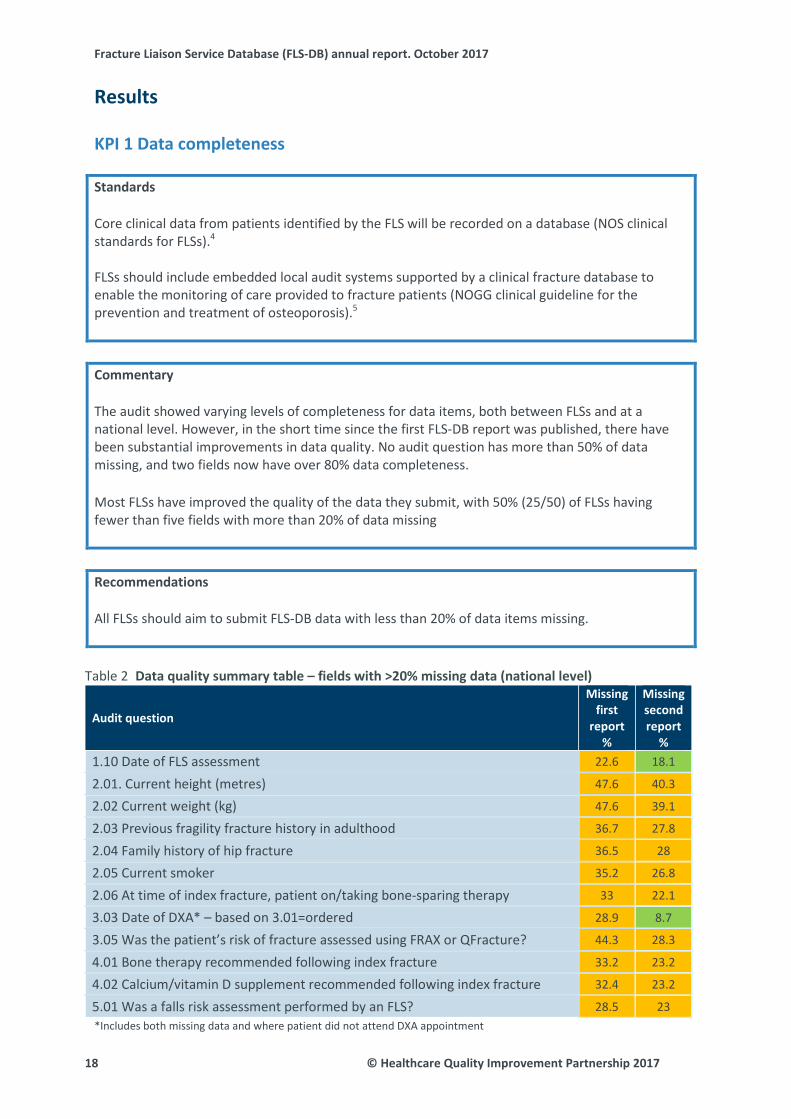
Core clinical data from patients identified by the FLS will be recorded on a database (NOS clinical standards for FLSs).4
FLSs should include embedded local audit systems supported by a clinical fracture database to enable the monitoring of care provided to fracture patients (NOGG clinical guideline for the prevention and treatment of osteoporosis).5
Commentary
The audit showed varying levels of completeness for data items, both between FLSs and at a national level. However, in the short time since the first FLS-DB report was published, there have been substantial improvements in data quality. No audit question has more than 50% of data missing, and two fields now have over 80% data completeness.
Most FLSs have improved the quality of the data they submit, with 50% (25/50) of FLSs having fewer than five fields with more than 20% of data missing
Recommendations
All FLSs should aim to submit FLS-DB data with less than 20% of data items missing.
Data quality summary table – fields with >20% missing data (national level) Table 2
Audit question
Missing first
report %
Missing second report
% 1.10 Date of FLS assessment 22.6 18.1
2.01. Current height (metres) 47.6 40.3
2.02 Current weight (kg) 47.6 39.1
2.03 Previous fragility fracture history in adulthood 36.7 27.8
2.04 Family history of hip fracture 36.5 28
2.05 Current smoker 35.2 26.8
2.06 At time of index fracture, patient on/taking bone-sparing therapy 33 22.1
3.03 Date of DXA* – based on 3.01=ordered 28.9 8.7
3.05 Was the patient’s risk of fracture assessed using FRAX or QFracture? 44.3 28.3
4.01 Bone therapy recommended following index fracture 33.2 23.2
4.02 Calcium/vitamin D supplement recommended following index fracture 32.4 23.2
5.01 Was a falls risk assessment performed by an FLS? 28.5 23 *Includes both missing data and where patient did not attend DXA appointment
18 © Healthcare Quality Improvement Partnership 2017
Fracture Liaison Service Database (FLS-DB) annual report. October 2017
KPIs 2 and 3 Identification
Standards
All patients aged 50 years and over who have a new fragility fracture or a newly reported vertebral fracture will be systematically and proactively identified (NOS clinical standards for FLSs).4
Coordinator-based FLSs should be used to systematically identify men and women with a fragility fracture (NOGG clinical guideline for the prevention and treatment of osteoporosis).5
Commentary
The systematic case finding of patients who present with fragility fractures is the essential first step for an effective FLS. A low rate of case ascertainment reflects suboptimal case finding and/or a failure to submit all identified cases to the audit. The percentage identification is a KPI that will be publically available in close-to-real-time run charts by spring 2018.
The average number of patients that an FLS was estimated to see per annum was 2,155. The average number submitted was 852, with a wide variation from 64 to 2,989 (Table 4).
The average rate of identification was 40%. The proportion of FLSs that are identifying less than 30% of their estimated caseload has changed from 47% (18/38) to 38% (19/50). Overall, 12% (6/50) of FLSs submitted more than 80% of their estimated caseload, which comparable to the first report 13% (5).
Spine fractures Most fracture types will be managed through trauma/orthopaedic pathways, but vertebral fractures often require different strategies for systematic and effective case findings.
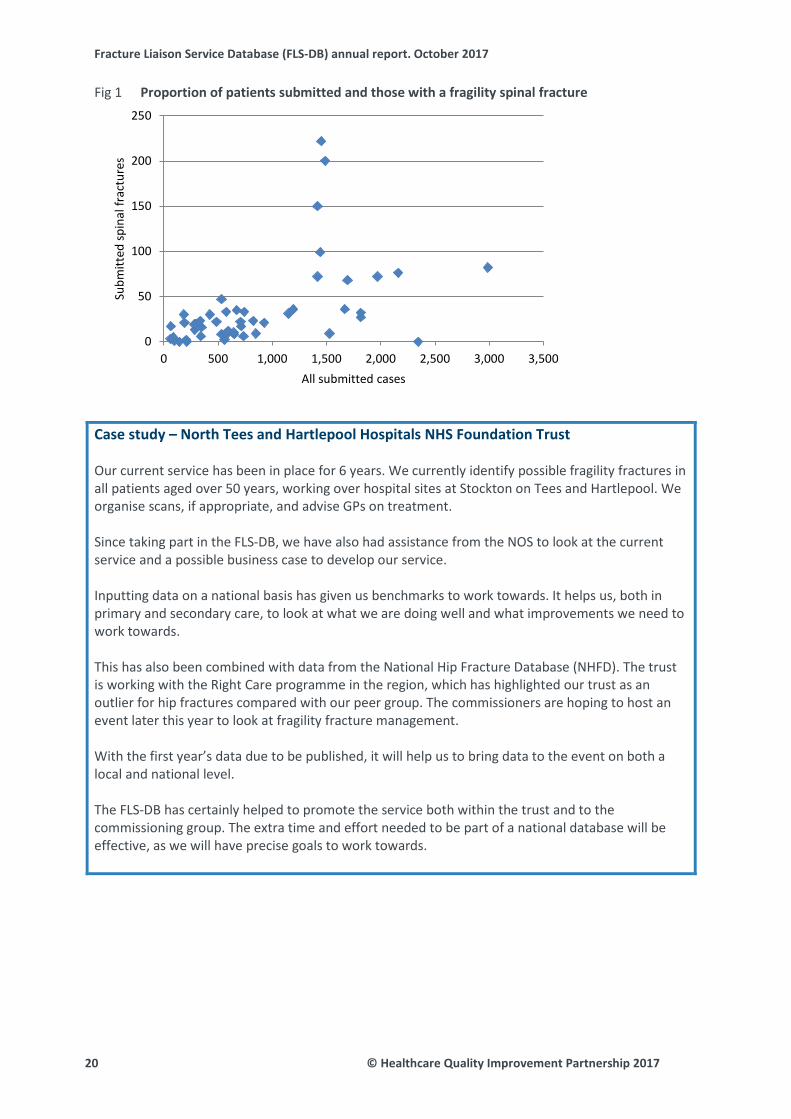
Spine fractures are one of the most common fragility fractures; however there are significant challenges with case finding. In the facilities audit, 37% of FLSs in England reported that they did not routinely identified patients presenting with a clinical vertebral fracture.11 The average number of spine fractures submitted was 35 (ranging from 0 to 222). The average proportion of spine fractures was 4% (ranging from 0 to 25%). Eighteen percent (9/50) of FLSs submitted at least 50 spine fractures. While FLSs that submitted more patients generally submitted spine fractures, there was wide variation even between FLSs that submitted similar numbers (Fig 1).
Recommendations
• All FLSs should review how their submitted caseload compares with their estimated fragilityfracture caseload.
• FLSs that submitted less than 80% of their estimated caseload should review their dataentry logs and ensure that all patients seen by the FLS are entered onto the FLS-DB.
• FLSs should ensure their local processes are identifying all patients aged 50 years and overwith a new fragility fracture, including hip fracture patients and those with newly reportedvertebral fractures.
© Healthcare Quality Improvement Partnership 2017 19
Fracture Liaison Service Database (FLS-DB) annual report. October 2017
Proportion of patients submitted and those with a fragility spinal fracture Fig 1
Case study – North Tees and Hartlepool Hospitals NHS Foundation Trust
Our current service has been in place for 6 years. We currently identify possible fragility fractures in all patients aged over 50 years, working over hospital sites at Stockton on Tees and Hartlepool. We organise scans, if appropriate, and advise GPs on treatment.
Since taking part in the FLS-DB, we have also had assistance from the NOS to look at the current service and a possible business case to develop our service.
Inputting data on a national basis has given us benchmarks to work towards. It helps us, both in primary and secondary care, to look at what we are doing well and what improvements we need to work towards.
This has also been combined with data from the National Hip Fracture Database (NHFD). The trust is working with the Right Care programme in the region, which has highlighted our trust as an outlier for hip fractures compared with our peer group. The commissioners are hoping to host an event later this year to look at fragility fracture management.
With the first year’s data due to be published, it will help us to bring data to the event on both a local and national level.
The FLS-DB has certainly helped to promote the service both within the trust and to the commissioning group. The extra time and effort needed to be part of a national database will be effective, as we will have precise goals to work towards.
0
50
100
150
200
250
0 500 1,000 1,500 2,000 2,500 3,000 3,500
Subm
itted
spin
al fr
actu
res
All submitted cases
20 © Healthcare Quality Improvement Partnership 2017
Fracture Liaison Service Database (FLS-DB) annual report. October 2017
KPI 4 Time to FLS assessment (investigation)
Standard
Patients will have a bone health assessment, and their need for a comprehensive falls risk assessment will be evaluated within 3 months of the incident fracture (NOS clinical standards for FLSs).4
Commentary
Rapid assessment after a fracture is important because it: • permits earlier introduction of anti-osteoporosis therapy• improves adherence to bone therapies (if initiated)• reduces uncertainty from the patient’s perspective.
Overall, despite more FLSs joining the FLS-DB since the first report was published, the number of patients who are being seen within 90 days after their fracture remains comparable (67% vs 68%). At the FLS level, 50% (25/50) of services were able to assess at least 80% of their patients within 90 days of their fracture. This compares with 52% (20/38) of FLSs in the first report.
Impressively, 24% (12/50) of FLSs are now able to assess over 95% of patients with 90 days.
Overall, 28% (14/50) of FLSs saw less than 50% of patients within 90 days, which is comparable to the 26% (10/38) from the first report.
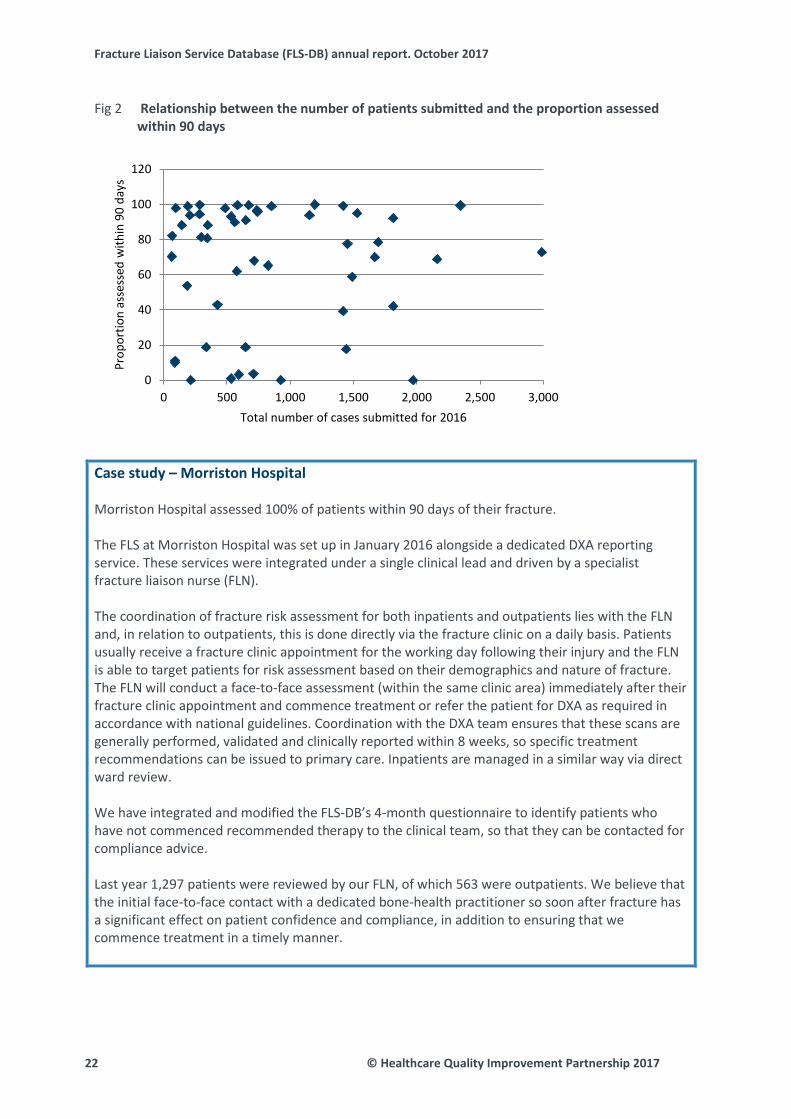
Again, there was no association between the size (in terms of caseload) of an FLS and the proportion of patients with fracture seen within 90 days (Fig 2), which suggests that both small and large services are able to perform well against this standard if appropriate systems are implemented.
Recommendations
• All FLSs should review their average time from fragility fracture diagnosis to FLSassessment. FLSs that are not able to assess at least 80% of their patients within 90 daysshould consider reviewing their funding for staff and patient pathways, and should liaisewith an FLS that has a similar estimated fragility fracture caseload to develop local serviceimprovement plans.
• FLSs should check that the date of contact is recorded in their local patient data record. Inmany cases, this will be the same as the date of assessment.
© Healthcare Quality Improvement Partnership 2017 21
Fracture Liaison Service Database (FLS-DB) annual report. October 2017
Relationship between the number of patients submitted and the proportion assessed Fig 2within 90 days
Case study – Morriston Hospital
Morriston Hospital assessed 100% of patients within 90 days of their fracture.
The FLS at Morriston Hospital was set up in January 2016 alongside a dedicated DXA reporting service. These services were integrated under a single clinical lead and driven by a specialist fracture liaison nurse (FLN).
The coordination of fracture risk assessment for both inpatients and outpatients lies with the FLN and, in relation to outpatients, this is done directly via the fracture clinic on a daily basis. Patients usually receive a fracture clinic appointment for the working day following their injury and the FLN is able to target patients for risk assessment based on their demographics and nature of fracture. The FLN will conduct a face-to-face assessment (within the same clinic area) immediately after their fracture clinic appointment and commence treatment or refer the patient for DXA as required in accordance with national guidelines. Coordination with the DXA team ensures that these scans are generally performed, validated and clinically reported within 8 weeks, so specific treatment recommendations can be issued to primary care. Inpatients are managed in a similar way via direct ward review.
We have integrated and modified the FLS-DB’s 4-month questionnaire to identify patients who have not commenced recommended therapy to the clinical team, so that they can be contacted for compliance advice.
Last year 1,297 patients were reviewed by our FLN, of which 563 were outpatients. We believe that the initial face-to-face contact with a dedicated bone-health practitioner so soon after fracture has a significant effect on patient confidence and compliance, in addition to ensuring that we commence treatment in a timely manner.
0
20
40
60
80
100
120
0 500 1,000 1,500 2,000 2,500 3,000
Prop
ortio
n as
sess
ed w
ithin
90
days
Total number of cases submitted for 2016
22 © Healthcare Quality Improvement Partnership 2017
Fracture Liaison Service Database (FLS-DB) annual report. October 2017
KPI 5 Time to DXA (investigation)
Standard
Patients will have a bone health assessment within 3 months of an incident fracture (NOS clinical standards for FLSs).4
Commentary
Given the importance of DXA for assessing fracture risk, timely assessment is usually needed to allow time-appropriate recommendations for the initiation of anti-osteoporosis medication.
Of those patients for whom a DXA scan was recommended or ordered, 43% were scanned within 90 days of their fracture: 10% (5/50) of FLSs were able to scan individuals with a DXA within 90 days in over 80% of cases. Fifty percent (25/50) of FLSs were unable to arrange a DXA scan within 90 days of the index fracture for at least 50% of patients.
Since the first FLS-DB report, there has been a 3% increase in the number of patients receiving a DXA scan within 90 days of their fracture.
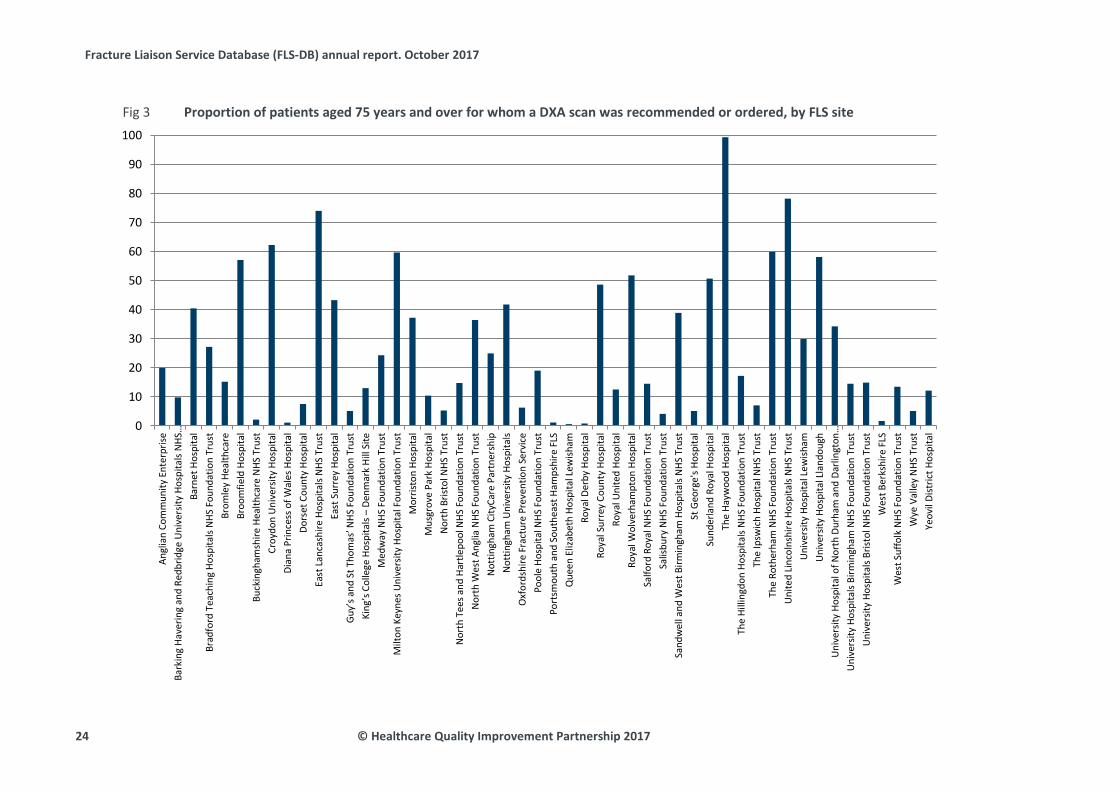
Of patients aged 75 years and over, the number and proportion for whom a DXA was recommended varied widely by site (Fig 3). This is likely to reflect differences in the interpretation of NICE TA161, which states:
If a woman aged 75 years or older has not previously had her BMD measured, a DXA scan may not be required if the responsible clinician considers it to be clinically inappropriate or unfeasible.9
It would appear that some FLSs interpret this as an ‘opt in’ for DXA, while for others it is an ‘opt out’. Results may also depend on rules relating to local CCG commissioning.
Recommendations
• All FLSs should review their average time from fragility fracture diagnosis to DXA. FLSs thatare not able to provide a DXA assessment within 90 days of the fragility fracture diagnosisfor at least 80% of their patients should review their current patient pathways, and developa local service improvement plan.
• FLSs that are under-resourced for DXA assessment should work with their localcommissioners to develop a business case for improved services, including reviewing theDXA requirement for those with a fragility fracture aged 75 years and over.
• If time to DXA is a quality issue, prioritisation should be given to patients aged 50–74.
© Healthcare Quality Improvement Partnership 2017 23
Fracture Liaison Service Database (FLS-DB) annual report. October 2017
Proportion of patients aged 75 years and over for whom a DXA scan was recommended or ordered, by FLS site Fig 3
0
10
20
30
40
50
60
70
80
90
100
Angl
ian
Com
mun
ity E
nter
prise
Bark
ing
Have
ring
and
Redb
ridge
Uni
vers
ity H
ospi
tals
NHS
…Ba
rnet
Hos
pita
lBr
adfo
rd T
each
ing
Hosp
itals
NHS
Fou
ndat
ion
Trus
tBr
omle
y He
alth
care
Broo
mfie
ld H
ospi
tal
Buck
ingh
amsh
ire H
ealth
care
NHS
Tru
stCr
oydo
n U
nive
rsity
Hos
pita
lDi
ana
Prin
cess
of W
ales
Hos
pita
lDo
rset
Cou
nty
Hosp
ital
East
Lan
cash
ire H
ospi
tals
NHS
Tru
stEa
st S
urre
y Ho
spita
lGu
y’s a
nd S
t Tho
mas
’ NHS
Fou
ndat
ion
Trus
t Ki
ng’s
Col
lege
Hos
pita
ls –
Denm
ark
Hill
Site
M
edw
ay N
HS F
ound
atio
n Tr
ust
Milt
on K
eyne
s Uni
vers
ity H
ospi
tal F
ound
atio
n Tr
ust
Mor
risto
n Ho
spita
lM
usgr
ove
Park
Hos
pita
lN
orth
Bris
tol N
HS T
rust
Nor
th T
ees a
nd H
artle
pool
NHS
Fou
ndat
ion
Trus
tN
orth
Wes
t Ang
lia N
HS F
ound
atio
n Tr
ust
Not
tingh
am C
ityCa
re P
artn
ersh
ipN
ottin
gham
Uni
vers
ity H
ospi
tals
Oxf
ords
hire
Fra
ctur
e Pr
even
tion
Serv
ice
Pool
e Ho
spita
l NHS
Fou
ndat
ion
Trus
tPo
rtsm
outh
and
Sou
thea
st H
amps
hire
FLS
Que
en E
lizab
eth
Hosp
ital L
ewish
amRo
yal D
erby
Hos
pita
lRo
yal S
urre
y Co
unty
Hos
pita
lRo
yal U
nite
d Ho
spita
lRo
yal W
olve
rham
pton
Hos
pita
lSa
lford
Roy
al N
HS F
ound
atio
n Tr
ust
Salis
bury
NHS
Fou
ndat
ion
Trus
tSa
ndw
ell a
nd W
est B
irmin
gham
Hos
pita
ls N
HS T
rust
St G
eorg
e's H
ospi
tal
Sund
erla
nd R
oyal
Hos
pita
lTh
e Ha
ywoo
d Ho
spita
lTh
e Hi
lling
don
Hosp
itals
NHS
Fou
ndat
ion
Trus
tTh
e Ip
swic
h Ho
spita
l NHS
Tru
stTh
e Ro
ther
ham
NHS
Fou
ndat
ion
Trus
tU
nite
d Li
ncol
nshi
re H
ospi
tals
NHS
Tru
stU
nive
rsity
Hos
pita
l Lew
isham
Uni
vers
ity H
ospi
tal L
land
ough
Uni
vers
ity H
ospi
tal o
f Nor
th D
urha
m a
nd D
arlin
gton
…U
nive
rsity
Hos
pita
ls Bi
rmin
gham
NHS
Fou
ndat
ion
Trus
tU
nive
rsity
Hos
pita
ls Br
istol
NHS
Fou
ndat
ion
Trus
tW
est B
erks
hire
FLS
Wes
t Suf
folk
NHS
Fou
ndat
ion
Trus
tW
ye V
alle
y N
HS T
rust
Yeov
il Di
stric
t Hos
pita
l
24 © Healthcare Quality Improvement Partnership 2017
Fracture Liaison Service Database (FLS-DB) annual report. October 2017
KPI 6 Falls assessment and KPI 8 Strength and balance training
Standards
Older people who present for medical attention because of a fall or who report recurrent falls in the past year should be offered a multifactorial falls risk assessment (NOS clinical standards for FLSs; NOGG; NICE CG161; NICE QS86; BOA The care of patients with fragility fracture).4–8 Older people who report a fall should be considered for strength and balance training (NICE CG161, NICE QS86).6,7
Patients should be advised to undertake regular weight-bearing exercise, tailored according to the needs and abilities of the individual patient (NOGG).5
Commentary
Reviewing patients for falls risk after a fragility fracture is an integral part of their management to reduce their re-fracture risk.
Forty percent of patients received a falls assessment or were referred or recommended for a falls assessment. This compares with 32% in the first FLS-DB report.
Twenty percent (10/50) of FLSs were able to provide a falls assessment to over 80% of their patients. Overall, 18% (9/50) of FLSs returned missing data for over 50% of their patients, which is an improvement from 21% in the first report (8/38).
Of the 18 FLSs that were performing a falls assessment in fewer than 25% of their patients in the first report, six are assessing at least 30% of patients.
Therapeutic exercise is the best-evidenced intervention for falls prevention. For most patients, it is effective as a single intervention, as well as part of a multifactorial approach. In the first FLS-DB report, 87 patients had started a strength and balance class by the time of their first follow-up. This second report shows a dramatic improvement, with 520 patients having started a class by first follow-up. However, while this is an increase, it still only represents 4% of patients aged over 75 (3% of all patients) who were due to be monitored.
Falls interventions should be funded and monitored with the same rigour as FLSs, and better national performance indicators are needed to identify effective and efficient falls pathways as they relate to patients seen within an FLS.
Recommendations
• FLSs that are not routinely performing or referring patients for falls risk assessments shouldreview their current clinical pathway and liaise with other FLSs that are able to meet thesecriteria to develop a local improvement plan.
• FLSs should engage with their strength and balance class groups to improve communicationand uptake.
© Healthcare Quality Improvement Partnership 2017 25
Fracture Liaison Service Database (FLS-DB) annual report. October 2017
Case study – Peterborough City Hospital
Peterborough City Hospital assessed 96% of its patients for falls risk (compared with 40% across all FLSs).
We have had an osteoporosis service in Peterborough since 2002. For all patients who were aged over 50 years and went through the service, we adopted the policy of asking a number of questions with regard to falls. As this is a face-to-face consultation, it is easy to observe the way the patient walks into the consulting room and how steady they are on their feet and whether they use walking aids. We are also able to observe them getting into and out of chairs and whether they wear spectacles. This consultation is undertaken at their fracture clinic appointment.
As part of the assessment we also go through the list of medications that the patient is taking and we ask when this was last reviewed, particularly if they are taking a large number of medications. If this requires review, a letter is sent to the GP requesting that this is undertaken. We also have a symbol on our electronic patient fracture list (a red triangle with an F in the centre) that indicates that the patient has had a number of previous falls.
The fracture liaison nurse is able to refer the patient to the community physiotherapy team for further assessment and treatment. Hip fracture patients at Peterborough are recorded on the NHFD only; however they are all assessed by the ward physiotherapy teams prior to discharge. We have a falls and fracture prevention nurse and a hip fracture practitioner who regularly review ward patients. Patients and relatives can be given information on how they can obtain aids such as grab rails. Exercise and education classes are held in the local community for those with osteoporosis and osteopenia.
We have made the falls assessment a routine part of our osteoporosis assessment and we deal with the patients according to their individual needs.
26 © Healthcare Quality Improvement Partnership 2017

Fracture Liaison Service Database (FLS-DB) annual report. October 2017
Case study – Haywood Hospital
We have used the data from the FLS-DB to make a number of improvements to our service.
Firstly, before the first FLS-DB report came out, we could see clearly from the run charts that we were not doing well with regard to falls assessments. We worked with the falls team to introduce a new one-page assessment and adjust the criteria with which we could refer patients to their service. The run charts are fantastic for real-time feedback and we are delighted to be achieving 100% adherence to this standard now.
When the first FLS-DB report came out we were disappointed with our identification rate, which was markedly lower than we expected. As a team, we identified four possible issues.
The first, was a data collection issue – we had not been entering details of patients who were identified but not seen in the FLS, nor had we entered data on patients who were seen in the hip fracture pathway who did not have a DXA scan. Secondly, we felt that we could be identifying more inpatient fragility fractures, and we have recently employed a link nurse to increase identification of these patients. Finally, and perhaps most importantly, the catchment area for our FLS does not match the catchment area of the acute trust, which accepts hip fractures from a larger area. As the total number of expected fragility fractures is calculated from the number of recorded hip fractures, our FLS will never be able to identify 100% of those patients who are at risk in the wider area. However, we had already been working with colleagues in three neighbouring trusts and the CCG on a business case for an extended FLS to cover this area: FLS-DB data have been really helpful in progressing this case.
As a team, we thought we were doing really well with regard to the follow-up of patients. However, the run charts and report told a different story: 0% of our patients were on treatment at 4 months. As a result, we reviewed our timelines within the service, and found that we had been phoning patients 4 months after they had been seen in the FLS and not 4 months after the date of fracture. We wanted to call patients earlier, but we found this was impractical, as we were not leaving enough time for GPs to receive our reports. However, we then reviewed how long it was taking for our reports to be sent out. By reducing delays in reporting, we are slowly addressing this standard, and ensuring that our GPs and patients are receiving reports and treatment in a more timely manner.
Finally, the ability to benchmark our service against others has provided real insight. We have reviewed our local guidance around treatment thresholds since the first audit. We have also identified that we are scanning more patients aged over 75 than many other units. This has prompted us to review our exclusion criteria and consider local audit on did not attend (DNA) rates and adherence to treatment in this age group, for which we can easily use our exported data from the FLS-DB.
© Healthcare Quality Improvement Partnership 2017 27
Fracture Liaison Service Database (FLS-DB) annual report. October 2017
KPI 7 Bone therapy recommended as inappropriate
Standard
Patients who are at increased risk of further fracture will be offered appropriate bone-protection treatments (NOS clinical standards for FLSs, NOGG, NICE TA161 and NICE QS149).4,5,9,10
Commentary
Of the patients who have a recorded treatment outcome, 23% were recommended for bone therapy and 11% required further clinical input (either by a GP or another clinician).
There was marked variability in the proportion of patients who were determined to be ‘inappropriate’ for treatment (Table 8). The proportion was higher in patients under 75 years of age than those over 75 years of age (41% vs 16%). Twelve percent (6/50) of FLSs recommended that treatment was inappropriate in over 50% of submitted patients.
Despite NICE recommendations, the interpretation of the standard was variable, as evidenced in the types of bone therapy that were recommended by FLSs (Table 9). Oral bisphosphonates were the most commonly recommended agent overall (18%), although proportions varied between FLSs from 0% to 51%. The recommendation of parenteral bone therapy denosumab (3%) and/or zoledronate (2%) also showed marked variability, from 0% to 15% and 0% to 32% respectively.
Recommendation
FLSs that have a very low or very high proportion of recommendations that treatment is inappropriate should review their clinical pathways.
28 © Healthcare Quality Improvement Partnership 2017
Fracture Liaison Service Database (FLS-DB) annual report. October 2017
KPI 9 Monitoring contact 12–16 weeks post fracture KPI 10 Commenced bone therapy by 16 weeks post fracture KPI 11 Adherence to bone therapy at 12 months post fracture Standard Patients for whom drug therapy is recommended to reduce their risk of fracture will be reviewed within 4 months of their fracture, to ensure that appropriate treatment has been started (NOS clinical standards for FLSs and NOGG).4,5 Commentary Given the higher rate of re-fracture in the first 24 months post fragility fracture, the priority is rapid initiation of therapy and good adherence during this period. Unless most patients adhere to bone therapy, secondary fracture prevention will remain inadequate. Therefore, monitoring may be the most critical determinant of an FLS’s success, given the published poor adherence rates with oral bisphosphonates (up to 60% discontinued by 6 months after initiation).12 Poor adherence to anti-osteoporosis medication significantly reduces clinical effectiveness. The approval of intermittent parenteral therapies for osteoporosis offers a unique opportunity to address non-adherence. The rate of non-adherence to falls interventions is not known, but is likely to be at least as high as that for oral bisphosphonates. However, monitoring is also likely to be the most challenging aspect for an FLS, as it requires actively engaging with patients and healthcare professionals in primary care and community settings. Monitoring remains challenging for FLSs, although there has been an improvement, with 41% (compared with 36% in the first report) of patients who were prescribed anti-osteoporosis medication being followed up by 12–16 weeks post fracture, with three FLSs now able to complete a monitoring assessment in over 80% of eligible patients. Of the patients for whom anti-osteoporosis medication was recommended by their FLS, 13% were on treatment within the first 4 months. For the first time, we can report the 12-month monitoring data Overall, 14% were able to confirm adherence and two FLSs were able to confirm this in at least 50% of their patients. Recommendation FLSs should prioritise reviewing their patient monitoring pathway as part of their service improvement plans.
© Healthcare Quality Improvement Partnership 2017 29
Fracture Liaison Service Database (FLS-DB) annual report. October 2017 Case study – West Suffolk FLS West Suffolk FLS monitored 60% of patients who were prescribed anti-osteoporosis medication by 16 weeks: 32% of these patients had started strength and balance training at this point (compared with 2% across all FLSs). The West Suffolk FLS is a community-based service that proactively finds all patients aged over 50 who have sustained a fragility fracture by in reaching into the acute hospital. We complete a falls and bone health assessment in the patient’s own home after they complete their acute episode of care. This offers the opportunity to assess their home environment and discuss medication compliance issues, balance and strength opportunities, coping strategies to prevent further falls and other healthy living issues. We also suggest treatment options to the GP, including referral into secondary care for parenteral treatments. We make onward referrals to community physiotherapists, adult social services and occupational therapy (for home adaptations, assistive technology and voluntary services). We follow up patients either face to face or on the telephone as often as necessary, to support them with starting and remaining compliant with bone strengthening treatments. Every patient receives a follow-up questionnaire 12 months after their fracture, to which we have had a good return rate. In 2016 we had a 72% return rate, which demonstrated that 71% of patients remained compliant with treatment. Again this questionnaire gives us the opportunity to be involved with the patient’s care, and to make recommendations and onward referral as appropriate. As a community-based service, we have developed strong links with primary care and other health, social care and voluntary community services, which:
• keeps us up to date on the availability of falls prevention interventions • promotes awareness of falls prevention and bone health with our community colleagues • ensures that all patients are referred for an intervention that is most appropriate to their
need, eg balance and strength exercises, home hazard adaptations, voluntary sector day care and opticians.
30 © Healthcare Quality Improvement Partnership 2017
Fracture Liaison Service Database (FLS-DB) annual report. October 2017
FLS-level results Presentation of results
FLS-level results are presented throughout this report. Unless otherwise indicated, we chose to use colour coding to demonstrate the specific proportions of FLSs that were achieving the specified standard: 0–49% (red), 50–79% (amber) and 80–100% (green).
Small numbers policy
Where any ‘n’ (number) was <3, the numbers and percentages were suppressed. Where only one ‘n’ was <3, and the second-lowest number was <5, the second-lowest number and percentage was also suppressed. Where only one ‘n’ was <3 and the second-lowest number was not <5, the second-lowest number was barnadised (+1/–1). This process was conducted for data protection reasons, to ensure anonymity of the patient data included in reporting.
Data quality
Where appropriate, sites with more than 50% missing data for a field were not colour coded.
© Healthcare Quality Improvement Partnership 2017 31
Fracture Liaison Service Database (FLS-DB) annual report. October 2017
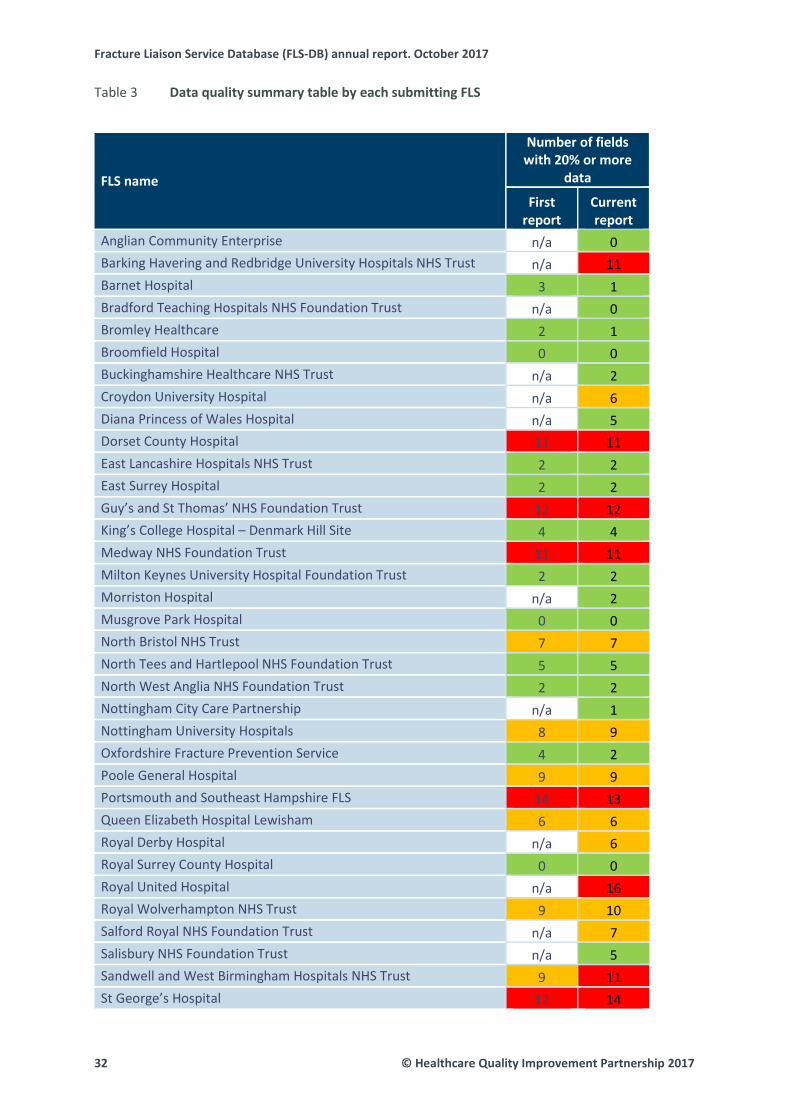
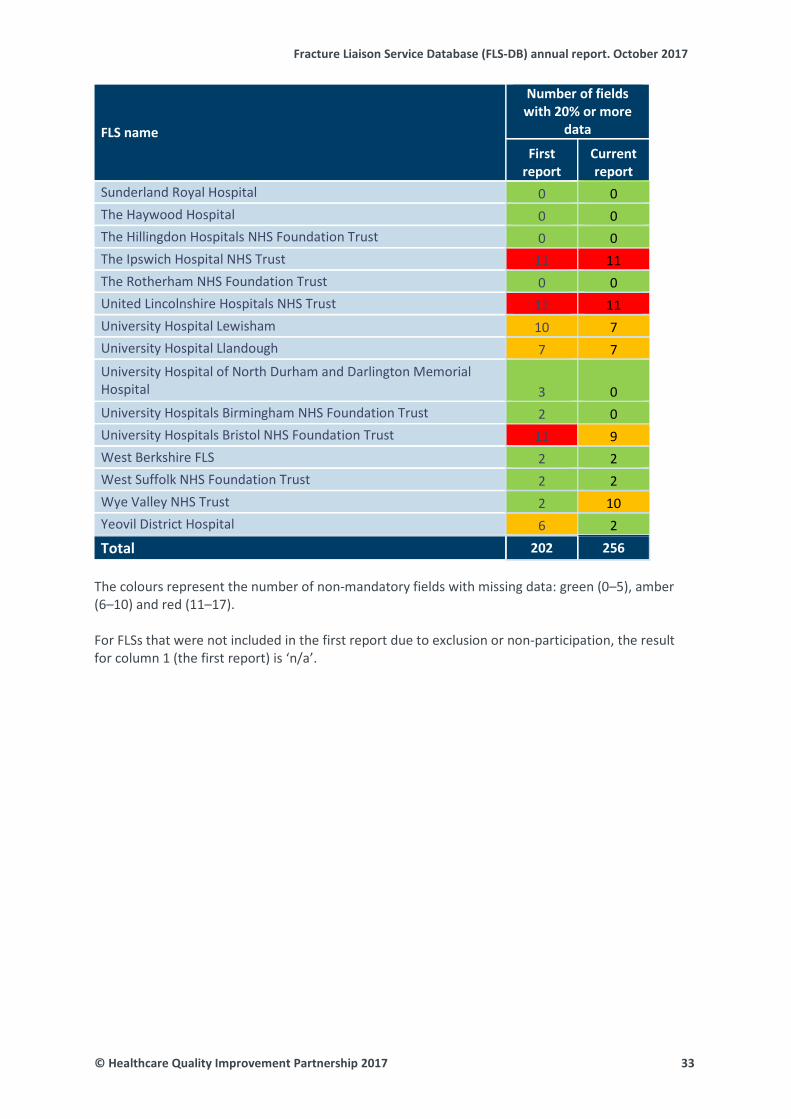
Data quality summary table by each submitting FLS Table 3
FLS name
Number of fields with 20% or more
data
First report
Current report
Anglian Community Enterprise n/a 0 Barking Havering and Redbridge University Hospitals NHS Trust n/a 11 Barnet Hospital 3 1 Bradford Teaching Hospitals NHS Foundation Trust n/a 0 Bromley Healthcare 2 1 Broomfield Hospital 0 0 Buckinghamshire Healthcare NHS Trust n/a 2 Croydon University Hospital n/a 6 Diana Princess of Wales Hospital n/a 5 Dorset County Hospital 11 11 East Lancashire Hospitals NHS Trust 2 2 East Surrey Hospital 2 2 Guy’s and St Thomas’ NHS Foundation Trust 12 12 King’s College Hospital – Denmark Hill Site 4 4 Medway NHS Foundation Trust 11 11 Milton Keynes University Hospital Foundation Trust 2 2 Morriston Hospital n/a 2 Musgrove Park Hospital 0 0 North Bristol NHS Trust 7 7 North Tees and Hartlepool NHS Foundation Trust 5 5 North West Anglia NHS Foundation Trust 2 2 Nottingham City Care Partnership n/a 1 Nottingham University Hospitals 8 9 Oxfordshire Fracture Prevention Service 4 2 Poole General Hospital 9 9 Portsmouth and Southeast Hampshire FLS 14 13 Queen Elizabeth Hospital Lewisham 6 6 Royal Derby Hospital n/a 6 Royal Surrey County Hospital 0 0 Royal United Hospital n/a 16 Royal Wolverhampton NHS Trust 9 10 Salford Royal NHS Foundation Trust n/a 7 Salisbury NHS Foundation Trust n/a 5 Sandwell and West Birmingham Hospitals NHS Trust 9 11 St George’s Hospital 12 14
32 © Healthcare Quality Improvement Partnership 2017
Fracture Liaison Service Database (FLS-DB) annual report. October 2017
FLS name
Number of fields with 20% or more
data
First report
Current report
Sunderland Royal Hospital 0 0 The Haywood Hospital 0 0 The Hillingdon Hospitals NHS Foundation Trust 0 0 The Ipswich Hospital NHS Trust 11 11 The Rotherham NHS Foundation Trust 0 0 United Lincolnshire Hospitals NHS Trust 12 11 University Hospital Lewisham 10 7 University Hospital Llandough 7 7 University Hospital of North Durham and Darlington Memorial Hospital 3 0 University Hospitals Birmingham NHS Foundation Trust 2 0 University Hospitals Bristol NHS Foundation Trust 11 9 West Berkshire FLS 2 2 West Suffolk NHS Foundation Trust 2 2 Wye Valley NHS Trust 2 10 Yeovil District Hospital 6 2 Total 202 256
The colours represent the number of non-mandatory fields with missing data: green (0–5), amber (6–10) and red (11–17). For FLSs that were not included in the first report due to exclusion or non-participation, the result for column 1 (the first report) is ‘n/a’.
© Healthcare Quality Improvement Partnership 2017 33
Fracture Liaison Service Database (FLS-DB) annual report. October 2017
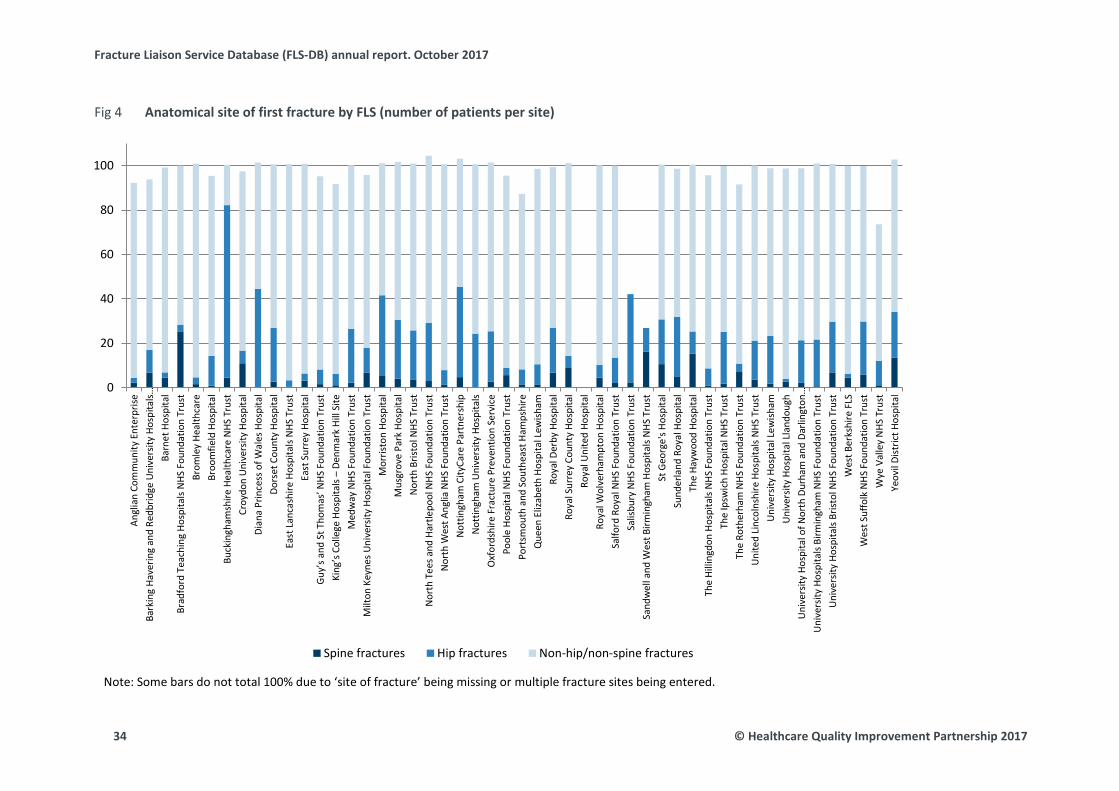
Anatomical site of first fracture by FLS (number of patients per site) Fig 4
Note: Some bars do not total 100% due to ‘site of fracture’ being missing or multiple fracture sites being entered.
0
20
40
60
80
100
Angl
ian
Com
mun
ity E
nter
prise
Bark
ing
Have
ring
and
Redb
ridge
Uni
vers
ity H
ospi
tals…
Barn
et H
ospi
tal
Brad
ford
Tea
chin
g Ho
spita
ls N
HS F
ound
atio
n Tr
ust
Brom
ley
Heal
thca
reBr
oom
field
Hos
pita
lBu
ckin
gham
shire
Hea
lthca
re N
HS T
rust
Croy
don
Uni
vers
ity H
ospi
tal
Dian
a Pr
ince
ss o
f Wal
es H
ospi
tal
Dors
et C
ount
y Ho
spita
lEa
st L
anca
shire
Hos
pita
ls N
HS T
rust
East
Sur
rey
Hosp
ital
Guy’
s and
St T
hom
as’ N
HS F
ound
atio
n Tr
ust
King
’s C
olle
ge H
ospi
tals
– De
nmar
k Hi
ll Si
te
Med
way
NHS
Fou
ndat
ion
Trus
tM
ilton
Key
nes U
nive
rsity
Hos
pita
l Fou
ndat
ion
Trus
tM
orris
ton
Hosp
ital
Mus
grov
e Pa
rk H
ospi
tal
Nor
th B
risto
l NHS
Tru
stN
orth
Tee
s and
Har
tlepo
ol N
HS F
ound
atio
n Tr
ust
Nor
th W
est A
nglia
NHS
Fou
ndat
ion
Trus
tN
ottin
gham
City
Care
Par
tner
ship
Not
tingh
am U
nive
rsity
Hos
pita
lsO
xfor
dshi
re F
ract
ure
Prev
entio
n Se
rvic
ePo
ole
Hosp
ital N
HS F
ound
atio
n Tr
ust
Port
smou
th a
nd S
outh
east
Ham
pshi
reQ
ueen
Eliz
abet
h Ho
spita
l Lew
isham
Roya
l Der
by H
ospi
tal
Roya
l Sur
rey
Coun
ty H
ospi
tal
Roya
l Uni
ted
Hosp
ital
Roya
l Wol
verh
ampt
on H
ospi
tal
Salfo
rd R
oyal
NHS
Fou
ndat
ion
Trus
tSa
lisbu
ry N
HS F
ound
atio
n Tr
ust
Sand
wel
l and
Wes
t Birm
ingh
am H
ospi
tals
NHS
Tru
stSt
Geo
rge'
s Hos
pita
lSu
nder
land
Roy
al H
ospi
tal
The
Hayw
ood
Hosp
ital
The
Hilli
ngdo
n Ho
spita
ls N
HS F
ound
atio
n Tr
ust
The
Ipsw
ich
Hosp
ital N
HS T
rust
The
Roth
erha
m N
HS F
ound
atio
n Tr
ust
Uni
ted
Linc
olns
hire
Hos
pita
ls N
HS T
rust
Uni
vers
ity H
ospi
tal L
ewish
amU
nive
rsity
Hos
pita
l Lla
ndou
ghU
nive
rsity
Hos
pita
l of N
orth
Dur
ham
and
Dar
lingt
on…
Uni
vers
ity H
ospi
tals
Birm
ingh
am N
HS F
ound
atio
n Tr
ust
Uni
vers
ity H
ospi
tals
Brist
ol N
HS F
ound
atio
n Tr
ust
Wes
t Ber
kshi
re F
LSW
est S
uffo
lk N
HS F
ound
atio
n Tr
ust
Wye
Val
ley
NHS
Tru
stYe
ovil
Dist
rict H
ospi
tal
Spine fractures Hip fractures Non-hip/non-spine fractures
34 © Healthcare Quality Improvement Partnership 2017

Fracture Liaison Service Database (FLS-DB) annual report. October 2017
Percentage of estimated fragility fracture patients submitted to the FLS-DB Table 4
FLS name
From
the
FLS-
DB
From
the
NHF
D
Estim
ated
cas
eloa
d
Percentage of estimated caseload submitted
Tota
l num
ber o
f non
-hip
, no
n-sp
ine
Tota
l cas
es (n
on-h
ip, n
on-
spin
e) %
Tota
l num
ber o
f hip
cas
es
Tota
l cas
es (h
ip) %
All Aged <75 Aged >75
Anglian Community Enterprise 90 526 2,630 3 6 0 79 88 * *
Barking Havering and Redbridge University Hospitals NHS Trust 337 527 2,635 13 20 5 259 77 34 10
Barnet Hospital 349 391 1,955 18 23 13 322 92 8 2
Bradford Teaching Hospitals NHS Foundation Trust 67 315 1,575 4 6 3 48 72 * *
Bromley Healthcare 585 368 1,840 32 32 31 563 96 18 3 Broomfield Hospital 737 412 2,060 36 63 9 598 81 99 13 Buckinghamshire Healthcare NHS Trust 287 403 2,015 14 6 23 52 18 223 78 Croydon University Hospital 192 259 1,295 15 19 11 155 81 11 6 Diana Princess of Wales Hospital 144 232 1,160 12 10 15 82 57 64 44 Dorset County Hospital 1,152 328 1,640 70 75 66 849 74 279 24 East Lancashire Hospitals NHS Trust 562 474 2,370 24 34 13 547 97 17 3 East Surrey Hospital 709 486 2,430 29 53 5 670 94 23 3 Guy’s and St Thomas’ NHS Foundation Trust 648 195 975 66 105 28 564 87 43 7 King’s College Hospital – Denmark Hill Site 97 157 785 12 19 6 83 86 5 5 Medway NHS Foundation Trust 926 332 1,660 56 63 49 683 74 224 24
© Healthcare Quality Improvement Partnership 2017 35
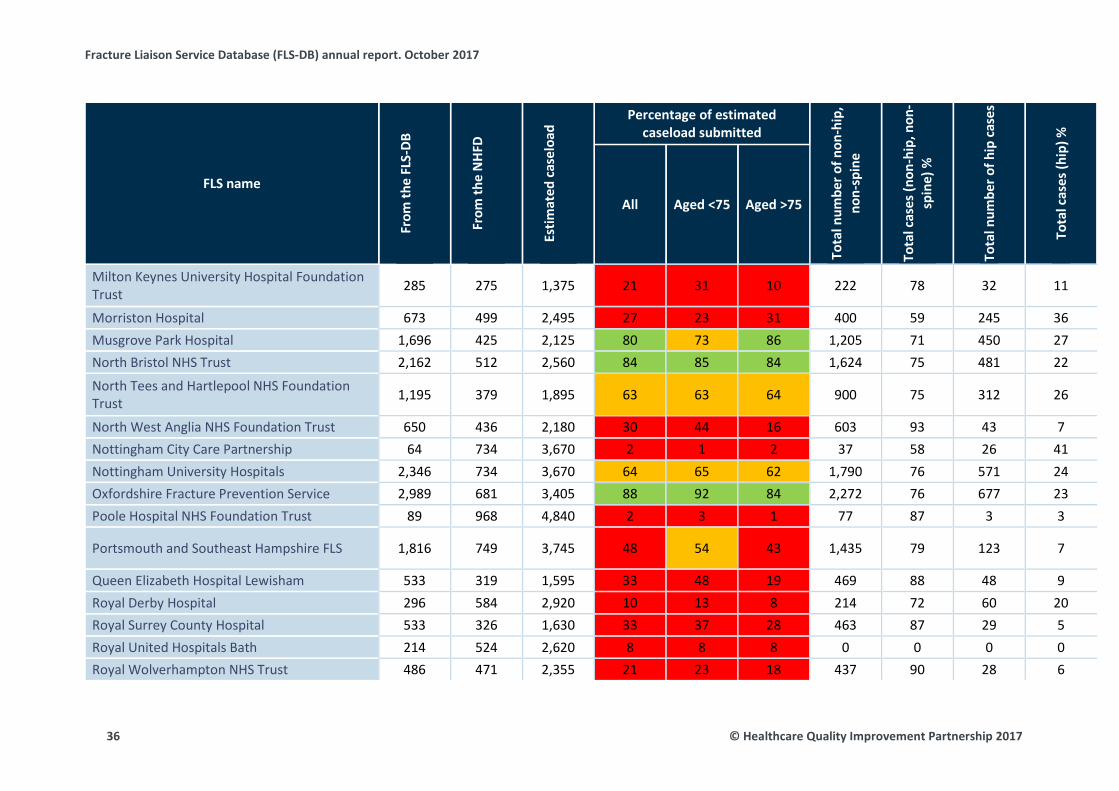
Fracture Liaison Service Database (FLS-DB) annual report. October 2017
FLS name
From
the
FLS-
DB
From
the
NHF
D
Estim
ated
cas
eloa
d
Percentage of estimated caseload submitted
Tota
l num
ber o
f non
-hip
, no
n-sp
ine
Tota
l cas
es (n
on-h
ip, n
on-
spin
e) %
Tota
l num
ber o
f hip
cas
es
Tota
l cas
es (h
ip) %
All Aged <75 Aged >75
Milton Keynes University Hospital Foundation Trust 285 275 1,375 21 31 10 222 78 32 11
Morriston Hospital 673 499 2,495 27 23 31 400 59 245 36 Musgrove Park Hospital 1,696 425 2,125 80 73 86 1,205 71 450 27 North Bristol NHS Trust 2,162 512 2,560 84 85 84 1,624 75 481 22
North Tees and Hartlepool NHS Foundation Trust 1,195 379 1,895 63 63 64 900 75 312 26
North West Anglia NHS Foundation Trust 650 436 2,180 30 44 16 603 93 43 7 Nottingham City Care Partnership 64 734 3,670 2 1 2 37 58 26 41 Nottingham University Hospitals 2,346 734 3,670 64 65 62 1,790 76 571 24 Oxfordshire Fracture Prevention Service 2,989 681 3,405 88 92 84 2,272 76 677 23 Poole Hospital NHS Foundation Trust 89 968 4,840 2 3 1 77 87 3 3
Portsmouth and Southeast Hampshire FLS 1,816 749 3,745 48 54 43 1,435 79 123 7
Queen Elizabeth Hospital Lewisham 533 319 1,595 33 48 19 469 88 48 9 Royal Derby Hospital 296 584 2,920 10 13 8 214 72 60 20 Royal Surrey County Hospital 533 326 1,630 33 37 28 463 87 29 5 Royal United Hospitals Bath 214 524 2,620 8 8 8 0 0 0 0 Royal Wolverhampton NHS Trust 486 471 2,355 21 23 18 437 90 28 6
36 © Healthcare Quality Improvement Partnership 2017
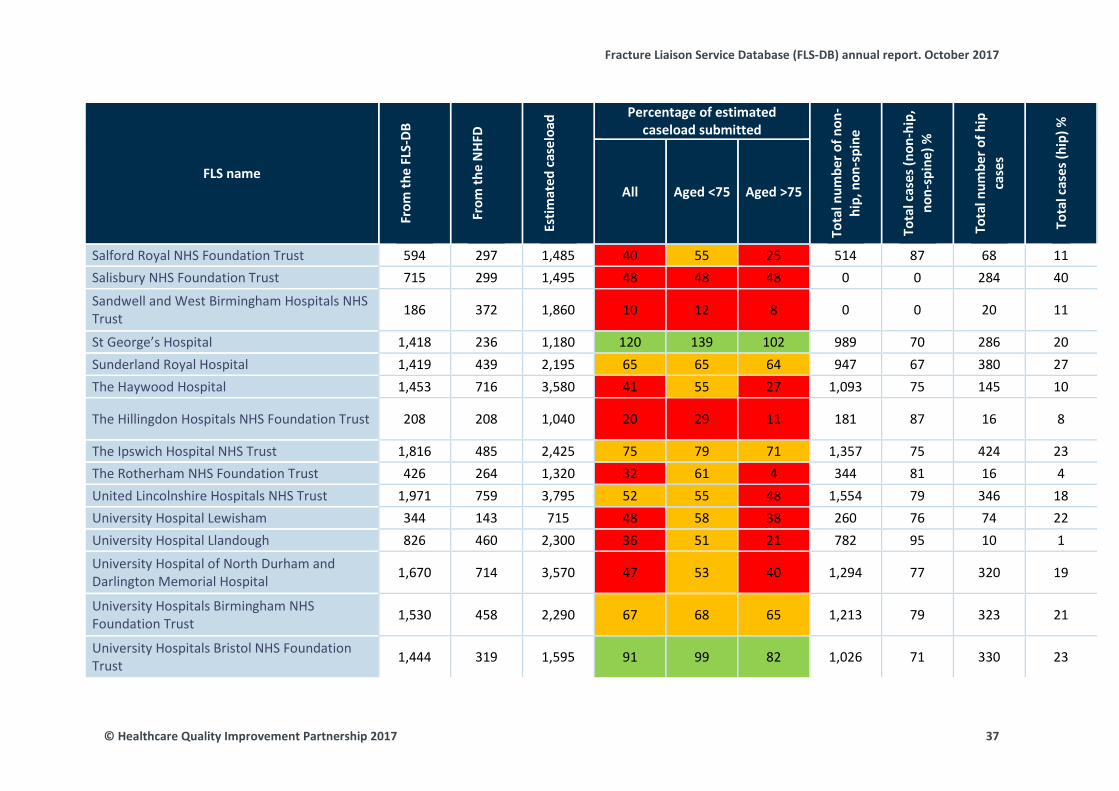
Fracture Liaison Service Database (FLS-DB) annual report. October 2017
FLS name
From
the
FLS-
DB
From
the
NHF
D
Estim
ated
cas
eloa
d
Percentage of estimated caseload submitted
Tota
l num
ber o
f non
-hi
p, n
on-s
pine
Tota
l cas
es (n
on-h
ip,
non-
spin
e) %
Tota
l num
ber o
f hip
ca
ses
Tota
l cas
es (h
ip) %
All Aged <75 Aged >75
Salford Royal NHS Foundation Trust 594 297 1,485 40 55 25 514 87 68 11 Salisbury NHS Foundation Trust 715 299 1,495 48 48 48 0 0 284 40
Sandwell and West Birmingham Hospitals NHS Trust 186 372 1,860 10 12 8 0 0 20 11
St George’s Hospital 1,418 236 1,180 120 139 102 989 70 286 20 Sunderland Royal Hospital 1,419 439 2,195 65 65 64 947 67 380 27 The Haywood Hospital 1,453 716 3,580 41 55 27 1,093 75 145 10
The Hillingdon Hospitals NHS Foundation Trust 208 208 1,040 20 29 11 181 87 16 8
The Ipswich Hospital NHS Trust 1,816 485 2,425 75 79 71 1,357 75 424 23 The Rotherham NHS Foundation Trust 426 264 1,320 32 61 4 344 81 16 4 United Lincolnshire Hospitals NHS Trust 1,971 759 3,795 52 55 48 1,554 79 346 18 University Hospital Lewisham 344 143 715 48 58 38 260 76 74 22 University Hospital Llandough 826 460 2,300 36 51 21 782 95 10 1
University Hospital of North Durham and Darlington Memorial Hospital 1,670 714 3,570 47 53 40 1,294 77 320 19
University Hospitals Birmingham NHS Foundation Trust 1,530 458 2,290 67 68 65 1,213 79 323 21
University Hospitals Bristol NHS Foundation Trust 1,444 319 1,595 91 99 82 1,026 71 330 23
© Healthcare Quality Improvement Partnership 2017 37

Fracture Liaison Service Database (FLS-DB) annual report. October 2017
FLS name
From
the
FLS-
DB
From
the
NHF
D
Estim
ated
cas
eloa
d
Percentage of estimated caseload submitted
Tota
l num
ber o
f non
-hi
p, n
on-s
pine
Tota
l cas
es (n
on-h
ip,
non-
spin
e) %
Tota
l num
ber o
f hip
ca
ses
Tota
l cas
es (h
ip) %
All Aged <75 Aged >75
West Berkshire FLS 742 414 2,070 36 43 29 695 94 13 2 West Suffolk NHS Foundation Trust 577 326 1,630 35 31 40 404 70 139 24 Wye Valley NHS Trust 852 307 1,535 56 53 58 524 62 94 11 Yeovil District Hospital 1,489 312 1,560 95 90 101 1,023 69 307 21 Overall (average) 42,589 21,549 107,745 40 45 34 31,902 75 7,775 18
Note: The numbers of non-hip fractures, calculated from 2016 NHFD data using ‘rule of 5’, were used to estimate the annual fragility fracture caseload in order to estimate the percentage case finding by FLSs for the 6 months of the year for hip and non-hip fractures. The NHFD data may underestimate the number of hip fractures, as the NHFD only includes people aged 60 years and over while the FLS-DB includes people aged 50 and over. However, very few patients sustain a fragility fracture of the hip between 50 and 60 years of age, and so underestimation is likely to be small. The estimated caseload at <75 years was calculated as 50% of the total estimated caseload for the FLS. Royal United Hospitals Bath did not submit any data for ‘site of fracture’.
38 © Healthcare Quality Improvement Partnership 2017

Fracture Liaison Service Database (FLS-DB) annual report. October 2017
Time from diagnosis of fracture to FLS assessment Table 5
FLS name Total
submitted Assessed within 90
days n n %
Anglian Community Enterprise 90 10 11
Barking Havering and Redbridge University Hospitals NHS Trust 337 63
19
Barnet Hospital 349 308 88
Bradford Teaching Hospitals NHS Foundation Trust 67 55 82
Bromley Healthcare 585 582 99
Broomfield Hospital 737 711 96
Buckinghamshire Healthcare NHS Trust 287 286 100
Croydon University Hospital 192 190 99
Diana Princess of Wales Hospital 144 127 88
Dorset County Hospital 1,152 1,081 94
East Lancashire Hospitals NHS Trust 562 505 90
East Surrey Hospital 709 25 4
Guy’s and St Thomas’ NHS Foundation Trust 648 121 19
King’s College Hospital – Denmark Hill Site 97 95 98
Medway NHS Foundation Trust 926 * *
Milton Keynes University Hospital Foundation Trust 285 269 94
Morriston Hospital 673 670 100
Musgrove Park Hospital 1,696 1,332 79
North Bristol NHS Trust 2,162 1,487 69
North Tees and Hartlepool NHS Foundation Trust 1,195 1,193 100
North West Anglia NHS Foundation Trust 650 591 91
Nottingham City Care Partnership 64 45 70
Nottingham University Hospitals 2,346 2,332 99
Oxfordshire Fracture Prevention Service 2,989 2,176 73
Poole General Hospital 89 9 10
Portsmouth and Southeast Hampshire FLS 1,816 1,675 92
Queen Elizabeth Hospital Lewisham 533 5 1
Royal Derby Hospital 296 241 81
Royal Surrey County Hospital 533 496 93
Royal United Hospital 214 0 0
Royal Wolverhampton NHS Trust 486 475 98
Salford Royal NHS Foundation Trust 594 19 3
Salisbury NHS Foundation Trust 715 486 68
© Healthcare Quality Improvement Partnership 2017 39
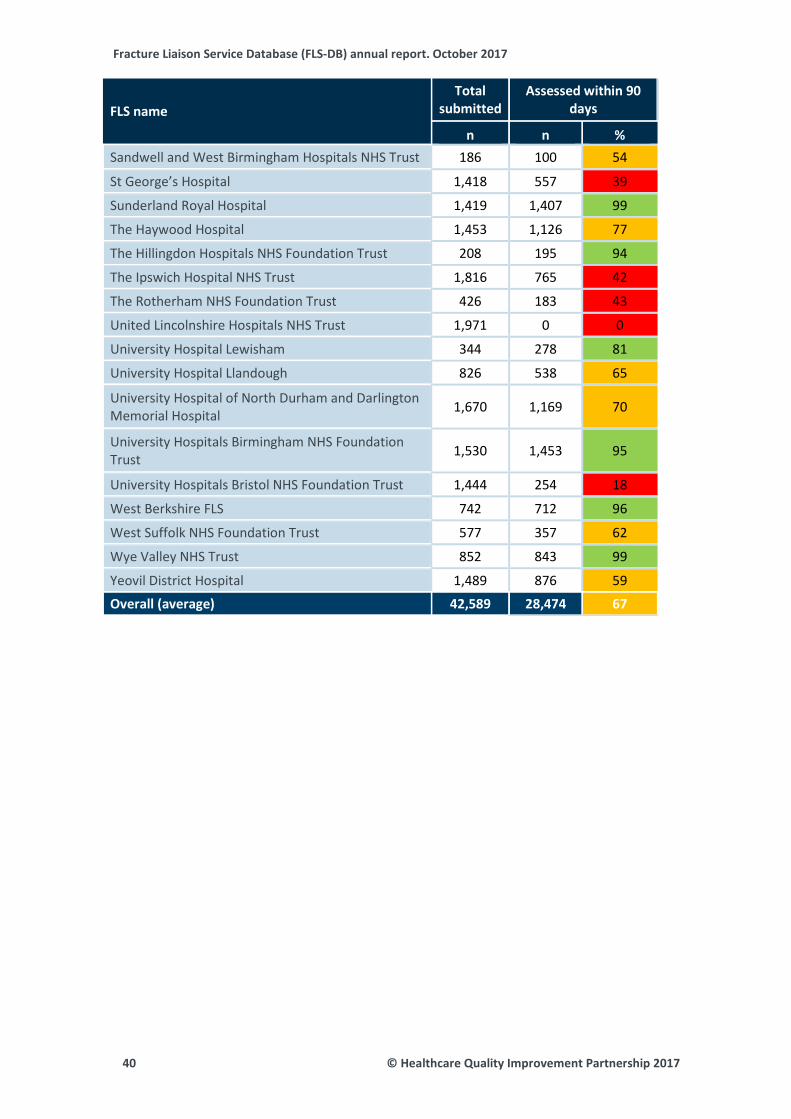
Fracture Liaison Service Database (FLS-DB) annual report. October 2017
FLS name Total
submitted Assessed within 90
days
n n % Sandwell and West Birmingham Hospitals NHS Trust 186 100 54
St George’s Hospital 1,418 557 39
Sunderland Royal Hospital 1,419 1,407 99
The Haywood Hospital 1,453 1,126 77
The Hillingdon Hospitals NHS Foundation Trust 208 195 94
The Ipswich Hospital NHS Trust 1,816 765 42
The Rotherham NHS Foundation Trust 426 183 43
United Lincolnshire Hospitals NHS Trust 1,971 0 0
University Hospital Lewisham 344 278 81
University Hospital Llandough 826 538 65
University Hospital of North Durham and Darlington Memorial Hospital 1,670 1,169 70
University Hospitals Birmingham NHS Foundation Trust 1,530 1,453 95
University Hospitals Bristol NHS Foundation Trust 1,444 254 18
West Berkshire FLS 742 712 96
West Suffolk NHS Foundation Trust 577 357 62
Wye Valley NHS Trust 852 843 99
Yeovil District Hospital 1,489 876 59
Overall (average) 42,589 28,474 67
40 © Healthcare Quality Improvement Partnership 2017
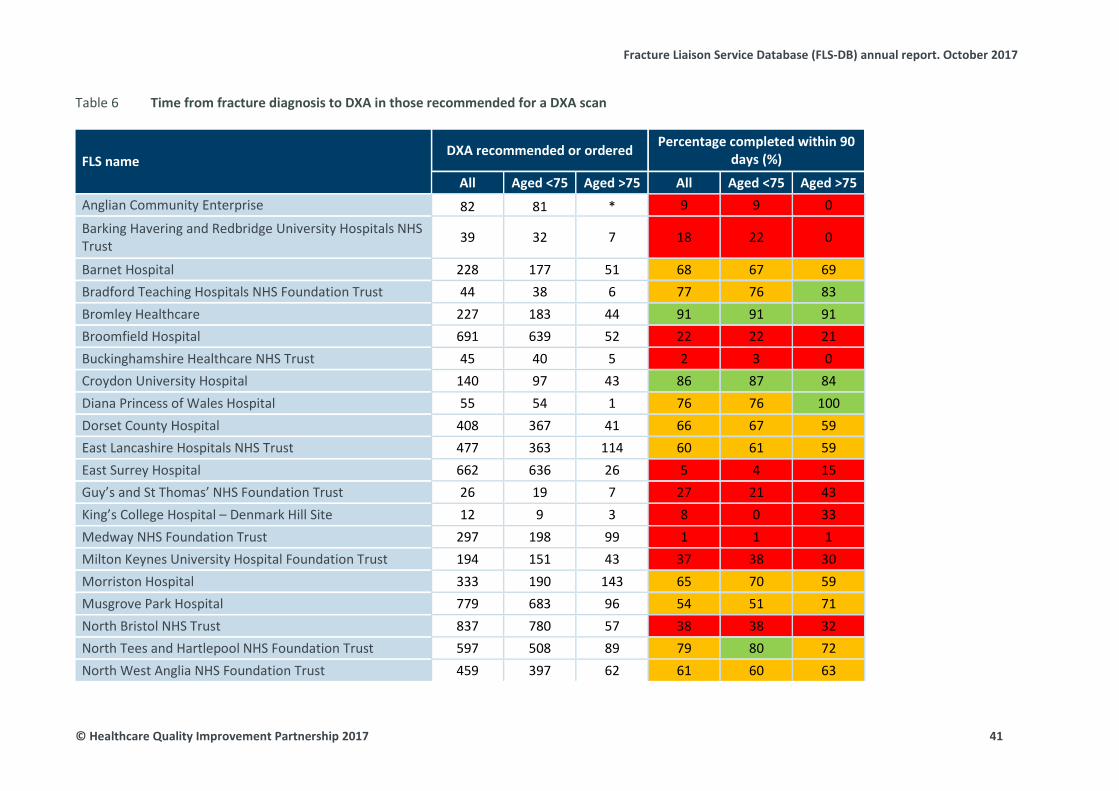
Fracture Liaison Service Database (FLS-DB) annual report. October 2017
Time from fracture diagnosis to DXA in those recommended for a DXA scan Table 6
FLS name DXA recommended or ordered Percentage completed within 90
days (%)
All Aged <75 Aged >75 All Aged <75 Aged >75 Anglian Community Enterprise 82 81 * 9 9 0
Barking Havering and Redbridge University Hospitals NHS Trust 39 32 7 18 22 0
Barnet Hospital 228 177 51 68 67 69 Bradford Teaching Hospitals NHS Foundation Trust 44 38 6 77 76 83 Bromley Healthcare 227 183 44 91 91 91 Broomfield Hospital 691 639 52 22 22 21 Buckinghamshire Healthcare NHS Trust 45 40 5 2 3 0 Croydon University Hospital 140 97 43 86 87 84 Diana Princess of Wales Hospital 55 54 1 76 76 100 Dorset County Hospital 408 367 41 66 67 59 East Lancashire Hospitals NHS Trust 477 363 114 60 61 59 East Surrey Hospital 662 636 26 5 4 15 Guy’s and St Thomas’ NHS Foundation Trust 26 19 7 27 21 43 King’s College Hospital – Denmark Hill Site 12 9 3 8 0 33 Medway NHS Foundation Trust 297 198 99 1 1 1 Milton Keynes University Hospital Foundation Trust 194 151 43 37 38 30 Morriston Hospital 333 190 143 65 70 59 Musgrove Park Hospital 779 683 96 54 51 71 North Bristol NHS Trust 837 780 57 38 38 32 North Tees and Hartlepool NHS Foundation Trust 597 508 89 79 80 72 North West Anglia NHS Foundation Trust 459 397 62 61 60 63
© Healthcare Quality Improvement Partnership 2017 41
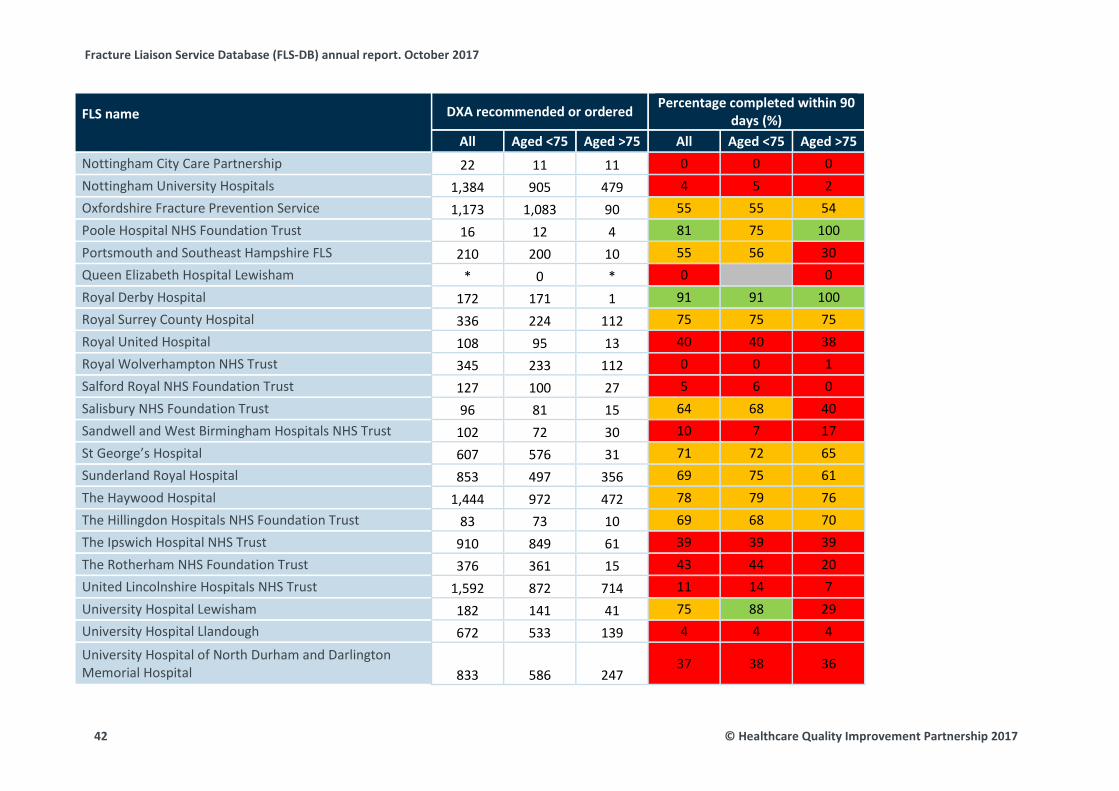
Fracture Liaison Service Database (FLS-DB) annual report. October 2017
FLS name
DXA recommended or ordered Percentage completed within 90 days (%)
All Aged <75 Aged >75 All Aged <75 Aged >75 Nottingham City Care Partnership 22 11 11 0 0 0 Nottingham University Hospitals 1,384 905 479 4 5 2 Oxfordshire Fracture Prevention Service 1,173 1,083 90 55 55 54 Poole Hospital NHS Foundation Trust 16 12 4 81 75 100 Portsmouth and Southeast Hampshire FLS 210 200 10 55 56 30 Queen Elizabeth Hospital Lewisham * 0 * 0 0 Royal Derby Hospital 172 171 1 91 91 100 Royal Surrey County Hospital 336 224 112 75 75 75 Royal United Hospital 108 95 13 40 40 38 Royal Wolverhampton NHS Trust 345 233 112 0 0 1 Salford Royal NHS Foundation Trust 127 100 27 5 6 0 Salisbury NHS Foundation Trust 96 81 15 64 68 40 Sandwell and West Birmingham Hospitals NHS Trust 102 72 30 10 7 17 St George’s Hospital 607 576 31 71 72 65 Sunderland Royal Hospital 853 497 356 69 75 61 The Haywood Hospital 1,444 972 472 78 79 76 The Hillingdon Hospitals NHS Foundation Trust 83 73 10 69 68 70 The Ipswich Hospital NHS Trust 910 849 61 39 39 39 The Rotherham NHS Foundation Trust 376 361 15 43 44 20 United Lincolnshire Hospitals NHS Trust 1,592 872 714 11 14 7 University Hospital Lewisham 182 141 41 75 88 29 University Hospital Llandough 672 533 139 4 4 4
University Hospital of North Durham and Darlington Memorial Hospital 833 586 247
37 38 36
42 © Healthcare Quality Improvement Partnership 2017

Fracture Liaison Service Database (FLS-DB) annual report. October 2017
FLS name
DXA recommended or ordered Percentage completed within 90 days (%)
All Aged <75 Aged >75 All Aged <75 Aged >75 University Hospitals Birmingham NHS Foundation Trust 529 420 109 39 36 49 University Hospitals Bristol NHS Foundation Trust 567 469 98 74 76 61 West Berkshire FLS 425 420 5 82 82 60 West Suffolk NHS Foundation Trust 238 194 44 68 74 43 Wye Valley NHS Trust 318 295 23 0 0 0 Yeovil District Hospital 540 444 96 19 18 27
Overall (average) 20,893 16,531 4,356 43 45 38
© Healthcare Quality Improvement Partnership 2017 43
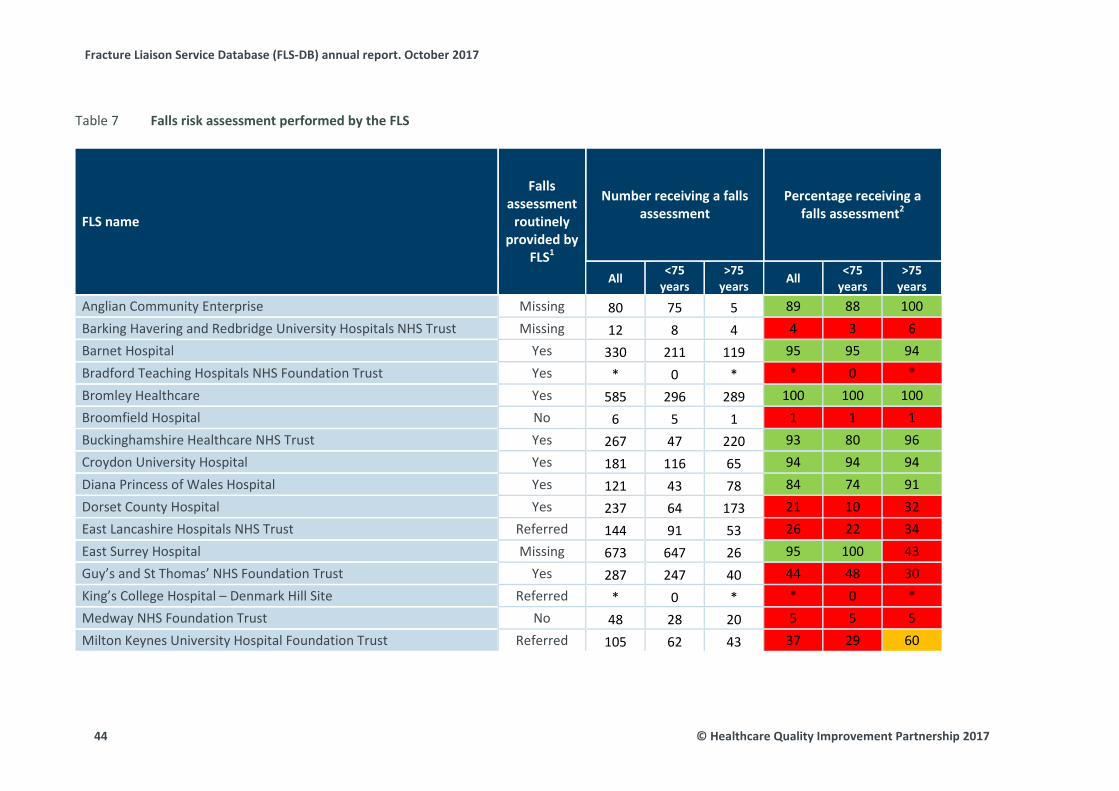
Fracture Liaison Service Database (FLS-DB) annual report. October 2017
Falls risk assessment performed by the FLS Table 7
FLS name
Falls assessment
routinely provided by
FLS1
Number receiving a falls assessment
Percentage receiving a falls assessment2
All <75 years
>75 years All <75
years >75
years Anglian Community Enterprise Missing 80 75 5 89 88 100 Barking Havering and Redbridge University Hospitals NHS Trust Missing 12 8 4 4 3 6 Barnet Hospital Yes 330 211 119 95 95 94 Bradford Teaching Hospitals NHS Foundation Trust Yes * 0 * * 0 * Bromley Healthcare Yes 585 296 289 100 100 100 Broomfield Hospital No 6 5 1 1 1 1 Buckinghamshire Healthcare NHS Trust Yes 267 47 220 93 80 96 Croydon University Hospital Yes 181 116 65 94 94 94 Diana Princess of Wales Hospital Yes 121 43 78 84 74 91 Dorset County Hospital Yes 237 64 173 21 10 32 East Lancashire Hospitals NHS Trust Referred 144 91 53 26 22 34 East Surrey Hospital Missing 673 647 26 95 100 43 Guy’s and St Thomas’ NHS Foundation Trust Yes 287 247 40 44 48 30 King’s College Hospital – Denmark Hill Site Referred * 0 * * 0 * Medway NHS Foundation Trust No 48 28 20 5 5 5 Milton Keynes University Hospital Foundation Trust Referred 105 62 43 37 29 60
44 © Healthcare Quality Improvement Partnership 2017
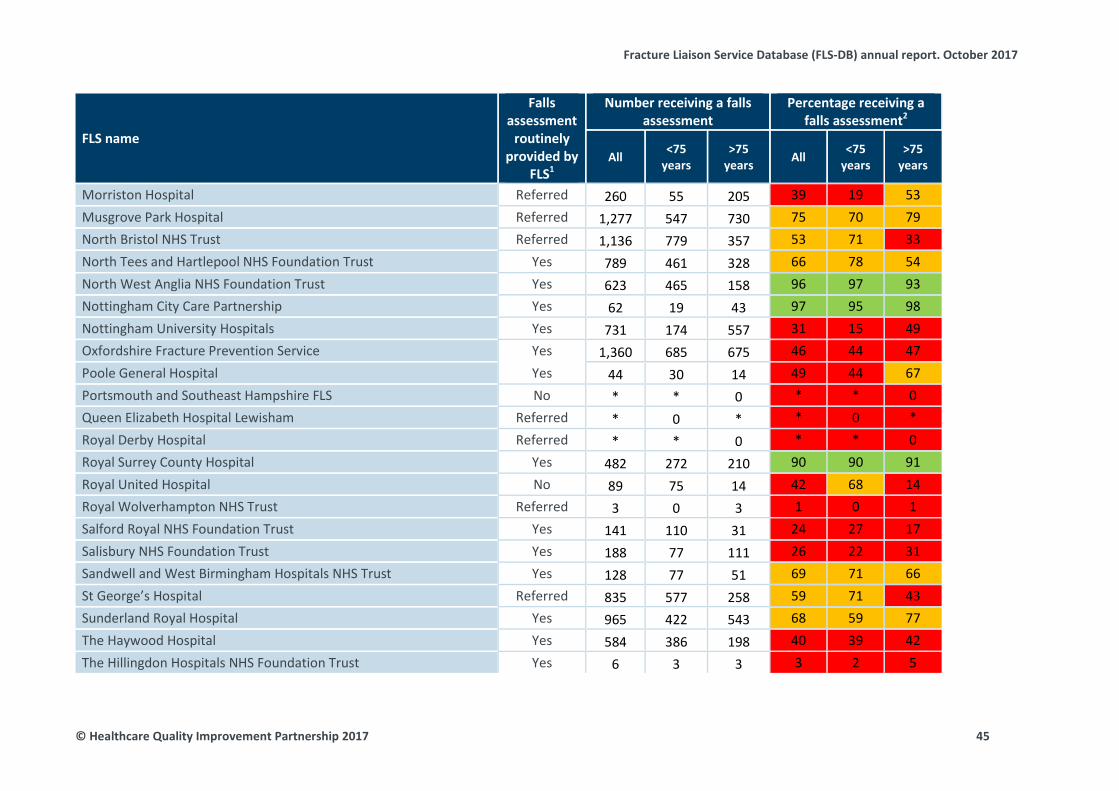
Fracture Liaison Service Database (FLS-DB) annual report. October 2017
FLS name
Falls assessment
routinely provided by
FLS1
Number receiving a falls assessment
Percentage receiving a falls assessment2
All <75 years
>75 years All <75
years >75
years
Morriston Hospital Referred 260 55 205 39 19 53 Musgrove Park Hospital Referred 1,277 547 730 75 70 79 North Bristol NHS Trust Referred 1,136 779 357 53 71 33 North Tees and Hartlepool NHS Foundation Trust Yes 789 461 328 66 78 54 North West Anglia NHS Foundation Trust Yes 623 465 158 96 97 93 Nottingham City Care Partnership Yes 62 19 43 97 95 98 Nottingham University Hospitals Yes 731 174 557 31 15 49 Oxfordshire Fracture Prevention Service Yes 1,360 685 675 46 44 47 Poole General Hospital Yes 44 30 14 49 44 67 Portsmouth and Southeast Hampshire FLS No * * 0 * * 0 Queen Elizabeth Hospital Lewisham Referred * 0 * * 0 * Royal Derby Hospital Referred * * 0 * * 0 Royal Surrey County Hospital Yes 482 272 210 90 90 91 Royal United Hospital No 89 75 14 42 68 14 Royal Wolverhampton NHS Trust Referred 3 0 3 1 0 1 Salford Royal NHS Foundation Trust Yes 141 110 31 24 27 17 Salisbury NHS Foundation Trust Yes 188 77 111 26 22 31 Sandwell and West Birmingham Hospitals NHS Trust Yes 128 77 51 69 71 66 St George’s Hospital Referred 835 577 258 59 71 43 Sunderland Royal Hospital Yes 965 422 543 68 59 77 The Haywood Hospital Yes 584 386 198 40 39 42 The Hillingdon Hospitals NHS Foundation Trust Yes 6 3 3 3 2 5
© Healthcare Quality Improvement Partnership 2017 45
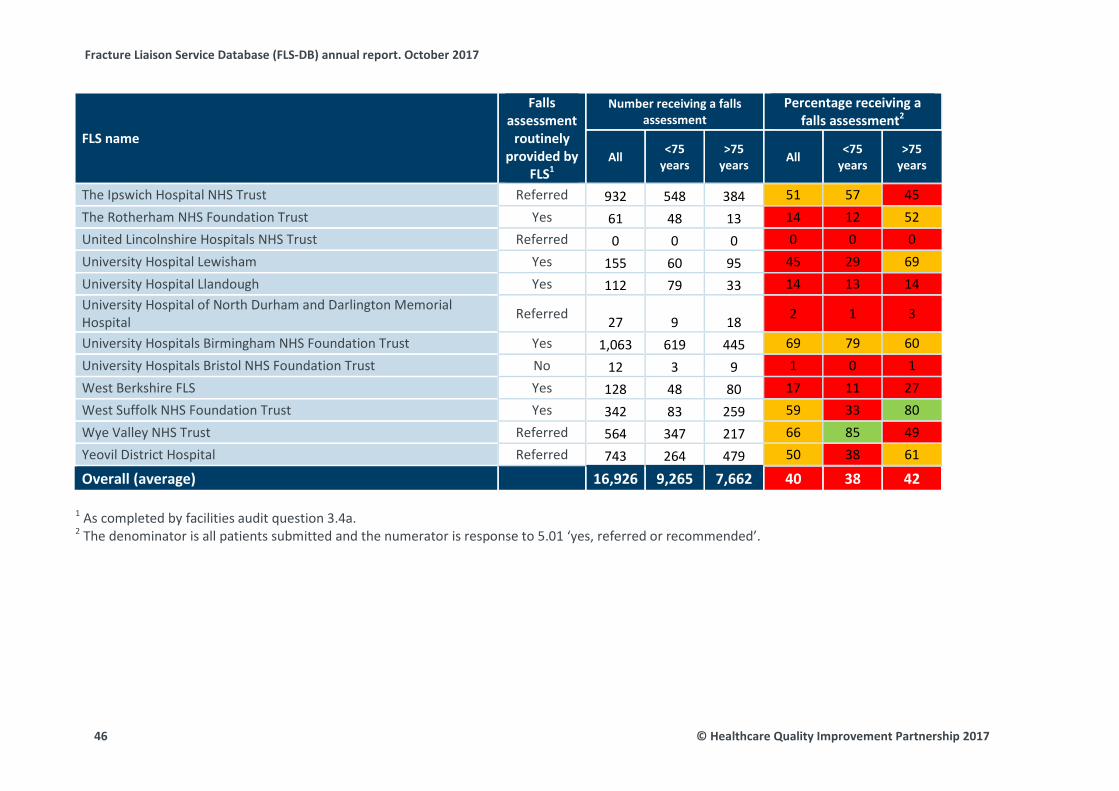
Fracture Liaison Service Database (FLS-DB) annual report. October 2017
FLS name
Falls assessment
routinely provided by
FLS1
Number receiving a falls assessment
Percentage receiving a falls assessment2
All <75 years
>75 years All <75
years >75
years
The Ipswich Hospital NHS Trust Referred 932 548 384 51 57 45 The Rotherham NHS Foundation Trust Yes 61 48 13 14 12 52 United Lincolnshire Hospitals NHS Trust Referred 0 0 0 0 0 0 University Hospital Lewisham Yes 155 60 95 45 29 69 University Hospital Llandough Yes 112 79 33 14 13 14 University Hospital of North Durham and Darlington Memorial Hospital Referred 27 9 18 2 1 3
University Hospitals Birmingham NHS Foundation Trust Yes 1,063 619 445 69 79 60 University Hospitals Bristol NHS Foundation Trust No 12 3 9 1 0 1 West Berkshire FLS Yes 128 48 80 17 11 27 West Suffolk NHS Foundation Trust Yes 342 83 259 59 33 80 Wye Valley NHS Trust Referred 564 347 217 66 85 49 Yeovil District Hospital Referred 743 264 479 50 38 61
Overall (average) 16,926 9,265 7,662 40 38 42 1 As completed by facilities audit question 3.4a. 2 The denominator is all patients submitted and the numerator is response to 5.01 ‘yes, referred or recommended’.
46 © Healthcare Quality Improvement Partnership 2017
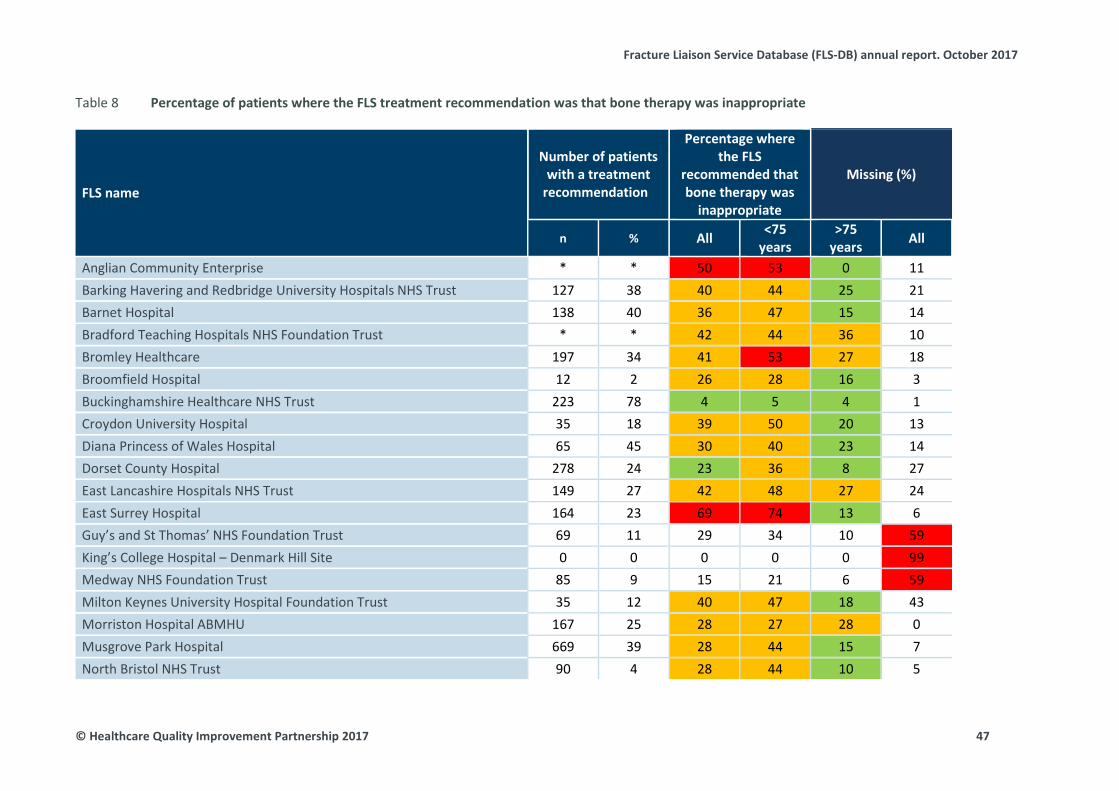
Fracture Liaison Service Database (FLS-DB) annual report. October 2017
Percentage of patients where the FLS treatment recommendation was that bone therapy was inappropriate Table 8
FLS name
Number of patients with a treatment
recommendation
Percentage where the FLS
recommended that bone therapy was
inappropriate
Missing (%)
n % All <75 years
>75 years All
Anglian Community Enterprise * * 50 53 0 11 Barking Havering and Redbridge University Hospitals NHS Trust 127 38 40 44 25 21 Barnet Hospital 138 40 36 47 15 14 Bradford Teaching Hospitals NHS Foundation Trust * * 42 44 36 10 Bromley Healthcare 197 34 41 53 27 18 Broomfield Hospital 12 2 26 28 16 3 Buckinghamshire Healthcare NHS Trust 223 78 4 5 4 1 Croydon University Hospital 35 18 39 50 20 13 Diana Princess of Wales Hospital 65 45 30 40 23 14 Dorset County Hospital 278 24 23 36 8 27 East Lancashire Hospitals NHS Trust 149 27 42 48 27 24 East Surrey Hospital 164 23 69 74 13 6 Guy’s and St Thomas’ NHS Foundation Trust 69 11 29 34 10 59 King’s College Hospital – Denmark Hill Site 0 0 0 0 0 99 Medway NHS Foundation Trust 85 9 15 21 6 59 Milton Keynes University Hospital Foundation Trust 35 12 40 47 18 43 Morriston Hospital ABMHU 167 25 28 27 28 0 Musgrove Park Hospital 669 39 28 44 15 7 North Bristol NHS Trust 90 4 28 44 10 5
© Healthcare Quality Improvement Partnership 2017 47
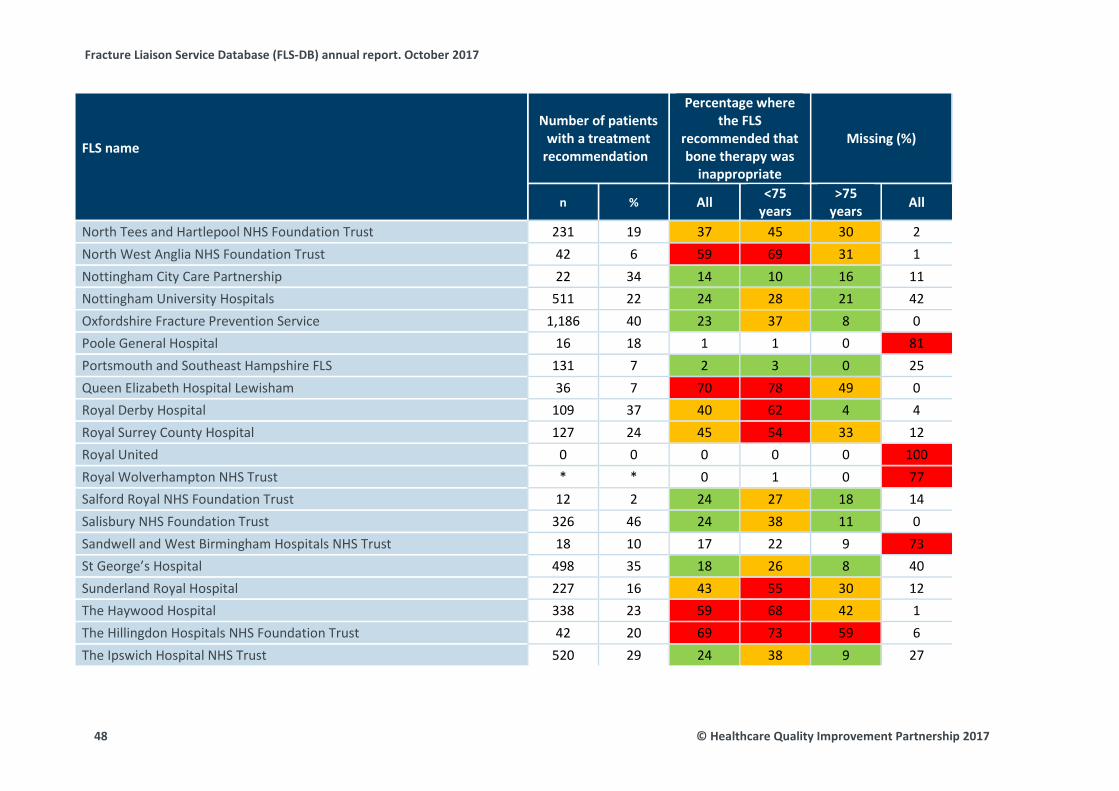
Fracture Liaison Service Database (FLS-DB) annual report. October 2017
FLS name
Number of patients with a treatment
recommendation
Percentage where the FLS
recommended that bone therapy was
inappropriate
Missing (%)
n % All <75 years
>75 years All
North Tees and Hartlepool NHS Foundation Trust 231 19 37 45 30 2 North West Anglia NHS Foundation Trust 42 6 59 69 31 1 Nottingham City Care Partnership 22 34 14 10 16 11 Nottingham University Hospitals 511 22 24 28 21 42 Oxfordshire Fracture Prevention Service 1,186 40 23 37 8 0 Poole General Hospital 16 18 1 1 0 81 Portsmouth and Southeast Hampshire FLS 131 7 2 3 0 25 Queen Elizabeth Hospital Lewisham 36 7 70 78 49 0 Royal Derby Hospital 109 37 40 62 4 4 Royal Surrey County Hospital 127 24 45 54 33 12 Royal United 0 0 0 0 0 100 Royal Wolverhampton NHS Trust * * 0 1 0 77 Salford Royal NHS Foundation Trust 12 2 24 27 18 14 Salisbury NHS Foundation Trust 326 46 24 38 11 0 Sandwell and West Birmingham Hospitals NHS Trust 18 10 17 22 9 73 St George’s Hospital 498 35 18 26 8 40 Sunderland Royal Hospital 227 16 43 55 30 12 The Haywood Hospital 338 23 59 68 42 1 The Hillingdon Hospitals NHS Foundation Trust 42 20 69 73 59 6 The Ipswich Hospital NHS Trust 520 29 24 38 9 27
48 © Healthcare Quality Improvement Partnership 2017
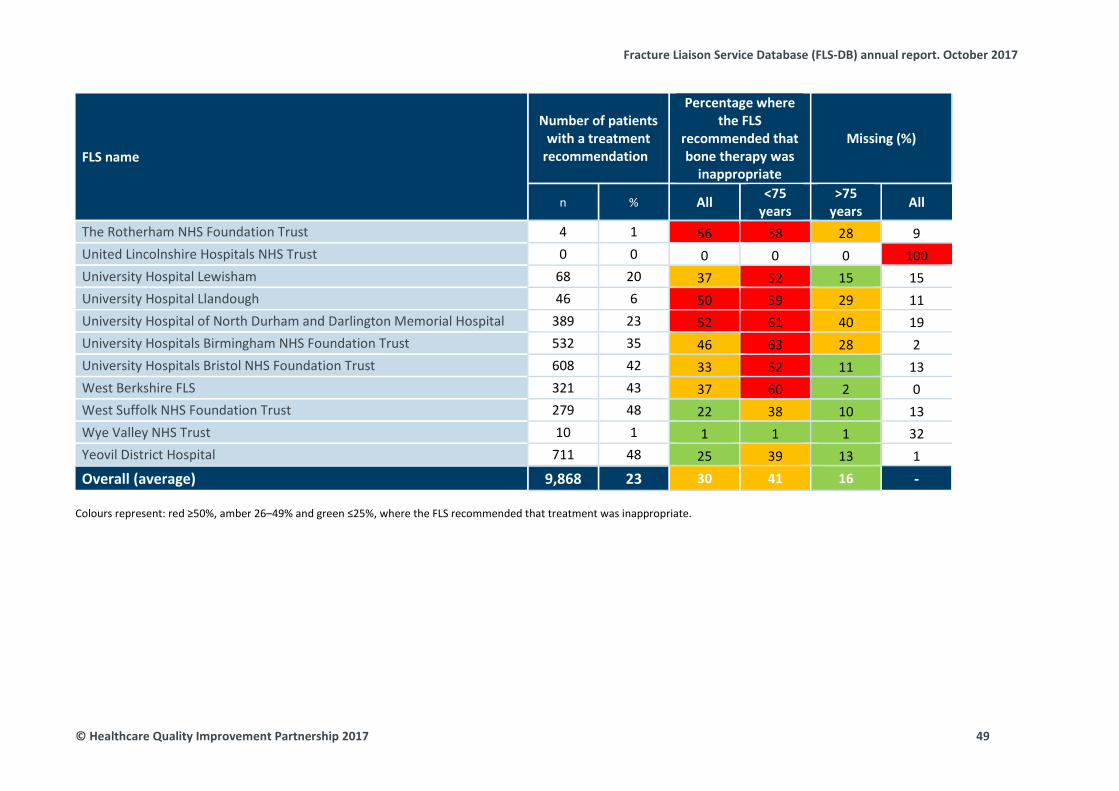
Fracture Liaison Service Database (FLS-DB) annual report. October 2017
FLS name
Number of patients with a treatment
recommendation
Percentage where the FLS
recommended that bone therapy was
inappropriate
Missing (%)
n % All <75 years
>75 years All
The Rotherham NHS Foundation Trust 4 1 56 58 28 9 United Lincolnshire Hospitals NHS Trust 0 0 0 0 0 100 University Hospital Lewisham 68 20 37 52 15 15 University Hospital Llandough 46 6 50 59 29 11 University Hospital of North Durham and Darlington Memorial Hospital 389 23 52 61 40 19 University Hospitals Birmingham NHS Foundation Trust 532 35 46 63 28 2 University Hospitals Bristol NHS Foundation Trust 608 42 33 52 11 13 West Berkshire FLS 321 43 37 60 2 0 West Suffolk NHS Foundation Trust 279 48 22 38 10 13 Wye Valley NHS Trust 10 1 1 1 1 32 Yeovil District Hospital 711 48 25 39 13 1 Overall (average) 9,868 23 30 41 16 -
Colours represent: red ≥50%, amber 26–49% and green ≤25%, where the FLS recommended that treatment was inappropriate.
© Healthcare Quality Improvement Partnership 2017 49
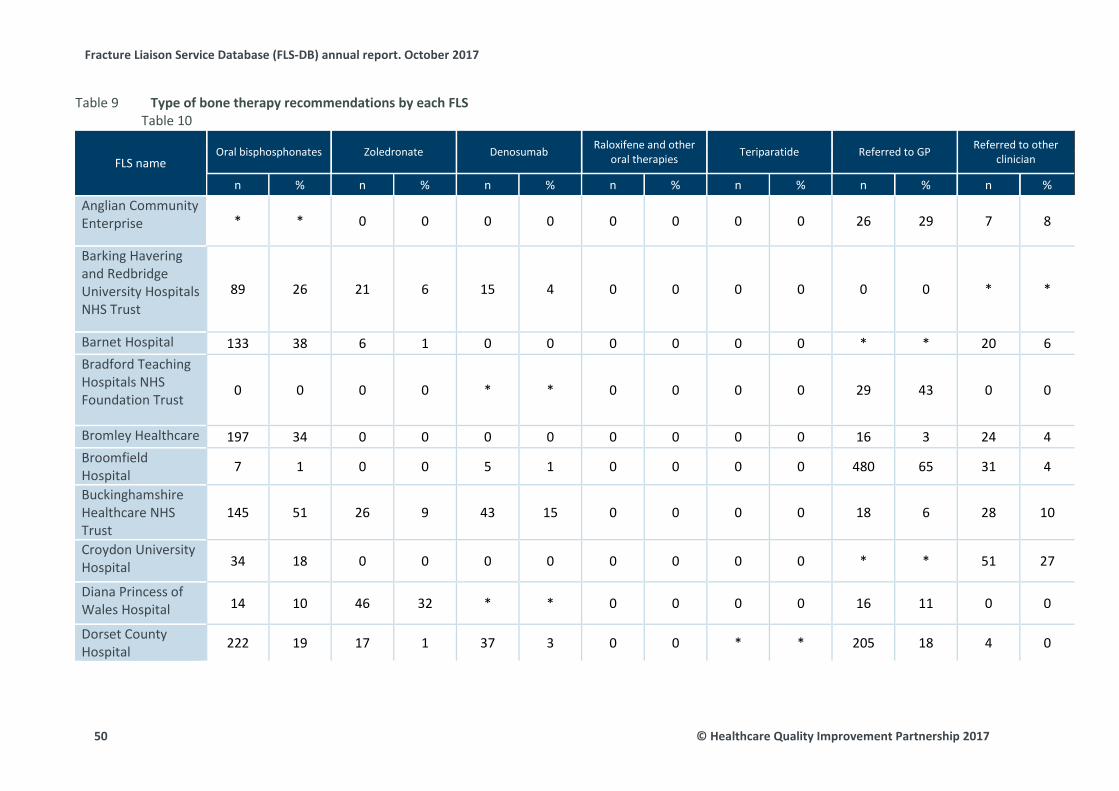
Fracture Liaison Service Database (FLS-DB) annual report. October 2017
Type of bone therapy recommendations by each FLS Table 9 Table 10
FLS name Oral bisphosphonates Zoledronate Denosumab Raloxifene and other
oral therapies Teriparatide Referred to GP Referred to other clinician
n % n % n % n % n % n % n % Anglian Community Enterprise * * 0 0 0 0 0 0 0 0 26 29 7 8
Barking Havering and Redbridge University Hospitals NHS Trust
89 26 21 6 15 4 0 0 0 0 0 0 * *
Barnet Hospital 133 38 6 1 0 0 0 0 0 0 * * 20 6 Bradford Teaching Hospitals NHS Foundation Trust
0 0 0 0 * * 0 0 0 0 29 43 0 0
Bromley Healthcare 197 34 0 0 0 0 0 0 0 0 16 3 24 4 Broomfield Hospital 7 1 0 0 5 1 0 0 0 0 480 65 31 4
Buckinghamshire Healthcare NHS Trust
145 51 26 9 43 15 0 0 0 0 18 6 28 10
Croydon University Hospital 34 18 0 0 0 0 0 0 0 0 * * 51 27
Diana Princess of Wales Hospital 14 10 46 32 * * 0 0 0 0 16 11 0 0
Dorset County Hospital 222 19 17 1 37 3 0 0 * * 205 18 4 0
50 © Healthcare Quality Improvement Partnership 2017
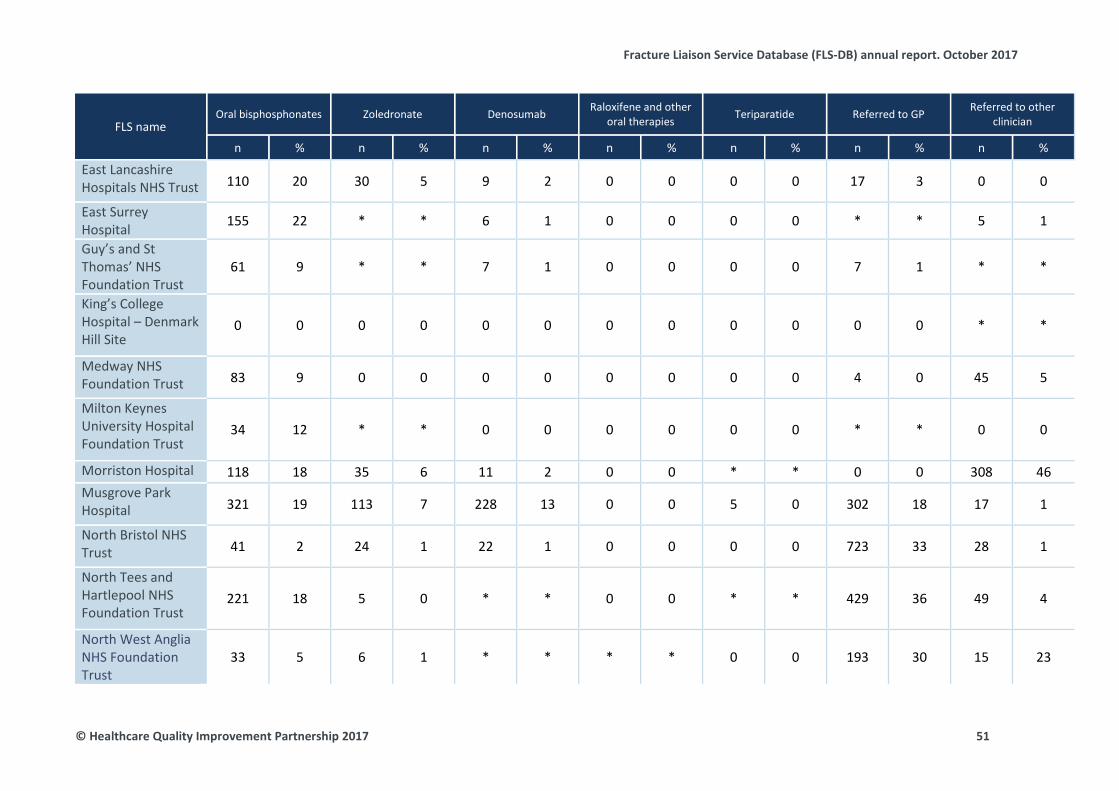
Fracture Liaison Service Database (FLS-DB) annual report. October 2017
FLS name Oral bisphosphonates Zoledronate Denosumab Raloxifene and other
oral therapies Teriparatide Referred to GP Referred to other clinician
n % n % n % n % n % n % n %
East Lancashire Hospitals NHS Trust 110 20 30 5 9 2 0 0 0 0 17 3 0 0
East Surrey Hospital 155 22 * * 6 1 0 0 0 0 * * 5 1
Guy’s and St Thomas’ NHS Foundation Trust
61 9 * * 7 1 0 0 0 0 7 1 * *
King’s College Hospital – Denmark Hill Site
0 0 0 0 0 0 0 0 0 0 0 0 * *
Medway NHS Foundation Trust 83 9 0 0 0 0 0 0 0 0 4 0 45 5
Milton Keynes University Hospital Foundation Trust
34 12 * * 0 0 0 0 0 0 * * 0 0
Morriston Hospital 118 18 35 6 11 2 0 0 * * 0 0 308 46 Musgrove Park Hospital 321 19 113 7 228 13 0 0 5 0 302 18 17 1
North Bristol NHS Trust 41 2 24 1 22 1 0 0 0 0 723 33 28 1
North Tees and Hartlepool NHS Foundation Trust
221 18 5 0 * * 0 0 * * 429 36 49 4
North West Anglia NHS Foundation Trust
33 5 6 1 * * * * 0 0 193 30 15 23
© Healthcare Quality Improvement Partnership 2017 51
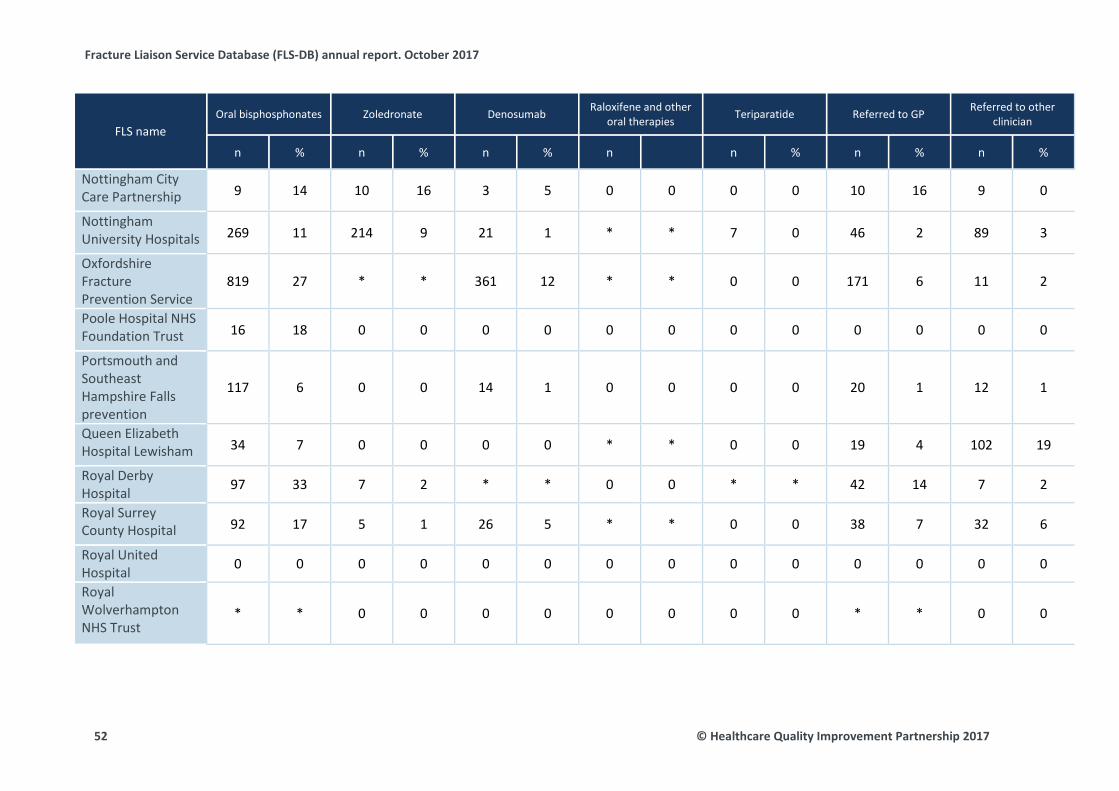
Fracture Liaison Service Database (FLS-DB) annual report. October 2017
FLS name Oral bisphosphonates Zoledronate Denosumab Raloxifene and other
oral therapies Teriparatide Referred to GP Referred to other clinician
n % n % n % n n % n % n %
Nottingham City Care Partnership 9 14 10 16 3 5 0 0 0 0 10 16 9 0
Nottingham University Hospitals 269 11 214 9 21 1 * * 7 0 46 2 89 3
Oxfordshire Fracture Prevention Service
819 27 * * 361 12 * * 0 0 171 6 11 2
Poole Hospital NHS Foundation Trust 16 18 0 0 0 0 0 0 0 0 0 0 0 0
Portsmouth and Southeast Hampshire Falls prevention
117 6 0 0 14 1 0 0 0 0 20 1 12 1
Queen Elizabeth Hospital Lewisham 34 7 0 0 0 0 * * 0 0 19 4 102 19
Royal Derby Hospital 97 33 7 2 * * 0 0 * * 42 14 7 2
Royal Surrey County Hospital 92 17 5 1 26 5 * * 0 0 38 7 32 6
Royal United Hospital 0 0 0 0 0 0 0 0 0 0 0 0 0 0
Royal Wolverhampton NHS Trust
* * 0 0 0 0 0 0 0 0 * * 0 0
52 © Healthcare Quality Improvement Partnership 2017
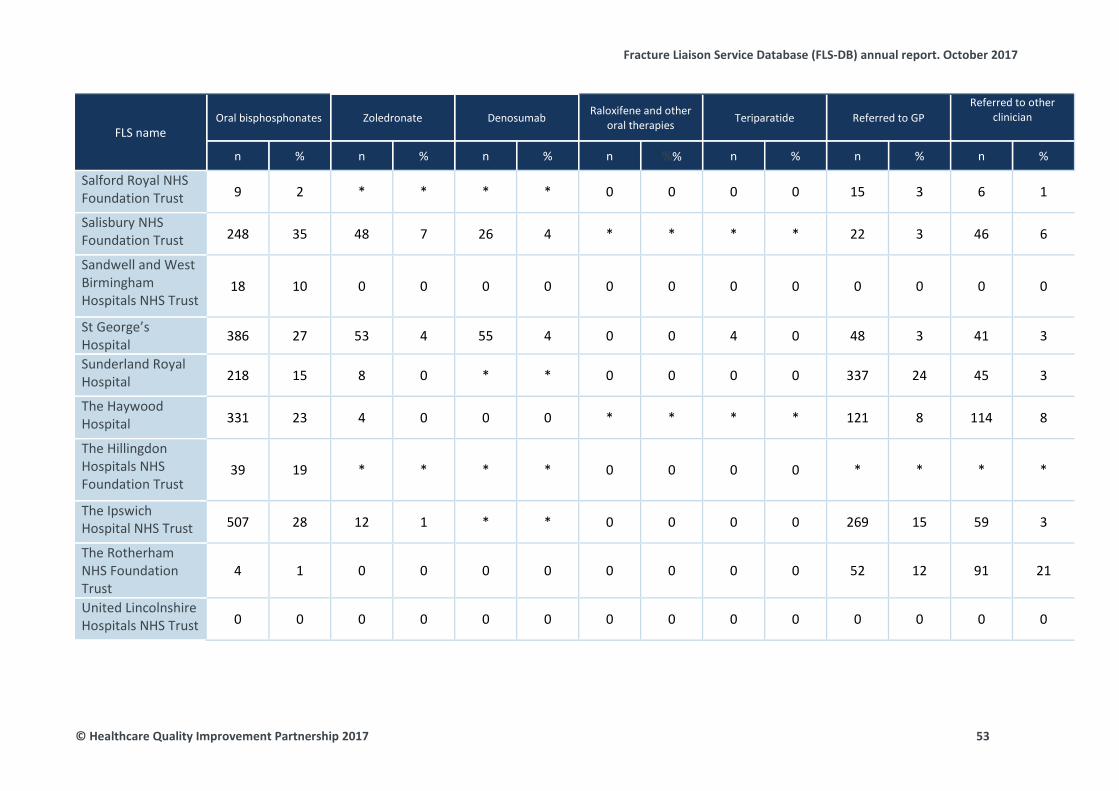
Fracture Liaison Service Database (FLS-DB) annual report. October 2017
FLS name Oral bisphosphonates Zoledronate Denosumab Raloxifene and other
oral therapies Teriparatide Referred to GP Referred to other
clinician
n % n % n % n %% n % n % n %
Salford Royal NHS Foundation Trust 9 2 * * * * 0 0 0 0 15 3 6 1
Salisbury NHS Foundation Trust 248 35 48 7 26 4 * * * * 22 3 46 6
Sandwell and West Birmingham Hospitals NHS Trust
18 10 0 0 0 0 0 0 0 0 0 0 0 0
St George’s Hospital 386 27 53 4 55 4 0 0 4 0 48 3 41 3
Sunderland Royal Hospital 218 15 8 0 * * 0 0 0 0 337 24 45 3
The Haywood Hospital 331 23 4 0 0 0 * * * * 121 8 114 8
The Hillingdon Hospitals NHS Foundation Trust
39 19 * * * * 0 0 0 0 * * * *
The Ipswich Hospital NHS Trust 507 28 12 1 * * 0 0 0 0 269 15 59 3
The Rotherham NHS Foundation Trust
4 1 0 0 0 0 0 0 0 0 52 12 91 21
United Lincolnshire Hospitals NHS Trust 0 0 0 0 0 0 0 0 0 0 0 0 0 0
© Healthcare Quality Improvement Partnership 2017 53
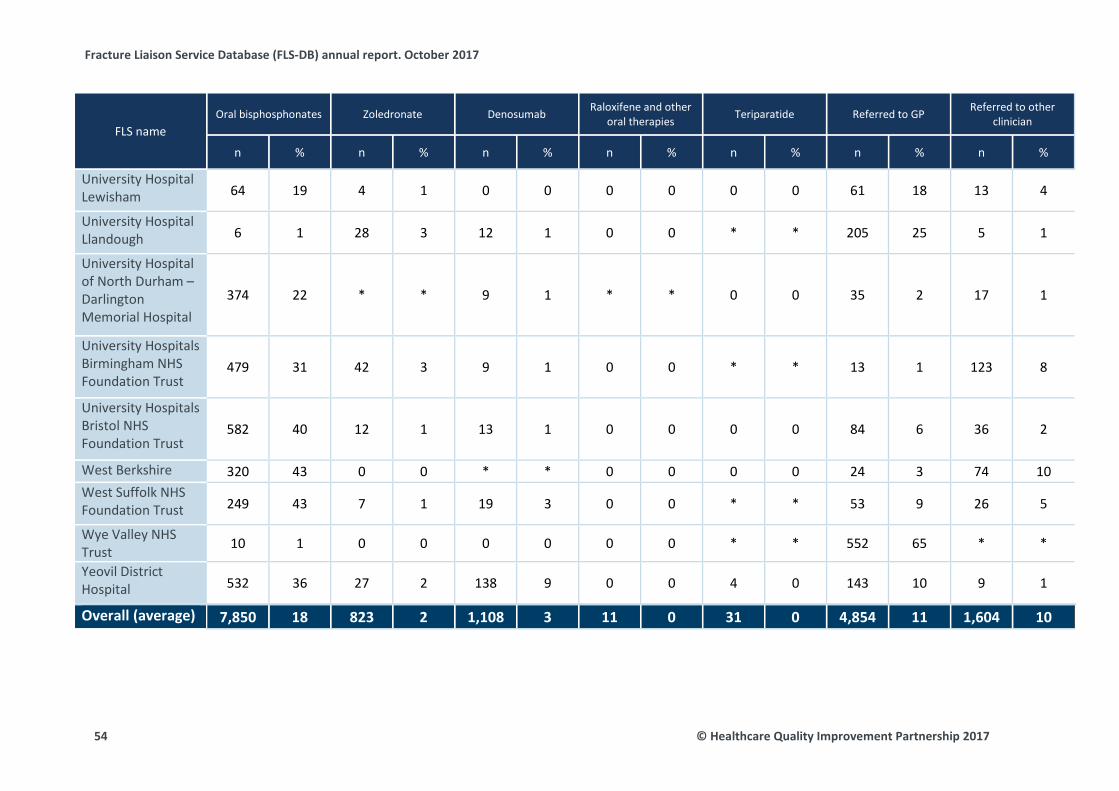
Fracture Liaison Service Database (FLS-DB) annual report. October 2017
FLS name Oral bisphosphonates Zoledronate Denosumab Raloxifene and other
oral therapies Teriparatide Referred to GP Referred to other clinician
n % n % n % n % n % n % n %
University Hospital Lewisham 64 19 4 1 0 0 0 0 0 0 61 18 13 4
University Hospital Llandough 6 1 28 3 12 1 0 0 * * 205 25 5 1
University Hospital of North Durham – Darlington Memorial Hospital
374 22 * * 9 1 * * 0 0 35 2 17 1
University Hospitals Birmingham NHS Foundation Trust
479 31 42 3 9 1 0 0 * * 13 1 123 8
University Hospitals Bristol NHS Foundation Trust
582 40 12 1 13 1 0 0 0 0 84 6 36 2
West Berkshire 320 43 0 0 * * 0 0 0 0 24 3 74 10 West Suffolk NHS Foundation Trust 249 43 7 1 19 3 0 0 * * 53 9 26 5
Wye Valley NHS Trust 10 1 0 0 0 0 0 0 * * 552 65 * *
Yeovil District Hospital 532 36 27 2 138 9 0 0 4 0 143 10 9 1
Overall (average) 7,850 18 823 2 1,108 3 11 0 31 0 4,854 11 1,604 10
54 © Healthcare Quality Improvement Partnership 2017
Fracture Liaison Service Database (FLS-DB) annual report. October 2017
Anti-osteoporosis medication included in this audit were: alendronate, risedronate, ibandronate, raloxifene, teriparatide, strontium, denosumab, zoledronate, systemic oestrogens, systemic oestrogen and progesterone, calcitriol and alphacalcidol. There were a few cases where more than one drug was submitted. To identify the recommended drug, a hierarchy was used to select the one drug: oral bisphosphonate > denosumab > zoledronate, then teriparatide or raloxifene or strontium or activated vitamin D or oestrogen therapy.
© Healthcare Quality Improvement Partnership 2017 55
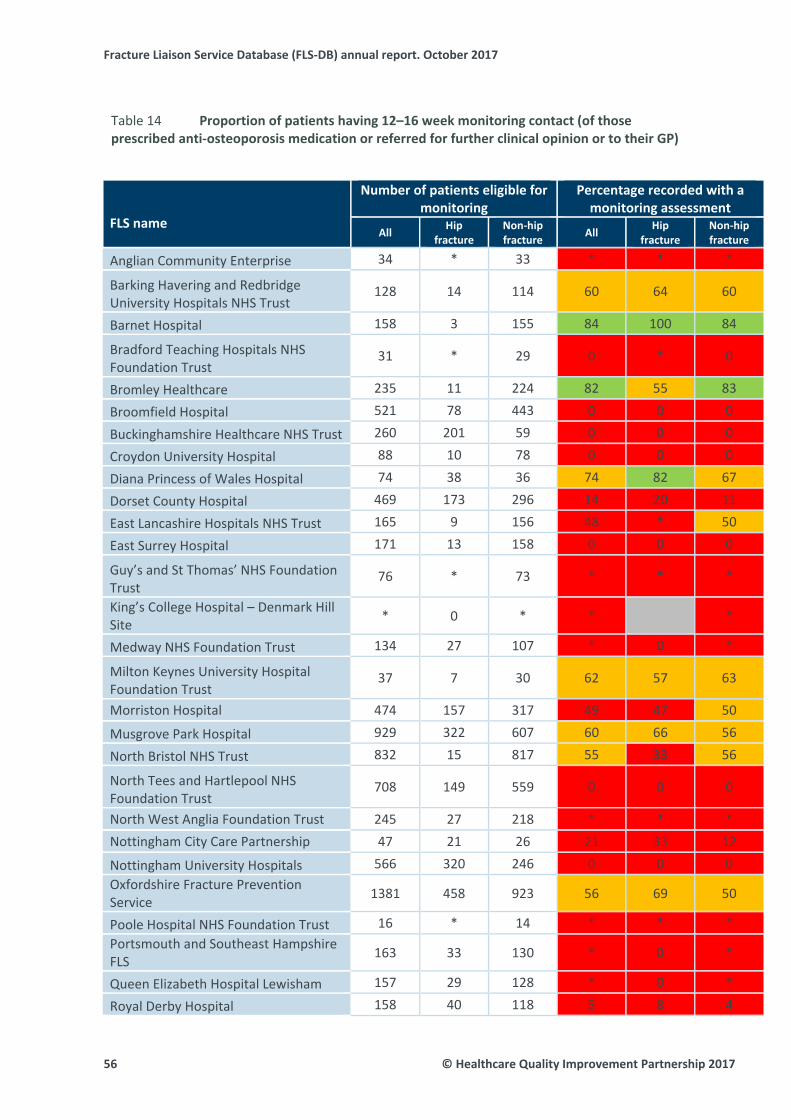
Fracture Liaison Service Database (FLS‐DB) annual report. October 2017
56 © Healthcare Quality Improvement Partnership 2017
Proportion of patients having 12–16 week monitoring contact (of those Table 14
prescribed anti‐osteoporosis medication or referred for further clinical opinion or to their GP)
FLS name
Number of patients eligible for monitoring
Percentage recorded with a monitoring assessment
All Hip
fracture Non‐hip fracture
All Hip
fracture Non‐hip fracture
Anglian Community Enterprise 34 * 33 * * *
Barking Havering and Redbridge University Hospitals NHS Trust
128 14 114 60 64 60
Barnet Hospital 158 3 155 84 100 84
Bradford Teaching Hospitals NHS Foundation Trust
31 * 29 0 * 0
Bromley Healthcare 235 11 224 82 55 83
Broomfield Hospital 521 78 443 0 0 0
Buckinghamshire Healthcare NHS Trust 260 201 59 0 0 0
Croydon University Hospital 88 10 78 0 0 0
Diana Princess of Wales Hospital 74 38 36 74 82 67
Dorset County Hospital 469 173 296 14 20 11
East Lancashire Hospitals NHS Trust 165 9 156 48 * 50
East Surrey Hospital 171 13 158 0 0 0
Guy’s and St Thomas’ NHS Foundation Trust
76 * 73 * * *
King’s College Hospital – Denmark Hill Site * 0 * * *
Medway NHS Foundation Trust 134 27 107 * 0 *
Milton Keynes University Hospital Foundation Trust
37 7 30 62 57 63
Morriston Hospital 474 157 317 49 47 50
Musgrove Park Hospital 929 322 607 60 66 56
North Bristol NHS Trust 832 15 817 55 33 56
North Tees and Hartlepool NHS Foundation Trust
708 149 559 0 0 0
North West Anglia Foundation Trust 245 27 218 * * * Nottingham City Care Partnership 47 21 26 21 33 12
Nottingham University Hospitals 566 320 246 0 0 0 Oxfordshire Fracture Prevention Service 1381 458 923 56 69 50
Poole Hospital NHS Foundation Trust 16 * 14 * * * Portsmouth and Southeast Hampshire FLS 163 33 130 * 0 *
Queen Elizabeth Hospital Lewisham 157 29 128 * 0 *
Royal Derby Hospital 158 40 118 5 8 4
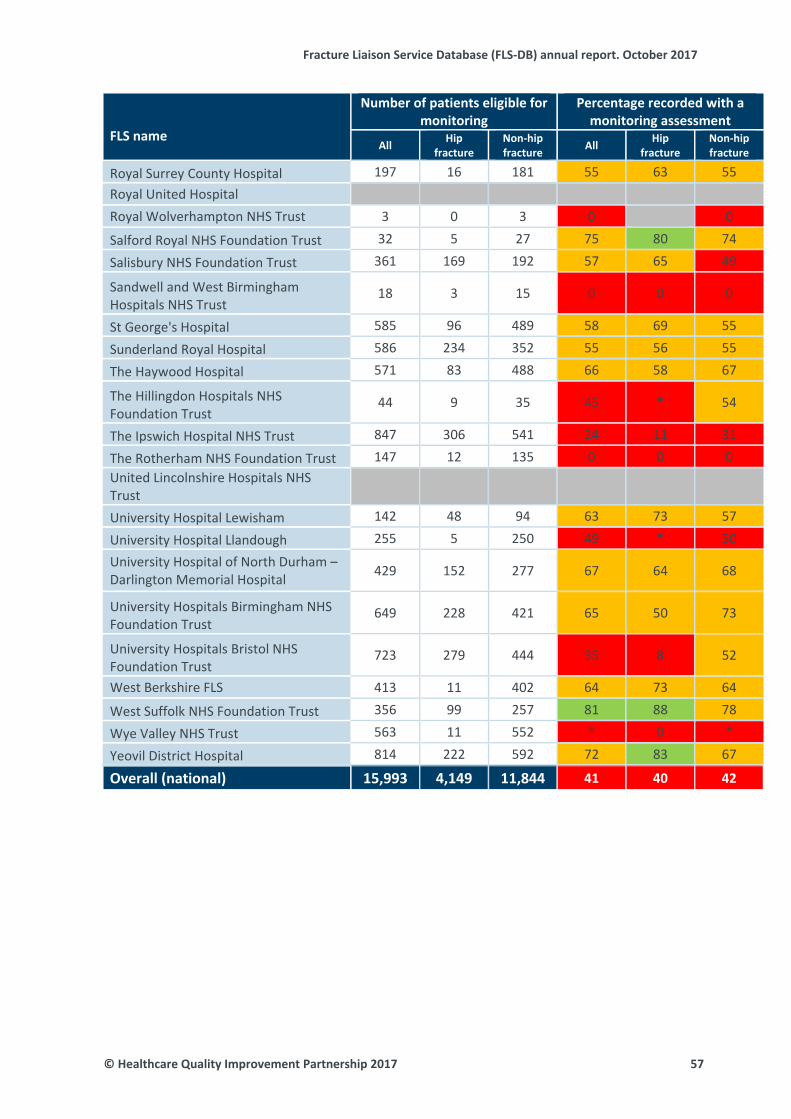
Fracture Liaison Service Database (FLS‐DB) annual report. October 2017
© Healthcare Quality Improvement Partnership 2017 57
FLS name
Number of patients eligible for monitoring
Percentage recorded with a monitoring assessment
All Hip
fracture Non‐hip fracture
All Hip
fracture Non‐hip fracture
Royal Surrey County Hospital 197 16 181 55 63 55 Royal United Hospital Royal Wolverhampton NHS Trust 3 0 3 0 0
Salford Royal NHS Foundation Trust 32 5 27 75 80 74
Salisbury NHS Foundation Trust 361 169 192 57 65 49
Sandwell and West Birmingham Hospitals NHS Trust
18 3 15 0 0 0
St George's Hospital 585 96 489 58 69 55
Sunderland Royal Hospital 586 234 352 55 56 55
The Haywood Hospital 571 83 488 66 58 67
The Hillingdon Hospitals NHS Foundation Trust
44 9 35 45 * 54
The Ipswich Hospital NHS Trust 847 306 541 24 11 31
The Rotherham NHS Foundation Trust 147 12 135 0 0 0 United Lincolnshire Hospitals NHS Trust University Hospital Lewisham 142 48 94 63 73 57
University Hospital Llandough 255 5 250 49 * 50
University Hospital of North Durham – Darlington Memorial Hospital 429 152 277 67 64 68
University Hospitals Birmingham NHS Foundation Trust
649 228 421 65 50 73
University Hospitals Bristol NHS Foundation Trust
723 279 444 35 8 52
West Berkshire FLS 413 11 402 64 73 64
West Suffolk NHS Foundation Trust 356 99 257 81 88 78
Wye Valley NHS Trust 563 11 552 * 0 *
Yeovil District Hospital 814 222 592 72 83 67
Overall (national) 15,993 4,149 11,844 41 40 42
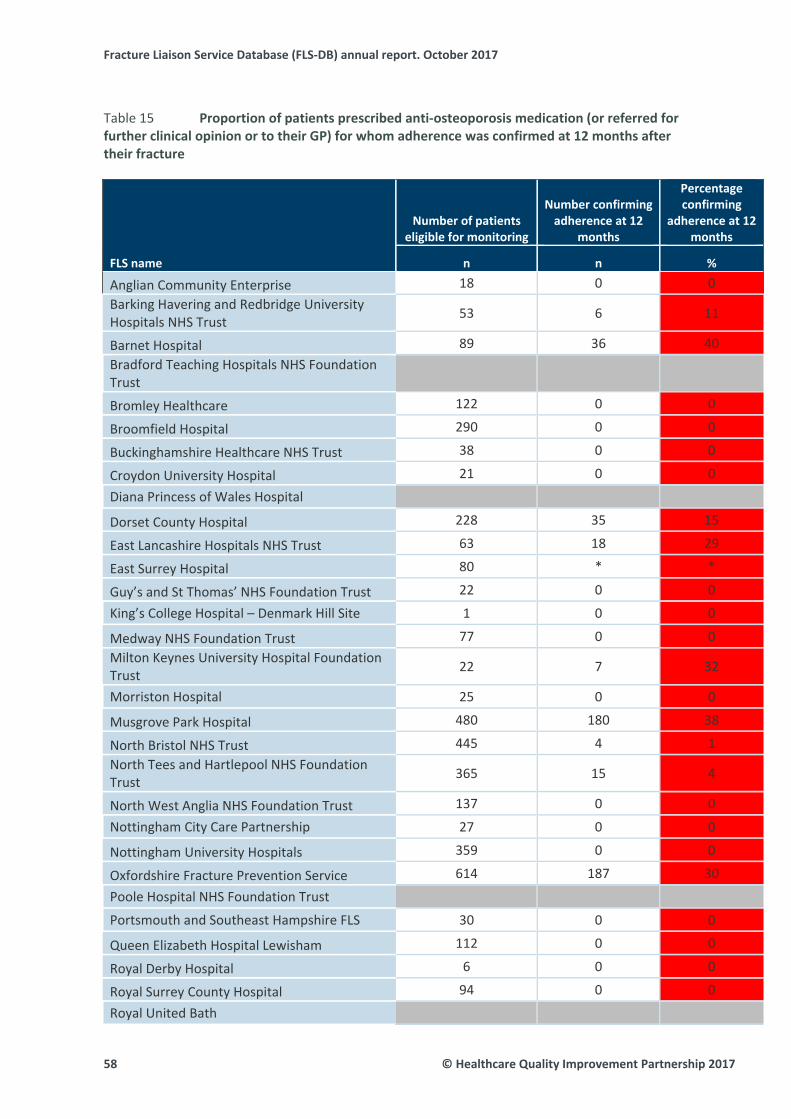
Fracture Liaison Service Database (FLS‐DB) annual report. October 2017
58 © Healthcare Quality Improvement Partnership 2017
Proportion of patients prescribed anti‐osteoporosis medication (or referred for Table 15
further clinical opinion or to their GP) for whom adherence was confirmed at 12 months after their fracture
FLS name
Number of patients eligible for monitoring
Number confirming adherence at 12
months
Percentage confirming
adherence at 12 months
n n %
Anglian Community Enterprise 18 0 0 Barking Havering and Redbridge University Hospitals NHS Trust 53 6 11
Barnet Hospital 89 36 40 Bradford Teaching Hospitals NHS Foundation Trust
Bromley Healthcare 122 0 0
Broomfield Hospital 290 0 0
Buckinghamshire Healthcare NHS Trust 38 0 0
Croydon University Hospital 21 0 0
Diana Princess of Wales Hospital
Dorset County Hospital 228 35 15
East Lancashire Hospitals NHS Trust 63 18 29
East Surrey Hospital 80 * *
Guy’s and St Thomas’ NHS Foundation Trust 22 0 0
King’s College Hospital – Denmark Hill Site 1 0 0
Medway NHS Foundation Trust 77 0 0 Milton Keynes University Hospital Foundation Trust 22 7 32
Morriston Hospital 25 0 0
Musgrove Park Hospital 480 180 38
North Bristol NHS Trust 445 4 1 North Tees and Hartlepool NHS Foundation Trust 365 15 4
North West Anglia NHS Foundation Trust 137 0 0
Nottingham City Care Partnership 27 0 0
Nottingham University Hospitals 359 0 0
Oxfordshire Fracture Prevention Service 614 187 30
Poole Hospital NHS Foundation Trust
Portsmouth and Southeast Hampshire FLS 30 0 0
Queen Elizabeth Hospital Lewisham 112 0 0
Royal Derby Hospital 6 0 0
Royal Surrey County Hospital 94 0 0
Royal United Bath
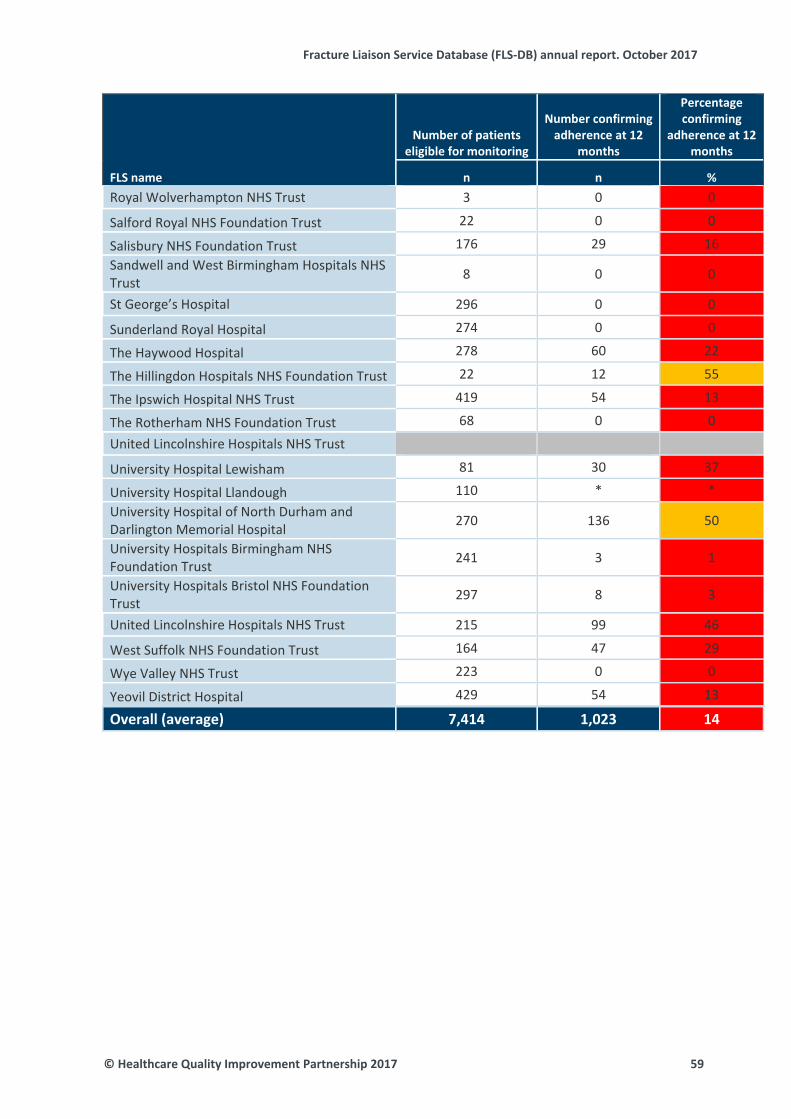
Fracture Liaison Service Database (FLS‐DB) annual report. October 2017
© Healthcare Quality Improvement Partnership 2017 59
FLS name
Number of patients eligible for monitoring
Number confirming adherence at 12
months
Percentage confirming
adherence at 12 months
n n %
Royal Wolverhampton NHS Trust 3 0 0
Salford Royal NHS Foundation Trust 22 0 0
Salisbury NHS Foundation Trust 176 29 16 Sandwell and West Birmingham Hospitals NHS Trust 8 0 0
St George’s Hospital 296 0 0
Sunderland Royal Hospital 274 0 0
The Haywood Hospital 278 60 22
The Hillingdon Hospitals NHS Foundation Trust 22 12 55
The Ipswich Hospital NHS Trust 419 54 13
The Rotherham NHS Foundation Trust 68 0 0
United Lincolnshire Hospitals NHS Trust
University Hospital Lewisham 81 30 37
University Hospital Llandough 110 * * University Hospital of North Durham and Darlington Memorial Hospital 270 136 50
University Hospitals Birmingham NHS Foundation Trust 241 3 1
University Hospitals Bristol NHS Foundation Trust 297 8 3
United Lincolnshire Hospitals NHS Trust 215 99 46
West Suffolk NHS Foundation Trust 164 47 29
Wye Valley NHS Trust 223 0 0
Yeovil District Hospital 429 54 13
Overall (average) 7,414 1,023 14
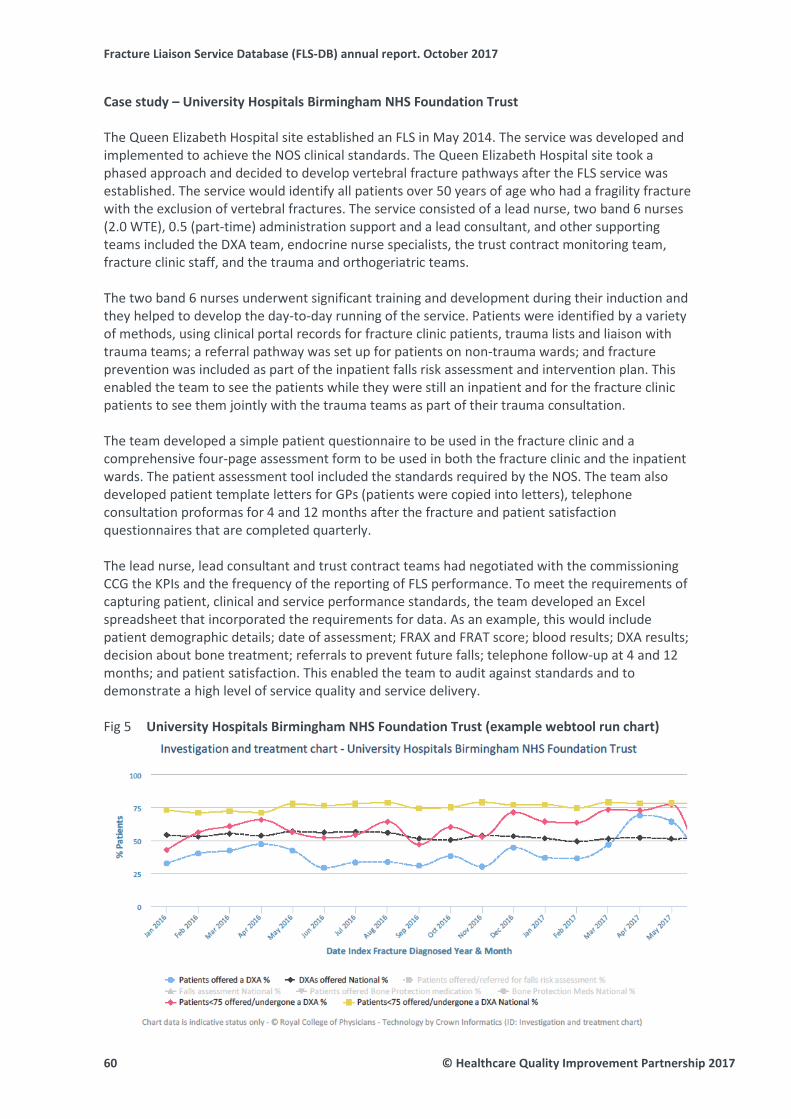
Fracture Liaison Service Database (FLS-DB) annual report. October 2017
Case study – University Hospitals Birmingham NHS Foundation Trust The Queen Elizabeth Hospital site established an FLS in May 2014. The service was developed and implemented to achieve the NOS clinical standards. The Queen Elizabeth Hospital site took a phased approach and decided to develop vertebral fracture pathways after the FLS service was established. The service would identify all patients over 50 years of age who had a fragility fracture with the exclusion of vertebral fractures. The service consisted of a lead nurse, two band 6 nurses (2.0 WTE), 0.5 (part-time) administration support and a lead consultant, and other supporting teams included the DXA team, endocrine nurse specialists, the trust contract monitoring team, fracture clinic staff, and the trauma and orthogeriatric teams. The two band 6 nurses underwent significant training and development during their induction and they helped to develop the day-to-day running of the service. Patients were identified by a variety of methods, using clinical portal records for fracture clinic patients, trauma lists and liaison with trauma teams; a referral pathway was set up for patients on non-trauma wards; and fracture prevention was included as part of the inpatient falls risk assessment and intervention plan. This enabled the team to see the patients while they were still an inpatient and for the fracture clinic patients to see them jointly with the trauma teams as part of their trauma consultation. The team developed a simple patient questionnaire to be used in the fracture clinic and a comprehensive four-page assessment form to be used in both the fracture clinic and the inpatient wards. The patient assessment tool included the standards required by the NOS. The team also developed patient template letters for GPs (patients were copied into letters), telephone consultation proformas for 4 and 12 months after the fracture and patient satisfaction questionnaires that are completed quarterly. The lead nurse, lead consultant and trust contract teams had negotiated with the commissioning CCG the KPIs and the frequency of the reporting of FLS performance. To meet the requirements of capturing patient, clinical and service performance standards, the team developed an Excel spreadsheet that incorporated the requirements for data. As an example, this would include patient demographic details; date of assessment; FRAX and FRAT score; blood results; DXA results; decision about bone treatment; referrals to prevent future falls; telephone follow-up at 4 and 12 months; and patient satisfaction. This enabled the team to audit against standards and to demonstrate a high level of service quality and service delivery.
University Hospitals Birmingham NHS Foundation Trust (example webtool run chart) Fig 5
60 © Healthcare Quality Improvement Partnership 2017
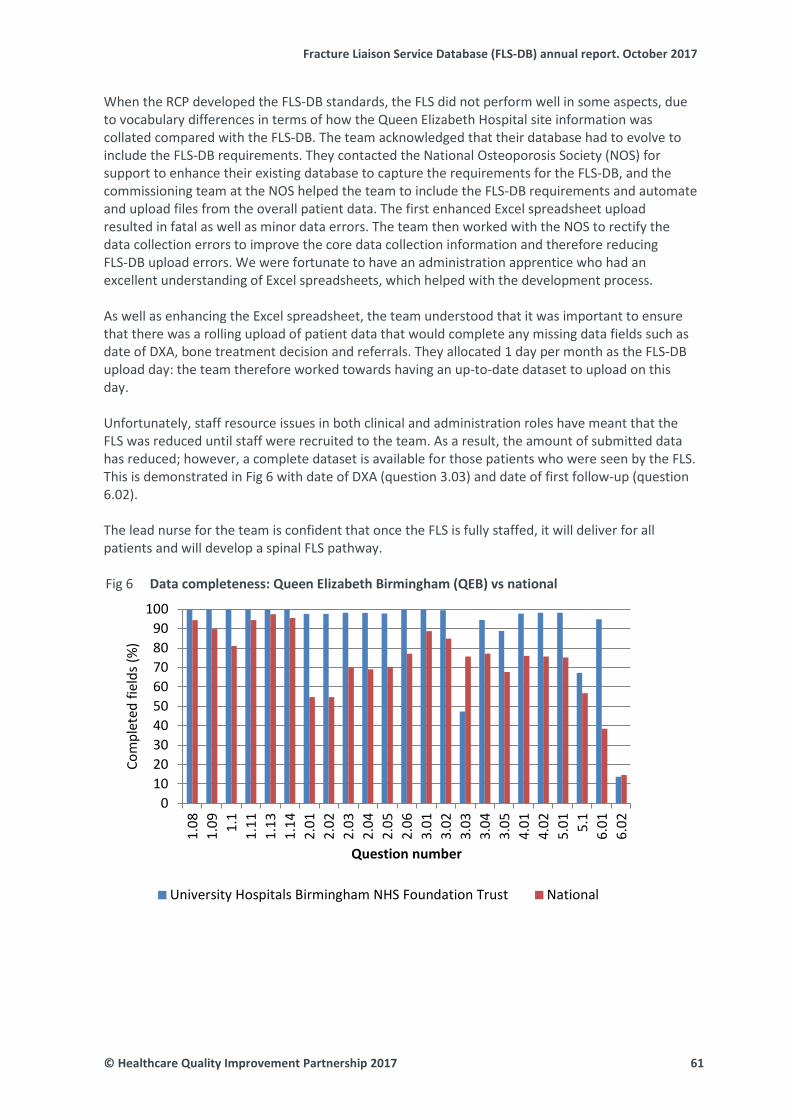
Fracture Liaison Service Database (FLS-DB) annual report. October 2017
When the RCP developed the FLS-DB standards, the FLS did not perform well in some aspects, due to vocabulary differences in terms of how the Queen Elizabeth Hospital site information was collated compared with the FLS-DB. The team acknowledged that their database had to evolve to include the FLS-DB requirements. They contacted the National Osteoporosis Society (NOS) for support to enhance their existing database to capture the requirements for the FLS-DB, and the commissioning team at the NOS helped the team to include the FLS-DB requirements and automate and upload files from the overall patient data. The first enhanced Excel spreadsheet upload resulted in fatal as well as minor data errors. The team then worked with the NOS to rectify the data collection errors to improve the core data collection information and therefore reducing FLS-DB upload errors. We were fortunate to have an administration apprentice who had an excellent understanding of Excel spreadsheets, which helped with the development process. As well as enhancing the Excel spreadsheet, the team understood that it was important to ensure that there was a rolling upload of patient data that would complete any missing data fields such as date of DXA, bone treatment decision and referrals. They allocated 1 day per month as the FLS-DB upload day: the team therefore worked towards having an up-to-date dataset to upload on this day. Unfortunately, staff resource issues in both clinical and administration roles have meant that the FLS was reduced until staff were recruited to the team. As a result, the amount of submitted data has reduced; however, a complete dataset is available for those patients who were seen by the FLS. This is demonstrated in Fig 6 with date of DXA (question 3.03) and date of first follow-up (question 6.02). The lead nurse for the team is confident that once the FLS is fully staffed, it will deliver for all patients and will develop a spinal FLS pathway.
Data completeness: Queen Elizabeth Birmingham (QEB) vs national Fig 6
0102030405060708090
100
1.08
1.09 1.
11.
111.
131.
142.
012.
022.
032.
042.
052.
063.
013.
023.
033.
043.
054.
014.
025.
01 5.1
6.01
6.02
Com
plet
ed fi
elds
(%)
Question number
University Hospitals Birmingham NHS Foundation Trust National
© Healthcare Quality Improvement Partnership 2017 61

Fracture Liaison Service Database (FLS-DB) annual report. October 2017
References
1 National Osteoporosis Society. Benefits calculator 2016. Bath: NOS, 2016. https://benefits.nos.org.uk/ [Accessed October 2017].
2 Royal College of Physicians. Falling standards, broken promises: Report of the national audit of falls and bone health in older people 2010. London: RCP, 2011. www.rcplondon.ac.uk/projects/outputs/falling-standards-broken-promises-report-national-audit-falls-and-bone-health [Accessed October 2017].
3 Quality and Outcomes Framework. Achievement, prevalence and exceptions data, 2012/13. www.hscic.gov.uk/catalogue/PUB12262 [Accessed October 2017].
4 National Osteoporosis Society. Effective secondary prevention of fragility fractures: clinical standards for fracture liaison services. Bath: NOS, 2015. https://staging.nos.org.uk/media/1776/clinical-standards-report.pdf [Accessed October 2017].
5 National Osteoporosis Guideline Group. NOGG 2017:Clinical guideline for the prevention and treatment of osteoporosis. Sheffield: NOGG, 2017 www.sheffield.ac.uk/NOGG/ [Accessed October 2017]
6 National Institute for Health and Care Excellence. Falls in older people: assessing risk and prevention. NICE clinical guideline (CG161). Manchester: NICE, 2013. www.nice.org.uk/guidance/cg161 [Accessed October 2017].
7 National Institute for Health and Care Excellence. Falls in older people. NICE quality standard (QS86). Manchester: NICE, 2015. www.nice.org.uk/guidance/qs86 [Accessed October 2017].
8 British Orthopaedic Association / British Geriatrics Society. The care of patients with fragility fracture. London: BOA, 2007. www.bgs.org.uk/fallsresources-307/subjectreference/fallsandbones/bluebookfragilityfracture [Accessed October 2017].
9 National Institute for Health and Care Excellence. Alendronate, etidronate, risedronate, raloxifene, strontium ranelate and teriparatide for the secondary prevention of osteoporotic fragility fractures in postmenopausal women. NICE technology appraisal (TA161). Manchester: NICE, 2008. www.nice.org.uk/guidance/ta161 [Accessed October 2017].
10 National Institute for Health and Care Excellence. Osteoporosis. NICE quality standard (QS149). Manchester: NICE, 2017. www.nice.org.uk/guidance/qs149 [Accessed October 2017].
11 Royal College of Physicians. Fracture Liaison Service Database (FLS-DB) facilities audit. FLS breakpoint: opportunities for improving patient care following a fragility fracture. London: RCP, 2016.
12 Li L, Roddam A, Gitlin M et al. Persistence with osteoporosis medications among postmenopausal women in the UK General Practice Research Database. Menopause 2012;19:33–40.
62 © Healthcare Quality Improvement Partnership 2017
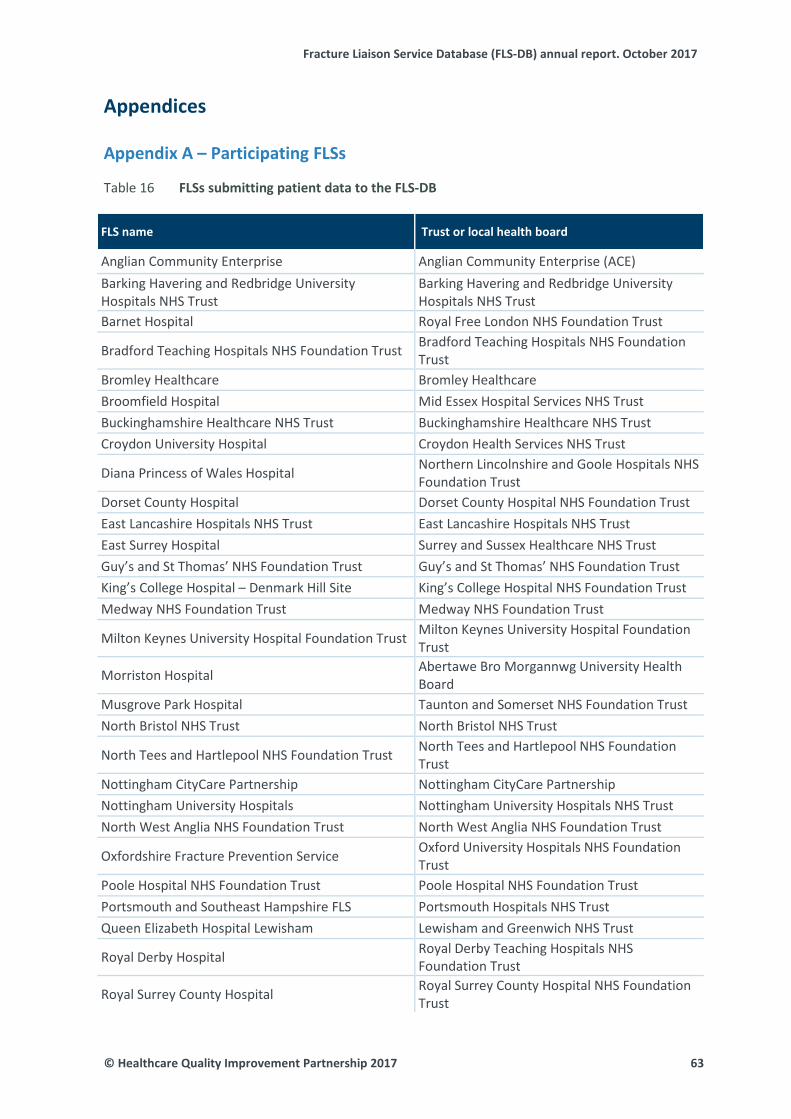
Fracture Liaison Service Database (FLS-DB) annual report. October 2017
Appendices Appendix A – Participating FLSs
FLSs submitting patient data to the FLS-DB Table 16
FLS name Trust or local health board
Anglian Community Enterprise Anglian Community Enterprise (ACE) Barking Havering and Redbridge University Hospitals NHS Trust
Barking Havering and Redbridge University Hospitals NHS Trust
Barnet Hospital Royal Free London NHS Foundation Trust
Bradford Teaching Hospitals NHS Foundation Trust Bradford Teaching Hospitals NHS Foundation Trust
Bromley Healthcare Bromley Healthcare Broomfield Hospital Mid Essex Hospital Services NHS Trust Buckinghamshire Healthcare NHS Trust Buckinghamshire Healthcare NHS Trust Croydon University Hospital Croydon Health Services NHS Trust
Diana Princess of Wales Hospital Northern Lincolnshire and Goole Hospitals NHS Foundation Trust
Dorset County Hospital Dorset County Hospital NHS Foundation Trust East Lancashire Hospitals NHS Trust East Lancashire Hospitals NHS Trust East Surrey Hospital Surrey and Sussex Healthcare NHS Trust Guy’s and St Thomas’ NHS Foundation Trust Guy’s and St Thomas’ NHS Foundation Trust King’s College Hospital – Denmark Hill Site King’s College Hospital NHS Foundation Trust Medway NHS Foundation Trust Medway NHS Foundation Trust
Milton Keynes University Hospital Foundation Trust Milton Keynes University Hospital Foundation Trust
Morriston Hospital Abertawe Bro Morgannwg University Health Board
Musgrove Park Hospital Taunton and Somerset NHS Foundation Trust North Bristol NHS Trust North Bristol NHS Trust
North Tees and Hartlepool NHS Foundation Trust North Tees and Hartlepool NHS Foundation Trust
Nottingham CityCare Partnership Nottingham CityCare Partnership Nottingham University Hospitals Nottingham University Hospitals NHS Trust North West Anglia NHS Foundation Trust North West Anglia NHS Foundation Trust
Oxfordshire Fracture Prevention Service Oxford University Hospitals NHS Foundation Trust
Poole Hospital NHS Foundation Trust Poole Hospital NHS Foundation Trust Portsmouth and Southeast Hampshire FLS Portsmouth Hospitals NHS Trust Queen Elizabeth Hospital Lewisham Lewisham and Greenwich NHS Trust
Royal Derby Hospital Royal Derby Teaching Hospitals NHS Foundation Trust
Royal Surrey County Hospital Royal Surrey County Hospital NHS Foundation Trust
© Healthcare Quality Improvement Partnership 2017 63
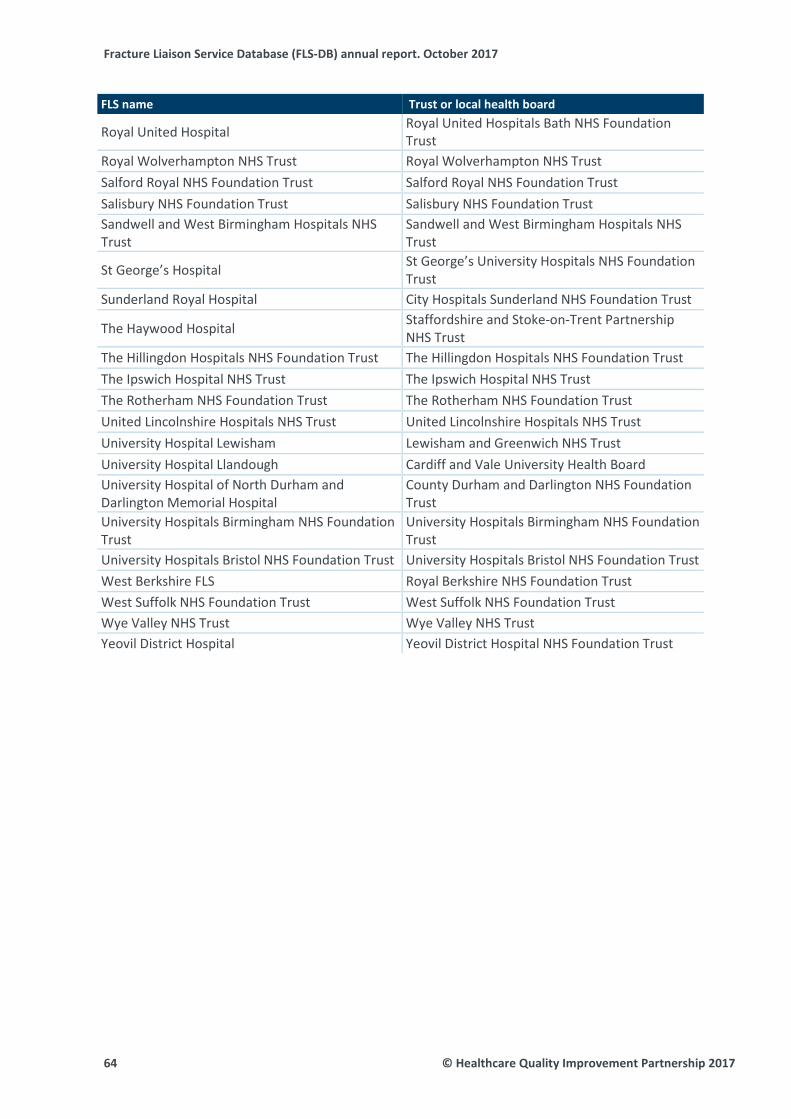
Fracture Liaison Service Database (FLS-DB) annual report. October 2017
FLS name Trust or local health board
Royal United Hospital Royal United Hospitals Bath NHS Foundation Trust
Royal Wolverhampton NHS Trust Royal Wolverhampton NHS Trust Salford Royal NHS Foundation Trust Salford Royal NHS Foundation Trust Salisbury NHS Foundation Trust Salisbury NHS Foundation Trust Sandwell and West Birmingham Hospitals NHS Trust
Sandwell and West Birmingham Hospitals NHS Trust
St George’s Hospital St George’s University Hospitals NHS Foundation Trust
Sunderland Royal Hospital City Hospitals Sunderland NHS Foundation Trust
The Haywood Hospital Staffordshire and Stoke-on-Trent Partnership NHS Trust
The Hillingdon Hospitals NHS Foundation Trust The Hillingdon Hospitals NHS Foundation Trust The Ipswich Hospital NHS Trust The Ipswich Hospital NHS Trust The Rotherham NHS Foundation Trust The Rotherham NHS Foundation Trust United Lincolnshire Hospitals NHS Trust United Lincolnshire Hospitals NHS Trust University Hospital Lewisham Lewisham and Greenwich NHS Trust University Hospital Llandough Cardiff and Vale University Health Board University Hospital of North Durham and Darlington Memorial Hospital
County Durham and Darlington NHS Foundation Trust
University Hospitals Birmingham NHS Foundation Trust
University Hospitals Birmingham NHS Foundation Trust
University Hospitals Bristol NHS Foundation Trust University Hospitals Bristol NHS Foundation Trust West Berkshire FLS Royal Berkshire NHS Foundation Trust West Suffolk NHS Foundation Trust West Suffolk NHS Foundation Trust Wye Valley NHS Trust Wye Valley NHS Trust Yeovil District Hospital Yeovil District Hospital NHS Foundation Trust
64 © Healthcare Quality Improvement Partnership 2017

Fracture Liaison Service Database (FLS-DB) annual report. October 2017
Appendix B – Non-participating trusts and organisations
NHS trusts and organisations where the quality of their FLS meant that it could not Table 17be audited due to non-participation in the FLS-DB
Sites that are not in the patient report
* Aintree University Hospital NHS Foundation Trust
East and North Hertfordshire NHS Trust
Airedale NHS Foundation Trust East Cheshire NHS Trust
* Aneurin Bevan University Health Board
* East Kent Hospitals University NHS Foundation Trust
* Ashford and St Peter’s Hospitals NHS Foundation Trust
East Sussex Healthcare NHS Trust
Barnsley Hospital NHS Foundation Trust
* Epsom and St Helier University Hospitals NHS Trust
Barts Health NHS Trust Frimley Health NHS Foundation Trust
** Basildon and Thurrock University Hospitals NHS Foundation Trust
Gateshead Health NHS Foundation Trust
Bedford Hospital NHS Trust George Eliot Hospital NHS Trust
* Betsi Cadwaladr University Local Health Board
* Gloucestershire Care Services NHS Trust
Blackpool Teaching Hospitals NHS Foundation Trust
Gloucestershire Hospitals NHS Foundation Trust
Bolton NHS Foundation Trust ** Great Western Hospitals NHS Foundation Trust
* Bone Protection Service, NHS Vale of York CCG
Hampshire Hospitals NHS Foundation Trust
Brighton and Sussex University Hospitals NHS Trust
** Harrogate and District NHS Foundation Trust
* Burton Hospitals NHS Foundation Trust
Heart of England NHS Foundation Trust
Calderdale and Huddersfield NHS Foundation Trust
Hinchingbrooke Health Care NHS Trust
EXCL Cambridge University Hospitals NHS Foundation Trust
Homerton University Hospital NHS Foundation Trust
Central Manchester University Hospitals NHS Foundation Trust
Hull and East Yorkshire Hospitals NHS Trust
Chelsea and Westminster Hospital NHS Foundation Trust
Hywel Dda University Health Board
* Chesterfield Royal Hospital NHS Foundation Trust
** Imperial College Healthcare NHS Trust
Colchester Hospital University NHS Foundation Trust
Isle of Wight NHS Trust
© Healthcare Quality Improvement Partnership 2017 65
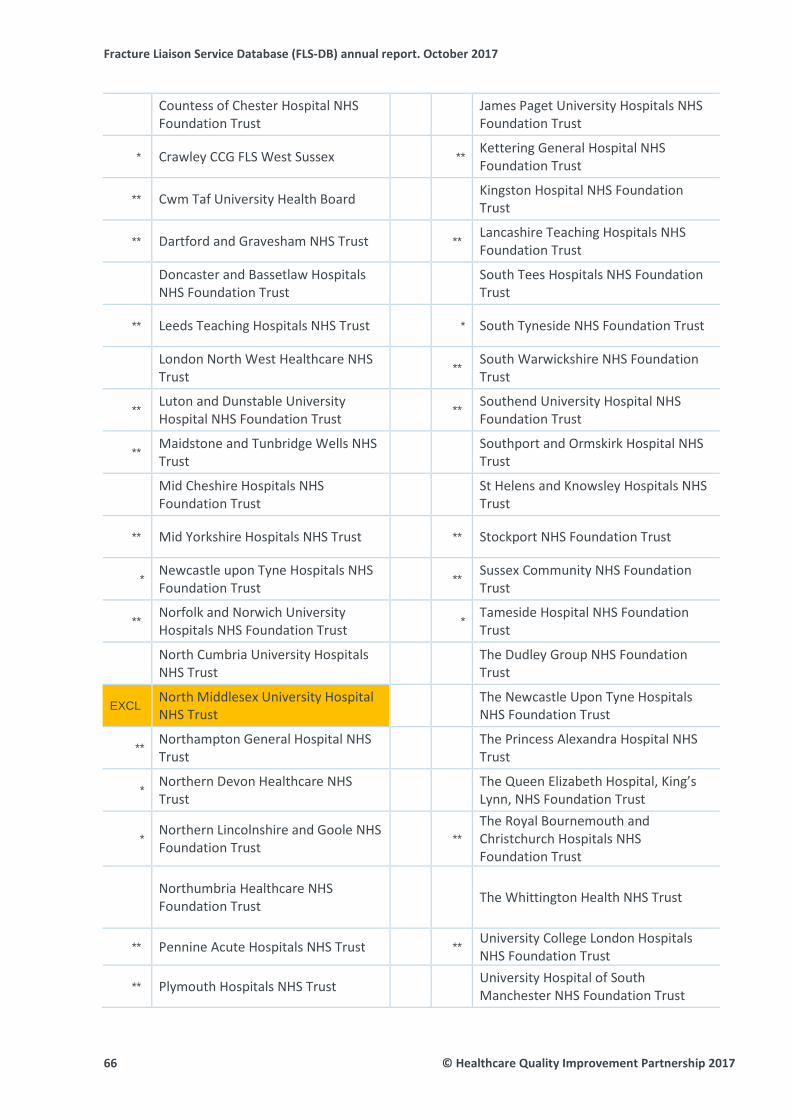
Fracture Liaison Service Database (FLS-DB) annual report. October 2017
Countess of Chester Hospital NHS Foundation Trust
James Paget University Hospitals NHS Foundation Trust
* Crawley CCG FLS West Sussex ** Kettering General Hospital NHS Foundation Trust
** Cwm Taf University Health Board Kingston Hospital NHS Foundation Trust
** Dartford and Gravesham NHS Trust ** Lancashire Teaching Hospitals NHS Foundation Trust
Doncaster and Bassetlaw Hospitals NHS Foundation Trust
South Tees Hospitals NHS Foundation Trust
** Leeds Teaching Hospitals NHS Trust * South Tyneside NHS Foundation Trust
London North West Healthcare NHS Trust
** South Warwickshire NHS Foundation Trust
** Luton and Dunstable University Hospital NHS Foundation Trust
** Southend University Hospital NHS Foundation Trust
** Maidstone and Tunbridge Wells NHS Trust
Southport and Ormskirk Hospital NHS Trust
Mid Cheshire Hospitals NHS Foundation Trust
St Helens and Knowsley Hospitals NHS Trust
** Mid Yorkshire Hospitals NHS Trust ** Stockport NHS Foundation Trust
* Newcastle upon Tyne Hospitals NHS Foundation Trust
** Sussex Community NHS Foundation Trust
** Norfolk and Norwich University Hospitals NHS Foundation Trust
* Tameside Hospital NHS Foundation Trust
North Cumbria University Hospitals NHS Trust
The Dudley Group NHS Foundation Trust
EXCL North Middlesex University Hospital NHS Trust
The Newcastle Upon Tyne Hospitals NHS Foundation Trust
** Northampton General Hospital NHS Trust
The Princess Alexandra Hospital NHS Trust
* Northern Devon Healthcare NHS Trust
The Queen Elizabeth Hospital, King’s Lynn, NHS Foundation Trust
* Northern Lincolnshire and Goole NHS Foundation Trust
** The Royal Bournemouth and Christchurch Hospitals NHS Foundation Trust
Northumbria Healthcare NHS Foundation Trust
The Whittington Health NHS Trust
** Pennine Acute Hospitals NHS Trust ** University College London Hospitals NHS Foundation Trust
** Plymouth Hospitals NHS Trust University Hospital of South Manchester NHS Foundation Trust
66 © Healthcare Quality Improvement Partnership 2017
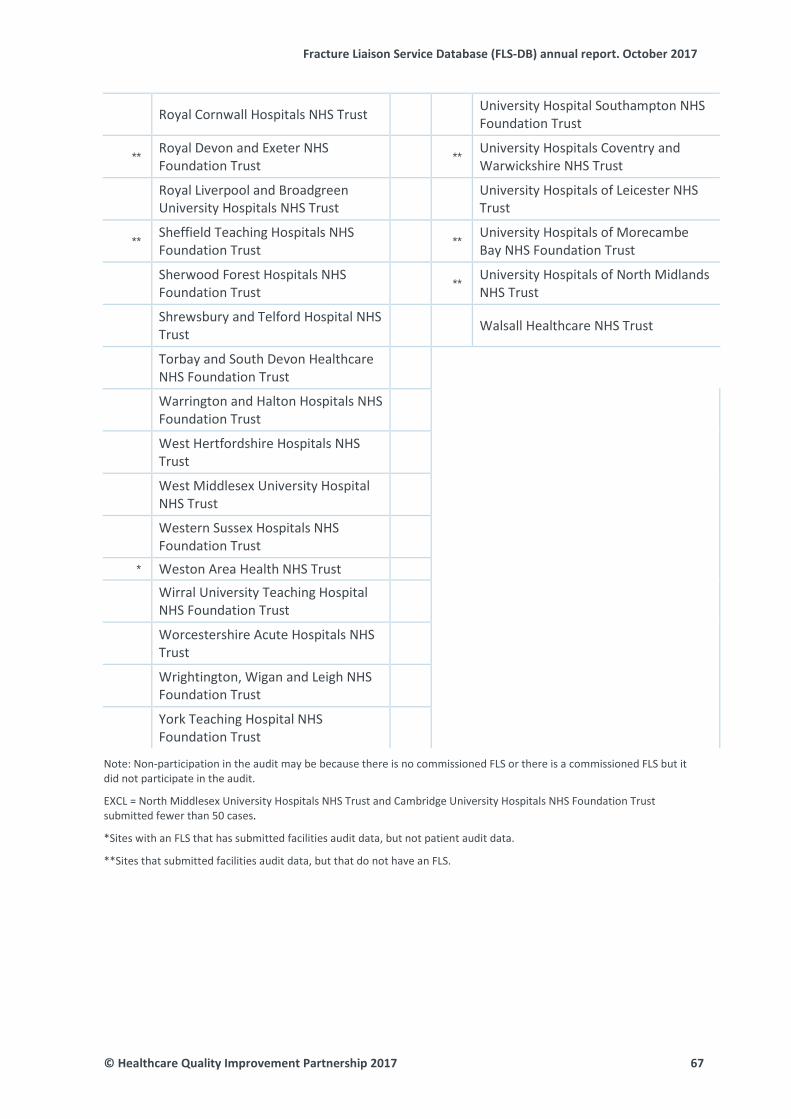
Fracture Liaison Service Database (FLS-DB) annual report. October 2017
Royal Cornwall Hospitals NHS Trust University Hospital Southampton NHS Foundation Trust
** Royal Devon and Exeter NHS Foundation Trust
** University Hospitals Coventry and Warwickshire NHS Trust
Royal Liverpool and Broadgreen University Hospitals NHS Trust
University Hospitals of Leicester NHS Trust
** Sheffield Teaching Hospitals NHS Foundation Trust
** University Hospitals of Morecambe Bay NHS Foundation Trust
Sherwood Forest Hospitals NHS Foundation Trust
** University Hospitals of North Midlands NHS Trust
Shrewsbury and Telford Hospital NHS Trust
Walsall Healthcare NHS Trust
Torbay and South Devon Healthcare NHS Foundation Trust
Warrington and Halton Hospitals NHS Foundation Trust
West Hertfordshire Hospitals NHS Trust
West Middlesex University Hospital NHS Trust
Western Sussex Hospitals NHS Foundation Trust
* Weston Area Health NHS Trust
Wirral University Teaching Hospital NHS Foundation Trust
Worcestershire Acute Hospitals NHS Trust
Wrightington, Wigan and Leigh NHS Foundation Trust
York Teaching Hospital NHS Foundation Trust
Note: Non-participation in the audit may be because there is no commissioned FLS or there is a commissioned FLS but it did not participate in the audit. EXCL = North Middlesex University Hospitals NHS Trust and Cambridge University Hospitals NHS Foundation Trust submitted fewer than 50 cases.
*Sites with an FLS that has submitted facilities audit data, but not patient audit data.
**Sites that submitted facilities audit data, but that do not have an FLS.
© Healthcare Quality Improvement Partnership 2017 67
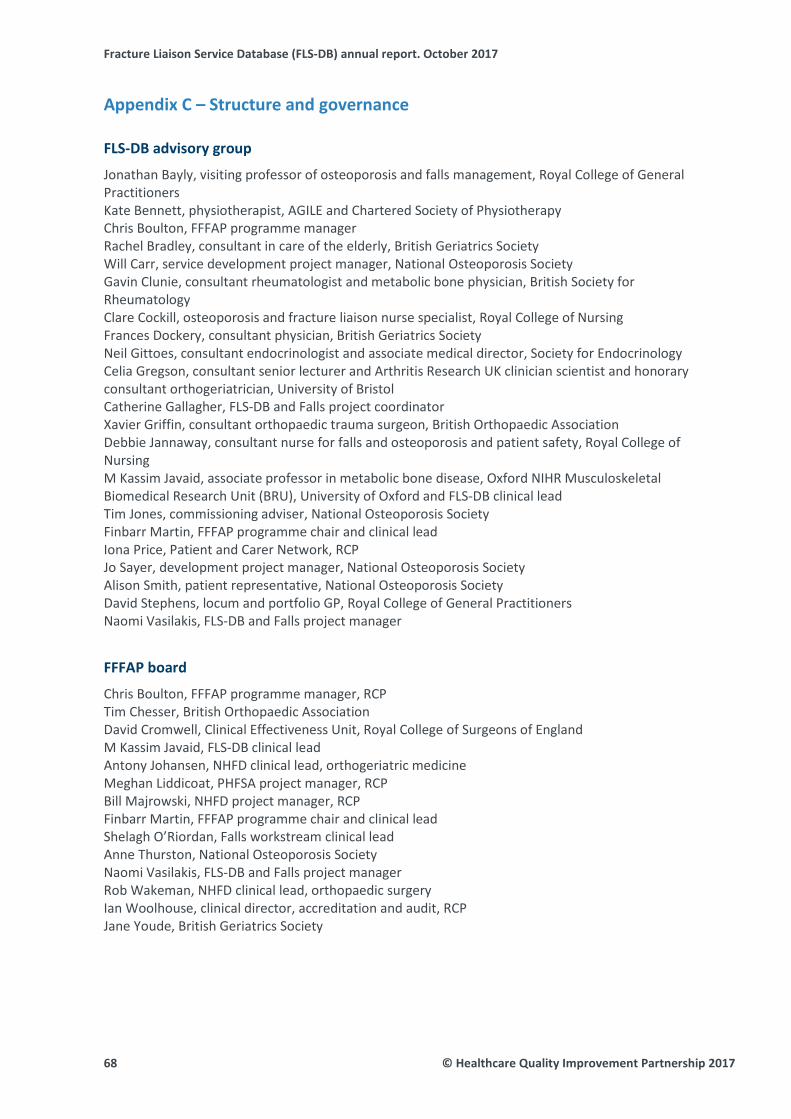
Fracture Liaison Service Database (FLS-DB) annual report. October 2017
Appendix C – Structure and governance FLS-DB advisory group
Jonathan Bayly, visiting professor of osteoporosis and falls management, Royal College of General Practitioners Kate Bennett, physiotherapist, AGILE and Chartered Society of Physiotherapy Chris Boulton, FFFAP programme manager Rachel Bradley, consultant in care of the elderly, British Geriatrics Society Will Carr, service development project manager, National Osteoporosis Society Gavin Clunie, consultant rheumatologist and metabolic bone physician, British Society for Rheumatology Clare Cockill, osteoporosis and fracture liaison nurse specialist, Royal College of Nursing Frances Dockery, consultant physician, British Geriatrics Society Neil Gittoes, consultant endocrinologist and associate medical director, Society for Endocrinology Celia Gregson, consultant senior lecturer and Arthritis Research UK clinician scientist and honorary consultant orthogeriatrician, University of Bristol Catherine Gallagher, FLS-DB and Falls project coordinator Xavier Griffin, consultant orthopaedic trauma surgeon, British Orthopaedic Association Debbie Jannaway, consultant nurse for falls and osteoporosis and patient safety, Royal College of Nursing M Kassim Javaid, associate professor in metabolic bone disease, Oxford NIHR Musculoskeletal Biomedical Research Unit (BRU), University of Oxford and FLS-DB clinical lead Tim Jones, commissioning adviser, National Osteoporosis Society Finbarr Martin, FFFAP programme chair and clinical lead Iona Price, Patient and Carer Network, RCP Jo Sayer, development project manager, National Osteoporosis Society Alison Smith, patient representative, National Osteoporosis Society David Stephens, locum and portfolio GP, Royal College of General Practitioners Naomi Vasilakis, FLS-DB and Falls project manager
FFFAP board
Chris Boulton, FFFAP programme manager, RCP Tim Chesser, British Orthopaedic Association David Cromwell, Clinical Effectiveness Unit, Royal College of Surgeons of England M Kassim Javaid, FLS-DB clinical lead Antony Johansen, NHFD clinical lead, orthogeriatric medicine Meghan Liddicoat, PHFSA project manager, RCP Bill Majrowski, NHFD project manager, RCP Finbarr Martin, FFFAP programme chair and clinical lead Shelagh O’Riordan, Falls workstream clinical lead Anne Thurston, National Osteoporosis Society Naomi Vasilakis, FLS-DB and Falls project manager Rob Wakeman, NHFD clinical lead, orthopaedic surgery Ian Woolhouse, clinical director, accreditation and audit, RCP Jane Youde, British Geriatrics Society
68 © Healthcare Quality Improvement Partnership 2017

This report provides the second benchmark for the performance of FLSs at the patient level and demonstrates the step change in engagement and quality improvement in England and Wales.
Falls and Fragility Fracture Audit Programme (FFFAP)
A suite of linked national clinical audits, driving improvements in care; managed by the Royal College of Physicians
> Falls Pathway Workstream > Fracture Liaison Service Database (FLS-DB) > National Hip Fracture Database (NHFD)


![An evaluation of fracture liaison services in the detection and …usir.salford.ac.uk/47940/3/USIR[1].pdf · 2019. 5. 25. · Fragility fracture identification: the role of radiology](https://img.pdfslide.net/doc/110x75/609ed2e7fa22e74ee96559b6/an-evaluation-of-fracture-liaison-services-in-the-detection-and-usir-1pdf-2019.jpg)