Embed Size (px)
Citation preview

HAL Id: hal-00115129https://hal-insu.archives-ouvertes.fr/hal-00115129
Submitted on 18 Feb 2013
HAL is a multi-disciplinary open accessarchive for the deposit and dissemination of sci-entific research documents, whether they are pub-lished or not. The documents may come fromteaching and research institutions in France orabroad, or from public or private research centers.
L’archive ouverte pluridisciplinaire HAL, estdestinée au dépôt et à la diffusion de documentsscientifiques de niveau recherche, publiés ou non,émanant des établissements d’enseignement et derecherche français ou étrangers, des laboratoirespublics ou privés.
Fragmentation of foamed silicic melts: an experimentalstudy
Caroline Martel, Donald B. Dingwell, Oliver Spieler, Michel Pichavant, MaxWilke
To cite this version:Caroline Martel, Donald B. Dingwell, Oliver Spieler, Michel Pichavant, Max Wilke. Fragmentationof foamed silicic melts: an experimental study. Earth and Planetary Science Letters, Elsevier, 2000,178, pp.47-58. �10.1016/S0012-821X(00)00062-5�. �hal-00115129�

Fragmentation of foamed silicic melts: an
experimental study
C Martela, D.B Dingwell
a, O Spieler
a, M Pichavant
b, M Wilke
c
a Bayerisches Geoinstitut, Universität Bayreuth, 95440 Bayreuth, Germany
b CNRS-CRSCM, 1A rue de la Férollerie, 45071 Orléans Cedex 2, France
c Institut für Mineralogie, Universität Hannover, Welfengarten 1, 30167 Hannover,
Germany
Abstract
We present the first experimental investigation of the fragmentation behavior of two-
phase (melt+gas) rhyolitic systems under rapid decompression. Two-phase samples have
been generated by foaming water-oversaturated rhyolitic melts up to 900°C and up to 18
MPa prior to rapid decompression in a fragmentation bomb. The fragmented particles or
experimental pyroclasts were recovered for analysis. Several features of naturally foamed
pumices have been reproduced, including the generation of both isotropic and tube
pumices. We focus here on the fragmentation behavior. Fragmentation occurred through a
layer-by-layer process, in the brittle regime of melt response. We investigated the
influence of the magnitude of the decompression (4 to 18 MPa), the porosity (0 to 85
vol%) and the pore morphology (tube versus isotropic) on the fragment size distribution.
Less vesicular samples (porosity<50 vol%) generate coarser fragments. Highly vesicular
samples (porosity>50 vol%) yield coarser fragments when decompressed below 15 MPa
and finer fragments when decompressed above 15 MPa. Increasing decompression of the
vesicular samples results in a decrease in fragment size of 0.2 Φ unit/MPa. The presence
of tubes instead of isotropic pores in vesicular samples generates finer fragments under
decompression. Implications for dome eruptions are discussed.
Keywords : fragmentation; experimental studies; magmas; pyroclastics; size
distribution; domes
1. Introduction
Explosive silicic eruptions are controlled by a complex interplay of physical and chemical
processes, leading to a wide range of eruptive features. Critical to the evaluation of
monitoring data and for the development of eruptive scenarios is a realistic and detailed
mechanistic picture of silicic eruptions, which are most robust if they can be confirmed by
real time experimental investigation of the magma of interest, under realistic pressure–
temperature conditions.
Reliable quantification of the parameterization of experimental results on magma
fragmentation must be based on a solid foundation of well-characterized materials. We have
chosen the best investigated silicate melt system of relevance to the earth sciences, HPG8
haplogranitic melt+water [1], which allow us to specify the physico-chemical properties (e.g.
surface tension, viscosity, density, diffusivity) of the magma during the fragmentation event.

The fragmentation of magma remains hotly debated: there is no general agreement on
mechanisms [2], [3], [4] and [5]. The principal fragmentation mechanisms in bubbly melts
that have been proposed are gas bubble overpressure exceeding the magma tensile strength
and melt film instabilities due to the propagation of a decompression wave.
Fragmentation simulations in laboratories have been performed in shock-tube apparatus,
either using liquids at room pressure and temperature or magmas. The former studies [6],
[7] and [8] provide the opportunity to observe the dynamics of vesiculation and fragmentation
in transparent experimental devices. In the latter studies [9] and [10], natural magmas are
rapidly decompressed and the chilled fragmented particles are recovered for characterization.
These experimental simulations have been pioneering in nature and are certainly valuable but
the time has now come to systematize the nature and efficiency of fragmentation as a function
of the physico-chemical state of the magma and the intensive variables operative at the
fragmentation event in nature.
We are interested here in the mechanism by which magmas fragment under rapid
decompression using the experimental device of [9] and [10]. Two sets of parameters that
must be constrained for these simulations are the magnitude of the decompression and the
physico-chemical properties of the material prior to fragmentation. As the samples have been
foamed under controlled conditions immediately prior to fragmentation, we can compare the
influence of porosity, viscosity and decompression on the fragment morphology and size
distribution.
2. Experimental
2.1. Fragmentation apparatus
The fragmentation device is described in [9] and [10]. A high-pressure and high-temperature
(HPT, up to 23 MPa and 950°C) section consists of a vertically operating externally heated
cold-seal pressure vessel (Nimonic 105 alloy) with a bore of 20 mm in diameter and 450 mm
in length. Cylindrical samples are placed in the hot source of the HPT section on a top of a K-
type thermocouple (precision of ±1°C). The temperature gradient of a 5 cm long sample is
less than 20°C [9]. The average heating rate ranges between 15°C/min at temperatures below
400°C and 5°C/min at temperatures above 650°C. The pressure medium is argon. The
pressure is measured by piezoresistive pressure transducers (precision of ±0.2 MPa). The low-
pressure and low-temperature (LPT, room conditions) section is a large cylindrical tank, 2 m
high and 70 cm wide. The HPT section is sealed and separated from the LPT section by one to
three copper or steel diaphragms specially designed to disrupt at a given pressure depending
on their thickness.
2.2. Sample preparation
A finely ground powder of HPG8 haplogranitic glass (SiO2: 79.0, Al2O3: 12.0, Na2O: 4.6,
K2O: 4.2 wt%, microprobe analyses) was loaded with 1.4 to 5.7 wt% distilled water in
platinum capsules of 2 cm in diameter and 2 cm in length. Capsules were arc-welded while
surrounded by liquid nitrogen to prevent water loss. Melt hydrations were performed in large
diameter furnace of an internally heated pressure vessel (IHPV) at CRSCM in Orléans for ca.
1 month at 950°C and 120 MPa, then isobarically quenched. Smaller samples were prepared
in platinum capsules of 8 mm diameter and 2.5 cm long, loaded for 4–6 days in a vertically
working IHPV at 1000–1100°C and 300 MPa at the Mineralogical Institute of the University
of Hannover. The starting glasses were all crystal-free, but small bubbles were sometimes
present (see Table 1 for bubble size and volume). Doubly polished (150–220 μm thick) glass
plates prepared from each end of the cylinders were used for the determination of water
content by near-infrared spectroscopy (Bruker IFS 120 HR). The concentrations of H2O and
OH species were determined from the height of the absorption bands at 5230 and 4500 cm−1
,
respectively, by using the Lambert–Beer law and the extinction coefficients of [17]. Water
contents between the two ends of the glass cylinders were homogeneous within a range of 0.2
wt%, up to 0.4 wt% for two samples (Table 1).
2.3. Vesiculation and fragmentation experiments
The hydrated glass cylinders were polished to fit tube-shape holders (8 mm i.d. and 5 cm long
or 17 mm i.d. and 25 cm long), which were loaded inside the HPT section of the
fragmentation device. The HPT section was pressurized, then heated up. These conditions
were maintained constant for 30 min, so that water exolution from the oversaturated melt is
allowed to proceed within 1–2 h (starting at the glass transition temperature). All the
experiments experienced vesiculation and subsequent rapid decompression, except
experiments 1 and 2, which were isobarically quenched instead of rapidly decompressed,
providing an insight into the pre-fragmentation state. The sequential occurrence of foaming
and fragmentation permits the investigation of foamed materials without the potential
complications arising from changes in foamed material properties due to an intermediate
quenching step.
Some experiments were performed using a single diaphragm, which was disrupted by
increasing the pressure in the HPT section up to the diaphragm strength (maximum increase
of 4 MPa in less than 5 s). During the course of this work we improved the procedure by
installing a set of three diaphragms, separated by two small-volume chambers that were
independently pressurized. Pressurizing these small-volume chambers over the strength of the
diaphragms while pressure is maintained constant in the HPT section leads to the
simultaneous disruption of the three diaphragms and subsequent rapid decompression of the
sample. Calculated decompression rates of a 5 cm long sample, range from 5 to 23 MPa/ms
[1]. The sample fragments if its strength is overcome and the fragments were collected in the
LPT section after rinsing with water. This wet collection procedure produces mass yields of
more than 97% of the initial weight. The experimental conditions are reported in Table 1.
3. Pyroclast analysis
3.1. Size distribution, morphology and water content of the fragments
The recovered pyroclasts were sieved to obtain fragment size distributions (FSD). The
automatic sieving was performed with care to prevent secondary breakage of these sometimes
highly porous and fragile particles (errors due to loss of particles and breaking are less than 3
and 5 wt%, respectively). We did not sieve particles below 63 μm in diameter, referred as an
arbitrary 40 μm diameter (4.5 Φ units). The mean and median diameters were calculated after
[18].
Pyroclasts of different sizes were selected for the morphological study by scanning electron
microscopy (JEOL 840A SEM). The aim was to characterize the fragment shapes and outlines
in order to infer aspects of the fragmentation processes they experienced.

The glass component of the fragments was analyzed for water content by infrared
spectroscopy following the procedure used for the starting hydrated glasses. Where the glass
areas were too small for infrared spectroscopy measurements, the fragments were crushed
below the size of the smallest bubbles for water determination by Karl–Fischer titration. If the
amount of fragmented material was too low for Karl–Fischer titration analysis, water contents
were calculated after [11].
3.2. Vesicularity
Fragments were selected for qualitative and quantitative analyses of the vesicularity. The
porosity, bubble shape and bubble size distribution (BSD) were determined by image analysis
from SEM pictures of the embedded fragments used for the fragment morphology study. The
porosity was determined from the two-dimensional sections and considered equivalent to the
volume percent of pores. By repeated measurements, it appeared that the higher the porosity,
the larger the errors on the vesicularity (up to ±8 at 83 vol%; Table 1), probably due to
pumice damage during polishing. The bubble sizes were defined by their measured diameters.
In case of very elongated pores (tubes), the full length of the elongation is not measurable
because of intersection by the fragmentation planes, so that pore sizes are defined by the
diameter of the section normal to the tube elongation preceded by a ‘T’ (for tube).
In each experiment, a minority of the fragments was nearly or fully glassy (i.e. very few
bubbles). The vesiculation experiments (without decompression, experiments 1 and 2, Table
1) revealed that these fragments might represent the rims at the contact with the holder. These
bubble-depleted parts were not considered in our vesicularity study.
4. Results
4.1. Vesicularity, pore morphology and bubble size distribution the pyroclasts
Low porous (<50 vol%) fragments have average vesicularities 5 to 15 vol% higher than the
calculated vesicularities (Fig. 1). Vesicularities measured on highly porous fragments are in
better agreement with the calculated ones, although fragments from bubble-bearing starting
samples are on average 5 vol% (up to 10 vol%) less porous than the calculated values.
Pores are either isotropic (Fig. 2a,b,d) or elongated (Fig. 2c,e). Fragments less porous than 50
vol% only display isotropic pores, but above ∼50 vol% porosity, pyroclasts show either tubes
or isotropic pores (Table 2). The tubes are always wider than 40 μm, whereas isotropic pores
are smaller than ∼50 μm in diameter (except in experiment 24). Bubble size distributions are
either unimodal or bimodal. Bimodal BSDs only characterize highly porous samples (α>60
vol%), whose starting glass cylinders contained bubbles, so that the population of large
bubbles (second mode of the BSD) might represent expansion of the pre-existing pores.
4.2. Morphology and size distribution of the pyroclasts
Fragments exhibit plate-like shapes (Fig. 2d,e,f) and have angular outlines, irrespective of the
pore size or shape.
Under rapid decompression, three samples did not experience fragmentation (experiments 18,
19, 20) and two were fragmented in a small number of particles (experiments 11, 27). For the
other experiments, FSDs are reported in Table 2. The distribution is always unimodal and the

particles, ranging from −2.5 to 4.5 Φ units (5.6 to 0.04 mm) correspond to coarse ash
according to the classical size scale of volcanic clasts. For most of the experiments, the mean
diameters are similar to the median diameters or slightly skewed to finer sizes.
5. Discussion
5.1. Pre-fragmentation conditions
5.1.1. Foaming
Our samples were able to foam under decompression as low as 1 MPa (experiment 2), which
was only observed in crystal-bearing samples (heterogeneous nucleation, [19]). Therefore, we
think that water nucleation in our samples was heterogeneous, probably due to tiny bubbles,
microfractures or impurities in the starting glass cylinders.
A vital point in our assumption that no significant viscous strain occurs during or after
fragmentation is the question whether or not fragment porosity equals pre-fragmented foam
porosity. The water solubilities calculated for the HPT section conditions agree with measured
water contents within 0.4 wt% (Table 1), so that water did not diffuse from the melt to the
bubbles during fragmentation. However, calculated cooling times up to 10 s for a particle
radius of 2 mm (thermal diffusivity of 4×10⁻⁷
m2/s) are larger than the decompression time
(10−3
s [1]), so that the gas in the fragments are likely to expand after decompression,
especially at melt viscosities below 108 Pa s for which bubble growth is not impeded. Our
experimental pyroclasts are mostly more porous with respect to the calculated vesicularities
(except fragments from bubble-bearing starting materials), suggesting that the actual porosity
of the pyroclasts might overestimate the porosity prior to fragmentation on average by 5 vol%
and up to 15 vol% (Table 1).
5.1.2. Isotropic versus tube pumices
Either isotropic or tube pumices were generated in the experiments. A crucial point for our
study is the determination of the pre-fragmentation pore characteristics, i.e. whether tube
pumices were formed before or during fragmentation. Tubes can certainly be formed before
decompression, as illustrated by the tubes in experiment 1 where no decompression and
fragmentation occurred. In order to determine whether tubes can also occur during
decompression, we compared the timescales of fragment cooling and bubble elongation.
Bubble elongation is parameterized by the capillary number (Ca), giving the ratio of the
viscous forces which act to deform a bubble to the interfacial forces which tend to maintain
the sphericity [20]: Ca=έηR/σ (έ is the strain rate, η is the melt viscosity, R is the bubble radius
and σ is the surface tension). A Ca number of 1 represents the maximum strain rate due to
flow around the bubble that may occur without deforming the bubble to a non-spherical shape
[21]. For Ca=1, η=105.7
Pa s, R=25 μm and σ=0.15 N m−1
[22], έ is of the order of 10−2
s−1
,
giving a time scale of 100 s (up to 104 s for η=10
8.1 Pa s). The slowest cooling time of ∼10 s
(see above) is shorter than the bubble elongation timescale, so that bubbles are very unlikely
to elongate during or after decompression.
The reason why either isotropic or tube pores are generated is not yet elucidated. However, it
seems to be related to bubble size. Indeed, isotropic pumices were generated when bubbles
did not grow above ∼50 μm in diameter (even at total porosities higher than 70 vol%), but
once they grew up to ∼50 μm at a total porosity larger than ∼50 vol%, pores end up as tubes

(except for experiment 24). It seems that ∼50 vol% of porosity is the maximal volume for
packing spheres of ∼50 μm in our experimental configuration where the sample holder
closely surrounds the samples, thus restricting lateral bubble expansion.
5.2. Fragmentation conditions
5.2.1. Fragmentation mechanism
From the plate-like shape fragments they recovered from experiments carried out using
Mount St. Helens dacite and from observation through high-speed cameras [23], Alidibirov
and Dingwell [24] concluded that the main fracturing process occurring in the fragmentation
bomb apparatus is a spallation fragmentation. The spallation fragmentation wave refers to the
decompression of magma containing pressurized gas vesicles (either close or open porosity).
Fragmentation is initiated by the disruption of the interbubble partitions due to the pressure
differential between gas in pores and ambient pressure, and propagates downwards into the
next layer of pores. Our plate-like shape pyroclasts are very likely to have experienced the
same layer-by-layer fragmentation process.
Three size distributions are commonly proposed to account for fragment populations
generated in industrial and natural processes: log-normal, power-law and exponential [25].
Fragmentation of a solid by an explosion or with a hammer generates a power-law
distribution (log-normal distributions rather describe droplets produced by the breakup of a
liquid jet and the exponential distributions characterize sequential processes such as grinding
and milling). The inset of Fig. 3 shows that the fragment sizes plotted in the power-law
typical coordinates give almost straight lines, suggesting that the FSDs produced by a
spallation fragmentation are close to follow a power-law, with exponents D ranging from 2.0
to 4.1 (Table 2).
5.2.2. Brittle versus ductile fragmentation
Recently, brittle versus ductile fragmentation of the magma has been discussed [2]. If the
applied stress is sufficient to push the strain response of the magma into the glass transition
region and overcome its strength, the magma fragments brittle. The following observations of
the fragment outlines and calculations allow us to resolve whether a brittle or ductile
fragmentation occurred. The tube pumices have outlines sharply cutting the tubes (e.g. Fig.
2c). By a ductile fragmentation, these tubes would have been distorted, tapered or necked at
their tips. The brittle fragmentation is confirmed by the process timescales. When the
application time of the stress is shorter than the relaxation time required for the melt to
deform in a viscous manner, brittle fragmentation can occur. The relaxation time (τs) of a
product in response to an applied stress is given by the Maxwell relation: τs=η/G, where η is
the viscosity and G the elastic modulus which is proportional to Young’s modulus for tensile
stresses. For a Young’s modulus of 1010
Pa, corresponding to a dacitic glassy matrix [26] and
bubbly-melt viscosities between 107 to 10
9.4 Pa s (Table 1), τs ranges from 10
−3 to 10
−1 s,
respectively. The decompression time Δtdec (∼10−3
s) is shorter than τs, thus suggesting a
brittle fragmentation. An exception is experiment 10, having a relaxation time τs of ∼10−3.5
s,
thus permitting a short viscous deformation during fragmentation.
The decompression threshold at which fragmentation occurs gives the strength of the material.
No fragmentation occurred in experiment 20 under rapid decompression at 5 MPa (porosity of
58 vol%, melt viscosity of 107.9
Pa s). The sample from experiment 11 was however slightly

fragmented at 5 MPa (porosity of 45 vol%, melt viscosity of 107.2
Pa s). This suggests a
strength for our samples of ∼5 MPa.
5.2.3. Parameters controlling the fragment size
We investigated the effects of the porosity and pressure on the power-law exponent D (Fig.
3). Samples less porous than 50 vol% are characterized by D<3.0, reflecting that the FSDs are
controlled by the large fragments. Above 50 vol% of porosity, FSDs are characterized either
by D<3.0 when samples were fragmented below 15 MPa or by D>3.0 when fragmented from
15 MPa (except experiments 9 and 22). This suggests that dense material (porosity<50 vol%)
does not fragment finely under rapid decompression up to 15 MPa. Vesicular material
(porosity>50 vol%) only fragments into fine particles at high decompressions (>15 MPa).
Kaminski and Jaupart [27] used D<3.0 to argue for primary fragmentation (a single event)
and D>3.0 for secondary fragmentation (such as repeat fragment collisions). They performed
experiments by hitting pumices with a hammer, where the size and the number of the
fragments produced depend on the energy input (at small energy input, only small pieces at
the surface of the sample can be broken). In contrary, the spallation fragmentation always
concerns the whole sample, as the over-pressurized layer of bubbles bursting into the free
surface exposes the next layer to fragmentation. Two hypotheses can be proposed for D>3.0
in our experiments, depending on how the physic of the fragmentation mechanisms compares
with the experiments of [27]: primary break-up in a context of spallation fragmentation if the
processes do not compare or secondary fragmentation of highly vesiculated melts (<50 vol%)
decompressed from 15 MPa (evidence for secondary fragmentation is however not supported
by any peculiarities of the fragment shape or texture).
The pressure effect on the FSDs of vesicular samples (porosity>50 vol%) was further
investigated by comparing experiments where starting material have comparable pre-
fragmentation physical properties. Fig. 4a shows that the higher the decompression, the finer
the particles. The correlation between pressure and fragment size suggests a fragment size
decrease of 0.2 Φ unit/MPa. Higher decompressions indeed involve larger released energy
applying on any flaws and heterogeneities of the sample through which failure will be
initiated. Fig. 4b shows the effect of the pore shape on the FSDs, suggesting that tube pumices
are generally more finely fragmented than samples with isotropic pores. This could reflect the
low strength of a material containing tube pores due to thin walls in between the tubes. The
effect of the melt viscosity on FSD is not straightforward and would require further
systematic investigations to be determined.
5.2.4. Applicability to dome explosions
Our experimental device generating fragmentation by rapid decompression best simulates
dome explosions, consequently to a destabilization (e.g. landslide) whereby the underlying
pressurized magma is suddenly exposed to much lower pressures. Melnik and Sparks [28]
have recently theoretically demonstrated that ground deformation patterns or vulcanian
eruptions observed in Soufriere Hills dome (Montserrat) [29] could be attributed to
pressurization at shallow levels (upper part of the conduit) rather than in the deep magma
chamber. Our experiments are consistent with this model, by showing that small
overpressures (less than 20 MPa) can lead to magma fragmentation when rapidly
decompressed. In addition, we suggest that the magnitude of the decompression is a parameter
much more efficient in dome explosions than melt porosity, bubble shape or melt viscosity of
the pre-fragmented magma. However, our starting samples are crystal-free, thus having

physical properties, which do not match those of magmas in common domes. Experimental
investigation using crystal-bearing samples is in progress.
Table 1. Experimental conditions
Expt. No. Starting glass cylinders Nucleation conditions Fragment characteristics
a Pinib Weight T Pc t Cwcalc
d Cwfine αcalc
f αmeas Log ηini−Log ηfing Log ηα
h
(wt%) (MPa) (g) (°C) (MPa) (min) (wt%) (wt%) (vol%) (vol%) (Pa s) (Pa s)
27 0° 0.1 6.166 900 10 1 0.0 0.00 I 0 4±1 12.4–12.4 –
18 1.4–1.4 11 0.110* 800 4(6.3) 30 0.9 – 58±2 64±5 6.9–7.5 8.6
5 1.4–1.4 11 0.717° 800 4.5(6.5) 30 1.0 1.0 I 49±2 61±5 6.9–7.4 8.4
8 1.4–1.4° 11 7.560 900 5(7.3) 30 1.0 0.7 K 63±2 61±5 5.8–6.7 7.7
20 1.5–1.6 14 1.128° 760 5(6.4) 30 1.0 – 52±3 58±5 7.2–7.9 8.8
11 1.6–1.7° 16 2.459° 784 5(7.6) 30 1.0 1.3 K 44±3 45±3 6.8–7.2 7.9
10 1.7–1.8 18 2.571° 900 10(∼12) 30 1.4 – 32±3 42±3 5.5–5.8 6.5
2 1.4–1.4 11 0.193° 900 10 60 1.4 1.2 I 19±2 23±3 5.8–6.0 –
28 1.5–1.5° 13 7.367 ∼360 10 1 1.5 – 0 <1 12.4–12.4 12.4
16 2.6–2.6 42 7.335 750 5(8.8) 30 1.0 1.0 K 77±2 74±8 6.5–8.1 9.4
13 2.4–2.4° 36 0.850° 750 5(8.2) 30 1.0 1.0 K 75±2 71±8 6.6–8.1 9.3
7 2.0–2.2 26 7.692 800 10(11.1) 25 1.4 1.3 K 46±4 62±5 6.3–7.0 8.0
17 2.1–2.4 31 1.335° 750 10(11.1) 30 1.5 1.8 K 32±5 43±3 6.7–7.1 7.7
25 2.5° 38 7.309 630 15 1 2.5 2.4 I 5±1 12±3 8.2–8.3 8.3
9 3.2–3.2° 66 7.750 900 10(12) 30 1.4 1.4 K 68±2 72±8 4.7–5.8 7.1
29 3.3–3.4° 75 1.183° 800 10 25 1.4 1.5 I 67±3 62±5 5.5–6.8 7.8
22 3.7–3.9° 97 7.178 750 10(11.2) 30 1.4 1.2 K 73±4 62±5 5.8–7.8 8.8
24 3.9–3.9° 102 6.092 900 15(17.3) 30 1.6 1.2 K 68±2 70±8 4.4–6.0 7.3
14 3.9–3.9° 102 7.508 822 18 1 1.8 1.4 K 60±2 61±5 5.0–6.6 7.6
19 4.4–4.6 143 0.154° 800 4(6.6) 30 0.9 – 91±4 – 5.0–7.5 –
1 4.4–4.6 143 0.090° 900 10 60 1.4 1.2 K 80±4 83±8 4.2–6.0 –
6 4.4–4.6 143 0.885° 755 15(15.3) 5 1.8 1.8 K 65±4 52±5 5.4–7.0 7.8
23 4.3–4.7° 140 7.622 750 15 30 1.8 1.5 K 68±6 61±5 5.5–7.4 8.4
21 5.6–5.8 234 1.312° 900 15(15.3) 30 16 1.6 K 80±4 83±8 3.8–5.7 9.1
A : Water content at each end of the starting glass cylinder measured by infrared spectroscopy, except for
experiments 9 and 10, for which the second value was obtained by Karl–Fischer titration. Analytical errors of ∼0.2
wt%.
° : Starting glasses with bubbles (<3 vol%, diameter of ∼50 μm), except for experiments 23 (diameter up to 150
μm) and 24 (11 vol%, diameter up to 150 μm).
B : Solubility pressure calculated after [11] corresponding to Cwini. Pini-P gives the supersaturation pressure for
vesiculation.
* : or 8 mm diameter samples.
C : Pressure of the HPT section. Number in bracket gives bursting pressure for the single diaphragm experiment
(see text for details).
D : At P, after [11].
E : Glass water content of the fragments measured by Karl–Fischer titration (K) or infrared spectroscopy (I).
F : Vesicularity (α) calculated after [12]: α=(1+ρw/((Cwini−Cwfin)ρm))−1, where ρw is the water density [13], ρm the
melt density of the starting hydrated HPG8 glasses (bubble-free) by the double-weight method in air and ethanol
(Mettler Toledo AG204). As this yields a glass density (∼2.338 g/cm3 for 1 wt% H2O), we subtracted the density
difference (i.e. 0.032 g/cm3) obtained by [14] between HPG8 glass at 20°C and melt at 900°C.
G : Melt viscosity calculated after [15] for average Cwini and Cwfin at T.
H : Bubbly-melt viscosity calculated after [16], for highly concentrated suspensions (Phimax=85), considering a
rigid behavior of the pores under the 10−3 s decompression time.

Fig. 1. Measured versus calculated vesicularity. Labels represent the experiment number (° for bubble-
bearing starting samples as reported in Table 1). Error bars on measured vesicularities are determined
from repeated measurements by image analysis. Error bars on the calculated vesicularities are ±2 vol%
plus the water content difference between both ends of the starting glass cylinders (see Table 1).

Fig. 2. SEM images showing the pore and fragment morphologies. (a) Experiment 10, (b) experiment
8, (c) experiment 6, (d) experiment 14, (e) experiment 23 and (f) experiment 21.

Table 2. Size distributions of bubbles and fragments
Expt
. No. P
Fragmen
t weight
Porosity
, α
Bubble size distribution
(diameter in μm)
Fragment size distribution (Φ
unit=−log2d in mm)
(MPa
) (g) (vol%)
Main
mode
(averag
e
bubble
size)
Second
mode
Total
rang
e
Averag
e
bubble
size
labela
Total
range
Mean
diamete
r
Median
diamete
r
Db
27° 10 – 4±1 7±1 – 0–25 10 – – – –
18 4 – 64±5 40±10 – 11–
102 50 – – – –
5 4.5 0.129 61±5 ∼50 – 5–
100 T50
−1.0/4.
0 0.46 0.26
2.
3
8° 5 7.146 61±1 40±10 ∼100 35–
442 50
−2.5/4.
5 0.32 0.27
2.
1
20 5 – 58±5 2±1 – 1–6 10 – – – –
11° 5 – 45±3 2.5±0.5 – 1–11 10 – – – –
10 10 – 42±3 10±4 – 4–32 10 – – – –
2 10 – 23±3 38±3 – 33–
71 50 – – – –
28° 10 7.097 <1 33±3 – 0–90 50 −2.5/4.
5 −0.37 −0.41
2.
1
16 5 5.252 74±8 90±40 275±2
5
33–
719 T100
−2.0/4.
5 1.22 1.05
2.
8
13° 5 0.179 71+8 ∼10 – 1–50 10 −1.5/4.
0 −0.68 −0.57
2.
2
7 10 4.958 62±15 – 33–
274 T50
−2.0/4.
5 1.39 1.29 2.7
17 10 1.159 43±3 5±1 – 1.4–
9 10
−1.5/4.
0 0.86 0.77
2.
1
25° 15 6.836 12±3 40±10 – 34–
206 50
−2.5/4.
5 −0.58 −0.66
2.
0
9° 10 5.546 72±8 200±80 – 35–
442 T100
−1.0/4.
5 2.00 1.96
3.
3
29° 10 0.073 62±5 50±20 175±2
5
32–
728 50
−0.5/4.
0 1.22 1.05
2.
5
22° 10 5.234 62±5 70±10 30±10 15–
177 T50
−1.0/4.
5 2.10 2.07
3.
3
24° 15 4.793 70±8 125±25 270±2
5
27–
468 100
−0.5/4.
5 2.26 2.26
3.
9
14° 18 6.036 61±5 50±10 110±5 23–
194 T50
−0.5/4.
5 2.41 2.37
4.
1
19 4 – – – – – – – – – –
1 10 – 83±8 100±20 215±1
5
33–
270 T100 – – – –
6 15 0.290 52±5 ∼40 – 10–
100 T50
−0.5/4.
5 2.16 2.21
3.
5

23° 15 5.576 61±5 70±10 ∼250 23–
348 T50
−1.0/4.
5 2.09 2.06
3.
3
21 15 0.497 83±8 2.5±1 9.5±0.
5 1–11 10
−1.5/4.
5 1.70 1.65
3.
1
° For bubble-bearing starting material.
a
10 for average bubble size (aBS) between 1 and 25 μm, 50 for aBS between 25, 75 μm and
100 for aBS above 75 μm and T for tubes.
b
Power-law exponent.
Fig. 3. Parameters controlling the FSD: porosity and pressure effects on the power-law exponent D
determined by the slopes of the best fit of the data in the inset. This diagram compares the fragment
size distributions with the power-law distribution given by log2(N)=r−D
, where N is the number of
fragments with radii larger than r. The fragment number was determined by dividing the total
fragment mass in each sieve (only the 0–4 Φ unit range is shown, where all experiments can be
compared) by the mass of a single fragment (volume of a sphere corresponding to the sieve mesh time
the glass density corrected by the porosity α given in Table 1).
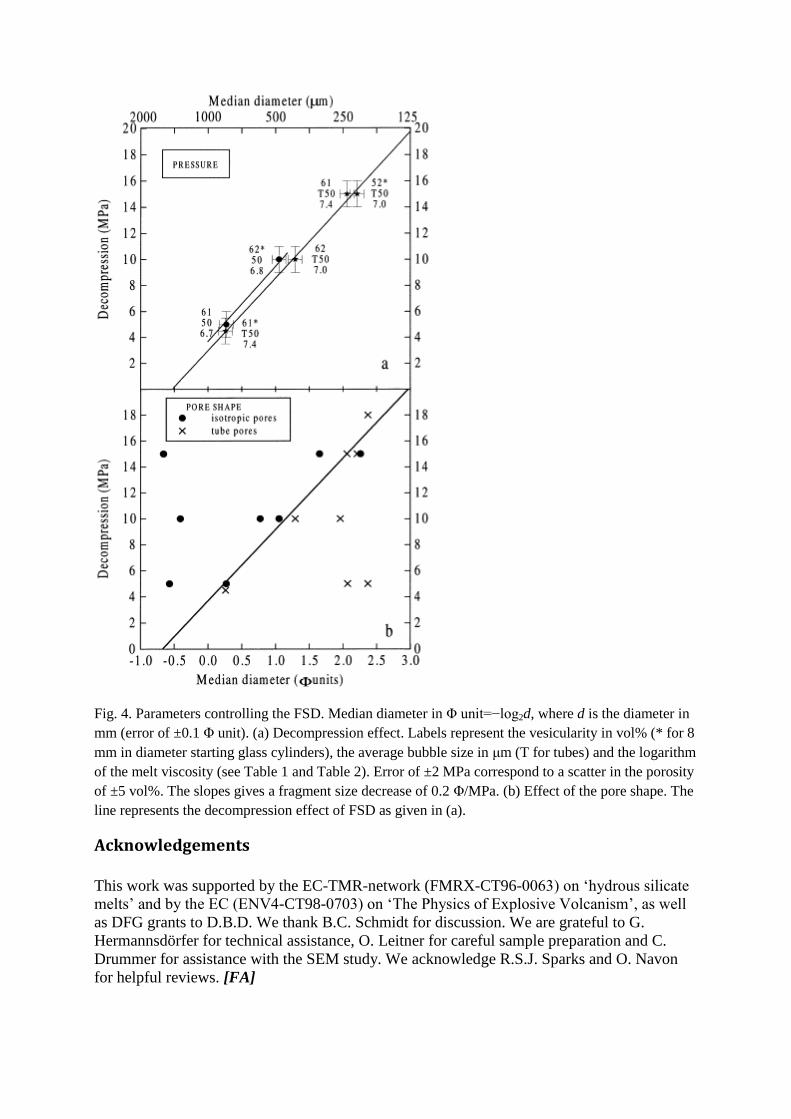
Fig. 4. Parameters controlling the FSD. Median diameter in Φ unit=−log2d, where d is the diameter in
mm (error of ±0.1 Φ unit). (a) Decompression effect. Labels represent the vesicularity in vol% (* for 8
mm in diameter starting glass cylinders), the average bubble size in μm (T for tubes) and the logarithm
of the melt viscosity (see Table 1 and Table 2). Error of ±2 MPa correspond to a scatter in the porosity
of ±5 vol%. The slopes gives a fragment size decrease of 0.2 Φ/MPa. (b) Effect of the pore shape. The
line represents the decompression effect of FSD as given in (a).
Acknowledgements
This work was supported by the EC-TMR-network (FMRX-CT96-0063) on ‘hydrous silicate
melts’ and by the EC (ENV4-CT98-0703) on ‘The Physics of Explosive Volcanism’, as well
as DFG grants to D.B.D. We thank B.C. Schmidt for discussion. We are grateful to G.
Hermannsdörfer for technical assistance, O. Leitner for careful sample preparation and C.
Drummer for assistance with the SEM study. We acknowledge R.S.J. Sparks and O. Navon
for helpful reviews. [FA]

References
D.B. Dingwell, Magma degassing and fragmentation: recent experimental advances, in: A. Freundt, M. Rosi (Eds.), From Magma to Tephra; Modeling Physical Processes of Explosive Volcanic Eruptions, 1998, pp. 1–23.
D.B. Dingwell, Recent experimental progress in the physical description of silicic magma relevant to explosive volcanism, in: J.S. Gilbert, R.S.J. Sparks (Eds.), The Physics of Explosive Volcanic Eruptions, Geol. Soc. London Spec. Publ. 145, 1998, pp. 9–26.
H.M Mader, J.C Phillips, R.S.J Sparks, B Sturtevant
Dynamics of explosive degassing of magma: observations of fragmenting two-
phase flows
J. Geophys. Res., 101 (1996), pp. 5547–5560 M Alidibirov
A model for viscous magma fragmentation during volcanic blasts
Bull. Volcanol., 56 (1994), pp. 459–465 P Papale
Strain-induced magma fragmentation in explosive eruptions
Nature, 397 (1999), pp. 425–42
H.M Mader, Y Zhang, J.C Phillips, R.S.J Sparks, B Sturtevant, E Stolper
Experimental simulations of explosive degassing of magma
Nature, 372 (1994), pp. 85–88
R.S.J. Sparks, J. Barclay, C. Jaupart, H.M. Mader, J.C. Phillips, Physical aspects of magmatic degassing I. Experimental and theoretical constraints on vesiculation, in: M.R. Carroll, J.R. Holloway (Eds.), Volatiles in Magmas, Reviews in Mineralogy 30, Mineral. Soc. Am., 1994, pp. 413–445.
Y Zhang, B Sturtevant, E.M Stolper
Dynamics of gas-driven eruptions: experimental simulations using CO2-H2O-
polymer system
J. Geophys. Res., 102 (1997), pp. 3077–3096 M Alidibirov, D.B Dingwell Magma fragmentation by rapid decompression
Nature, 380 (1996), pp. 146–148 M Alidibirov, D.B Dingwell
An experimental facility for the investigation of magma fragmentation by rapid
decompression
Bull. Volcanol., 58 (1996), pp. 411–416
C.W. Burnham, Development of the Burnham model for prediction of H2O solubility in magmas, in: M.R. Carroll, J.R. Holloway (Eds.), Volatiles in Magmas, Reviews in Mineralogy 30, Mineral. Soc. Am., 1994, pp. 123–129.

C. Jaupart, S. Tait, Dynamics of eruptive phenomena, in: J. Nicholls, J.K. Russell (Eds.), Modern Methods of Igneous petrology: Understanding Magmatic Processes, Reviews in Mineralogy 24, Mineral. Soc. Am., 1989, pp. 213–238.
A Saul, W Wagner
A fundamental equation for water covering the range from the melting line to 1273
K at pressures up to 25 000 MPa
J. Phys. Chem., 18 (1989), pp. 1537–1565 R Knoche, D.B Dingwell, S.L Webb Melt densities for leucogranites and granitic pegmatites: partial molar volumes for
SiO2, Al2O3, Na2O, K2O, Li2O, Rb2O, Cs2O, MgO, CaO, SrO, BaO, B2O3, P2O5,
F2O-1, TiO2, Nb2O5, Ta2O5 and WO3
Geochim. Cosmochim. Acta, 59 (1995), pp. 4645–4652 K.U Hess, D.B Dingwell
Viscosities of hydrous leucogranitic melts: non-arrhenian model
Am. Miner., 81 (1996), pp. 1297–1300 N.A Frankel, A Acrivos
The constitutive equation for emulsion
J. Fluid Mech., 44 (1970), pp. 65–78 M Nowak, H Behrens
The speciation of water in haplogranitic glasses and melts determined by in situ
near-infrared spectroscopy
Geochim. Cosmochim. Acta, 59 (1995), pp. 3445–3450 R.L Folk, W.C Ward
Brazos River bar: a study in the significance of grain size parameters
J. Sedim. Petrol., 27 (1957), pp. 3–26
O. Navon, V. Lyakhovsky, Vesiculation processes in silicic magmas, in: J.S. Gilbert, R.S.J. Sparks (Eds.), The Physics of Explosive Volcanic Eruptions, Geological Society, London, Spec. Publ. 145, 1998, pp. 27–50.
D.J Stein, F.J Spera Rheology and microstructure of magmatic emulsions: theory and experiments
J. Volcanol. Geotherm. Res., 49 (1992), pp. 157–174
K.V. Cashman, M.T. Mangan, Physical aspects of magmatic degassing II. Constraints on vesiculation processes from textural studies of eruptive products, in: M.R. Carroll, J.R. Holloway (Eds.), Volatiles in Magmas, Reviews in Mineralogy 30, Mineral. Soc. Am., 1994, pp. 447–478.
N.S Bagdassarov, A Dorfman, D.B Dingwell
Effect of alkalis, phosphorus and water on surface tension of haplogranite melt
Am. Miner., 85 (1999), pp. 33–40

M Alidibirov, V Panov
Magma fragmentation dynamics: experiments with analogue porous low-strength
material
Bull. Volcanol., 59 (1998), pp. 481–489
M. Alidibirov, D.B. Dingwell, Three fragmentation mechanisms for highly viscous magma under rapid decompression, J. Volcanol. Geotherm. Res., in press.
S. Redner, Fragmentation, in: H.J. Herrmann, S. Roux (Eds.), Random Material and Processes, Statistical Models for the Fracture of Disordered Media, North-Holland, New York, 1990, pp. 321–348.
M Alidibirov, D.B Dingwell, R.J Stevenson, K.U Hess, S.L Webb, J Zinke
Physical properties of the 1980 Mount St. Helens cryptodome magma
Bull. Volcanol., 59 (1997), pp. 103–111 E Kaminski, C Jaupart
The size distribution of pyroclasts and the fragmentation sequence in explosive
volcanic eruptions
J. Geophys. Res., 103 (1998), pp. 29759–29779 O Melnik, R.S.J Sparks
Nonlinear dynamics of lava dome extrusion
Nature, 402 (1999), pp. 37–41 B Voight et al.
Magma flow instability and cyclic activity at Soufriere Hills Volcano, Montserrat,
B.W.I.
Science, 283 (1999), pp. 1138–1142