Embed Size (px)
Citation preview
©2019 Journal of Communications 402
Fragmentation of Production: New Challenges for Big
Data–A Complex Network Approach
Giulia De Masi1 and Giorgio Ricchiuti 2 1 Zayed University, Dubai, UAE
2 Università degli Studi di Firenze, Complexity Lab for Economics, Florence, Italy
Email: [email protected], [email protected]
Abstract—Globalization is one of the most relevant economic
phenomena of the last decades. Due to this reason, the
economies of different countries are strongly interconnected.
This may lead to higher robustness or higher vulnerability of the
whole economic system, depending on the economic scenario.
Traditional models are unable to represent the complex
relationship among firms. This may lead to a misunderstanding
of the complex interconnections between countries,
underestimating vulnerability of the world economic system. In
this framework, a complex network approach, based on graph
theory, is a valuable tool to outline the interdependencies of
different countries and their impact on the stability of the whole
economic system. Nowadays economic Big Data are available
on globalization, helping to have a rigorous approach when
shading light on these interdependencies. In this paper, the
complex network analysis is applied on a particular shade of
globalization, namely fragmentation of production.
Index Terms-Complex networks; big data; foreign direct
investments
I. INTRODUCTION
In the last decades, one of the main emerging economic
phenomena has been fragmentation of production (the so
called globalization) driven by rapidly growing World
Wide Web and intercontinental transportation easiness.
Globalization has been a relevant opportunity, allowing
economic growth toward new markets of enterprises
before working only at local/national level. On the other
hand, the main risk of global interconnections is related to
economic crisis spreading from one country to another
trough the complex set of economic interdependencies.
The larger number of firms engaged in international
activities such as exports, FDI and global outsourcing
shows that there is a strong heterogeneity in
internationally oriented strategies. At the same time, these
strategies are strictly connected. This deserves a detailed
analysis to better guide the development of the next
strategies. It is evident that economic systems have to be
represented considering this complex set of connections.
Fortunately, nowadays, large databases of economic data
(ultimately economic Big Data) are available. For this
reason, methods from Big Data literature are applied also
Manuscript received August 25, 2018; revised April 9, 2019.
doi:10.12720/jcm.14.5.402-407
to economic field [1]. Traditional statistics, based on
characteristic measurements (like distributions, with their
average quantities and their standard deviations), as well
as techniques from Machine Learning (like neural
networks as other supervised learning algorithms, decision
trees and Bayesian statistics) are not enough to investigate
a highly interconnected economic system, that can be
affected much more severely by internal interconnections
than by the behavior of single individuals. Other
instruments are necessary. In order to represent and
analyze these linkages, it is particularly useful a modeling
approach based on complex networks [2]. This approach
is scalable and therefore can be extended to big global
databases.
Mainstream Economics usually neglect the role of
heterogeneity between agents (firms) and their complex
interconnections. Only recently some interest rose up on
the role of heterogeneity with the decision to export
and/or to fragment the production investing in abroad. The
network representation allows to identify the role of
heterogeneity in order to better understand the long-run
economic trend and properly design policy strategies to
limit the possible adverse effects on the economic system,
particularly in terms of employment.
Complex Network theory is a relatively new field,
borderline between different disciplines: particularly
Statistical Physics, Mathematics (Graph Theory) and
Statistics. In the last decade, it has been set up as a
cutting-edge research field in various disciplines of
natural sciences (Physics and Biology) and Social
Sciences [3]. Networks allow to detect the links and their
evolution between different individuals / agents /
businesses. In particular, several studies have been carried
out to understand the mechanisms underlying
communication networks: Internet, World Wide Web
(WWW) and e-mail networks. These communication
networks are a mirror of the underlying social network,
composed of a group of agents who collaborate and
compete with each other, gaining mutual benefits from
interaction. This approach is promising for the study of
economic systems, in which businesses, families,
individuals, the State actively interact and shape
seamlessly socio-economic structures. The study of
Journal of Communications Vol. 14, No. 5, May 2019
©2019 Journal of Communications 403
networks is able to reproduce with simple, stylized and
meaningful models both stationary and dynamic systems.
The complex network theory, whose mathematical
formulation is based on the most well-established theory
of graphs, has only recently been applied to Economics
[4], allowing to identify and evaluate the structures
underlying the relationships between different economic
units. Moreover, it allows studying effects that cannot be
captured with simple descriptive statistics. Empirical use
is mostly related to the structure of the interbank market
[5], bank-firm credit market [6], [7], financial market
investments [8] and the world trade network [9]. Finally,
in literature few studies can be found of the network
structure of FDI at global level. The network of the top
100 global multinational and ownership linkages in more
than 2000 cities worldwide has been analyzed
distinguishing between all industrial sectors and producer
service sector [10]. More recently, a worldwide database
of multinationals has been analyzed using measurements
of network density to study agglomeration phenomena
[11]. Relatively to European countries, network based
analyses have been done on Italian foreign investment
data [12] and on French data [13]. Specifically, De Masi
et al. [11] reconstruct the network of Italian firms that
invest abroad, showing that even within the same sector,
firms can adopt different strategies: horizontal FDI are
done by firms that use middle-large countries (Brazil) as a
productive platform to export in neighboring through
commercial affiliates (the rest of Latin America countries);
other firms are global players (vertical FDI), and their
production is carried out for cost-saving reasons (in the
textile sector), and/or in search of professional skills (if
there are machinery producers); finally, they show that
there is a strong complementarity between FDI and
exports because most of Italian FDIs present commercial
purposes. Similarly to [14], in this paper, we reconstruct
the network of the European (EU28) firms investing
abroad in order to shed light on the role of heterogeneity
in the big database of European Foreign Direct
Investments. A bipartite network is defined where nodes
are investors and their countries of investment. Here the
objective of the paper is to identify if investors share
similar strategies (in particular which countries they
choose to invest) and if more than one strategy emerge
within the same economic sector. To this aim, Network
analysis is particularly useful, because it allows to
represent common investing behavior of firms. In this
paper, we assume that if firms have in common both the
sector of the parent company and the country of
destination, they adopt the same internationalization
strategy for foreign direct investment. In particular, we
focus on the analysis of sub-structures within the network.
The community detection inside the sectoral network
allows to investigate the aggregated behavior of subsets of
investors and common investment strategies shared within
a group of investors, differently from other groups. The
analysis is carried out highlighting, at a particular sector
level (Industrial Machinery), the evolution of network's
structure and sub-structures, looking to 2003 and 2015
(first and last years of the available dataset), in terms of
both countries of destination and activities of the main
nodes. The globalization effect is very relevant as evident
from the analysis of the two projected networks.
II. METHODOLOGY
Network analysis allows investigating the topological
properties of the complex structure of economic
relationships. A network is represented as graph, which is
a set of nodes and links.
From a mathematical point of view, a network is
represented by an adjacency matrix. The element of the
adjacency matrix aij indicates that a link exists between
nodes i and j.
A. Bipartite Network
In this paper, a bipartite network is defined. A network
is called bipartite when two kinds of nodes are present, in
our case investing firms and countries. From a
mathematical perspective, distinguishing two kinds of
nodes, namely C (countries) and I (investors), the graph
G{C+I}, with a total set of nodes (C+I) is defined. A link
is drawn if a firm invests in a specific host country,
therefore aij =1 if investor i goes to country j; otherwise aij
=0.
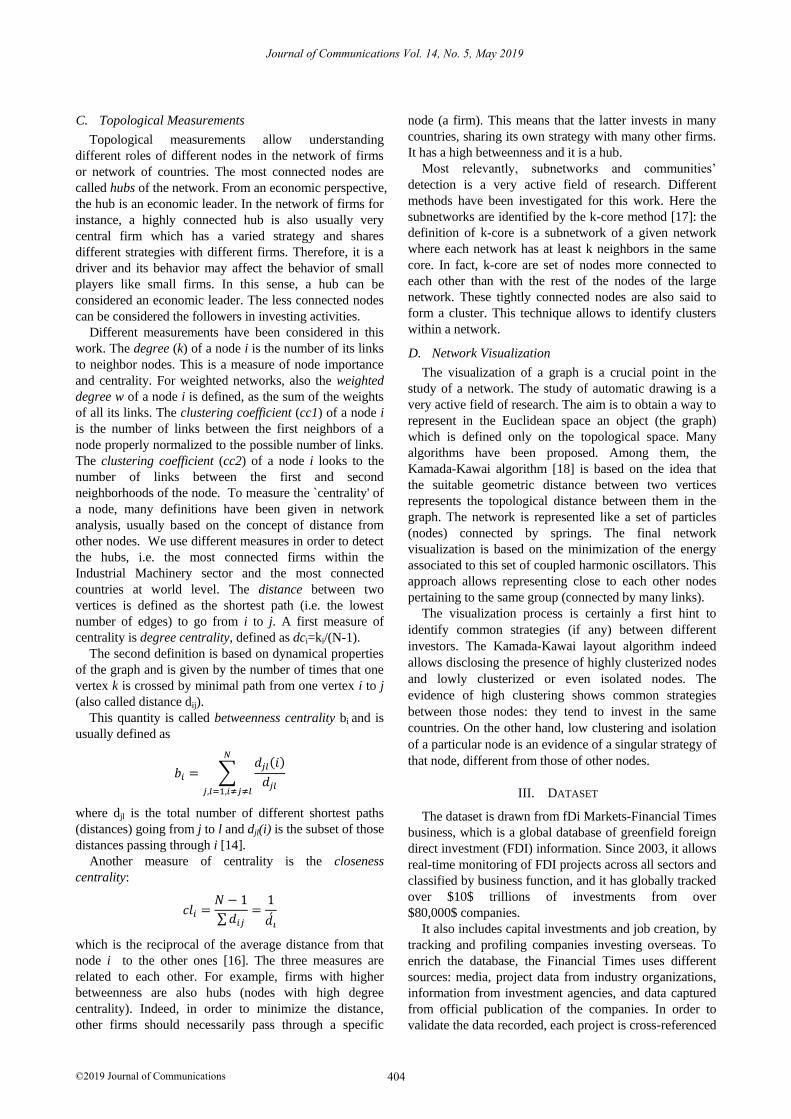
As an example, a simplified example of a bipartite
network of countries and firms is plotted in Fig.1.
Fig 1. Bipartition process. Top panel: bipartite graph, considering the
set of investors (circles) I={1,2,3,4} and countries C={a,b,c,d,e,f}
(squares). Bottom panel: corresponding projected graph on firm space.
B. Projected network
In the study of bipartite graph, a widely used approach
is to study separately two networks defined from the
original one. In particular, we extract from the overall
graph two graphs, each one composed by just one kind of
nodes. These two networks are called projected networks,
in the sense that they are obtained as a projection of the
initial graph in the subspace composed by nodes only of
the same kind.
Two new networks are defined, GC and GI, which have
only nodes of kind C (countries) or I (investors)
respectively.
In Fig. 1, starting from the bipartite network in the left
panel, the network projected into the subspace of firms is
plotted in the right panel.
In fact, we define weighted networks: the weight of the
link between two countries represents the number of firms
investing on both of them. On the other hand, the weight
of the link between two firms represents the number of
common countries they choose.
Journal of Communications Vol. 14, No. 5, May 2019
©2019 Journal of Communications 404
C. Topological Measurements
Topological measurements allow understanding
different roles of different nodes in the network of firms
or network of countries. The most connected nodes are
called hubs of the network. From an economic perspective,
the hub is an economic leader. In the network of firms for
instance, a highly connected hub is also usually very
central firm which has a varied strategy and shares
different strategies with different firms. Therefore, it is a
driver and its behavior may affect the behavior of small
players like small firms. In this sense, a hub can be
considered an economic leader. The less connected nodes
can be considered the followers in investing activities.
Different measurements have been considered in this
work. The degree (k) of a node i is the number of its links
to neighbor nodes. This is a measure of node importance
and centrality. For weighted networks, also the weighted
degree w of a node i is defined, as the sum of the weights
of all its links. The clustering coefficient (cc1) of a node i
is the number of links between the first neighbors of a
node properly normalized to the possible number of links.
The clustering coefficient (cc2) of a node i looks to the
number of links between the first and second
neighborhoods of the node. To measure the `centrality' of
a node, many definitions have been given in network
analysis, usually based on the concept of distance from
other nodes. We use different measures in order to detect
the hubs, i.e. the most connected firms within the
Industrial Machinery sector and the most connected
countries at world level. The distance between two
vertices is defined as the shortest path (i.e. the lowest
number of edges) to go from i to j. A first measure of
centrality is degree centrality, defined as dci=ki/(N-1).
The second definition is based on dynamical properties
of the graph and is given by the number of times that one
vertex k is crossed by minimal path from one vertex i to j
(also called distance dij).
This quantity is called betweenness centrality bi and is
usually defined as
𝑏𝑖 = ∑𝑑𝑗𝑙(𝑖)
𝑑𝑗𝑙
𝑁
𝑗,𝑙=1,𝑖≠𝑗≠𝑙
where djl is the total number of different shortest paths
(distances) going from j to l and djl(i) is the subset of those
distances passing through i [14].
Another measure of centrality is the closeness
centrality:
𝑐𝑙𝑖 =𝑁 − 1
∑𝑑𝑖𝑗=
1
𝑑𝑖´
which is the reciprocal of the average distance from that
node i to the other ones [16]. The three measures are
related to each other. For example, firms with higher
betweenness are also hubs (nodes with high degree
centrality). Indeed, in order to minimize the distance,
other firms should necessarily pass through a specific
node (a firm). This means that the latter invests in many
countries, sharing its own strategy with many other firms.
It has a high betweenness and it is a hub.
Most relevantly, subnetworks and communities’
detection is a very active field of research. Different
methods have been investigated for this work. Here the
subnetworks are identified by the k-core method [17]: the
definition of k-core is a subnetwork of a given network
where each network has at least k neighbors in the same
core. In fact, k-core are set of nodes more connected to
each other than with the rest of the nodes of the large
network. These tightly connected nodes are also said to
form a cluster. This technique allows to identify clusters
within a network.
D. Network Visualization
The visualization of a graph is a crucial point in the
study of a network. The study of automatic drawing is a
very active field of research. The aim is to obtain a way to
represent in the Euclidean space an object (the graph)
which is defined only on the topological space. Many
algorithms have been proposed. Among them, the
Kamada-Kawai algorithm [18] is based on the idea that
the suitable geometric distance between two vertices
represents the topological distance between them in the
graph. The network is represented like a set of particles
(nodes) connected by springs. The final network
visualization is based on the minimization of the energy
associated to this set of coupled harmonic oscillators. This
approach allows representing close to each other nodes
pertaining to the same group (connected by many links).
The visualization process is certainly a first hint to
identify common strategies (if any) between different
investors. The Kamada-Kawai layout algorithm indeed
allows disclosing the presence of highly clusterized nodes
and lowly clusterized or even isolated nodes. The
evidence of high clustering shows common strategies
between those nodes: they tend to invest in the same
countries. On the other hand, low clustering and isolation
of a particular node is an evidence of a singular strategy of
that node, different from those of other nodes.
III. DATASET
The dataset is drawn from fDi Markets-Financial Times
business, which is a global database of greenfield foreign
direct investment (FDI) information. Since 2003, it allows
real-time monitoring of FDI projects across all sectors and
classified by business function, and it has globally tracked
over $10$ trillions of investments from over
$80,000$ companies.
It also includes capital investments and job creation, by
tracking and profiling companies investing overseas. To
enrich the database, the Financial Times uses different
sources: media, project data from industry organizations,
information from investment agencies, and data captured
from official publication of the companies. In order to
validate the data recorded, each project is cross-referenced
Journal of Communications Vol. 14, No. 5, May 2019

©2019 Journal of Communications 405
through multiple sources. Different scholars have already
employed data on FDi markets, to our knowledge none of
them have reconstructed a network of European FDI. For
the purpose of this paper, our database comprises outward
FDI from each of EU28 (countries of origin) to the rest of
the world. Therefore, the countries of destination may be
also within the EU28 itself. We employ only data for 2003
and 2015 in order to compare the possible change of the
FDI-network, due to the crises. While a comparison
between different sectors is under study, in this paper we
focus on Industrial Machinery sector. This sector presents
the largest number of investing and affiliated companies.
Moreover, this number increases between the two periods,
both investors and affiliates triple in the period from 2003
to 2015, showing a very strong effect of globalization.
IV. RESULTS
In order to define the network, a bipartite graph has
been generated, where the nodes are both investors and
host countries, and a link is drawn if a parent company
invests in a certain host country. Projecting the links on
two subspaces, two new projected networks are obtained:
the network of investors, and the network of countries.
Fig. 2. Projected network on country space (year 2003)
In Fig. 2 and Fig. 3, the country networks for year 2003
and 2015 are reported respectively. It is very evident the
large increase of number of countries of investment. This
may be due to several factors, especially integration of EU
countries and enlargement to the Eastern Europe countries
of 2004 and 2007, driving further foreign direct
investments also towards new countries.
Fig. 3. Projected network on Country space (year 2015)
Main hubs are almost the same, namely China, USA,
India, but several new countries appear from far East,
Arabian countries and Africa. Two interesting trends can
be glimpsed: on the one hand, there is a lower presence of
Eastern European countries replaced by new countries of
destination (India, Turkey for example), on the other there
is an increase in projects in the key hubs of EU28. Rather
than cost reduction, companies in the mechanical industry
seem to be interested in workers' skills and the
concentration of specific region of production within the
same union. This could support the so-called phenomenon
of near-shoring, that is the tendency to expand business in
nearby countries, more than to far away countries. More
in-depth response may be given by the analysis of the
evolution of the network that will be done in a future work.
TABLE I. TOPOLOGICAL MEASUREMENTS FOR INVESTOR NETWORK
Year
2003 2015
Investors 101 323
Countries 23 67
k 0.7 2.2
w 6.1 1.3
cc1 6.7 6.6
cc2 1.5 4.2
b 6.3 8.7
cl 3.9 2.0
In Table I the comparison of the most relevant above
described topological measurements on investor networks
between the two selected years (2003 and 2015) are
reported. The total number of investors and countries of
investment is tripled. The average degree (k) reproduces
this trend. The weighted degree (w) on the contrary shows
a strong decrease, disclosing a tendency to differentiate
the investments. This may be a response to the crisis:
more fragmentation of production to diversify the risk and
reorganize the production.
The two clustering coefficients have a different trend as
can be easily explained. cc1 (measuring the links between
the first neighbors) is almost constant; cc2 (considering
links between both first and second neighbors) is strongly
increasing in 2015 due to the emergence of few large
clusters. This is evident from Fig. 4 and Fig. 5 that show
the investor networks relatively to the year 2003 and 2015
respectively.
Fig. 4. Projected network on Investor space (year 2003)
A very relevant change of the structure emerges. While
the number of investors is lower in 2003 and also forming
clusters quite disconnected, in 2015 the number of
investors strongly increase and they are tightly connected
disclosing five large clusters.
Journal of Communications Vol. 14, No. 5, May 2019

©2019 Journal of Communications 406
Fig. 5. Projected network on Investor space (year 2015)
Their maximum degree is really high (38 in 2003 and
146 in 2015) as well as their betweenness, indicating the
tendency of these firms to invest worldwide. Moreover,
sector leaders produce mechanical and electronic
components and their projects are mainly related with
manufacturing products, which have an intrinsic global
spreading. Even if the identity of firms cannot be
disclosed, each cluster is formed around a big firm (we
can say a sector leader).
The projected network of companies reinforces what
has already been seen for the destination countries. We
have moved from a fairly disconnected network to a very
connected one but with emerging clusters. These clusters
are well identified by the k-core method. In Fig. 4 and Fig.
5 each cluster is identified by a different color. The
clusters are quite well defined both for 2003 and 2015. In
this sense the methodology proved to be very effective.
This evidence of emerging clusters discloses a
convergence in the strategies adopted by the companies in
the sector that are concentrated in the same production
regions. At a preliminary analysis, we can say that there is
a convergence in the strategies adopted that primarily
concern the identified markets. We also emphasize that
cost reduction does not seem to be the main reason for
these investments.
V. CONCLUSIONS
In this paper the problem of fragmentation of
production, one of the main emerging economic
phenomena of last years, has been studied. Big data are
nowadays available in order to study the investments of
single firms in worldwide countries. Traditional analyses
based on statistical distributions and their parameters as
well as methods from Machine Learning and Big Data
analysis are not enough to highlight the role of
heterogeneity and to enhance the complex structure of
interconnections. For this reason, we based our analysis
on Complex Network approach. Unlike most traditional
statistical techniques, this approach is relevant, because it
allows discriminating between different agents, without
canceling their differences as usual in averaging processes
of traditional statistics. Indeed, agent’s heterogeneity
does play a crucial role in economic phenomena, that
often can neither be predicted nor explained considering
average representative economic agents. Most relevantly,
the economic connections between the economic agents
inside the system are considered. In particular, economic
failure propagation can be studied only considering the
architecture of these connections. For instance, it is
completely different on a random network or on a
network characterized by hubs and peripheral nodes, like
the real ones. This may play a crucial role in the study of
economic vulnerability and systemic risk.
Moreover, network approach allows outlining the
second order correlation and the cluster structure, not only
looking to the first neighbors but also to other members of
sub-networks and communities within the large network.
The first (2003) and last year (2015) of fDi Market
database has been analyzed using Network theory, with
focus to European countries investing worldwide.
Comparing the two years, we observe a change from a
slightly connected network to a strongly connected
network with very well defined clusters emerging in 2015
within the same industrial sector. K-core analysis allowed
to identify the main clusters, each one driven by a sector
leader. This is an evidence of convergence to common
strategies of groups of different firms concentrated in the
same production regions.
In the future, we plan to study the evolution of the
network year by year focusing on different sectors, in
order to outline the main differences in the fragmentation
of production strategies and how they have been affected
by the economic crisis.
REFERENCES
[1] D. Blazquez and J. Domenech, “Big data sources and
methods for social and economic analyses,”
Technological Forecasting and Social Change, vol. 130,
2018.
[2] M. Dehmer, F. Emmert-Streib, S. Pickl, and A. Holzinger,
Big Data of Complex Networks, CRC Press, Francis and
Taylor, 2016.
[3] S. N. Dorogovtsev and J. F. F Mendez, Evolution of
Networks, Oxford University Press, 2003.
[4] F. Schweitzer, G. Fagiolo, D. Sornette, F. Vega-Redondo,
A. Vespignani, and D. R. White, “Economic networks:
The New challenges,” Science, vol. 325, no. 5939, pp.
422-425, 24, July 2009.
[5] G. Iori, G. De Masi, O. Precup, G. Gabbie, and G.
Caldarelli, “A network analysis of the Italian overnight
money market,” J. Economic Dynamic and Control, vol.
32, no. 1, pp. 259-278, 2008.
[6] G. De Masi, Y. Fujiwara, M. Gallegati, B. Greenwald,
and J. E. Stiglitz, “Japanese financial credit networks,
evolutionary and institutional economics review,” vol. 7,
no. 2, pp. 209–232, 2011.
[7] S. Battiston, D. Delli Gatti, M. Gallegati, B. Greenwald,
and J. E. Stiglitz, “Credit chains and bankruptcy
propagation in production networks,” J. Economic
Dynamic and Control, vol. 31, no. 6, pp. 2061-2084, June
2007.
[8] D. Garlaschelli, S. Battiston, M. Castri, V. D. P. Servedio,
and G. Caldarelli, “The scale-free topology of market
Journal of Communications Vol. 14, No. 5, May 2019

©2019 Journal of Communications 407
investments,” Physica A, vol. 350, no. 2-4, pp. 491-499,
May 15, 2005
[9] G. Fagiolo, T. Squartini, and D. Garlaschelli, “Null
models of economic network: The case of the world trade
web,” in Proc. Laboratory of Economics and
Management (LEM), Sant'Anna School of Advanced
Studies, Pisa, Italy, 2011.
[10] R. S. Wall and G. A. van der Knapp, “Sectoral
differentiation and network structure within contemporary
worldwide corporate networks,” Economic Geography,
vol. 87, no. 3, pp. 267-308, 2011.
[11] L. Alfaro and M. Chen, “The global network of
multidimensional firms,” Journal of International
Economics, vol. 94, no. 2, pp. 263-276, 2014.
[12] G. De Masi, G. Giovannetti, and G. Ricchiuti, “Network
analysis of Italian foreign direct investments,” Physica A,
vol. 392, pp. 1202-1214, 2013.
[13] C. Joyez, “On the topological Structure of Multinational
network,” Physica A, vol. 473, pp. 578-588, 2017.
[14] G. De Masi and G. Ricchiuti, “The network of european
outward foreign direct investment,” Chapter contribution
to book “Networks of International Trade and Investment:
“Understanding globalisation through the lens of network
analysis”, Vernon Press, edited by Alessia Amighini, Sara
Gorgoni, Matthew Smith, 2018
[15] L. C. Freeman, “A set of measures of centrality based on
betweenness,” Sociometry, vol. 40, no. 35, p. 41, 1977.
[16] G. Sabidussi, “The centrality index of a graph,”
Psychometrika, vol. 31, pp. 581-603, 1966.
[17] S. N. Dorogovtsev, A. V. Goltsev, and J. F. F. Mendes,
“k-Core organization of complex networks,” Physical
Review Letters, vol. 96, no. 4, 2006.
[18] T. Kamada and S. Kawai, “An algorithm for drawing
general undirected graphs,” Inf. Process. Lett., vol. 31, no.
1, pp. 7-15, 1989.
Giulia De Masi received her PhD in
Physics in 2007 on Statistical Properties
and Dynamical Evolution of Complex
Networks with Applications. Starting
from her PhD, she focused on Statistical
Modeling ad Data Science with
multidisciplinary collaborations, mainly
in Engineering, Environmental Sciences
and Economics. She has long experience both in University and
Industry R&D sector. Her research interests include Complex
Network analysis and modeling, Machine Learning and Data
Science.
Giorgio Ricchiuti defended his PhD in
Development Economics at the
Università di Firenze (Italy). He is
currently Associate Professor at the
Università di Firenze and fellow of the
Complexity Lab in Economics at
Università Cattolica (in Milan). His
research has been regarding dynamic
models with heterogeneous agents and bounded rationality and,
on how different modes of internationalization affect
productivity and firms' survival probability.
Journal of Communications Vol. 14, No. 5, May 2019