Embed Size (px)
Citation preview

Please cite this paper as:
Rannan-Eliya, R. P. and L. Lorenzoni (2010), “Guidelinesfor Improving the Comparability and Availability of PrivateHealth Expenditures Under the System of Health AccountsFramework”, OECD Health Working Papers, No. 52,OECD Publishing.http://dx.doi.org/10.1787/5kmbrcg0clvc-en
OECD Health Working Papers No. 52
Guidelines for Improvingthe Comparability andAvailability of Private HealthExpenditures Under theSystem of Health AccountsFramework
Ravi P. Rannan-Eliya, Luca Lorenzoni
JEL Classification: C81, I10, N41

Unclassified DELSA/HEA/WD/HWP(2010)3 Organisation de Coopération et de Développement Économiques Organisation for Economic Co-operation and Development 26-May-2010 ___________________________________________________________________________________________
English - Or. English DIRECTORATE FOR EMPLOYMENT, LABOUR AND SOCIAL AFFAIRS HEALTH COMMITTEE
Health Working Papers
OECD Health Working Papers No. 52 GUIDELINES FOR IMPROVING THE COMPARABILITY AND AVAILABILITY OF PRIVATE HEALTH EXPENDITURES UNDER THE SYSTEM OF HEALTH ACCOUNTS FRAMEWORK
Ravi P. Rannan-Eliya and Luca Lorenzoni
JEL Classification: I10, C81, M41
All Health Working Papers are now available through the OECD's Internet Website at http://oecd.org/els
JT03284143
Document complet disponible sur OLIS dans son format d'origine Complete document available on OLIS in its original format
DE
LSA
/HE
A/W
D/H
WP(2010)3
Unclassified
English - O
r. English

DELSA/HEA/WD/HWP(2010)3
2
DIRECTORATE FOR EMPLOYMENT, LABOUR AND SOCIAL AFFAIRS
www.oecd.org/els
OECD HEALTH WORKING PAPERS
http://www.oecd.org/els/health/workingpapers This series is designed to make available to a wider readership health studies prepared for use within the OECD. Authorship is usually collective, but principal writers are named. The papers are generally available only in their original language – English or French – with a summary in the other. Comment on the series is welcome, and should be sent to the Directorate for Employment, Labour and Social Affairs, 2, rue André-Pascal, 75775 PARIS CEDEX 16, France.
The opinions expressed and arguments employed here are the responsibility of the author(s) and do not necessarily reflect those of the OECD.
Applications for permission to reproduce or translate all or part of this material should be made to:
Head of Publications Service
OECD 2, rue André-Pascal
75775 Paris, CEDEX 16 France
Copyright OECD 2010

DELSA/HEA/WD/HWP(2010)3
3
ACKNOWLEDGEMENTS
1. The authors gratefully acknowledge the important and valuable input provided by a range of experts during preparation and revision of the guidelines. In particular, Sandra Hopkins at the OECD Secretariat helped to steer the guidelines preparation, and gave important inputs throughout the process. The author acknowledges the valuable inputs and feedback from the country correspondents in Bulgaria, Ireland, Korea, Poland, Spain and Switzerland. Finka Denkova (Health Statistics, Bulgaria), Ciara O’Shea (Central Statistics Office, Ireland), HS Jeong (Yonsei University, Korea), Malgorzata Zyra (Central Statistical Office, Poland), Jorge Relaño (Ministry of Health and Social Affairs, Spain), and Raymond Rossel (Swiss Statistics) were involved in the pilot project to review the first draft of these guidelines and to document their own current practices, and then participated, together with Aljona Karloseva and Natalja Jedomskihh-Eigo (National Institute for Health Development, Estonia), in the 12th June 2009 workshop in Paris to share and discuss their experience and observations on the guidelines. The authors would also like to acknowledge the valuable work of Yuxin Zhao (China National Health Economics Institute, China), and Marisa García Calatayud (Ministry of Health and Social Affairs, Spain). The authors received and appreciated the useful comments from staff of the Centres for Medicare and Medicaid Services, USA. This diverse feedback was extremely useful in anchoring the guidelines in the experience of country experts, who face the difficult challenge of estimating private spending in their countries, often with limited resources.
2. The project on Improving the comparability and availability of private health expenditure under the SHA framework was funded over the period 2007-08 by regular contributions from member countries of the OECD. The project was also supported by a grant provided by the Directorate General for Public Health and Consumer Affairs of the European Commission under Agreement No 2006OECD01.

DELSA/HEA/WD/HWP(2010)3
4
ABSTRACT
3. This paper reports on a project to improve the comparability and availability of private health expenditure under the joint health accounts questionnaire (JHAQ) data collection. The JHAQ is a framework for joint data collection in the area of health expenditure data developed by OECD, Eurostat, and WHO. In particular, the study questions were: How to overcome the inherent tendency for much private health care financing to occur without the generation of linked, reliable, and comprehensive routine data? How to tackle the issue of private providers likely to operate without reporting of routine data to statistical agencies?
4. In order to do this, draft guidelines for improving the comparability and availability of private health expenditures were prepared. Seven countries were invited to provide more detail on the data sources and estimation methods used to compile private health expenditure data under the SHA framework.
5. The guidelines reported in this working paper draw on country information in terms of the data sources used and estimation methods applied in order to report components of private health expenditure. The guidelines were informed by the discussion at a workshop held at OECD headquarters in Paris on the 12th June 2009, which all the participating country experts participated in, together with other experts from BASYS, Eurostat and WHO. Experts from Estonia also attended this meeting, and shared the work that they had done to review and improve methodologies for estimation of household spending on health.
6. The guidelines provide advice on the general approach to be taken in measuring private expenditures, in particular how a measurement strategy should be formulated, and how data sources and methods should be identified. They equally provide a tool for a national self-assessment of existing methodology. They review in detail potential methods for estimating private expenditure flows, with those specific to financing agents presented before those specific for providers. The methods to be used for estimating household out-of-pocket are only presented afterwards, as these require consideration of when and how household survey data can be used. Finally, the guidelines discuss how the different estimation methods and data sources can be combined to produce overall and final estimates in an integrated approach.

DELSA/HEA/WD/HWP(2010)3
5
RÉSUMÉ
7. Ce papier présente le projet pour améliorer la comparabilité et la disponibilité des données sur les dépenses privées dans le cadre de la collecte de données conjointe de comptes de la santé (Joint health accounts questionnaire, JHAQ). Le JHAQ est un cadre de travail pour la collecte de données conjointe dans le domaine des dépenses de santé, développé par l’OCDE, Eurostat et l’OMS. Les questions auxquelles l’étude voulait répondre été : comment supère les problèmes de mesure des dépenses privées tiennent avant tout au fait que, par sa nature même, le financement s’effectue en général sans donner lieu à la production de données courantes, fiables et exhaustives? Concernant les prestataires privés, comment affronter l’absence fréquente de données courantes d’enregistrement, d’ordre administratif ou transactionnel, adéquates?
8. Pour ce faire, dans le cadre du projet ont été élabore de lignes directrices relatives à l’estimation des dépenses de santé privées afin d’améliorer la comparabilité et la disponibilité des données sur les dépenses privées. Ces lignes directrices ont été évaluées à la lumière de l’expérience de sept pays en matière de sources de données et de méthodes d’estimation dans le cadre du Système de comptes de la santé (SCS).
9. Les lignes directrices présentées dans ce papier utilisent les informations détaillées que les pays pilot ont communiquées sur les sources de données utilisées et les méthodes d’estimation employées. Ces lignes directrices s’appuient sur l’examen des problèmes rencontrés en matière d’estimation des dépenses privées discutées dans un workshop qui s’est tenu au siège de l’OCDE à Paris le 12 juan 2009. Les experts de pays pilots ont participés, aussi que des experts de BASYS, de l’OMS, et Eurostat. Deux experts de l’Estonie ont aussi participé à la réunion, et ont partagé le travaille qu’ils ont fait pour améliorée la méthode de données d’enquêtes auprès des ménages pour estimer les dépenses de ceux-ci.
10. Ces lignes directrices présentent un ensemble de méthodes qu’il est recommandé d’adopter pour mesurer les dépenses de santé privées. Cette stratégie sous-entend d’examiner la totalité des sources de données disponibles, considérées sous les différents angles, et de voir lequel on retient pour l’estimation des flux de dépenses. A ce titre, elles offrent un cadre pour la poursuite des travaux visant à mettre au point un self assessment des méthodes utilise dans chaque pays. Il est recommandé aux experts de tabler davantage sur les données provenant des prestataires et à celles relatives aux mécanismes de financement qu’aux données des enquêtes auprès des ménages, et d’adopter une approche intégrative en ne fondant pas les estimations uniquement sur les dépenses des ménages mais sur la totalité des flux de dépenses dans un compte de la santé.

DELSA/HEA/WD/HWP(2010)3
6
TABLE OF CONTENTS
ACKNOWLEDGEMENTS ............................................................................................................................ 3
ABSTRACT ................................................................................................................................................... 4
RÉSUMÉ ........................................................................................................................................................ 5
TABLE OF CONTENTS ................................................................................................................................ 6
EXECUTIVE SUMMARY ............................................................................................................................ 8
1. INTRODUCTION .................................................................................................................................... 10
2. DEFINITIONS.......................................................................................................................................... 12
3. PROBLEMS AND CHALLENGES IN THE MEASUREMENT OF PRIVATE HEALTH EXPENDITURES ......................................................................................................................................... 15
3.1 Limitations in the use of household surveys to estimate household out-of-pocket expenditures ....... 15
4. GENERAL APPROACH ......................................................................................................................... 19
4.1 Measurement strategy ......................................................................................................................... 19 4.2 Formulating the measurement strategy ............................................................................................... 19 4.3 Assessing data sources ........................................................................................................................ 20 4.4 Selecting approaches ........................................................................................................................... 22
4.4.1 Measurement from financing and provider perspectives .............................................................. 22 4.4.2 Integrative approach to expenditure measurement ....................................................................... 23
5. METHODS FOR SPECIFIC EXPENDITURE FLOWS ......................................................................... 25
5.1 A/B/C classification of methods ......................................................................................................... 25 5.2 Methods specific to expenditure flows classified by financing agents ............................................... 26
5.2.1 Private social insurance – HF.2.1 ................................................................................................. 26 5.2.2 Private insurance expenditures (other than social insurance) – HF.2.2 ........................................ 27 5.2.3 Private household out-of-pocket expenditure – HF.2.3 ................................................................ 28 5.2.4 Non-profit organisations serving households (other than social insurance) – HF.2.4 .................. 30 5.2.5 Corporations (other than health insurance) – HF.2.5 .................................................................... 31
5.3 Methods specific to providers ............................................................................................................. 32 5.3.1 Private expenditures at public providers (cost sharing) ................................................................ 32 5.3.2 Expenditures at private hospitals – HP.1 ...................................................................................... 32 5.3.3 Expenditures at private providers of ambulatory care, including physicians – HP.3 ................... 34 5.3.4 Sales of pharmaceuticals through retail outlets – HC.5.1 and HP.4 ............................................. 35
6. METHODS SPECIFIC FOR ESTIMATION OF HOUSEHOLD OUT-OF-POCKET EXPENDITURE38
6.1 Determining when and how to use household survey data ................................................................. 38 6.2 Types of household surveys ................................................................................................................ 38
6.2.1 Household budget surveys ............................................................................................................ 38 6.2.2 Specialised surveys of household healthcare utilisation and expenditure .................................... 39 6.2.3 Specialised surveys of household health care utilisation only ...................................................... 39 6.2.4 Diary surveys ................................................................................................................................ 39

DELSA/HEA/WD/HWP(2010)3
7
6.2.5 General limitations in coverage of household surveys ................................................................. 39 6.3 Assessing reporting biases in household survey data .......................................................................... 40
6.3.1 Cross-validation using national accounts ..................................................................................... 40 6.3.2 Cross-validation using utilisation rates ......................................................................................... 41
6.4 Estimating household expenditures in the absence of reliable provider data ...................................... 42 6.4.1 Price and quantity (PQ) method ................................................................................................... 42 6.4.2 Aggregate scaling method ............................................................................................................ 43 6.4.3 Using household survey data to estimate residual items of out-of-pocket spending by assuming reporting bias is equal across items ....................................................................................................... 44
7. PRODUCING FINAL ESTIMATES OF PRIVATE EXPENDITURE BY RECONCILING AND INTEGRATING ESTIMATES .................................................................................................................... 47
7.1 Estimation of expenditures as a time series ......................................................................................... 47 7.2 Organisation of data ............................................................................................................................ 47 7.3 Reconciliation and integration of the estimates .................................................................................. 48
8. CONCLUSIONS ...................................................................................................................................... 51
ANNEX 1: REPORTS ON IMPLEMENTING THE DRAFT GUIDELINES ............................................ 52
Bulgaria ..................................................................................................................................................... 53 China ......................................................................................................................................................... 54 Ireland ....................................................................................................................................................... 55 Korea ......................................................................................................................................................... 55 Poland ........................................................................................................................................................ 57 Spain .......................................................................................................................................................... 59 Switzerland ................................................................................................................................................ 60
BIBLIOGRAPHY ......................................................................................................................................... 62
Tables
Table 1. ICHA-HF Classification of private health care financing..................................................... 12 Table 2. Methods specific for estimating expenditures by private financing agents .......................... 36 Table 3. Summary of methods specific for estimating private expenditures at providers .................. 37 Table 4. Organisation of data in a spreadsheet example ..................................................................... 48 Table 6. Estimation of Private dentists' revenues ............................................................................... 48 Table 7. Estimation of private dentists' revenues ................................................................................ 49 Table 7. Estimation of household spending at private practitioner clinics, Hong Kong SAR, China 50
Figures
Figure 1. Derivation of final estimate of private dentits' revenues ....................................................... 50 Boxes
Box 1. Exhibit 1: Research on health survey design by US National Center for Health Statistics ........... 17

DELSA/HEA/WD/HWP(2010)3
8
EXECUTIVE SUMMARY
11. The System of Health Accounts (SHA) aims to develop comprehensive and internationally comparable data on health expenditure. In doing so, SHA accounts not only for health expenditure by financing sources of private insurance, households’ out-of-pocket payments, non-profit institutions and corporations, but also their breakdown by function and provider. Incomplete sources and estimation methods for components of private expenditure on health are among the major limitations for international comparisons.
12. The principal source of problems in measurement of private expenditures is the inherent tendency for much private health care financing to occur without the generation of linked, reliable and comprehensive routine data, and for private providers, who are more likely to be financed by private expenditures, to tend to operate without reporting of routine data to statistical agencies. The frequent lack of suitable registration data for private providers reinforces the difficulties, since they limit the potential for comprehensive and representative surveys. As a result, in the absence of routine, administrative or transactional data, estimation of private health expenditures must often rely on the use of survey data. Production of reliable estimates thus requires considerable care in selection of appropriate methods, in the assessment of the available data, and in combining information from multiple data sources.
13. The data sources currently used for estimation of private expenditure components such as household budget surveys and data reported in national accounts have been developed for other purposes, and hence a mapping of national categories to the International Classification of Health Accounts (ICHA) is often difficult due to differences in concepts, definitions and the exhaustiveness of classifications.
14. The main purpose of the project was to develop guidelines for estimating private expenditure in order to improve the comparability and availability of private health expenditure under the joint OECD, Eurostat and WHO SHA data collection.
15. These guidelines present a set of recommended approaches to measuring private health expenditure. These are based on a review of known problems in private expenditure estimation, and consideration of the reliability, reproducibility and feasibility of current and potential methods. As such they provide a platform for ongoing work to develop improved methods.
16. The guidelines were evaluated on the basis of country experiences in terms of sources of data and estimation methods. Seven countries – Bulgaria, China, Ireland, Korea, Poland, Spain, and Switzerland - provided detailed information on: data sources used for each financing agent; estimation methods used, including the use of any residual techniques; methods used for reconciling data from providers and functions with funding sources; methods used to ensure that the private health expenditure data reported is devoted to health goods and services which fall within the SHA boundaries; how data from household surveys are used; how the differences between data from household budget surveys and data reported in National Accounts (for households’ final consumption expenditure) are reconciled; how informal payments are measured or estimated.
17. The results of this project confirm that reliable and accurate estimation of private expenditures is a major challenge in estimating health accounts in most countries. Differences in the way in which private expenditures are estimated in different SHA implementations can result in significant differences in the levels of private expenditures that are being reported, and represent an important obstacle to achieving comparability of national estimates of health spending. Household out-of-pocket spending accounts for the largest part of private expenditures in most countries, and it is estimation of household expenditure that often presents the most problems for health accountants.

DELSA/HEA/WD/HWP(2010)3
9
18. Despite the diversity in methods used, there are many ways in which current approaches to estimation can be significantly improved, by drawing upon emerging best practices. In particular, health accountants need to be aware of the dangers in simply relying on household survey data to estimate household expenditures. Many decades of experience in both national accounts and health accounts have demonstrated that household surveys have certain weaknesses as instruments to measure the level of household spending, and might be subject to sampling and non-sampling error.
19. It is recommended that health accountants rely more on provider side and financing scheme data than on household survey data, and adopt an integrative approach to estimating not only household expenditures, but all expenditure flows in a health account. This strategy involves examining all available data sources and balancing estimates of expenditure flows from different perspectives. In the case of household spending, this requires using data from both the provider and household sides. Adoption of an integrative strategy represents not only current international best practice for estimation of household health expenditures, but also shifts health accounting practice closer to what is considered best practice in national accounts.
20. In applying the integrative approach, the health accountant should invest time and resources where it is most cost-effective. Given that private expenditure estimates will often be subject to considerable error despite the best efforts of health accountants, it is not wise to invest considerable time in focusing on minor components of spending with little policy significance. For example, trying to correct for the errors that arise because insurance payments are not made in the same year as the relevant medical expenditure is unlikely to be an efficient use of resources in most countries, where insurance is not a major source of financing.
21. Nevertheless, estimation of private expenditures will still remain a challenge. It is important therefore that estimation methods continue to develop and improve. Health accountants are encouraged to document the different methods they use to allow other countries to learn from different national experiences, so that international understanding of the available methods increases. It is only through this process of transparency and mutual learning that the both national and global estimates of private expenditure will improve in the future.

DELSA/HEA/WD/HWP(2010)3
10
1. INTRODUCTION
22. The aim of the present paper is to enhance the analytical power of the System of Health Accounts (SHA), improve the quality of the SHA as a statistical framework and provide better guidance for application of the SHA by national statistical authorities.
23. In September 2006, OECD, Eurostat and WHO, having agreed that it would be desirable to avoid the development of diverging versions of health accounts methodology, decided to co-operate in working towards a common revised manual for the System of Health Accounts (SHA 2.0). It is anticipated that the projects in the OECD programme of work will contribute to the ongoing revision of the SHA Manual.
24. The main purpose of the project on private health spending is to develop guidelines for estimating private expenditure in order to improve the comparability and availability of those estimates under the joint OECD, Eurostat and WHO SHA data collection. The primary purpose of these guidelines is to provide practical guidance in the area of private health expenditure estimation to experts who are compiling health accounts using the methodology developed in the SHA.
25. The pilot implementations of the SHA in OECD, EU and other countries since 2000 and the annual collection of health accounts data in the Joint SHA collections by OECD, Eurostat and WHO since 2005 reveal that a wide range of methods is currently in use by health accounts experts when measuring the same types of private health expenditures. Experts have also frequently reported difficulties in estimating components of private health expenditure.
26. Errors and uncertainties in measurement are likely to be associated with many of the methods currently observed to be in use. This combined with the considerable variation in methods contributes significantly to lack of comparability and reliability in current SHA estimates of private health expenditure. Furthermore, in several SHA implementations, some elements of private sector-financed expenditures are omitted owing to lack of appropriate methods and data sources, which further undermines comparability of SHA estimates between countries and over time.
27. As also stated in the Office for National Statistics SHA Guidelines (2004) “Private funding is at the moment the least reliable component of health care financing (mainly due to uncertainties with respect to the amount of out-of-pocket payments to health care providers and pharmacies) and also one of the major sources of estimation error in total expenditure on health in many countries. Data sources for a detailed breakdown of out-of-pocket financing by private households are consequently one of the weak points in existing Health Accounts in many countries”.
28. Achieving better consistency and comparability of private expenditures in SHA estimates is consequently a key priority, also in light of the share of total expenditure on health from private financing sources (HF.2 in the ICHA-HF classification) that ranges between 15 and 43% across reporting OECD countries (OECD SHA, 2009). Policy measures in several OECD and EU economies are also concerned with either reducing what is perceived as a high level of out-of-pocket expenditures, or increasing it, both of which imply the need for more reliable and stable measures of private expenditure across countries and over time.

DELSA/HEA/WD/HWP(2010)3
11
29. These guidelines present a set of recommended approaches to measuring private health expenditure. These are based on review of known problems in private expenditure estimation, and consideration of the reliability, reproducibility and feasibility of current and potential methods. As such they provide a platform for further work to develop improved methods. They may be read in conjunction with ONS/Eurostat “SHA Guidelines: Practical guidance for implementing a System of Health Accounts in the EU”, henceforth referred to as the SHA Guide and the WHO “Guide to producing national health accounts”, henceforth referred to as the WHO PG.
30. These guidelines are written mainly for those involved in the compilation of health accounts using the SHA framework, but they may be useful to a wider number of health accounts experts. The reader is expected to be familiar with the SHA, and have some basic understanding of National Accounts and of economic and statistical concepts.
31. The guidelines start with a discussion of a key problem in estimating private expenditures, which is the lack of reliability of household survey data for this purpose. This is to emphasise the importance of treating such data as the data of last resort, and of identifying alternative methods, which is a recurrent message in these guidelines. This is followed by advice on the general approach to be taken in measuring private expenditures, in particular how a measurement strategy should be formulated, and how data sources and methods should be identified. Then the guidelines review in detail potential methods for estimating private expenditure flows, with those specific to financing agents presented before those specific for providers. The methods specific for estimating household out-of-pocket are only presented afterwards, as these require consideration of when and how household survey data can be used. Finally, the guidelines discuss how the different estimation methods and data sources can be combined to produce overall and final estimates.
DELSA/HEA/WD/HWP(2010)3
12
2. DEFINITIONS
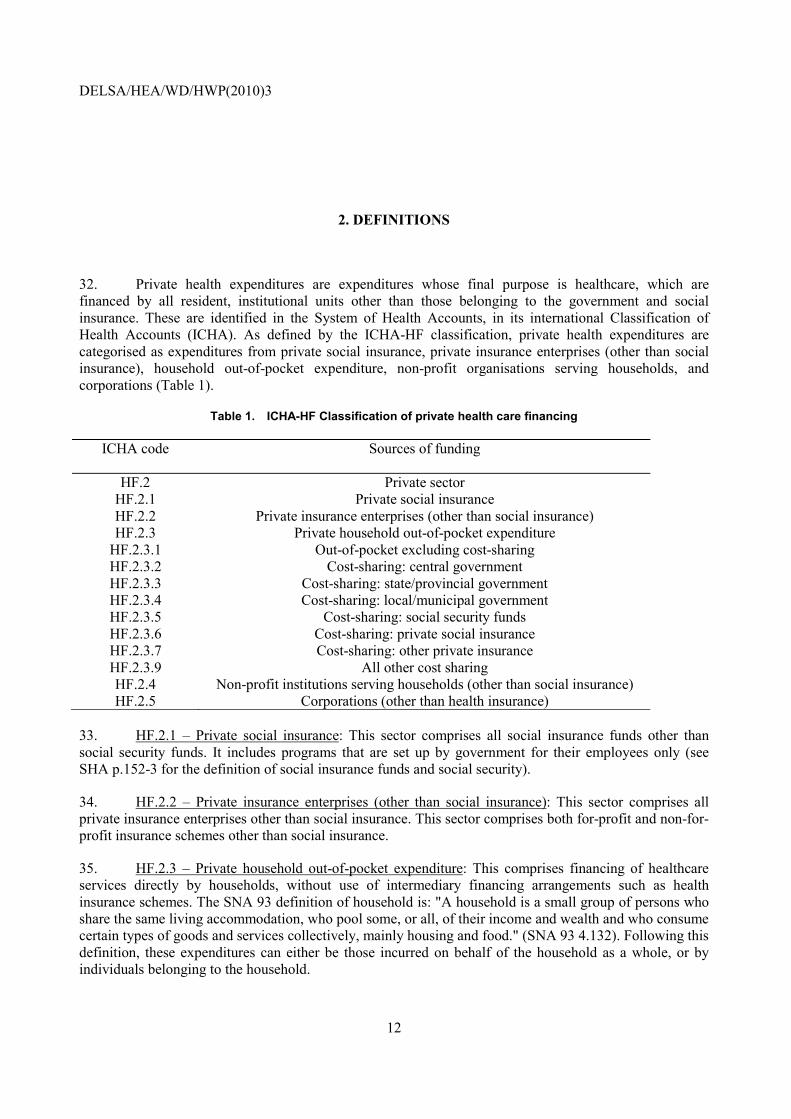
32. Private health expenditures are expenditures whose final purpose is healthcare, which are financed by all resident, institutional units other than those belonging to the government and social insurance. These are identified in the System of Health Accounts, in its international Classification of Health Accounts (ICHA). As defined by the ICHA-HF classification, private health expenditures are categorised as expenditures from private social insurance, private insurance enterprises (other than social insurance), household out-of-pocket expenditure, non-profit organisations serving households, and corporations (Table 1).
Table 1. ICHA-HF Classification of private health care financing
ICHA code Sources of funding
HF.2 Private sector HF.2.1 Private social insurance HF.2.2 Private insurance enterprises (other than social insurance) HF.2.3 Private household out-of-pocket expenditure
HF.2.3.1 Out-of-pocket excluding cost-sharing HF.2.3.2 Cost-sharing: central government HF.2.3.3 Cost-sharing: state/provincial government HF.2.3.4 Cost-sharing: local/municipal government HF.2.3.5 Cost-sharing: social security funds HF.2.3.6 Cost-sharing: private social insurance HF.2.3.7 Cost-sharing: other private insurance HF.2.3.9 All other cost sharing HF.2.4 Non-profit institutions serving households (other than social insurance) HF.2.5 Corporations (other than health insurance)
33. HF.2.1 – Private social insurance: This sector comprises all social insurance funds other than social security funds. It includes programs that are set up by government for their employees only (see SHA p.152-3 for the definition of social insurance funds and social security).
34. HF.2.2 – Private insurance enterprises (other than social insurance): This sector comprises all private insurance enterprises other than social insurance. This sector comprises both for-profit and non-for-profit insurance schemes other than social insurance.
35. HF.2.3 – Private household out-of-pocket expenditure: This comprises financing of healthcare services directly by households, without use of intermediary financing arrangements such as health insurance schemes. The SNA 93 definition of household is: "A household is a small group of persons who share the same living accommodation, who pool some, or all, of their income and wealth and who consume certain types of goods and services collectively, mainly housing and food." (SNA 93 4.132). Following this definition, these expenditures can either be those incurred on behalf of the household as a whole, or by individuals belonging to the household.
DELSA/HEA/WD/HWP(2010)3
13
36. For a more detailed breakdown of household out-of-pocket payments, the following definitions are relevant:
• Out-of-pocket payments: payments borne directly by a patient without the benefit of insurance. They include cost-sharing and informal payments to health care providers;
• Cost-sharing: a provision of health insurance or third-party payment that requires the individual who is covered to pay part of the cost of health care received. This is distinct from the payment of a health insurance premium, contribution or tax, which is paid whether health care is received or not. Cost-sharing can be in the form of deductibles, co-insurance or co-payments;
• Co-payment: cost-sharing in the form of a fixed amount to be paid for a service.
• Co-insurance: cost-sharing in the form of a set proportion of the cost of a service. In France and Belgium, this is the “ticket modérateur”.
• Deductibles: cost sharing in the form of a fixed amount which must be paid for a service before any payment of benefits can take place.
37. HF.2.4 – Non-profit institutions serving households (other than social insurance): Non-profit institutions serving households (NPISHs) consist of non-profit institutions that provide goods or services to households free or at prices that are not economically significant (SNA 93, 4.64). Relevant as sources of funding of health care are in particular charities, relief or aid agencies that are created for philanthropic purposes and not to serve the interests of the members of the association controlling the NPISH. Such NPISHs may provide health care goods or services on a non-market basis to households in need, including households affected by natural disasters or war. The resources of such NPISHs are provided mainly by donations in cash or in kind from the general public, corporations or governments. They may also be provided by transfers from non-residents, including similar kinds of NPISHs resident in other countries (SNA 93, 4.67).
38. HF.2.5 – Corporations (other than health insurance): This sector comprises all corporations or quasi-corporations whose principal activity is the production of market goods or services (other than health insurance). Included are all resident non-profit institutions that are market producers of goods or non-financial services (SNA 93, 4.68).
39. Financing agents versus sources of financing: Health financing systems mobilise and allocate money to cover the health needs of the population, both individually and collectively, in the health system. The dominant approach in the health policy literature is to describe and categorise health financing systems through their basic functions: raising/collecting revenues; risk-pooling (pooling resources); and purchasing (paying for) services. Financing sources are the entities providing funds (through taxes, contributions to insurance, premiums paid, transfer payments and discretionary allocations) for financing schemes. Financing sources are institutional units (including households as a generic group) whose resources are mobilised and managed by financing schemes. The categories under financing schemes (or agents) represent different entities or arrangements for pooling funds and purchasing health care. At the same time, even when combined they are often not sufficient to capture the full complexity of financial flows that are seen in many health systems, since financing can pass through two or more intervening agents before reaching its ultimate destination and use. These guidelines are concerned with the financing agent perspective, i.e., estimating expenditure flows when the last financier is a private sector unit. This corresponds to the dimension of analysis explicitly classified by the ICHA-HF classification of financing agents.

DELSA/HEA/WD/HWP(2010)3
14
40. For more detailed definition and discussion of the above and other terms used in these guidelines, the reader is referred to the OECD System of Health Accounts, the WHO “Guide to producing national health accounts”, and the United Nations System of National Accounts – SNA93 (United Nations 1993).
DELSA/HEA/WD/HWP(2010)3
15
3. PROBLEMS AND CHALLENGES IN THE MEASUREMENT OF PRIVATE HEALTH EXPENDITURES
41. Private health expenditures present significant problems of measurement in most health accounts. These problems are magnified in SHA implementations, because of the requirement for expenditures to be classified in detail by type of financing agent, function and provider. Improvement of measurement methods and harmonisation of those in use along the lines of existing best practices is necessary in order to achieve more comparable estimates of health expenditures in different countries.
42. The principal source of problems in measurement of private expenditures is the inherent tendency for much private health care financing to occur without the generation of linked, reliable and comprehensive routine data, and for private providers, who are more likely to be financed by private expenditures, to tend to operate without reporting of routine data to statistical agencies. The frequent lack of suitable registration data for private providers reinforces the difficulties, since they limit the potential for comprehensive and representative surveys. Nevertheless, in the absence of routine, administrative or transactional data, estimation of private health expenditures must often rely on use of survey data that are often unreliable, biased and lacking in comprehensiveness. Production of reliable estimates thus requires considerable care in selection of appropriate methods, and in the assessment and use of the available data. The more unreliable, biased or lacking in comprehensiveness of the data sources, the more necessary it will be to use methods that combine information from multiple different data sources, and correspondingly the greater the need for approximations.
43. The difficulties encountered in private expenditure estimation can be categorised under the following headings:
• Limitations in the use of household surveys: problems inherent to all household surveys diminish their effectiveness as reliable measures of healthcare behaviour and spending;
• Comprehensiveness in coverage of data sources: many data sources representing private sector institutions suffer from problems of only partial coverage of relevant institutions;
• Periodicity of data sources: many that must be used are not available on a regular or frequent basis;
• Lack of detail in data sources and correspondence with desired ICHA classifications: data sources often do not permit direct disaggregation of expenditures according to the required ICHA classifications, or their scope and detail may not match what is required.
3.1 Limitations in the use of household surveys to estimate household out-of-pocket expenditures
44. Amongst the many components of private health expenditures, the one that can cause the most concerns about reliability of estimates is household out-of-pocket expenditure (HF.2.3). Household surveys can seem an attractive and ideal data source for estimating out-of-pocket spending, but health accounts experts must be particularly cautious about reliance on use of household survey data, especially if other types of data are available, and they should be aware of the significant, potential problems in the use of household survey data.
DELSA/HEA/WD/HWP(2010)3
16
45. There are three problems that health accountants must consider when contemplating the use of household surveys as the primary data source for estimating household expenditures:
i. sampling error in surveys; ii. biases arising from non-sampling errors; and
iii. lack of annual repetition of most household surveys.
Of these, the second is typically under-appreciated, and is behind the most important errors that can arise when estimating household spending.
46. Sampling error is relatively well understood and can be easily quantified. It is covered in most standard statistical texts, and is discussed further in WHO NHA Producers Guide (PG 8.17-8.21), and in a useful guide on design of household surveys in developing and transition economies produced by the UN (Department of Economic and Social Affairs 2005). It is an outcome of the inherent variation between individuals, and the variation in the specific individuals selected in any given sample. This type of sampling error will tend to decrease with increasing size of the survey sample, and so can be a significant problem if the household survey sample is less than 3-5,000 households. The impact of sampling error will also be greater for expenditures that are less frequent or are more variable between individuals, for expenditures that are a smaller proportion of overall health spending, and when the reference period used in a survey is shorter. Finally, it should be noted that in sample surveys that use stratification, the stratification is usually designed to optimise efficiency or reduce sampling error with respect to specific items, and this may not apply to the health components.
47. In practice, the main problem that affects the reliability and comparability of health accounts estimates is the existence of non-sampling errors or biases in household survey data. These biases can be both substantial and also difficult to quantify. Non-sampling biases have a large impact on the net error in most household survey estimates than do sampling errors. Nevertheless, much is known about these problems of bias, since most were subject to comprehensive study and field-based evaluation in research conducted by the US National Centre for Health Statistics (NCHS) in the 1960-70s. This research also permits some assessment of their relative magnitude (Exhibit 1).
48. Non-sampling errors are biases that arise from defects in the design and implementation of a survey, or from the inherent limitations of human behaviour when responding to survey questions. The most important of these is that individuals are rarely able or willing to accurately recall exactly what they did in any given time period. They may fail to accurately recall when an event occurred, thus reporting it to have occurred in the wrong time period, or forget that it had occurred in the period in question. They can fail to recall correctly the number of times an event occurred in a given time period, or fail to correctly report the actual amount of expenditure associated with a particular event.
49. Another source of biases is the use of proxy respondents to obtain information. This refers to individuals who provide information on behalf of other individuals who are not directly interviewed. This is normal in most surveys when dealing with children, as adults are typically expected to provide information concerning them. Whenever proxy respondents are used to elicit information on healthcare use or spending, there is a greater chance that the respondent will fail to recall a pertinent event, not having experienced it directly themselves. In the case of adult respondents who proxy for children, male adults in many countries often have less knowledge of events involving their children than their actual mothers, and so the choice of adult proxy respondent can have additional implications for the size of any non-sampling errors.
50. The types of biases mentioned so occur with cooperative respondents, without any deliberate intent to mislead the interviewer. However, errors may arise also as a consequence of embarrassment or a
DELSA/HEA/WD/HWP(2010)3
17
wish to conceal information. This can, for example, be a problem when surveys seek information about expenditures associated with illnesses of a personally sensitive nature, or when respondent may be reluctant to admit to use of specific providers or products. Alternatively, if the survey instrument is too exhaustive, some respondents may learn to under-report certain events, so as to shorten the interview time.
51. These non-sampling biases can be large (see Box 1), and tend to show the following patterns:
(i) The number of events forgotten increases proportionately with the length of the recall period. (ii) Events with less salience or impact on the individual are more likely to be forgotten. (iii) Proxy respondents tend to report 20% fewer events.
Box 1. Research on health survey design by US National Centre for Health Statistics
In the 1960s, a considerable amount of research was conducted into the problems of non-sampling error and response bias in health interview surveys by the National Center for Health Statistics in the USA (Cannell, Fisher, and Bakker 1965; Cannell and Fowler 1965; Cannell, Marguiz, and Laurent 1977). Their researchers surveyed large samples of individuals about their health care visits and spending in communities where it was possible to obtain reliable data on actual visits from the administrative records of the providers. The communities chosen were stable and relatively culturally homogeneous and educated by existing US standards, and could be considered to be a population where recall errors might be minimised. The investigators were able to test, through randomisation, the impact of changes in the instrument design on responses, including the effect of changes in recall periods.
The researchers found that respondents were liable both to forget, and fail to report, events that took place in a given recall period, as well as report events that had not taken place in the same recall period. The net impact of the two forces tended to be an underestimation of events. The net bias was found to be associated with a number of factors, including design of the questions, whether a proxy respondent was used and their relationship to the individual of interest, the length of the recall period, the type of event, the age, sex, education and socio-cultural characteristics of the respondent, and whether the illness was acute or chronic. For example, when asked about inpatient admissions, the total number of admissions reported by adult respondents who were responding on behalf of other adults in the family was 18% under-estimated when the events took place 1-20 weeks before the interview, increasing to 45% under-estimation when the recall period was 40-53 weeks before.
It was found that significant recall loss of events occurred with recall periods of more than one week for outpatient events, and more than six months for inpatient events. In general, the size of the recall loss increased monotonically with increased length of the recall period. There has not been substantial research in developing countries to replicate these investigations, but evidence from several surveys (Ross and Vaughan 1986), and other health accounting studies conducted in places as diverse as Taiwan, Bangladesh and Sri Lanka provide confirmatory evidence that the US results can be generalised to other settings (Data International 1998).
Further details of the NCHS research to improve the design of health surveys and estimation of health expenditures are available in the research reports, published in the NCHS Vital and Health Statistics Series, Number 2 (Data Evaluation and Methods Research), available at: http://www.cdc.gov/nchs/products/series.htm#sr2.
52. In general, surveys which use recall periods of twelve months for inpatient events will be associated with significant forgetting of events (upwards of 30-50%), and surveys which use recall periods of more than two to three days for outpatient events will be associated with significant forgetting of events (more than 20%).
53. The evidence suggests that specialised health surveys which focus only on health events and health expenditures can contrarily lead to over-reporting of events, with more events or expenditures reported for a given time period than what actually occurred. Household budget or expenditure surveys, which are conducted to collect data on all items of household expenditure, will tend to result in lower estimates of health spending than specialised health surveys, which focus only on healthcare use. Nevertheless, the general household budget survey may still be unbiased in one respect, since it will tend to
DELSA/HEA/WD/HWP(2010)3
18
provide a less biased estimate of the proportion of overall household consumption that is for health than a health survey which concentrates on health items and provides only minimal time to collecting data on general income or consumption.
54. It is not possible to design and field a household survey with zero non-sampling error-associated bias. The correct strategy is to assume that such biases exist with every survey, and then apply an approach that explicitly takes that into account. In practice this will mean complementing or substituting household surveys with other sources of data, and where possible using data generated from the provider side.
55. One additional problem concerning the use of household surveys relates to the lack of regularity or periodicity. Household surveys are expensive to undertake, and consequently in many countries are not conducted on an annual basis, if at all regularly. In addition, the data collected by household surveys typically takes a long time to be processed and become available. If the health accounts system relies predominantly on such data for estimating private expenditure on an annual basis, then two problems are likely to be faced. First, the lack of data on an annual basis may make it difficult to produce meaningful estimates of annual changes, and second, the time taken to process data from household surveys may be too long to allow them to be included in timely health accounts estimates.
56. There is also concern with the consistency of results produced by different types of surveys. As an example, there is evidence that the health-focused World Health Survey (Ustun et al, 2003) tends to give a higher estimate in health spending as compared to other survey instruments (Xu et al, 2009).
57. The general strategy for measurement of private health expenditures that these guidelines recommend is to identify and use linked, administrative or transactional data where these data exist and are reliable, but in their absence to use methods that triangulate from multiple data sources taking into account their likely deficiencies and biases.

DELSA/HEA/WD/HWP(2010)3
19
4. GENERAL APPROACH
4.1 Measurement strategy
58. From a statistical perspective, measurement of private health expenditure presents many challenges and potential pitfalls, because of problems with unreliable data, and the complete non-coverage of desired items by available data sources. Consequently, estimation may have to rely on approximations, triangulation from different data sources, and the incremental construction of an estimate.
59. In this situation, health accountants will benefit by following a step-by-step approach when measuring private expenditures. These steps consist of formulating a measurement strategy that divides the different components of private health expenditure into separate measurement problems that can be separately and sequentially tackled, assessing the data sources available for generating estimates for each identified component, selecting the optimal measurement approaches, and integrating the overall estimates. A framework for such a strategy is presented first in the following paragraphs, before attention is given to the details of estimating specific types of private expenditure. This is because of the importance of being guided by an overall strategy, before selecting specific methods of measurement.
60. The framework outlined can also be used to assess the quality of current expenditure estimates. Health accountants can use this framework presented here to identify problems in existing methods, and develop improvements.
4.2 Formulating the measurement strategy
61. The starting point is to develop an overview of how and where private expenditures occur in a health system. In most health systems, private health expenditures do not occur in all areas of health activity. In practice, different types and items of private health expenditure are compartmentalised in different parts of the system. For example, in many countries private health insurance and private social insurance expenditures are used to finance services only from a limited range of providers, such as private hospitals and doctors, and do not finance public sector services. The different types of cost-sharing (HF.2.3.2-2.3.9) are all specific to certain types of provision.
62. Since private health expenditures tend to be compartmentalised within the health system, the problem of estimating private expenditures can be divided into separate, discrete problems of estimating different areas of spending, each of which can be tackled with a different estimation approach. If these areas of spending are essentially independent in a measurement sense of each other, employing a different estimation method in each case is valid. Total private health expenditures can then be estimated as the sum of the estimates of all the discrete components. Such areas of spending could be demarcated not only in relation to the financing sources, or only in relation to the providers, but according to the how the health system’s funding flows are structured. For example, out-of-pocket spending at pharmacies might be one area of spending, whilst private expenditure flows at private hospitals might be another; in the first, the spending flow is defined in relation to the financing source (out-of-pocket), and in the second in relation to the provider (private hospitals). Both of these can be measured separately.

DELSA/HEA/WD/HWP(2010)3
20
63. Having identified the discrete areas of spending, focus on estimating first those areas or expenditure elements for which reliable and comprehensive data are available. These reliable estimates may be useful later as additional information when estimating those elements for which reliable data do not exist.
64. For each of the identified areas of spending, identify and collate the relevant data sources. At this stage, it is useful to conceptualise the problem of estimating an expenditure flow as comprising up to three linked estimation problems:
(i) Estimating the absolute level of expenditure at a given time or during a time period. (ii) Estimating the composition of an expenditure flow by financing source, function and provider:
for example, the percentages of household out-of-pocket spending that are for medicines, doctors’ fees and medical supplies.
(iii) Estimating the trend of an expenditure flow during a given time period; for example, what the percentage change in actual expenditure was each year during a ten year period.
65. When data sources for private expenditure in particular are incomplete or unreliable, the estimation strategy may have to use different data sources to estimate different elements of an expenditure flow, i.e., its level, composition and trend. In most situations when comprehensive data do not exist, it is best to focus on estimating the level and trend in expenditures first, and then the composition of expenditures.
66. In summary, formulation of a measurement strategy starts first with demarcating different and distinct areas of private healthcare expenditure, each of which can be estimated largely independently of the other areas. These areas are defined according to their relationship to specific financing sources, or in relation to providers, or in some other manner. For each area, the estimation problems involve estimation of the level, trend and composition of the expenditure flow. The sequencing of the estimations will generally flow from estimating those areas for which data are reliable and comprehensive to those for which data are not reliable, and from estimating the level and trends in an expenditure area first, and then the composition.
4.3 Assessing data sources
67. All available data sources should be considered in order to develop an estimation strategy. In practice, many data sources are not collected by government or as part of routine national statistical data collections, and many might involve self-reporting by private institutions. In order to assess the quality of data sources, particularly from the private sector, it is critical that the health accountant understands the origins and processing of each data source, the purposes for which the data were collected, and how this might influence the quality of the data (PG 6.30-6.60).
68. In selecting and using data sources from private sector sources, there are a number of considerations to be taken into account, many of which are similar to those faced when estimating components of the non-observed economy (OECD 2002). They are as follows.
• Coverage is partial. Each survey or data collection uses its own reference population, and this may not comprise the total population of interest. It is important to identify when institutions of interest are not covered. Most surveys conducted by other agencies or institutions do not cover the full range of respondents that are of interest to the health accountant, and this needs to be taken into account. For example, household surveys of out-of-pocket expenditure often exclude individuals who live in institutions, including hospitals, and who have above-average levels of health care use; industry surveys of retail pharmaceuticals may omit certain retail outlets, certain

DELSA/HEA/WD/HWP(2010)3
21
product categories or certain geographical areas; industry data may only cover members of a trade association, such as those belonging to a hospital association.
• Deficiencies exist in sampling design. The sample size and sampling design of surveys can be less than ideal, particularly for surveys of private providers, when either sampling frames are inadequate or high levels of non-response exist. These must be evaluated in order to assess the likely impact of sampling errors. In addition, many surveys are stratified and are not self-weighting, so this information is important to avoid making invalid generalisations from sample data. In these cases, adjustments will need to be made to the estimates to account for potential bias.
• Information may be partial or not correspond exactly to the relevant scope. For example, in surveys of business enterprise sales, not all sales will be exclusively health. In diagnostic facilities, some sales might not represent final consumption expenditures, since some facilities may be providing services to other providers on an out-sourcing basis. Similarly, in surveys of pharmacies total sales may be greater than sales of medicines, as they may also sell other products such as food, groceries and stationery. In these cases, adjustments may be required to exclude those items that fall outside the scope of the health accounts concept of final expenditures for health, and additional supplementary data may be needed to adjust the primary data.
• The information is a by product of a data collection designed for other purposes. The information of interest to the health accounts estimation may not have been the primary objective of the data collection or survey. In these situations, the data collection may not have been designed or optimised to produce the most reliable estimates of the items in question, and the data may suffer from deficiencies in terms of reliability or completeness. For example, in a household budget survey, data on health expenditures are not the main concern, and so estimates may be unreliable or inadequately detailed.
• Data source is irregular or infrequent. When dealing with private expenditures, available data sources are more likely not to be available on a frequent and regular basis. They may be collected regularly but infrequently, or only on an ad hoc unpredictable basis. Although frequent, regular sources are much preferred as they facilitate production of annual expenditure estimates, infrequent sources can add value too. They may be much richer and detailed than routine data sources, and so might be used to establish benchmark estimates.
• Classifications used in data sources may differ. The classifications used to categorise data may differ from those used in the health accounts, and even between data sources. For example, industry surveys of private providers might not use the provider classification required by the SHA. Different hospital surveys may categorise hospitals differently. Services produced by private providers might not be aggregated according to a classification that maps to the desired functional classification. In these instances, adjustments may need to be made to the data before producing estimates.
• Concepts and accounting rules may differ. Data sources may use definitions, accounting concepts and accounting periods that are not consistent with the health accounts. For example, institutions might collect and report data on a non-accrual basis, or may deviate in part from accrual accounting. The collection period may not match the period used for reporting by the health accounts. For example, the financial years of private providers may vary idiosyncratically, and data collected in a household survey may not be for the same months as referred to in the health

DELSA/HEA/WD/HWP(2010)3
22
accounts. In all these cases, adjustments to the data may be required to reduce the gaps between concepts and accounting rules.
• Limited potential for cross-validation of reported data items. Did the survey collect information on items that can cross-validated using other independent data sources? This can be useful in gauging the bias in a survey or in validating the reliability of a data source.
• Do providers of data or survey respondents have incentives to misreport? This can commonly occur in data collections from private institutions, and also in household surveys. Private providers often face incentives to misreport income, and so data collected for regulatory purposes or tax records in particular can be affected. The extent to which this is a problem may depend also on who is collecting the data, and in many countries private providers will provide reliable financial data to national statistical offices, as they have familiarity with providing them with data and are comfortable with the guarantees provided of confidentiality, but not to other agencies. The potential for this type of bias in data reporting must be assessed with all data sources.
• Do the data sources provide information on the level, composition or trend of expenditure? Data do not have to provide reliable information on all three aspects to be useful. Different data sources can be used to characterise different dimensions of an expenditure flow.
• How large and in what direction are the response biases inherent to household surveys? Household surveys of healthcare expenditures should be used with caution in estimating household out-of-pocket expenditures. Systematic evaluations and experience demonstrate that almost all household surveys suffer from problems of under or over-reporting, which make them an inadequate basis by themselves for estimating the absolute level of expenditures. These problems are discussed further in section 6.
• Are the household surveys subject to seasonal bias? In almost all countries, household health care use and expenditures vary seasonally during the year. In the case of a household survey, it is important to note which months the survey refers to. If the survey was not over a twelve-month period, it may be subject to seasonal bias. Such a bias may need adjustment for.
4.4 Selecting approaches
4.4.1 Measurement from financing and provider perspectives
69. The estimation approach that is used for a particular expenditure flow will depend on the types and range of data that are available, and the reliability of these data sources. In practice, particular approaches will tend to predominate according to the financing source, or provider, or between which financing sources and provider the expenditures flow.
70. There is a menu of four potential approaches available to estimate private health expenditures. These approaches can be used alone or in combination:
(i) Estimation using data from the financing sources, e.g., private health insurance schemes, household surveys (financing side perspective);
(ii) Estimation using data obtained from the providers; e.g., industry surveys of hospitals and pharmacies, administrative data of providers, tax claims of physicians (provider side perspective);

DELSA/HEA/WD/HWP(2010)3
23
(iii) Estimation using data obtained on the consumption of services, e.g. the composition of household spending on particular goods or services, or survey data on the distribution of providers providing a particular service to household (consumption side perspective); and
(iv) Combining the first two or three approaches, by using the data from one to validate and adjust the data from the other (integrative approach).
71. The first three track expenditures from single perspectives: (i) from the financing side (HF); (ii) from the provider side (HP), and (iii) from the consumption side (HC). When considering household out-of-pocket expenditure, using household survey data on spending represents the financing side perspective, but household survey data giving details of the various sources of provision of particular services represents the consumption side perspective. An example of the provider side perspective is when the data on the revenue of private physicians, as reported in their tax returns, are used to estimate total expenditures for private physician services. This might also be recognised as a form of the production approach.
72. Whether the financing side, provider side or consumption side perspectives should be used to estimate an expenditure area or element will depend on the availability and reliability of data sources for each approach. Experience in both OECD and non-OECD countries is that consumption side data tend to be the poorest, and that provider side (cost and revenue) data are the richest, especially for inpatient services. Financing side data are often the most reliable for public expenditures (government and social security), but are typically incomplete because of the usual absence of reliable data on out-of-pocket expenditures.
73. Each approach will be adequate when comprehensive and reliable data are available, but when dealing with private expenditures this is often not the case, and in this common scenario the fourth integrative approach is best. These guidelines recommend use of the integrative approach wherever the available data sources are likely to be unreliable.
4.4.2 Integrative approach to expenditure measurement
74. The integrative approach involves examining expenditure flows from the perspective of all agents involved in an expenditure flow, and attempting to balance all data sources by linking estimates on any one item by financing agents with those given to provider agents. In practice, for any set of transactions, this involves looking at expenditure from both the provider (via data on their receipts or costs) and financing sides (e.g., data from financing schemes or from household surveys), and then reconciling the different data sources. This process of reconciliation should confront the data sources with each other, identify and assess discrepancies, taking into account their respective strengths and weaknesses, in order to obtain a composite estimate of actual expenditures, which reflects all the available information. Although this will entail more effort than relying on a single data source, it will yield results that are more robust and consistent, more comprehensive, and of higher quality than the original data sources.
75. An example of the use of the integrative approach is when distributing the expenditure flow at a particular type of provider by financing source. Often, it can be relatively easy using provider side data on provider revenues to reliably estimate the total expenditures that take place at a given provider. These same data may not provide information on how these expenditures are financed, and it might be the case that these providers are financed by more than one type of financing source. However, if other data are available from the financing side, which permit accurate estimation of the flows from particular financing sources to the provider, then an acceptable estimation method is to subtract the expenditure flows from the measured financing sources from the provider’s total revenues, and derive the expenditure flows from the unmeasured financing sources as a residual.

DELSA/HEA/WD/HWP(2010)3
24
76. The following sections provide guidance for estimating expenditures in a number of specific expenditure areas. These are organised first by methods specific to financing sources, and then by methods specific to types of provider. Estimation of household out-of-pocket expenditure is discussed in its own section, as it is associated with a number of unique problems.

DELSA/HEA/WD/HWP(2010)3
25
5. METHODS FOR SPECIFIC EXPENDITURE FLOWS
77. Since estimates of private expenditure flows may have to be built-up incrementally using a mix of financing-side, provider side, consumption-side, and integrative methods, it is necessary to apply a mix of methods at different points in the overall estimation process. The following paragraphs provide guidance on specific expenditure flows, without implying that the order of items presented is the sequence of estimations that should be used in actual practice. For reasons of convenience, methods specific to flows organised by financing agents are presented before those specific to providers. Since total household out-of-pocket expenditures can rarely be estimated from the financing-side or completely from the provider side, the complete estimation of household out-of-pocket expenditures (HF.2.3) is discussed in the next section, and not here. The various methods presented are summarised in Tables 2 and 3.
5.1 A/B/C classification of methods
78. A variety of methods are usually available for estimating any specific expenditure flow, either its level and trend, or its distribution. These tend to vary in their reliability and appropriateness. Given the choice, it can be difficult to know which methods are to be preferred, and also where efforts are best invested to improve or change methods in order to achieve the largest improvement in the final estimates. To provide guidance on this issue, these guidelines attempt to indicate the relative merits of different methods by ranking them using an A/B/C classification.
79. Methods are treated here as consisting of a combination of a data source or mix of data sources and an analytic process that translates the data sources into final estimates of an expenditure item. Methods are classified into three groups according to their presumed reliability and effectiveness in estimating a particular item, and implicitly the size of the estimation error in the final estimate of the item. This means that the grading of a method will depend on what the intended final item of estimation is, and a method that is considered good for one item, may be ranked differently when applied to estimation of a different item. The three groups are:
(A) methods that are reliable and ideal, and are most appropriate; (B) methods that are less reliable, but are acceptable if A methods cannot be used; and (C) methods that are not acceptable, except as a last resort.
80. This A/B/C classification is intended to encourage improvement in current practices, greater harmonisation of methods, and achievement of greater comparability in SHA estimates of private expenditure. It is only intended to provide guidance, and the classification of a method as A, B or C can be subjective and dependent on the specific circumstances. In many instances, A or even B methods may not be feasible, if requisite data sources are lacking or missing, so A or B methods are not always feasible or necessarily the best that can be achieved.
81. This ranking is intended to provide guidance on the relative strengths of each method, but it must be kept in mind that given the paucity of methodological evaluation research in this area, this guidance is indicative and not intended to be definitive or comprehensive in applicability to all situations or contexts. During the pilot project, there was significant concern by participating experts that the classification might be seen as a means of grading the quality of the health accounts estimates. However, it is important to note

DELSA/HEA/WD/HWP(2010)3
26
that the classification is intended only to provide guidance to health accounts experts as they seek to assess and improve the methods used in a particular country.
5.2 Methods specific to expenditure flows classified by financing agents
82. Where organised private financing schemes exist, and reliable and comprehensive data are available, estimation of the level and trend of total expenditure flows from these financing sources should form the first stage of the measurement strategy. Estimation of the composition of these expenditures by provider and function may however require additional data and use of approximations, and this aspect may need to be delayed until later stages in the process.
5.2.1 Private social insurance – HF.2.1
83. Private social insurance consists of all social insurance other than social security funds. It can consist of programs set up by government for its employees as well as private sector schemes. In the case of schemes covering government employees, the critical difference with social security funds is that the latter are organised separately from general government units, and they hold their assets and liabilities independently, with some level of operational autonomy from government. Private social insurance schemes for government workers are usually restricted to specific groups of government employees, such as teachers or civil servants, and are not organised on a community basis. Private social insurance schemes can exist in the private sector, and involve some element of mandatory coverage owing to agreements between employers and employees, or because of compulsion by the employer or employee organisations, but they differ from social security in that they are not mandated or supervised by government.
84. The general features of these expenditure flows are such that the best approach to measuring the level and trend of total expenditure flows is to use data collected from the financing side, i.e., from the actual schemes. Private social insurance schemes will typically finance services at either public or private providers only, or a mix of public and private providers. In either case, the expenditure flow will represent only a portion of total financing of the relevant providers, and in the case of the private providers it is usually more difficult to obtain reliable data on their insurance receipts from the providers than from the insurance schemes. This is not only because surveying private providers can be inherently problematic, but also because private providers commonly do not maintain records on the financing sources used by their patients, and often do not know whether their patients were reimbursed by insurance. Since schemes will by necessity (contractual, financial and administrative reasons) keep reliable data on their expenditures in a given year, the only practical challenge is identifying a mechanism to efficiently access such data. Even if there is no routine national collection of scheme data, primary collection of data from the schemes themselves will in most cases still yield more reliable and comprehensive data than attempting to estimate the expenditures from data collected from providers.
85. A method – The recommended method of estimation is direct data collection from the schemes themselves or the agencies responsible for their organisation. Data sources can consist of routine administrative data collections from such schemes or employers, routine reports to regulatory agencies, or data collected by direct enquiry from the schemes or agencies involved. If schemes are established on an industry basis, covering groups of similar organisations, then comprehensive data might also be collected by agencies representing such groups, such as employer associations.
86. B method – In some instances, data cannot be collected directly from all schemes, and data collected by employer groups or in surveys specifically targeted at such activities may not be comprehensive in coverage. In these cases, the data can be used with adjustment for gaps in coverage.

DELSA/HEA/WD/HWP(2010)3
27
87. C method – If comprehensive data cannot be collected from the financing side, one alternative method is to rely on data collected in household surveys which ask individuals about their coverage by such schemes, and the frequency and cost of medical care episodes covered by such schemes.
88. Having measured the level and trend of total expenditure flows, the next step is to estimate the composition of those expenditures by provider and function. In some cases, the same routine data sources may contain sufficient detail to comprehensively allocate such expenditures. If not, estimation of the composition of these private social insurance expenditures by function and provider may need to be undertaken at a later stage together with analysis of the revenues of providers.
5.2.2 Private insurance expenditures (other than social insurance) – HF.2.2
89. The general features of private insurance financing are similar to that of private social insurance, in that the best approach to measuring the level and trend of total expenditure flows is usually to use data collected from the financing side, i.e., from the actual private insurance schemes. As with private social health insurance, private insurance typically finances services at a mix of providers, often private, and their financing represents only a portion of total financing of the relevant providers. Since insurance entities are often required (regulatory, financial, administrative reasons) to keep reliable data on their expenditures and financial activities in a given year, the task is to identify a mechanism to efficiently access such data.
90. A method – The ideal scenario is if private insurance entities are required to report details of their health insurance operations (premiums collected, benefits paid, administrative costs) to a regulatory agency, in which case collection of the annual data from the regulatory agency would be the first choice method. In the absence of regulatory agencies, industry or trade associations may collect industry wide data on a private basis, and these can provide an equivalent substitute.
91. This is the case for China, where the China Insurance Regulatory Commission (CIRC) collects health insurance data from all insurance corporations at each regional level (including China-funded corporations and foreign-invested corporations). All commercial health insurance corporations are requested to report their business operation data following the formal statistical report tables of CIRC (including not only the health insurance of life insurance companies, but also some health insurance in the property insurance companies). Because CIRC is the direct administrator of the commercial insurance industry in China, and is responsible for business supervision of all kinds of insurance companies and has its branches all over the state, these data source are comprehensive and reliable.
92. B methods – In a situation where industry-wide data specific to health insurance activities are not routinely collected, the next best approach is to conduct representative surveys directly of the insurance agencies, either directly, or by using the services of an industry association or regulatory agency to act as the data collection intermediary. Such surveys might be organised on a sample basis. Industry data may also be collected by market research agencies, and if these data are comprehensive and reliable they can suffice.
93. As with private social insurance expenditures, the next step is to estimate the composition of private insurance expenditures by provider and function. In some cases, the same routine data that are collected by regulatory agencies or through industry associations may contain sufficient detail to comprehensively allocate such expenditures. If not, estimation of the composition of private insurance expenditures may need to be undertaken at a later stage together with analysis of the revenues of providers.
94. One element of the expenditures from private insurance can normally be estimated separately from the estimation of the functional and provider composition of treatment expenditures. The SHA requires estimation of expenditures for administration of health insurance (HC.7.2.2). Options include:

DELSA/HEA/WD/HWP(2010)3
28
• A method – In some cases, the insurance schemes are able to report their administrative expenditures, and direct data collection or enquiries are the recommended approach.
• B method – In other cases when direct data reports are not available, the amounts concerned can be estimated as the difference between total premium revenues and total claims expenditures. However, caution is advised when applying the latter method, as it only provides an approximation of actual administration expenditures, and it is possible for the method to indicate a negative expenditure, i.e., for claims expenditures to be more than premium revenues in a given year.
• C methods – If it is not possible to apply the B method using data from all insurance schemes, an alternative is to obtain estimates from the few schemes that can provide such details, and then use these estimates to impute the administrative costs for other schemes, for example by assuming a similar ratio of administrative costs to claims expenditures.
Considerations applicable to both private social insurance and private insurance
95. In many cases, both private social insurance (HF.2.1) and private insurance (HF.2.2) schemes do not routinely collect or report data on the distribution of private insurance claims expenditures by function and provider. In this situation, the problem may be that either the insurance schemes themselves do not maintain the necessary internal information systems, or that they do compile such data but there is no industry-wide collection. If the problem is simply the latter, a purposeful, representative survey of the schemes is recommended (A method). If the problem is the former, then an appropriate substitute maybe a sample survey of actual claims records (B method). A suitably designed survey can represent the best source of data to estimate the composition of these expenditures, and if it is feasible would be more reliable than relying on provider side data. However, such surveys can be resource intensive and will require the cooperation of the insurance schemes themselves.
96. When private health insurance schemes finance medical care by reimbursing patients retrospectively for their out-of-pocket expenditures instead of paying providers directly, there is potential for double counting with household out-of-pocket financing. In this scenario, the financing agent for the expenditure must be recorded as the insurance scheme, and the estimates of household out-of-pocket spending may need to be adjusted by subtracting the amounts that were reimbursed.
97. If insurance reimbursements take place in a different time period to that of the original household out-of-pocket payment, this can cause a measurement error. In principle, all payments should be counted as occurring in the period in which the actual medical service was provided, but it may be difficult to determine from the available insurance data for which period actual insurance expenditures relate to. In practice, this may not be a significant problem, as any errors are likely to cancel each other out, but there may be a small discrepancy from year to year. In health systems where private insurance financing is small, this is a problem that usually will not justify significant efforts to resolve, but in countries where it is significant, the health accountant may need to obtain more detailed data on the timing of medical claims being reimbursed by the insurance scheme.
5.2.3 Private household out-of-pocket expenditure – HF.2.3
98. Owing to the known unreliability and biases associated with household survey data, it is recommended that provider side methods be always included in the methods used to estimate private household out-of-pocket expenditures. More details of such methods are given in the next section that deals with methods relevant to provider types. As will be discussed further, household surveys generally suffer from significant non-sampling biases, so in most cases estimates taken directly from such surveys are not reliable estimates of the level of spending. However, household surveys do vary in the extent of this problem, and so some household surveys perform significantly better than others. Nevertheless, given the potential for bias in all surveys, these guidelines emphasise that when household survey data are used, they

DELSA/HEA/WD/HWP(2010)3
29
should always be supplemented by other data sources that can be used for validation and adjustment purposes.
99. In general, type A methods will use comprehensive and reliable data collected from providers. Type B methods use less comprehensive data, such as sample surveys, collected from providers or which estimate expenditures from the provider perspective using indirect means of triangulation. In certain cases, methods relying on household surveys may also warrant classification as B methods, but generally use of such surveys should be considered as a type C method, although, as discussed later there are methods can be used to adjust the estimates sourced from household survey data.
Out-of-pocket expenditure, excluding cost-sharing (HF.2.3.1)
100. These expenditures, if they occur at providers where no cost-sharing is involved, can be estimated best directly using provider side data. Otherwise if there is an element of cost-sharing in the expenditure flow, this component is best estimated as a residual, by subtracting the cost-sharing amounts from the estimated total household out-of-pocket expenditure flow.
Cost-sharing: central government (HF.2.3.2); state/provincial government (HF.2.3.3), local/municipal government (HF.2.3.4),
101. These expenditures are incurred in the form of official co-payments when households use government-provided or financed services. An example of the former would be official user charges at government hospitals, and an example of the latter would be co-payments for obtaining prescription drugs from private pharmacies, where the government reimburses the pharmacies directly as in the UK. The three-digit categories refer to the specific level of government involved.
102. A method - As discussed in section 5.2.1, this type of cost-sharing is ideally estimated using administrative data generated by the relevant government institutions. If these data are not reported nationally, for example by sub-national governments, then it may be necessary to instigate a regular survey of such governments. The assignment of these cost-sharing expenditures by sub-category will follow the level of government involved.
Cost-sharing: social security funds (HF.2.3.5); private social insurance (HF.2.3.6)
103. A methods – The ideal situations are either when the providers involved are required to report administratively to the insurance funds or some regulatory body the actual amounts collected from insured patients as cost-sharing, or when the amount that is charged as cost-sharing is strictly set and regulated by the insurance schemes or by government. In the first situation, the expenditures can be directly obtained from the relevant data. In the second situation, the cost-sharing amounts can be computed according to the official cost-sharing schedules, if the actual payments by the insurance schemes for the relevant services are known.
104. B methods – In many cases, the amounts that are charged by providers as cost-sharing amounts when patients are covered by social security are subject to provider discretion, i.e., the provider may balance bill over and above any cost-sharing amount set by the schemes. In this scenario, one approach is to use patient survey data to estimate the mean ratio between the actual cost-sharing amounts and those set officially. However, this method is difficult to apply reliably, and will depend on very detailed survey data. Computation effort will also depend on the extent to which the price and cost-sharing schedules of the insurance schemes vary by type of service and provider. An alternative method is to estimate the cost-sharing amounts as a residual, by subtracting the amounts paid by the schemes and other financing schemes from the total revenue of the providers. However, this approach will only work if the providers do not have any source of revenue other than the revenues from treating insured patients.

DELSA/HEA/WD/HWP(2010)3
30
Cost-sharing: other private insurance (HF.2.3.7)
105. A method – The ideal situation is when the providers routinely report such cost-sharing amounts to either government or private agencies, such as the private insurers themselves. However, this does not normally occur, so methods using such data are not feasible in practice.
106. B methods – When type A methods are not feasible, the next best approach is to obtain data directly from the private insurance schemes as to the average level of cost-sharing they impose on their patients. In practice, this may be difficult to obtain directly if the insurers do not routinely track such statistics, and if the level of cost-sharing varies considerably according to the details of the service and patient. In addition, private insurers may vary considerably in their pricing policies between each other, and also across different policies provided by the same firm. An option in this situation is to directly analyze a representative sample of insurance claims records and the provider receipts submitted by patients claiming reimbursement. This will generally require a high level of cooperation from the insurers themselves.
5.2.4 Non-profit organisations serving households (other than social insurance) – HF.2.4
107. Expenditures financed by non-profit institutions (other than social insurance) are poorly measured in current SHA implementations. This reflects the scarcity and lack of comprehensiveness of routinely collected data on non-profit institutions, as well as the diverse modalities by which non-profits may finance health services. Expenditures by non-profits cannot always be comprehensively estimated from data collected from medical providers, since non-profit institutions often self-finance their own activities, or finance non-personal medical services, such as health education.
108. A method – The ideal method is to use data obtained from nationally representative and comprehensive surveys of the activities of non-profit institutions. Such data might also be collected through routine national administrative data collections, and reported in aggregate.
109. B methods – In practice, comprehensive surveys are rare, or the data collected in such surveys may not distinguish health expenditures. In such a situation, consideration might be given to conducting occasional or sample surveys. However, implementing such surveys can be difficult, either because there are no comprehensive lists of non-profit institutions, or because the available listings of non-profit institutions are out-of-date and unreliable. Sample surveys can also face significant sampling errors, if the non-profits are very heterogeneous, response rates are low, and a few non-profits account for a large share of overall expenditures. This type of problem is not insurmountable, but does imply significant investments in the survey design. Nevertheless, partial surveys can provide reliable information, and data on the activities of these organisations might be combined with other data to estimate the level of expenditures.
110. C methods – In the absence of comprehensive data sources that cover the whole non-profit sector, analysts might rely on extrapolation with data collected from a smaller number of larger and better known non-profit institutions. Trends in expenditures at these institutions might be used as a proxy for overall trends in the sector. For example, in many countries, a small number of well-known non-profit institutions account for a large share of overall non-profit expenditures, such as the Red Cross or faith-based organisations. Collection of data on a regular basis using direct enquiry from these organisations is usually feasible, and can support estimation of the trend and level of expenditures by this sub-group on a more systematic basis. These estimates can be supplemented by less reliable sample surveys of other non-profit institutions.
111. Mention is made of an interesting method that has been used in Hong Kong SAR, China, whose social welfare policies and regulations are similar to that of the UK. In Hong Kong SAR, a government

DELSA/HEA/WD/HWP(2010)3
31
grant-funding scheme is a financing source for many non-profit institutions, and these grants are precisely known. A small sample survey was conducted of registered non-profit institutions asking about their overall revenues, including sources, and expenditures. By comparison with the government’s own data on its overall grants to non-profit institutions for health purposes, and by triangulation from the ratio of government grant funding to other funding in the sample institutions, the level of overall non-profit spending is derived.
112. C methods – In the absence of other reliable methods, an option is to use the estimates of expenditures by non-profit institutions compiled for the national accounts or in input-output matrices. This is classified here as a C method, since in most OECD and EU countries, such estimates in the national accounts are based on limited data themselves.
5.2.5 Corporations (other than health insurance) – HF.2.5
113. Corporations can fund healthcare services in a number of ways: (i) direct provision of services, including both patient treatment and occupational health care; (ii) financing of patient treatment provided to their employees by other providers, which involves some type of market transaction; and (iii) donations in kind or of money. For estimating the total expenditure flows associated with the first and third modalities, the recommended approach is to use data collected directly from corporations, i.e., the financing side. These might be obtained from routine economic surveys of enterprises, or though other industry-specific surveys conducted by government or private organisations.
114. A methods – Estimation of total expenditures associated with financing by corporations of medical services provided by other providers faces similar difficulties to those associated with estimating total expenditures by private insurance schemes, i.e., such financing will represent only a portion of total financing of the relevant providers, and in the case of the private providers it is usually more difficult to obtain reliable data on their revenues from corporations than from the corporations themselves. Consequently, the best method in practice will be to use data obtained in regular surveys or administrative data collections from corporations. Other than routine economic surveys of enterprises, other relevant data sources include industry surveys of employee benefits that are carried out in many countries by private organisations, and government surveys of occupational health activities of employers. The treatment of occupational healthcare is discussed in some detail in the Eurostat SHA Guide (SG 122-125). As noted by it, in some countries, certain industries are required to report data on occupational healthcare activities and expenditures, and such data are reliable and comprehensive for the relevant industries.
115. B methods – In the absence of routine data sources, occasional surveys can be conducted of corporations, with interpolation and adjustment procedures used to make estimates for intervening years and non-surveyed corporations. However, such surveys tend to be unreliable, given the likely small sample sizes involved, and in many countries the lack of reliable, up to date registrations of all economic enterprises.
116. C methods – In the absence of other reliable methods, estimates compiled for intermediate consumption in the national accounts or in supply-use tables may be useful. This is classified here as a C method, since in most OECD and EU countries, such estimates in the national accounts are based on limited data themselves, and since the classification of health by purpose used in such estimations often does not fully match the perspective of the SHA.

DELSA/HEA/WD/HWP(2010)3
32
5.3 Methods specific to providers
5.3.1 Private expenditures at public providers (cost sharing)
117. The level and trend of private health expenditures at public healthcare institutions is usually most efficiently and reliably measured by collecting data directly generated by the institutions in their own accounts, i.e., from the provider side. Such private expenditures include household out-of-pocket expenditures for official fees or user charges, and other expenditures from private insurance and private social insurance.
118. A method – In most countries, public sector healthcare institutions must report publicly or to government authorities reliable administrative information on their revenues from non-budgetary sources. If these data are assessed to be reliable and comprehensive, they can provide definitive estimates of the relevant expenditure flows. Suitably categorised, such data also support the estimation of the HF.2.3 category according to its three digit sub-categories.
119. B method – In some instances, there is no centralised reporting of institutional revenues from patient charges. In this scenario, if reliable and representative surveys of the institutions can be conducted, this will be an acceptable alternative, and one that remains superior to potential financing side methods.
120. In most countries where cost sharing at public facilities represents only a small share of overall household out-of-pocket expenditures for health, the use of household surveys is not recommended. The sampling errors can be large, and it is usually observed that survey respondents do not reliably differentiate between payments that are cost-sharing and other household healthcare payments.
121. Although most public sector healthcare institutions that rely primarily on public sector financing will be categorised as non-market producers, thus requiring that expenditures be valued at the cost of production according to SNA rules, private expenditures at these providers should usually be allocated to functions according to the purpose for which they were made. In some cases, the available administrative data will be sufficient to allocate precisely private expenditures according to function and detailed financing source. In other cases it will not be. In their absence, if these private expenditures are small in relation to overall private expenditures, the best measurement approach would be to make estimations based on collection of sample data from the institutions on this aspect.
122. In some countries, public healthcare institutions keep records on the services provided to non-residents, and payments collected from non-residents. In these cases, these data should be collected in order to isolate such expenditures and exclude them from the estimates (A method). However, in many other situations such data are not readily available, and without conducting surveys at these institutions of their patients (B method), it may not be possible to do this.
5.3.2 Expenditures at private hospitals – HP.1
123. A methods – In most countries, the preferred method for estimation of expenditure levels and trends at private hospitals will be to use the provider side approach. Provider-generated data on total current revenues and expenditures on capital formation (HCR.1) may be available from a number of routine data sources, such as national hospital data collections, filings with regulatory authorities for private hospitals, industry surveys of private hospitals, routine enterprise surveys not specific to health, and market research firms. Most of these data are likely to be comprehensive in coverage, and subject to minimal reporting biases. For example, in Poland, estimates of expenditure at private hospitals are based on data collected through annual statistical surveys of enterprises conducted by the national statistical office.
DELSA/HEA/WD/HWP(2010)3
33
124. Although provider-supplied data are often reliable, this is not always the case, and the possibility of distortions in reporting owing to incentives to under-state income should always be borne in mind, when using such national data. The evidence certainly suggests that the extent to which providers report unbiased data on revenues depends on the national context. For example, surveys of provider-reported revenues are generally reliable in many central European countries, such as Bulgaria and Poland (A methods), but such surveys produce highly biased and unreliable data in Korea (C methods). So in practice, the health accountant will need to carefully assess the quality of the data and the reliability of methods using these data.
125. In Switzerland, it is thought that private hospitals often under-report revenues and a correction factor is used to adjust for this. Other practical issues that may be encountered in use of routine data include adjusting for inconsistencies in financial reporting years by private sector institutions, and conceptual differences from SHA definitions in data produced for accounting or tax purposes.
126. One type of provider-supplied data that are commonly problematic are official tax data, which often suffer from downward, reporting biases, so that the use of tax data in many countries might be better classified as a B or C method.
127. Although household survey data are typically subject to reporting biases, carefully designed surveys of patients at private hospitals may produce reliable data. In Korea, experience suggests that systematic sample surveys of patients at private hospitals can produce reliable data on out-of-pocket spending at these providers. In the Korean case, this involves stratifying private hospitals by type and size, and then sampling institutions within each stratum, before sampling patients at the selected institutions to ask about their out-of-pocket expenditures. Estimation using data from this type of survey might also be considered an A method.
128. B method – If reliable and representative routine hospital data are not available, sample surveys of private hospitals can provide a substitute data source on aggregate revenues and expenditures on capital formation. However, the feasibility of this will depend on the availability of comprehensive registrations of the private hospital population, and the willingness of private hospitals to provide data.
129. Provider-supplied data usually allow reliable measurement of the gross revenues of private hospitals. However, these expenditure totals must be reviewed carefully, as gross revenues may need further adjustment to match the SHA scope. Specifically, adjustments should be made for revenues from non-health production (e.g., providing laundry and car parking services), production of services that are intermediate production for other health care providers (e.g., laboratory services for other private providers), and revenues from providing services to non-residents. These expenditure items should be subtracted from the estimates of gross revenues.
130. One complication that may be encountered in estimating private expenditures at hospitals is when private doctors admit and treat patients at these hospitals, and bill for their services independently. Such a situation is found in many countries, and in these cases the patient payments for the physician’s time do not pass through the hospital’s financial accounts, and are not reported as hospital revenues. In the SHA framework, such payments can be considered expenditures for inpatient care, but the provider is not the hospital, but the medical specialist or doctor. The health accountant should be aware of this possibility, as it both complicates the interpretation of data, and adds to the challenges for estimation. First, household surveys of health spending often do not distinguish between patient payments to hospitals and those to independent doctors working at the same hospitals, and thus such household data may over-estimate the payments actually made to hospitals. Second, it can be difficult to obtain any data on the payments made to doctors in this situation, as the problem is analogous to the problem of estimating revenues of private doctors clinics with added complications. In some countries, data are available for these payments, as this
DELSA/HEA/WD/HWP(2010)3
34
information is collected in order to estimate DRG prices. When these data are available in this way on the basis of systematic collection, use of these data can be considered an A method. B methods might rely on household survey data to estimate the likely amount of overall payments at hospitals for inpatient care, and then use insurance claims data, if available, to estimate the proportion of typical hospital expenses that are incurred directly with doctors. Other options in the absence of specific data include eliciting expert opinions on the share of a typical hospital admission bill that is paid directly to the doctors (C method).
5.3.3 Expenditures at private providers of ambulatory care, including physicians – HP.3
131. A methods – If particular types of ambulatory providers are financed exclusively or predominantly from organised financing schemes, such as social insurance or private insurance, the recommended approach to estimating their expenditure flows is to use financing side methods, i.e., estimate the expenditure flow using data collected from the financing schemes. However, when these providers are largely financed by out-of-pocket payments by households, estimation of the household expenditures can be challenging.
132. B methods – If reliable data from organised financing sources do not provide an adequate solution, a possible substitute method is to use provider side data collected directly from the providers themselves. Some countries cover such providers in regular business or enterprise surveys. If the surveys contain a large enough sample of medical and dental clinics and the data are considered reliable, they may potentially be a source of such provider side data. The alternative is to conduct a survey of private practitioners to directly estimate their revenues. However, these surveys are very difficult to carry out properly (PG 7.55), as they frequently face problems such as lack of cooperation from practitioners, lack of reliable sampling frames, and incentives for respondents to misreport. However, if best practice principles in survey design are followed, it may be possible to obtain useful data from such surveys. Such design considerations include minimising respondent burden, providing credible guarantees of data confidentiality, asking information in a way that the respondent can understand and provide, and paying attention to questionnaire design. Even if the potential for under-reporting cannot be eliminated from such surveys, data collected in such surveys on a routine basis can still be very useful for providing information on the trend in expenditure flows, and in providing a lower-bound for the expenditure estimates.
133. In most countries, ambulatory providers, such as doctors or dentists, must pay taxes on their income. However, in many countries use of data collected by tax authorities to estimate the level of provider income is not recommended, because of significant problems of under-reporting of income for tax purposes, representativeness of tax sample data that might be provided by tax agencies, as well as difficulties in differentiating health related income from other income in tax data. Nevertheless, tax data may still be useful to assess the trend in income of private practitioners.
134. C method – If the recommended methods are not feasible, then the estimates may have to rely on use of household survey data. This is the most unreliable method that can be used. Further discussion of such estimations and the problems in using household survey data are discussed in the next section.
135. Whatever methods are used, care should always be taken to take account of payments to private providers of ambulatory care, which are not assigned to households as the financing agent. If payments are made directly by third-parties, such as insurance schemes or employers, or if payments are made first by households who are later reimbursed by an insurance scheme, these payments must be subtracted from the gross revenues of private providers (and also from household survey estimates of out-of-pocket spending) in order to obtain the correct estimate of household spending.
DELSA/HEA/WD/HWP(2010)3
35
5.3.4 Sales of pharmaceuticals through retail outlets – HC.5.1 and HP.4
136. The retail sale of medicines through retail outlets, such as pharmacies and shops, corresponds to the HC.5.1 functional category and the HP.4 provider category. In most countries, it comprises a large proportion of household out-of-pocket spending.
137. A method – Experience across a wide range of countries shows that the most reliable and efficient method of estimating the level and trends in expenditure flows for sales of pharmaceuticals from retail outlets is to use industry data on retail sales, i.e. provider side methods. In many countries, including almost all OECD economies, retail sales of pharmaceutical products are routinely tracked and monitored either by the pharmaceutical industry or must be reported to government registries. If these data are detailed enough, they can also support the disaggregation of HC.5.1 expenditures into its subcategories HC.5.1.1 and HC.5.1.2. The quality, regularity and reliability of the industry-generated data are often high, as reliable sales data for pharmaceutical products are vital information of the marketing activities of most pharmaceutical firms.
138. These industry data sources on retail sales are usually very specific in their coverage, restricting their scope to a defined range of products. Consequently, when these data are used, it will not be necessary usually to separate out revenues for non-pharmaceutical products at these providers from their total revenues. However, adjustments may be necessary if the product range does not exactly correspond to SHA requirements, e.g., sales data exclude vaccines and vitamins.
139. One important industry source for this information is market research firms that have established an extensive infrastructure in many countries for routinely collecting and publishing these data. The most notable of these firms is IMS-Health (http://www.imshealth.com). When using this type of information, the health accountant should - as with any data source - assess how the data were collected and identify any limitations. Although this type of industry data can be of high quality, it may need to be adjusted to take into account non-coverage of certain pharmaceutical products and certain sales channels, and, in some cases, the size of the samples used to produce the estimates may be associated with significant sampling error. It should be noted that the commercial firms who produce this type of data can usually supply comprehensive information on their quality assurance procedures and assessment of their own data.
140. B method – In the absence of reliable industry data on retail sales, a less optimal alternative is to estimate pharmacy retail sales using data on the manufacture, import and export of pharmaceuticals in the country. Such alternative estimations might also be done to corroborate the estimates obtained from the industry sources mentioned above. However, this is not an easy exercise to do well, as it requires knowledge of the mark-ups at various points in the distribution system from the factory gate to the retail sales point, as well as the ability to adjust for unrecorded flows of pharmaceuticals, for example, due to smuggling or unregulated production (see PG 7.57). In general, the difficulties of making such estimates reliably are usually under-estimated, and health accountants are advised to embark on such an analysis with caution.
141. C methods – In the absence of any industry data to support A or B methods, household surveys represent the last resort. However, in almost all OECD and EU member states, this scenario does not arise. Any such estimates should be treated with caution about the likelihood of substantial non-sampling errors and biases.

DELSA/HEA/WD/HWP(2010)3
36
Table 2. Summary of methods specific for estimating expenditures by private financing agents
HF code Financing agent A methods B methods C methods Notes HF.2.1 Private social insurance Direct data collection from all schemes
or regulatory agencies, or from representative surveys of the same
Data collected non-representative surveys of schemes or employers, with adjustment for non-coverage
Household survey data on coverage by such schemes and household medical costs covered by such schemes
Sample surveys of transaction records for composition of expenditures by function and provider
HF.2.2 Private insurance Routine data returns to regulatory agencies or equivalent data collected by industry associations
Surveys of insurance schemes conducted directly or using industry agencies as data collectors
Composition by provider and function might use industry/regulatory data or analysis of claims data
HF.2.3 Private out-of-pocket expenditures
Refer other methods
HF.2.3.1 Private out-of-pocket expenditures excluding cost-sharing
Direct data collection from relevant providers where no cost-sharing expenditures occur
Estimated as residual after subtracting cost-sharing amounts from total household expenditure flow
HF.2.3.2, HF.2.3.3, HF.2.3.4
Cost-sharing: government institutions
Computation using administrative data collections from relevant government institutions
HF.2.3.5, HF.2.3.6
Cost-sharing: social security funds; cost-sharing: private social insurance
Administrative data returns by providers to funds or regulatory agencies of actual cost-sharing amounts, or computation from official cost-sharing schedules set by insurers if these are uniformly applied
When cost-sharing amounts charged are subject to provider discretion, use patient surveys to estimate ratio of actual cost-sharing amounts to officially set amounts
HF.2.3.7 Cost-sharing: other private insurance
Direct data collection from private insurance schemes of the average level of cost-sharing imposed, or analysis of representative samples of insurance claims records and patient receipts
HF.2.4 Non-profit organisations serving households
Nationally-representative, comprehensive surveys of non-profit institutions or routine national administrative data collections from such institutions
Special purpose, occasional sample surveys of non-profit organisations, with or without stratification by size
National accounts estimates of expenditures by non-profit institutions
HF.2.5 Corporations Routine surveys or administrative data collections of enterprises, or industry or employer surveys of employee benefits
Special purpose, occasional surveys of enterprises, with interpolation for non-covered enterprises and intervening years
National accounts estimates of intermediate consumption

DELSA/HEA/WD/HWP(2010)3
37
Table 3. Summary of methods specific for estimating private expenditures at providers
HP code Provider A methods B methods C methods Notes - Public providers – all types Administrative data returns by public
institutions of revenues from non-budgetary sources, where reliable and comprehensive
Representative surveys of relevant institutions, when there is no routine administrative reporting mechanism
HP.1 Private hospitals 1. Routine or administrative financial returns generated by private hospitals to regulatory authorities or in routine industry surveys 2. Carefully designed sample surveys of patients at private hospitals
1. Special purpose, occasional sample surveys 2. PQ method
Household survey data, with adjustment for reporting bias
Reliability of responses in voluntary surveys of private institutions should always be evaluated
HP.3 Private providers of ambulatory care
Data from financing schemes, when these providers are exclusively financed by such organised financing sources
1. Routine national surveys of business enterprises, if these contain large enough samples, or special purpose surveys. 2. PQ method
Household survey data, with adjustment for reporting bias
Reliability of responses in surveys should always be evaluated
HP.4 Sales of pharmaceuticals through retail outlets (HC.5.1)
Industry data on retail sales, generated through well-established, organised data collection procedures, such as those operated by specialist pharmaceutical market survey firms
Estimation by analysis of data on manufacture and trade of pharmaceuticals, and information on retail margins
Household survey data, with adjustment for reporting bias

DELSA/HEA/WD/HWP(2010)3
38
6. METHODS SPECIFIC FOR ESTIMATION OF HOUSEHOLD OUT-OF-POCKET EXPENDITURE
6.1 Determining when and how to use household survey data
142. Estimation of household out-of-pocket expenditures (HF.2.3) is most frequently the largest source of problems for health accounts estimations. Given the well documented and studied problems of reporting bias in household surveys, the best methods for estimating household out-of-pocket spending are those that exploit reliable data generated on the provider side. For the reasons discussed earlier in Section 3.1, use of household survey data to estimate out-of-pocket spending is not recommended.
143. The previous section has reviewed how provider side data can be used to estimate specific items of spending. In some cases, this will be sufficient to generate reliable data on the level, trend and composition (by functions) of household out-of-pocket spending. In other instances where data on actual household payments are missing but the total expenditure flow is known and reliable data on the contributions of other financing schemes are available, the household out-of-pocket spending component of the expenditure flow can be reliably estimated as the residual element, after subtracting those expenditures accounted for by the other financing sources (Section 4.4.2).
144. Nevertheless, there may be insufficient provider side and financing scheme data to enable reliable estimation of all household out-of-pocket expenditures using A or B methods. In these situations, which must be minimised to the maximum extent possible, household survey data may represent the last resort. This is most likely to occur when the expenditures occur at non-institutional or informal providers, such ambulatory care providers. The following paragraphs provide more detailed guidance on how to use household survey data in such scenarios.
6.2 Types of household surveys
145. Not all household surveys are the same. It is important to differentiate the major types of household survey data, and understand the issues associated with their use. The following are the three major types of household survey that may be relevant for estimation of health accounts. The WHO Producers Guide provides a more comprehensive listing and discussion (refer PG chapters 6-9).
6.2.1 Household budget surveys
146. These are general surveys of household consumption or expenditure. They are available in most countries on a regular basis (annual to five yearly is the most common pattern), and are most often conducted with the primary purpose of constructing consumer price indices and examining the distribution and composition of consumption and income.
147. For the purpose of health expenditure estimation, these surveys are most useful in providing general indicators for the weight of health expenditures in overall household consumption, and the relative shares of different components of household spending for healthcare services and goods.

DELSA/HEA/WD/HWP(2010)3
39
6.2.2 Specialised surveys of household healthcare utilisation and expenditure
148. These are surveys that focus on healthcare use and expenditures, usually linking the questions on expenditures to the responses indicating some healthcare use. In some countries, such as the USA, such national health surveys are conducted on a periodic basis, but in others they are conducted if at all only as part of special projects or research studies. Sometimes, a household general budget survey may also contain a special module devoted to health care use and expenditure.
149. These surveys are potentially useful in that they allow estimation of the rates of use of healthcare goods and services, as well as the estimation of their prices. This information may support the validation of survey estimates of household out-of-pocket spending.
6.2.3 Specialised surveys of household health care utilisation only
150. These differ from the previous category in that they collect information only on healthcare use, and not on actual expenditures. However, for reasons discussed below, these surveys might still be useful for estimating health expenditure. In particular, they may be useful in validating estimates of the rate of use of health care services.
6.2.4 Diary surveys
151. One approach that is sometimes used to reduce sampling bias and under-reporting in surveys is the use of diary methods. In these surveys, respondents are asked to maintain a diary to record all expenditures prospectively during a defined time period. As an example, the Social Economic Survey on Urban and Rural Residents conducted by the National Bureau of Statistics in China uses this method to record all expenditures of 118,000 households.
152. Although such an approach might seem a robust way to prevent under-reporting or recall errors, this is not actually the case. For example, the regular diary-based household budget survey in Hong Kong SAR was found to be associated with a significant degree of under-estimation of overall household expenditures, and in addition the reporting errors were found to vary systematically by type of consumption item (Grootaert et al. 1982). Such findings are not surprising, since survey research since at least the 1960s have found that consumer diaries can be subject to recall losses of up to 40-50%. Later research has shown that reporting levels decrease in diary surveys with time, and that best results are obtained only with short periods. However, compared with normal household interview surveys, diary methods seem to improve reporting of smaller, less salient expenditures (Silberstein and Scott 2004). Consequently, diary methods should not be considered as free of reporting biases, and as in any other survey their data must be carefully evaluated for evidence of bias
6.2.5 General limitations in coverage of household surveys
153. Household surveys tend by design to sample households from the general population, drawn using standard national sampling frames. Two major limitations in such surveys are noted, as they can contribute to coverage bias in all of the above types of household surveys. First, the sampling frames or the field design of the surveys will in most cases exclude both households and individuals in the institutionalised population, i.e., those living in hospitals, nursing homes, other elderly care facilities, prisons and military institutions. Such omission can and does lead to under-estimation of healthcare expenditures and service use, since these are often higher in institutionalised populations. It will also lead to a gross under-estimation of expenditures on long-term care services in most countries. In practice, the best solution to this problem will be to supplement general population surveys with targeted surveys of the institutionalised population. The second limitation that is noted is that in many countries either gaps in the sampling frame or the design of the sampling itself lead to under-sampling of richer households. Since in

DELSA/HEA/WD/HWP(2010)3
40
most countries, such households tend to account for a disproportionate share of overall household health expenditures, this can result in a general underestimation of healthcare events and spending in these surveys.
6.3 Assessing reporting biases in household survey data
154. As previously discussed, the major problem in using household surveys of household spending for estimating health accounts is the prevalence of significant reporting biases or non-sampling errors in most surveys. Despite this, surveys can still be valuable in providing information on the composition of expenditures, and if the non-sampling errors can be adjusted for, they can also be useful for estimating the level and trends in spending.
155. Consequently, before using household surveys as a data source for health accounts estimation, each survey should be systematically assessed to identify potential errors, biases and weaknesses, and whether these problems are of relevance to the measurement problem of interest. If the survey might still be used, the next step is to quantify, where possible, the potential size of such errors or discrepancies with other data sources, and to determine whether these can be adjusted for. In doing so, it is advisable to start first by examining discrepancies in aggregate healthcare expenditure, and follow by more detailed evaluation of discrepancies in estimates for specific items of healthcare expenditure. The following are some important general considerations:
(i) The number of events forgotten increases proportionately with the length of the recall period. (ii) Events with less salience or impact on the individual are more likely to be forgotten. (iii) Proxy respondents tend to report 20% fewer events.
156. The exact wording of questions used in a household survey is important. The wording of questions can significantly influence the responses, and may alert the health accountant to differences between the scope of the survey items and those of interest to the health accountant, as well as the possibility that some questions may have been misinterpreted by respondents.
6.3.1 Cross-validation using national accounts
157. For general household budget surveys (or other focused healthcare expenditure surveys which also attempt to measure total household spending), first assess the validity of the estimates of overall household expenditure by comparing the survey estimates of mean per capita expenditure with the estimates of per capita household final consumption as measured in the national accounts. In most countries, this is a close equivalent; differences will depend on whether private final consumption differentiates between households and non-profit institutions serving households, and the treatment in surveys of items such as owner-occupied housing. As noted by Deaton (2003) in his analysis of data from 127 countries, consumption as measured in these surveys is typically lower than estimated in the national accounts. The average level of consumption per capita in the household surveys was only 86% per cent of that estimated in the national accounts, and the discrepancy was greater in OECD economies (population weighted mean was 72%) than in African economies. Deaton also notes that in many OECD economies, such as the UK and USA, the discrepancy is actually increasing over time, and not reducing.
158. At the same time, it is often noted that the discrepancy is consistent over time within a country, demonstrating that systematic errors play a significant role in the differences observed. The reasons for such systematic differences between countries in the size of the discrepancy might be explained by the different structure of consumption in different countries, differences in the survey methods and questions used, and the varying extents to which the respective national accounts have incorporated the use of integrative methods in the estimation of general household consumption.

DELSA/HEA/WD/HWP(2010)3
41
159. For most countries, particularly OECD and EU countries where the methodological quality of the national accounts can be considered high, the national accounts estimate of aggregate household consumption must be taken as the best estimate of household expenditure, since the national accounts estimation methods should have taken into account all the available information, both from the consumption and production side. Such an assumption also ensures consistency with the national accounts, since a key question in most health accounts estimations is relating total expenditure on health to the gross domestic product. In other countries, where there may be concerns about the quality of methods used to prepare the national accounts, there may be value in re-assessing the reliability of those methods.
160. If there is a difference between the survey and national accounts estimates, it should alert the health accountant to potential gross biases in the survey estimates. Clearly, if the estimate of overall survey estimate of household expenditure is different to that in the national accounts, then the survey’s estimate of household health expenditure cannot be assumed to be somehow unaffected by any bias that affects the overall survey estimate. In this situation, there are still two different estimations of household healthcare expenditure that can be derived using the survey data:
(i) The direct estimate, which is simply the per capita expenditure level reported in the survey. (ii) The indirect scaled estimate, which is obtained by scaling the household survey estimate to
match the national accounts estimate of household consumption. This is done by multiplying the survey expenditure figure for health spending by the ratio of the national accounts estimate of household expenditure to the survey estimate of aggregate household expenditure.
161. In the event of significant discrepancies between the national accounts and the household survey, the indirect scaled estimate is to be preferred for further analysis, as it is based on weaker assumptions than the direct estimate. The direct estimate makes the assumption that the reporting of all non-health care goods and services was biased, but that this bias did not apply to healthcare goods and services expenditure. The indirect scaled estimate makes the weaker assumption that any bias in the reporting of healthcare expenditures was no different to the bias in the reporting of all aggregate household expenditures.
6.3.2 Cross-validation using utilisation rates
162. Specialised household health surveys can link healthcare use and expenditure. In these, the estimate of expenditure can be decomposed into two elements – volume and price. Volume is the number of visits made in the survey recall period to any healthcare provider, and price is the amount paid by the household for the average visit. Expenditures are by definition the product of the mean number of visits made to all healthcare providers and the mean cost of each visit, that is:
Expenditure, E = Volume (V) * Price (P) 163. With these surveys, three aspects of the expenditure can be potentially cross-validated:
(i) Total healthcare expenditure; (ii) Volume of visits; (iii) Price of visits.
164. Validation of the first (total healthcare expenditure) should be done using the same procedure as described earlier for any household expenditure survey. Comparison of the total spending can be made directly with all other available household expenditure surveys.

DELSA/HEA/WD/HWP(2010)3
42
165. Validation of the volume of visits might be made by reference to reliable administrative data generated by providers, where available. If these are not available, then consistent with the recommended integrative approach, the health accountant might assess all the data sources, and determine a balanced estimate of the actual volume. In most countries, reliable administrative data generated by healthcare facilities do exist, for at least some types of provider, typically in the public sector. In a few countries, another source of reliable data is the national social health insurance system. It does not matter if the available administrative data do not cover all types of provider, as long as the household survey data on visit numbers distinguishes between the type of provider, and it is possible to compare the visit numbers for one or more types of provider using both data sources. Care should be taken when doing this to distinguish between ambulatory and inpatient visits.
166. Validation of the price of visits is generally more difficult, except in instances where national social health insurance systems mandate standard prices or have good data on the gross fees paid by patients. In some countries, it is possible to compare the average price of a visit to a physician’s clinic with data collected from surveys of such providers.
167. If the comparison of the volume estimates with independent verifiable data reveal a significant difference in visit rates for one or more types of provider, then the health accountant must consider this as strong evidence that the overall number of visits reported in the survey is biased, and thus that the overall expenditures reported are also biased. However, in many instances it is reasonable to believe that whilst visit numbers may be biased, that the average price per visit is not subject to a bias as large as with the visit numbers.
168. The procedure just described of estimating the expenditure flow for a particular healthcare service by balancing household and provider data on the volume of healthcare services produced or consumed is in fact conceptually consistent with the “commodity flow method” used in the national accounts. Adopting this approach where appropriate and relevant in health accounts has the advantage that it would bring methodological standards in health accounting work closer to those in the national accounts.
6.4 Estimating household expenditures in the absence of reliable provider data
169. Having assessed the likely biases, household survey data should be adjusted where necessary in order to be used with greater confidence to generate preliminary estimates of out-of-pocket spending. These estimates may then be combined with other information to derive final estimates of household out-of-pocket spending (HF.2.3) for the health accounts.
170. The following paragraphs suggest three methods for estimating components of household out-of-pocket spending, when reliable provider data are not available or are not complete, and where household survey data might be of value. The first two methods can be considered to be type B, and the third type C.
6.4.1 Price and quantity (PQ) method
171. This is a type B method, and is most useful for estimating expenditures for ambulatory care, such as at physicians and dentists. It relies on the fact that expenditures are, in fact, the product of the mean number of visits made to all healthcare providers and the mean price of each visit, i.e.:
Expenditure, E = Price (P) * Quantity of visits (Q)
If both of the two elements on the right hand side can be reliably estimated, then total expenditures can be reliably derived. Note that the price referred to here is the mean price for a visit by all persons, and so this reflects the cost of both cheap and expensive visits.
DELSA/HEA/WD/HWP(2010)3
43
172. The identity between prices, quantity and expenditure can be exploited when the available household survey data permits decomposition of the household expenditure into visits made to providers and the amounts paid for each visit, and when the providers are identified by type. In this scenario, the health accountant can separate the task of estimating the expenditure flow into two components: (i) estimating the volume of visits, and (ii) estimating the mean price of visits. This is advantageous since it can be assumed that the errors associated with the first are different to the errors associated with the second.
173. To apply this method, the health accountant must obtain independent and reliable data on the number of patient visits made to certain types of provider, if not all. Examples of these other data sources include (i) national data collections from providers, (ii) administrative data produced by social insurance schemes on visits made to providers financed by the insurance schemes, and (iii) estimates of visits based on surveys of the providers themselves. Household survey data can also be used; if the number of actual visits to a given set of providers is reliably known, then the number of visits to other types of provider can be estimated by simply scaling the household survey estimates of visit numbers by the ratio between the two data sources, that is,
Visits to Provider B = Visits to Provider B as reported in survey * (Visits to Provider A as reported from provider data/Visits to Provider A as reported in survey)
This method makes the assumption that the size of any non-sampling errors that affect the reporting of
visits to providers in the household survey is equal across all types of provider.
174. Obtaining reliable data on the price of visits is generally more difficult, except in instances where public insurance schemes have good data on fees paid by patients, or when prices are effectively mandated and controlled by authorities. In some countries, it is possible to estimate the average price of a visit to a physician’s clinic with data collected from surveys of such providers. When doing this it is important to focus on the concept of a mean price, which is not the same as the typical or median price. The mean price is the average price paid by all patients for all types of service at these providers. In the absence of such data, household survey data might be relevant. One assumption that can be made is that much of the error associated with reporting of household healthcare expenditures in a household survey involves the misreporting of how many visits took place. When individuals do recall that a visit took place, they tend to more reliably recall how much it cost. If this assumption that the error is largely related to the number of visits is correct, then the health accountant might simply assume that the estimated mean price reported in the household survey is correct. The caveat to this assumption is that the visits that survey respondents forget may tend to be less costly than average.
175. Once the estimates of price and quantity are obtained, the estimate of household out-of-pocket expenditure is directly derived as the product of both. After this, the health accountant can turn to validation of these estimates using other data sources and common sense.
6.4.2 Aggregate scaling method
176. This method can be applied when the available household survey data provides estimates of the aggregate expenditures made at different types of provider, and where the gross payments made to one or more types of provider are known from other independent and more reliable data sources. In this scenario, the ratio of the more reliable data source to the household survey estimates of aggregate payments at that particular type of provider is used to adjust the household survey estimates of aggregate payments at the

DELSA/HEA/WD/HWP(2010)3
44
other types of provider. If the ratio of the former to the latter is high (>1), then this method can treated as a type B method, but otherwise it should be regarded as a type C method.
177. For example, there may be three types of provider, A, B and C, of which more reliable administrative data on gross revenues are available for provider type C (estimate CX). Estimates of aggregate expenditure at all three types of provider are available from the household surveys (estimates AH, BH, CH). Then if the independent estimate of gross revenues at provider type C is considered reliable, then the estimates of gross revenues at provider types A and B could be calculated by:
Expenditures at providers types A and B = (Estimate AH + Estimate BH) * (Estimate CX / Estimate CH)
6.4.3 Using household survey data to estimate residual items of out-of-pocket spending by assuming reporting bias is equal across items
178. This is a type C method. In practice, there will usually be a final list of private expenditure items for which neither reliable provider side nor reliable financing scheme data are available. Types of expenditure that commonly fall into this category include expenditures for dentists, services of paramedical practitioners, traditional medical providers, goods and services, unqualified or unlicensed medical practitioners, and purchases of medical durables. In these cases, the only available data sources may be household survey expenditure data.
179. Fortunately, if the methods discussed above, including the integrative approach combining provider and financing scheme data sources, have been used to obtain more reliable estimates of most items of household health spending, the health accountant is in a much better position to adjust for the potential errors associated with the available household survey expenditure data. The main problem with the use of household survey data, as has been emphasised in these guidelines, is the existence of bias due to non-sampling error. A large part of this bias is systematic and will affect all items of expenditure in a survey to more or less a similar extent.
180. If reliable estimates have been compiled for some items of household spending by reference to more reliable non-household survey data, then it is possible to use this information to make reasonable inferences about the size of the bias affecting the other items reported in the household survey data. The larger the number of items of household expenditure that the health accountant has been able to estimate using other independent data sources, the more reliable and robust this approach will be.
181. Consider a situation where there are five different items of household expenditure, X1, X2, X3, X4 and X5. There is a household survey that reports expenditure levels for these items, i.e., h1, h2, h3, h4 and h5. However these household survey estimates are considered unreliable measures of the actual levels of spending. Using a combination of type A and B methods and the integrative approach, it is nevertheless possible to obtain reliable best estimates of the first three of these expenditures, that is x1, x2 and x3. However, there are no independent data sources available to measure the last two items, and the only available data source is the household survey, which has been assessed as an unreliable measure of the level of spending. In this situation is it possible to combine the information obtained in estimating the first three items with that in the household survey to obtain a more reliable estimate of the last two items. This can be done by assuming that the average bias or level of over or under-reporting in the household survey data for the last two items is the same as for the first three items. In that case, the best estimates for the last two items are given by:
DELSA/HEA/WD/HWP(2010)3
45
x4 = h4 ∗
(x1 + x2 + x3)(h1 + h2 + h3)
and
x5 = h5 ∗
(x1 + x2 + x3)(h1 + h2 + h3)
.
182. The critical assumption here is that the bias or discrepancy for each item in the household survey is the same. However, this is not in practice the case, since the bias usually systematically varies between different items. However, in the absence of any information as to the relative size of the bias for different items, this approach should result in the best possible estimates for the other items. Nevertheless, if there is some information on the size of the relative biases, the health accountant might adjust the estimates accordingly.
183. In many SHA implementations using this approach, health accountants are able to estimate 60-75% of overall household out-of-pocket expenditures without relying on household survey data as the primary source of information (Figure 1). This leaves only a residual list of items for which household survey data may represent the only available source of information. By comparing the household and alternative estimates for the 60-75% of expenditures, for which more reliable estimates are available, it is possible to derive one or more adjustment factors to apply to the remaining items of expenditure collected in the household survey data. At its simplest, this would be the ratio of the independent estimates of the first set of items to the household survey estimate of the same items.
184. Figure 1: Extent of use of non-household survey data in estimation of out-of-pocket expenditure in recent SHA implementations

DELSA/HEA/WD/HWP(2010)3
46
Figure 1. Extent of use of non-household survey data in estimation of out-of-pocket expenditure in recent SHA implementations
Bangladesh Sri Lanka
Hong Kong SAR, China Canada
Hospitals
Residential care facilities
Pharmaceuticals
Medical supplies
Others10%
Dentists20%
Government hospitals
Pharmaceuticals
Others16%
Private doctors6%
Private hospitals
NGO user fees
Public sector user fees
Private medical practitioners
Other practitioners2%
Western medicines
Private hospitals
Traditional medicines7%
Other goods and services
20%
Public sector user fees
Private hospitals
Western medicines
Other practitioners18%
Private medica
Other goods and services
6%
Traditional medicines10%

DELSA/HEA/WD/HWP(2010)3
47
7. PRODUCING FINAL ESTIMATES OF PRIVATE EXPENDITURE BY RECONCILING AND INTEGRATING ESTIMATES
185. The previous sections have outlined the recommended approach to compiling and assessing data sources, and estimating specific items of household expenditure. This section provides guidance on how individual estimates of expenditure and other relevant data might be combined and reconciled to produce a final estimate of overall household out-of-pocket expenditures.
7.1 Estimation of expenditures as a time series
186. It is strongly recommended that since most relevant data sources are not available on an annual basis, that the focus of the health accountant should be to estimate household expenditure as a time series of linked individual year point estimates, and not a single year estimate in isolation to estimates for other years. This represents best practice. It has the added benefit that most policy-makers and users are more interested in the trend in spending than in the actual level.
187. In estimating an expenditure flow as a time series, it is important to recall that different data sources can be valuable in two different ways: (i) they can provide information about the trend in expenditure, and (ii) they can provide information about the level of expenditure. In addition, even if data are thought to be biased, for example, tax data for private doctors may under-estimate their real revenues, they can still be useful by providing information as to the upper and lower bounds of an expenditure.
7.2 Organisation of data
188. Most health accountants eventually organise and compile their estimates using spreadsheet or database packages. It is recommended that initial development of SHA estimations of household out-of-pocket expenditures should rely on spreadsheet software to organise the various data sources and estimates, instead of attempting to work with database packages. The benefits are that most estimates of spending cannot be based on type A or B methods, and must be derived through a process of reconciliation. It is easier to visualise and manipulate data during a reconciliation process in a spreadsheet than in a multidimensional database application. In countries where estimation of household expenditure is a major component of the health accounts, it is recommended that a separate set of spreadsheets should be maintained for estimating these expenditures.
189. Depending on the particular approach chosen, most of the initial data collected for a health account will relate either to financing sources or to providers. This will tend to dictate the general organisation of a spreadsheet: whether the data should be organised by funding source or by provider (SG 4.5.2). However, in the case of household expenditure, where it is important to systematically reconcile data from both the financing and provider sides, it is often better to organise the spreadsheets according to the major components of household expenditure, for example, private hospital spending, purchases of medicines from pharmacies, government user charges, etc. These can be arranged according to one dimension of the spreadsheet, either in a vertical or a horizontal direction. The other dimension of the spreadsheet is most usefully reserved for organising the data by year. This then allows easy visual comparison of data sources from different years, and by component of spending. Table 4 is an example that illustrates this.

DELSA/HEA/WD/HWP(2010)3
48
Table 4. Organisation of data in a spreadsheet example
Item Data source Comments Year 1 Year 2 Year 3 Year 4 Cost sharing at government facilities
Treasury records
Believed to be accurate $100 $105 $107 $102
Household survey
Small amounts – large sampling error $220
Pharmacy sales at retail price
Market research firm
Reliable, but excludes vitamins $900 $920 $925 $940
Industry association
Estimated from wholesale data $850 $870 $890 $880
Household survey
Subject to non-sampling bias $1,200
7.3 Reconciliation and integration of the estimates
190. As suggested earlier, it is best to separate the task of estimation into estimating individual components of household spending. Each of these components can be separately displayed in the spreadsheet, and estimation can proceed on a step-by-step basis, in which the first step is to finalise those expenditure items that are known with high reliability, followed by those for which some data are available. Those expenditure items for which few data are available should be finalised last. Estimation can start by entering those estimates for which there is a high degree of certainty, and for which no data reconciliation is necessary or appropriate.
191. If there are gaps in the time series for the initial items owing to missing data or unavailability of the data source for that year, then these can be filled through an appropriate process of interpolation or extrapolation (see PG D.02-D.21 for more detailed description of methods). This process of data imputation to fill gaps in a time series should always occur when the any set of numbers is finalised for a particular set of years. In doing this, the health accountant should be mindful about being consistent in the underlying assumptions and in the choice of control variables, indicator series and inflation measures used (PG D.08-D.21), so that there is overall consistency between the estimates for different expenditure items. The appropriate set of indicator series or inflation measures will depend on the expenditure item and specific circumstances of the country. Examples that are commonly used in existing health accounts include nominal private consumption as reported in the national accounts, nominal GDP, and the GDP deflator or equivalent price measure. Note that none of these are simply population measures. When dealing with trends in household spending, it is useful to bear in mind that the most relevant macro-variable is not the gross size of the population but its overall purchasing power, which will reflect changes in real income levels, the composition of the population and other factors.
192. The process of interpolation is also important in allowing data sources that are for different years to be combined to produce an integrated estimate. This is illustrated in the following schematic example, which presents the hypothetical estimation of household out-of-pocket expenditures at private dentists. As shown in Table 5 in this example, there are four different data sources available to estimate this expenditure item, but they are not available for all years. By a process of interpolation using appropriate indicator and inflation measures, it is possible to extend each of the original estimates to produce the parallel estimates shown in Table 6.
Table 5. Estimation of Private dentists' revenues by integrating multiple data sources: original data
Data source Comment Year 1 Year 2 Year 3 Year 4 Year 5 General household Under-estimate $500 $900

DELSA/HEA/WD/HWP(2010)3
49
expenditure survey when compared with national accounts
Specialised household health expenditure survey
Possible over-estimate according to key informants
$1,200
Tax department data Likely to be under-reported $260 $285 $345 $410 $470
Dental Association Survey
Excluded dentists who not members $1,000
Table 6. Estimation of private dentists' revenues by integrating multiple data sources: original data plus imputations
Data source Comment Year 1 Year 2 Year 3 Year 4 Year 5 General household expenditure survey
Under-estimate when compared with national accounts
$500 $600 $700 $800 $900
Specialised household health expenditure survey
Possible over-estimate according to key informants
$1,000 $1,200 $1,400 $1,600 $1,800
Tax department data Likely to be under-reported $260 $285 $345 $410 $470
Dental Association Survey
Excluded dentists who not members $700 $1,100
193. As noted in the comments, the tax data and general household expenditure survey data are thought to be under-estimates. However, they provide good information on the trend in expenditures. On the other hand, the specialised household survey is thought to be an over-estimate following the preliminary assessment. At the same time, the estimates from the Dental Association are thought to be of high quality, but subject to a small amount of underestimation since they do not include dentists who are not association members. Taking all these into account, the final estimate is derived, and shown as a thick red line in Figure 2. The level of this line is based on the inferences made about the relative biases of the different data sources, and its trend is based on the trend implied by the tax and general household expenditure data.

DELSA/HEA/WD/HWP(2010)3
50
Figure 2. Derivation of final estimate of private dentists' revenues
$0
$200
$400
$600
$800
$1,000
$1,200
$1,400
$1,600
$1,800
$2,000
Year 1 Year 2 Year 3 Year 4 Year 5General household expenditure survey Specialized household health expenditure surveyTax department data Dental Association Survey
194. For some expenditure items, it will be relevant to apply such methods as that described earlier, which multiplies price and volume. In these cases, it is useful to also enter the data that are being used to estimate price and volume and organise them separately, so that the steps taken to finalise these elements are also shown. This is illustrated by the example in Table 7.
Table 7. Estimation of household spending at private practitioner clinics, Hong Kong SAR, China
Data source Item 1996 1997 1998 1999 Administrative data of government
Visits to public hospital clinics (A1) 11,337,548 13,091,650
General Household Survey
Visits to public hospital clinics (A2) 291,900 285,200
Visits to private practitioner clinics (B2) 920,200 746,500
Ratio of A1 to A2 38.84 45.90 Final estimates Visits to private practitioner
clinics [Q=(A1/A2)xB2] 35,741,047 34,266,889
Gross revenues [E=QxP] 7,484.04 7,221.06
Note: The mean price (P) of a visit to a private doctor was estimated separately using survey data and interpolation. Source: Gabriel Leung, Keith Tin, Hong Kong University Domestic Health Accounts Team. 195. Having proceeded sequentially in this fashion, it is often possible to build up estimates of a large percentage of overall household health expenditure (see Figure 2). There will, inevitably, remain some data for which no corroborating data exist other than the household survey data, which is considered subject to non-sampling error. In these cases, the second-best solution is to estimate the average discrepancy between the household survey estimates and the final health accounts estimates for those expenditure items where other data have been used. This discrepancy or ratio can then be applied to correct for the unknown non-sampling bias in the estimates of the remaining items, following the approach suggested in section 6.4.3.

DELSA/HEA/WD/HWP(2010)3
51
8. CONCLUSIONS
196. Reliable and accurate estimation of private expenditures is a major challenge in estimating health accounts in most countries. Major differences in the way in which private expenditures are estimated in different SHA implementations result in significant differences in the levels of private expenditures that are being reported, and represent a major barrier to achieving comparability of national estimates of health spending. Household out-of-pocket spending accounts for the largest part of private expenditures, and it is estimation of household expenditure that often presents the most problems for health accountants.
197. Despite the diversity in methods used, there are many ways in which current approaches to estimation can be significantly improved, by drawing upon emerging best practices, and shifting where possible from type C methods to type A or type B methods. In particular, health accountants need to be aware of the dangers in simply relying on household survey data to estimate household expenditures. Many decades of experience in both national accounts and health accounts have demonstrated that household surveys are poor instruments to measure the level of household spending, and are subject to significant sampling and non-sampling error.
198. It is recommended that health accountants rely more on provider side and financing scheme data than on household survey data, and adopt an integrative approach to estimating not only household expenditures, but all expenditure flows in a health account. This strategy involves examining all available data sources and balancing estimates of expenditure flows from different perspectives. In the case of household spending, this requires using data from both the provider and household sides. Adoption of an integrative strategy represents not only current international best practice for estimation of household health expenditures, but also shifts health accounting practice closer to what is considered best practice in national accounts.
199. In applying the integrative approach, the health accountant should invest their time and resources where it is most cost-effective. Given that private expenditure estimates will often be subject to considerable error despite the best efforts of health accountants, it is not wise to invest considerable time in focusing on minor components of spending with little policy significance. For example, trying to correct for the errors that arise because insurance payments are not made in the same year as the relevant medical expenditure is unlikely to be an efficient use of resources in most countries, where insurance is not a major source of financing. Similarly, health accountants should first focus attention on improving estimates for private expenditure items for which data are plentiful and type A or B methods are feasible, and which are of policy importance. In many instances this will imply paying more attention to estimation of expenditures at private clinics and private hospitals than to estimation of expenditures for services of paramedical ambulatory care providers.
200. Nevertheless, estimation of private expenditures will still remain a challenge, and estimates will continue to remain subject to considerable error. It is important therefore that estimation methods continue to develop and improve. Health accountants are encouraged to document the different methods they use, so that international understanding of the available methods increases, and in order to allow other countries to learn from different national experiences. It is only through this process of transparency and mutual learning that the both national and global estimates of private expenditure will improve in the future.

DELSA/HEA/WD/HWP(2010)3
52
ANNEX 1: REPORTS ON IMPLEMENTING THE DRAFT GUIDELINES
201. In order to move forward in improving the comparability and availability of private health expenditure, it was necessary to learn more about country experiences in terms of sources of data and estimation methods. By carefully compiling and cataloguing the data sources and estimation methods, the draft guidelines were improved and modified so that countries may learn from each other with the ultimate aim of improving international data comparability.
202. In order to compile more and better information on data sources and estimation methods, seven countries – Bulgaria, China, Ireland, Korea, Poland, Spain, and Switzerland – were invited to provide detailed information on:
• Data sources used for each financing agent, including where available at the 3 digit level.
• Estimation methods used, including the use of any residual techniques.
• Methods used for reconciling data from providers and functions with funding sources.
• Methods used to ensure that the private health expenditure data reported is devoted to health goods and services which fall within the SHA boundaries e.g. over-the-counter medicines.
• How data from household surveys is used, e.g., is an adjustment made for possible underestimation of private health spending.
• How the differences between data from Household Budget Surveys and data reported in National Accounts (for households’ final consumption expenditure) are reconciled.
• How informal payments are measured or estimated, e.g., ‘under-the-table payments’.
• Any areas where data collection is problematic e.g., non-profit institutions serving households or occupational health.
203. In addition, the selected countries were asked to provide a short critique of the draft guidelines for both financing agents and providers from the viewpoint of their country and available data sets. This feedback was taken into account, when finalising the final version of the guidelines included in this report.
204. The critiques to the draft guidelines from each pilot country are summarised below. The main conclusions from the countries’ viewpoint are the following:
• Guidelines proved to be useful for increasing the international data comparability, and provide an important tool to implement and/or refine the estimation methodology used at country level.
• There is a need to discuss more in depth the advantages and disadvantages of using household surveys as data sources, also enlarging the set of countries’ case studies.

DELSA/HEA/WD/HWP(2010)3
53
• The proposed framework for formulating a measurement strategy - divide the different components of private health expenditure into separate measurement problems that can be separately and sequentially tackled; assessing the data sources available for generating estimates for each identified component; selecting the optimal measurement approaches, and integrating the overall estimates – was very much welcomed by countries.
• Countries had positively valued the proposed integrative approach, which involves examining expenditure flows from the perspective of all agents involved in the transactions, and attempting to balance all data sources by linking estimates on any one item by financing agents with those given to provider agents.
205. Pilot countries had recognised the importance that private health expenditures estimation methods continue to develop and improve. Health accountants should be invited to document the different methods they use, so that international understanding of the available methods increases.
206. A brief summary from each pilot country study is reported below. The country reports are available from the OECD on request.
Bulgaria
207. The Guidelines present a frame of recommendations on measuring private health expenditure in the SHA. It is important for the health accountants involved in compilation of SHA that the particular recommendations could be used in conjunction with the OECD “A System of Health Accounts Manual” as well as the ONS/Eurostat “Practical Guidance for implementing a SHA in EU” and other Eurostat methodological papers and reports.
208. The definitions presented in the Guidelines are in compliance with the existing concepts applied in the Bulgarian SHA tables, with the exception of definition of out-of-pocket payments. The Guidelines definition is: “Out-of-pocket payments: payments borne directly by a patient without the benefit of insurance. They include cost-sharing and informal payments to health care providers”.
209. The estimation of normatively regulated private payments is very important for the national health policy and the use of reliable and consistent data is of a great importance in the statistical practice of the NSI of Bulgaria. The estimation of informal payments is not included in the household out-of-pocket expenditure and there are a lot of reasons for that. First of all there are no reliable sample sociological surveys or other data sources on the informal payments. The surveys on private payments very often do not use a clear methodology on informal payments definition. Very often all patients’ payments are considered as informal which results in wrong information and confusions. Generally, in case there are some good practices in informal payments estimations their inclusion in the Guidelines will be very useful.
210. The difference between sources of funding and financial agents is clearly explained in the Guidelines and it is important for the data providers that the particular guidelines are concentrated on the financing agent perspective i.e. estimating expenditure flows when the last financier is a private sector unit.
211. Problems in the measurement of private health expenditures are summarised in a very efficient and practical way. The most common problem in Bulgarian health accounts practice is the lack of details in data sources and correspondence with SHA classifications. Limitations in the use of household surveys, and especially HBS are typical for all countries that is why we do not include these arguments in details in our report.

DELSA/HEA/WD/HWP(2010)3
54
212. The measurement strategy steps are very clearly explained and the methods specific to different private expenditure agents could be considered as sufficient contribution to the methodological materials about SHA compilation.
213. The recommended approach to assess the data source and to estimate specific household expenditure items is practically useful worked out. As far as the estimation of HF 2.4 and HF 2.5 is very complex task, the attention paid in the guidelines on these items is less detailed. Some examples on good practices would be very helpful not only for the countries, but for the comparability. Up to now there are a lot of doubts concerning comparability of our national data on HF 2.4 and HF 2.5 probably due to lack of enough information on other countries practice.
214. The approach described in chapter 6 “Producing final estimates of private expenditure by reconciling and integrating estimates” provides a good example on data organisation spreadsheet. This will be included in the Bulgarian national practice when presenting data collection and estimation methods to national data users.
China
215. At present, total expenditure on health by financing agent and by provider at national level are available, while total expenditure on health by function and by cross-classified tables are not due to the non-availability of national disaggregated data. Therefore, the estimation methods and data sources of private health expenditure by financing agent are at national level, the estimation methods and data sources of full three dimensions matrix tabulation (source, provider, and function) were illustrated through experience of Tianjin municipality.
216. The guidelines are an important reference for China to adjust and standardise estimation methods of private health expenditure. Assessing the quality of data and potential for bias through A/B/C classification can help to analyze the reliability of result and improve the estimation methods, especially to how to achieve the matrix of private health expenditure by financing agents, provider and function.
217. Measurement strategy and principle should be consistent, but health system, and statistical report system and quality of data in different industries are different, as well as the methods used in different surveys. Therefore, A/B/C Classification of estimation methods cannot be completely determined by data sources. The method selected should be more suitable to the situation of a country on the basis of evaluating the quality of data and cross-validation.
218. More detailed definition and boundary of different financing agents in private health care financing and examples about each financing agent are needed, such as private social insurance.
219. The draft Guidelines described how to collect data from financing and provider perspective, and methods of estimation expenditure flow by financing agent and provider. The estimation methodology of private health expenditures by function should be added or some recommendations on it should be given.
220. It’s better to provide some examples in the guideline to illustrate how to adjust the bias in household survey, including how to quantify and adjust the sampling error and non-sampling error are needed.
221. Using household surveys to estimate the level of household out-of-pocket health expenditure in China should be classified as A method. But it is difficult to estimate household out-of-pocket health expenditure at the 3 digit level (HF2.3.1-HF2.3.7).

DELSA/HEA/WD/HWP(2010)3
55
222. The methods of estimating private health expenditures at public providers and private providers separately are feasible. According to China’s experiences, routine statistical report system is normative in public providers, and the data are more reliable. But in private providers, the statistical report system is usually unsound. Detailed methods of collecting data in private providers should be added in the Guidelines. If a representative survey should be conducted, what items should be included should be carefully considered.
223. Price and quantity (PQ) method is most useful for estimating out-of-pocket payments for ambulatory care. Data on health services (mainly refers to out-patient services) utilisation from National Household Health Interview Survey was subject to seasonal bias. It is suggested that the method of adjusting seasonal bias be provided in the Guidelines.
Ireland
224. Ireland is currently completing a feasibility study on the implementation of the SHA. Thus the draft guidelines are an excellent resource in Ireland. They identify ideal data sources for use in the compilation/estimation of private health expenditure. They identify deficiencies in some of these data sources. They will provide a guide on how to systematically approach and structure our estimation methodology in the future. They highlight areas that need development; as for example better data from private health insurance companies, better estimates of under reporting of health expenditure in the Household Budget Survey, and data source for corporate expenditure.
225. An important issue relates to confidentiality. Ireland has a small number of private health insurance companies/providers with one company having the largest market share. Publishing of financing information may be sensitive. Perhaps data can be collected but not published in such a way that would maintain confidentiality.
Korea
226. The draft guidelines feature high quality and abundance of illuminating information in both practical and theoretical terms as well. They are to be highly estimated in that they have made basic and multiple problems associated with the data availability on private expenditures clearly recognisable, one of its major contributions. They have also brought up the need for the integrative methods using different data sources to be developed by countries in order to meet best practice standards.
227. The foregoing A/B/C classification suggested by the guidelines is basically intended to encourage improvement in current practices, and achievement of greater comparability in SHA estimates of private expenditure. However, the guidelines leave it uncertain whether the classification is the assessment of data sources or of estimation methods. Since the same kind of sources could allow for data gathering processes varying from country to country, it is inappropriate to assign the same grade to the same kind of data source.
228. For example, the household surveys markedly vary qualitatively from country to country and from kind of household survey to kind of household survey. Where daily diary logging is employed, there arise no recall bias problems, for one thing. Precautions are in order because the simple grading could run the risk of disregarding the difference in a relative level as well as absolute level of the household surveys of each individual country involved.
229. At the same time, when evaluating data sources and methods, evaluation should be made of the ‘combined data source and estimation method’ while it is precarious to evaluate with regard to data sources alone. The same data source varies in value depending upon what type of estimation method is used, since each data source needs an estimation method to go with it. The guidelines underscore the fact that

DELSA/HEA/WD/HWP(2010)3
56
household surveys generally do not provide basic data for the estimation of health expenditure as required in the health accounts. However, the data from the household survey, when supplemented by complete administrative data, could be rated as data source providing fine information.
230. The guidelines address the problem of lack of reliability of household survey data in estimating private expenditures. They emphasise the importance of treating such data as a last resort, and of identifying alternative methods, and then go on to review in detail potential methods of estimating private expenditure flows. Finally, they discuss the way the different data sources and estimation methods come together to produce overall and final estimates.
231. These problems are also encountered in various household surveys carried in Korea, as the Korea National Health and Nutrition Examination (KNHANE) Survey where an interview technique is employed, and thus a recall period matters.
232. Non-sampling errors arise from defects in the design and process of a survey, or from the inherent limits to human behaviour when responding to survey questions. Recall loss does not matter in the current Household Income and Expenditure (HIE) Survey since spending by the household members is daily logged, rather than obtained through an interview. In addition, the Survey includes a survey sample much larger in size than the rule of thumb standard of 3-5,000 households as suggested by the draft guidelines.
233. Paragraph 49 of the guidelines indicates that specialised health surveys which focus only on health events and health expenditures could only lead to exaggerated reports of events, while household budget or expenditure surveys, which are conducted to collect data on all items of household expenditures, will tend to result in lower estimates of spending on health care. However, the possibility of over- or under-reporting is largely affected by the way the survey is conducted as discussed earlier, whether the survey is conducted. Evidence from Korea indicates that the KNHANE Survey that is a specialised health survey but employs an interview method shows lower medical bills expended as compared to the HIE survey that is a generalised household budget expenditure survey but employs a diary keeping technique.
234. The same paragraph 49 also indicates that ‘the general household budget survey may still be unbiased in one respect, since it tends to provide a more unbiased estimate of the proportion of overall household consumption that is for health than a health survey which concentrates on health items and assigns only minimal time to collecting data on general income or consumption,’ a description that points exactly to the attribute of these two surveys. The Korean health accounts are positively employing the characteristics of the HIE Survey featuring a less biased estimate of the proportion of overall household consumption. Though the size of the overall household consumption itself leaves some room for errors, there is no choice but to use the household data in estimating household’s out-of-pocket expenditure at a few types of medical providers until an environment has matured when data from providers are available with comparative precision or the results of the Health Care Panel Survey (KoHPS) launched in 2008 are made available.
235. In terms of measurement strategies, three interrelated estimation problems raised by the guidelines as those to be solved at the stage of identifying and collating the relevant data sources for each of the identified areas of spending, are particularly useful, namely, 1) estimating the absolute level of expenditure at a given time or during a time period, 2) estimating the composition of an expenditure flow by financing source, function and provider, and 3) estimating the trend of an expenditure flow during a given time period.
236. In addition, the guidelines list three approaches that include the financing side approach, the providers’ side, and the integrative approach combining the other two. The author agrees with the

DELSA/HEA/WD/HWP(2010)3
57
recommendations by the guidelines that one should use the integrative approach wherever the data sources available seem to be unreliable.
237. As suggested in the draft guidelines, a step-by-step approach was followed when measuring private expenditures in the Korean health accounts. Different components of the private health expenditure were divided into separate measurement problems, the data sources available for generating estimates for each identified component assessed, the optimal measurement approaches selected, and the overall estimates were integrated.
238. It is crucial to understand the origins and processing of each data source, the purposes for which the data were collected, and how this could influence the quality of the data. When it comes to data availability, the financing and consumption side is apparently accessible to relevant data with relative ease, compared with the production side. The financing side is a source most reliable in estimating the public expenditure, but is incomplete in estimating out-of-pocket expenditure because it is almost totally lacking in regular and direct data. It is not relatively easy to obtain reliable data on provider revenues in Korea to soundly estimate the total expenditure incurred at a given provider. This is partly because surveying providers could inherently be problematic, and partly because medical practitioners do not usually keep records of their revenue details. Expenditures from both financing and the provider sides were reviewed and then reconciled in this study. The data sources were compared with each other, discrepancies identified and assessed, and their respective strengths and weaknesses taken into account.
239. An integrative approach was used when distributing the expenditure flow at a particular financing source by type of the provider. The estimation approach to a particular expenditure flow varied according to the type and range of data that are available, and the reliability of such data sources. Missing cells of three cross-tables or a three-dimension (function, provider and financing) cube are filled by using the information given in the elements next to them. Estimating methods including triangulation from other data sources are used where no reliable direct data sources and methods are available. Micro and meso-economic data sources are combined when necessary. Estimations on the basis of time series come in handy as an indicator of the absolute level of the expenditure. Data from household budget surveys over several years can serve as a reference for occasional estimation of the absolute total expenditure in the case of dentistry, glasses and herbal medicines for which no payments by the health insurance are involved.
Poland
240. The Guidelines provide essential information in the area of assessment of private health expenditures. The guidelines present principles and methods which should be taken into account while compiling data on health expenditures in order to make them more comparable and reliable on the international level. They clearly describe categories which are crucial for proper understanding the idea of private health expenditures and highlight difficulties that may occur while compiling private health expenditure data for the health accounts purposes. The summary of methods by two approaches, in a form of tables, enables its simple and quickly reviews.
241. Special attention is paid on the issue of household surveys which are one type of data sources. This matter is very essential in case of Polish health accounts. The calculations for category HF.2.3 are based mostly on data from household budget surveys because of lack of reliable enough information from provider side. Recommendations and suggestions in Chapter 5 “Methods specific for estimation of household out-of pocket expenditure” will be used in methodological works on improvement of household expenditures on health care data that are currently conducted.
242. However, there is one general remark concerning this part of guidelines. Many disadvantages of households’ surveys serving as a source of information are discussed and for that reason other sources,

DELSA/HEA/WD/HWP(2010)3
58
among others providers-side surveys results are recommended. After reading the Guidelines one might conclude that only household surveys suffer from different kind of errors and all other sources of information are better. Therefore, we suggest adding more information concerning problems that can occur while using other than household survey data: surveys of health care providers, National Accounts, even registers. It shouldn’t be forgotten that no surveys are free of errors and these errors have always negative influence on reliability of results. Many surveys, especially for small entities are conducted with the use of sampling methods, so we have sampling error. There are a lot of changes with the activity of surveyed units, some are established, and other ended their activity. In Poland activity of some doctor’s practices depend only on the contract signed with the National Health Fund. If a contract is not signed, they don’t conduct the activity. Such situations can be a source of coverage errors, or non-response. The last one can occur also during the filling in reports – when they are difficult or include sensitive questions. Respondents, similarly as in households can underreport their incomes from private sources. Recall errors and many other can take place also while provider side surveys are conducted. It would be very useful to know about weak points that we should take into account while analysing alternative sources for the purpose of health accounts, what should be treated carefully.
243. In Poland, the system of health care financing is rather complex. Both private and public health care providers can provide services financed from public as well as private sources, and the amount paid from public sources is well recognised. On the other hand no direct information on number of services paid from public/private sources or information on source of income (public, private) are collected by health care provider. Moreover, due to the tax payment reason health care providers can underreport information on number of visits or amount of money received from private payers. Therefore the quality of data collected from provider side surveys might not be much better than that based on household surveys. We realise that estimates of health care expenditures based on data from households surveys differ from other results. However it is very difficult to draw a borderline between those results: where errors resulting from households surveys end and errors of other information sources start.
244. Due to the diversity of data sources and practices we find providing guidance for estimating expenditures from financing and provider perspective very useful. However, the presented A/B/C classification should be reinforced by presenting more examples which make them more understandable and easier to distinguish. There is also some doubt that only the process of measuring the level of the expenditures by financing agents should be considered by categorising the combinations of data sources and estimation methods as A, B&C methods or also the distribution by provider and function should be taken into account. In the case of methods for financing agent HF.2.2 private insurance expenditures (other than social insurance) we would like to suggest providing the C method that includes for instance estimations on the basis of data on insurance activity or from the national accounts.
245. Finally we would like to stress that learning the Guidelines was very useful and helps us preparing national health accounts for the current round of Joint SHA Questionnaire. We particularly appreciate the part of guidance devoted to data reconciling which is in our opinion one of the most important and difficult issues in the procedure of making health accounts.
246. We propose to supplement guidelines by description of best practices concerning particular items estimation. Results of the project could be used for this aim. It will be very helpful as well to have more detailed examples of calculations including evaluation of methods, their advantages and limitations.
247. Moreover as we look at Bibliography, it is visible a lack of more up-to date items (the most recent is published in 2003). We suggest to include “Understanding National Accounts by F. Lequiller and D.Blades, OECD 2006”, and to supplement Bibliography with publications presenting National Health Accounts of some other countries besides Bangladesh, e.g., recent Swedish edition on NHA for the years 2001-2006.

DELSA/HEA/WD/HWP(2010)3
59
Spain
248. From a formal point of view, we found the structure of the guidelines very friendly, and it is easy to get information about a particular subject. From a technical point of view, we agree that is necessary to achieve a better consistency and comparability in private expenditure estimates. These guidelines become a good starting point to check and improve the different approaches that each country employs in their estimations of private expenditure.
249. When writing our paper about the methodology used in our estimates it has been very useful to contrast our methods with the different options the guidelines set out. As our methodology rest on National Account figures, as first step to estimate the absolute expenditure level, we feel somehow ashamed since all the guidelines mark as C methods almost every attempt of estimating through that source.
250. The NA basis as way of estimating private HC in Spain, has been kept since the middle of the nineties, what offers a coherent long time series that has somehow configured the image we have about de Spanish Health Care System.
251. The point is that there are, at least, two different kind of national institutions involved in the task of estimating health care expenditure: National Institutes of Statistics and Health Administration bodies. The resources, the sources, the expert background and their experience and, finally, the degree of concern are quite different.
252. There is in Spain a legal commandment for the Ministry of Health, the Autonomous Communities and other health administration bodies, to produce Health Accounts on public expenditure that includes a clear structure of classifications and agents. This statistic operation is regularly contemplated in the four-year National Statistics Plan and it is yearly regulated in its annual application plan. There is no prevision at all about estimating the private expenditure. So, it could be not easy for the Institutions involved, to assign resources, both personal and monetary ones, intended to calculate what the NA experts have already done when estimating final households’ consumption expenditure. Without doubt, the detail level SHA requires is far from the desegregation of macroeconomics NA data; and it is there where health accounts experts could go deeper into the functions and providers classifications by using health surveys, documents and their own knowledge as well as or all other information they could get, about the health care sector management.
253. We completely agree with the introduction point three regarding the problem of comparability between countries due to the omission of some elements of private expenditure owing to a lack of appropriate data or methods.
254. It is not possible to complete for the private expenditure the demanding SHA manual classifications with methods and estimates as good as public expenditure one. Therefore, the table functions-providers, as addition of the both financing schemes could entails, at some desegregation levels, misleading figures.
255. It seems necessary to draw a desegregation level at which private expenditure estimates becomes reliable. At this level the consolidation of both financing schemes will lead to consistent expenditure figures. And as far as public estimate is concerned the wider provider- functions and modes of production breakdowns can be kept.
256. We found that it would be necessary to lay emphasis on the health benefits of traffic and other accident insurance. It is not clearly mentioned either in the Manual or in the guidelines.

DELSA/HEA/WD/HWP(2010)3
60
257. It would be interesting to mention the different borders of Household’s Budget surveys and final household consumption , and the possible expenditure included in the last one, that do not mach with the SHA financing scheme.
Switzerland
258. This paper is of an excellent level, scientifically and technically well documented and practice oriented. It is in fact an important acknowledgment toward health accountants and their struggle to find acceptable data sources and estimation methods. It can be an important milestone in the improvement of quality and comparability of estimates of the health accounts.
259. Although focusing on the private health expenditure, this report deals de facto with basic and widespread difficulties on data and methods in health accounting. The availability of data and comparability of figures on private expenditure is just the emerging tip of the iceberg representing hundreds of items to be estimated according to the three SHA classifications.
260. One important advantage of the report is that it describes in a general and adequate manner ways to be developed in order to find acceptable solutions in the challenging task of building internationally comparable health accounts. Detailed “cook books” on health accounts have already been written but there is some doubt if they are of real help for national statisticians in charge of health accounting.
261. One main achievement of the report is that it brings clear recognition of basic and multiple problems in the data availability on private expenditure. It brings also evidence that integrative methods using different data sources and institutional information have to be developed in each country in order to meet best practice standards.
262. This report brings also many elements on the very limited use of budget household surveys for health expenditure. The scientific work in this field was done in the United States in the seventies. It is rather surprising that no more recent research has been made on this subject in other countries.
263. In “Selecting approaches” (3.4.1 Measurement from financing and provider perspectives) the author mentioned three approaches: one from the financing side perspective, one from the providers’ side perspective and finally the integrative approach combining the other two. This choice is a good one for the purpose of this paper to explain the main problematic in which is the need of development on estimation methods using different data sources and other institutional information.
264. However, from the health accountant point of view more bound to the technical constraints in constructing coherent figures, a three dimensional approach along with the three SHA classifications (providers’, functional and financing classifications) would be preferred. Building health accounts consists basically in computing three cross tabulations at the most detailed level : Goods and services cross checked with Providers (HC X HP), Goods and services with financing agents (HC X HF) and Providers with financing agents (HP X HF). We all know that in dealing with health accounts that we switch very quickly from providers’ data to figures on goods and services but the development of methods needs also a more clear distinction there.
265. The integrative method deserves a more central place already in this section. Besides mentioning the search for reliable data sources on the sides of the consumption (HC), on the side of the production (HP) and on the side of the financing (HF), I would advocate even more emphasis on the integrative approach with three dimensions.
266. The general concept of grading methods from A to C with the definitions for qualification is good. In trying to use it adequately in this report by assessing our own methods we faced some evidence

DELSA/HEA/WD/HWP(2010)3
61
that a more precise scale of evaluation could be necessary. For this reason we used two logical additional possibilities in between, A/B and B/C.
267. Going further on to methods specific to expenditure flows classified by financing agents, one important assessment problem seems to be ignored. Assessing the financing flow globally is an easy exercise. Total financing from agents HF1 to HF.2.4 would actually meet the requirements for A methods since data are routinely collected from schemes themselves or regulatory agencies. Building health accounts means however basically estimating financing flows for each item of expenditure along the functional classification and the providers’ classification. Therefore the assessment of the method to the financing agent requires integrating a global assessment on the possibilities and the quality of the desegregation into expenditure for goods and services.
268. The variety of methods is practically infinite in this area. Each financing scheme has its own typology of payments for health care and many ad hoc methods (keys for break down or grouping) have to be developed in order to meet the required desegregation of the SHA. Moreover the Health Financing categories (HF) may cover more than one financing scheme.
269. The global assessment of methods specific to flows classified by financing agents appear to be not so easy for the reasons mentioned above. It may also be recalled here that in the overall assessment of the category, we had to consider the economic weight of the financial flow.

DELSA/HEA/WD/HWP(2010)3
62
BIBLIOGRAPHY
Cannell, C, G Fisher, and T Bakker (1965), Reporting of hospitalization in the Health Interview Survey. Vol. Series 2, No. 6, Vital and Health Statistics. Washington, D.C.: Government Printing Office.
Cannell, C, and F Fowler (1965), Comparison of hospitalization reporting in three survey procedures. Vol. Series 2, No. 8, Vital and Health Statistics. Washington, D.C.: Government Printing Office.
Cannell, C, K Marguiz, and A Laurent (1977), A Summary of Studies of Interviewing Methodology. Vol. Series 2, No. 69, Vital and Health Statistics. Washington, D.C.: Government Printing Office.
Data International (1998), Bangladesh National Health Accounts 1996/97. Dhaka, Bangladesh: Health Economics Unit, Ministry of Health and Family Welfare.
Deaton, Angus (2003), Measuring Poverty in a Growing World (or Measuring Growth in a Poor World) July 2003. Cambridge, MA, USA: National Bureau of Economic Research.
Department of Economic and Social Affairs, Statistics Division, United Nations (2005), Household Sample Surveys in Developing and Transition Countries. Vol. No. 96 (ST/ESA/STAT/SER.F/96), Studies in Methods Series F. New York, USA: United Nations.
Grootaert, Christiaan, K. F. Cheung, H. W. Fung, and S. M. Tan. 1982. Statistical Experimentation for Household Surveys: Two Case Studies of Hong Kong. Vol. Number 20, LSMS Working Papers. Washington, D.C.: World Bank.
OECD (2009). System of Health Accounts (SHA) Data Collection.
OECD (2000), A System of Health Accounts. Paris, France: Organisation for Economic Co-operation and Development.
OECD (2002), Measuring the Non-Observed Economy, A Handbook, Paris, France.
Office of National Statistics (2004) SHA Guidelines. Practical guidance for implementing a System of Health Accounts in the EU.
Poisal, John A. . 2003. Reporting of Drug Expenditures in the MCBS. Health Care Financing Review 25 (2):23-36.
Ross, David A, and J. Patrick Vaughan (1986), Health Interview Surveys in Developing Countries: A Methodological Review. Studies in Family Planning 17 (2):78-94.
United Nations (1993), System of National Accounts. New York, USA: United Nations.

DELSA/HEA/WD/HWP(2010)3
63
Ustun TB, Chatterji S, Mechbal A, and Murray CJL (2003). The World Health Survey. In Health systems performance assessment: debates, methods and empiricism / edited by Murray CJL, and Evans DB. World Health Organisation, Geneva.
Xu K, Ravndal F, Evans DB, and Carrin G (2009). Assessing the reliability of household expenditure data: Results of the World Health Survey. Health Policy 91: 297-305.
World Health Organization (2003), Guide to producing national health accounts: with special applications for low-income and middle-income countries. Geneva, Switzerland: World Health Organization.

DELSA/HEA/WD/HWP(2010)3
64
OECD HEALTH WORKING PAPERS
A full list of the papers in this series can be found on the OECD website: www.oecd.org/els/health/workingpapers
No. 51 EFFECTIVE WAYS TO REALISE POLICY REFORMS IN HEALTH SYSTEMS Jeremy Hurst
No. 50 HEALTH SYSTEMS INSTITUTIONAL CHARACTERISTICS A SURVEY OF 29 OECD COUNTRIES Valerie Paris, Marion Devaux and Lihan Wei
No. 49 THE CHALLENGE OF FINANCING HEALTH CARE IN THE CURRENT CRISIS (forthcoming) Peter Scherer, Marion Deveaux
No. 48 IMPROVING LIFESTYLES, TACKLING OBESITY: THE HEALTH AND ECONOMIC IMPACT OF PREVENTION STRATEGIES (2009) Franco Sassi, Michele Cecchini, Jeremy Lauer and Dan Chisholm
No. 47 HEALTH CARE QUALITY INDICATORS PROJECT: PATIENT SAFETY INDICATORS REPORT 2009 (2009) Saskia Drösler, Patrick Romano, Lihan Wei; and ANNEX Saskia Drösler
No. 46 EDUCATION AND OBESITY IN FOUR OECD COUNTRIES (2009) Franco Sassi, Marion Devaux, Jody Church, Michele Cecchini and Francesca Borgonovi
No. 45 THE OBESITY EPIDEMIC: ANALYSIS OF PAST AND PROJECTED FUTURE TRENDS IN SELECTED OECD COUNTRIES (2009) Franco Sassi, Marion Devaux, Michele Cecchini and Elena Rusticelli
No. 44 THE LONG-TERM CARE WORKFORCE: OVERVIEW AND STRATEGIES TO ADAPT SUPPLY TO A GROWING DEMAND (2009) Rie Fujisawa and Francesca Colombo
No. 43 MEASURING DISPARITIES IN HEALTH STATUS AND IN ACCESS AND USE OF HEALTH CARE IN OECD COUNTRIES (2009) Michael de Looper and Gaetan Lafortune
No. 42 POLICIES FOR HEALTHY AGEING: AN OVERVIEW (2009) Howard Oxley
No. 41 THE REMUNERATION OF GENERAL PRACTITIONERS AND SPECIALISTS IN 14 OECD COUNTRIES: WHAT ARE THE FACTORS EXPLAINING VARIATIONS ACROSS COUNTRIES? (2008) Rie Fujisawa and Gaetan Lafortune
No. 40 INTERNATIONAL MOBILITY OF HEALTH PROFESSIONALS AND HEALTH WORKFORCE MANAGEMENT IN CANADA: MYTHS AND REALITIES (2008) Jean-Christophe Dumont, Pascal Zurn, Jody Church and Christine Le Thi
No. 39 PHARMACEUTICAL PRICING & REIMBURSEMENT POLICIES IN GERMANY (2008) Valérie Paris and Elizabeth Docteur
No. 38 MIGRATION OF HEALTH WORKERS: THE UK PERSPECTIVE TO 2006 (2008) James Buchan, Susanna Baldwin and Miranda Munro
No. 37 THE US PHYSICIAN WORKFORCE: WHERE DO WE STAND? (2008) Richard A. Cooper

DELSA/HEA/WD/HWP(2010)3
65
No. 36 MIGRATION POLICIES OF HEALTH PROFESSIONALS IN FRANCE (2008) Roland Cash and Philippe Ulmann
No. 35 NURSE WORKFORCE CHALLENGES IN THE UNITED STATES: IMPLICATIONS FOR POLICY (2008) Linda H. Aiken and Robyn Cheung
No. 34 MISMATCHES IN THE FORMAL SECTOR, EXPANSION OF THE INFORMAL SECTOR: IMMIGRATION OF HEALTH PROFESSIONALS TO ITALY (2008) Jonathan Chaloff
No. 33 HEALTH WORKFORCE AND INTERNATIONAL MIGRATION: CAN NEW ZEALAND COMPETE? (2008) Pascal Zurn and Jean-Christophe Dumont
No. 32 THE PREVENTION OF LIFESTYLE-RELATED CHRONIC DISEASES: AN ECONOMIC FRAMEWORK (2008) Franco Sassi and Jeremy Hurst
No. 31 PHARMACEUTICAL PRICING AND REIMBURSEMENT POLICIES IN SLOVAKIA (2008) Zoltán Kaló, Elizabeth Docteur and Pierre Moïse
No. 30 IMPROVED HEALTH SYSTEM PERFORMANCE THROUGH BETTER CARE COORDINATION (2007) Maria M. Hofmarcher, Howard Oxley, and Elena Rusticelli
No. 29 HEALTH CARE QUALITY INDICATORS PROJECT 2006 DATA COLLECTION UPDATE REPORT (2007) Sandra Garcia-Armesto, Maria Luisa Gil Lapetra, Lihan Wei, Edward Kelley and the Members of the HCQI Expert Group
No. 28 PHARMACEUTICAL PRICING AND REIMBURSEMENT POLICIES IN SWEDEN (2007) Pierre Moïse and Elizabeth Docteur
No. 27 PHARMACEUTICAL PRICING AND REIMBURSEMENT POLICIES IN SWITZERLAND (2007) Valérie Paris and Elizabeth Docteur
No. 26 TRENDS IN SEVERE DISABILITY AMONG ELDERLY PEOPLE: ASSESSING THE EVIDENCE IN 12 OECD COUNTRIES AND THE FUTURE IMPLICATIONS (2007) Gaétan Lafortune, Gaëlle Balestat, and the Disability Study Expert Group Members
No. 25 PHARMACEUTICAL PRICING AND REIMBURSEMENT POLICIES IN MEXICO (2007) Pierre Moïse and Elizabeth Docteur
No. 24 PHARMACEUTICAL PRICING AND REIMBURSEMENT POLICIES IN CANADA (2006) Valérie Paris and Elizabeth Docteur
No. 23 HEALTH CARE QUALITY INDICATORS PROJECT, CONCEPTUAL FRAMEWORK PAPER (2006) Edward Kelley and Jeremy Hurst
No. 22 HEALTH CARE QUALITY INDICATORS PROJECT, INITIAL INDICATORS REPORT (2006) Soeren Mattke, Edward Kelley, Peter Scherer, Jeremy Hurst, Maria Luisa Gil Lapetra and the HCQI Expert Group Members
No. 21 THE SUPPLY OF PHYSICIAN SERVICES IN OECD COUNTRIES (2006) Steven Simeons and Jeremy Hurst

DELSA/HEA/WD/HWP(2010)3
66
No. 20 CONSUMER DIRECTION AND CHOICE IN LONG-TERM CARE FOR OLDER PERSONS, INCLUDING PAYMENTS FOR INFORMAL CARE: HOW CAN IT HELP IMPROVE CARE OUTCOMES, EMPLOYMENT AND FISCAL SUSTAINABILITY? (2005) Jens Lundsgaard
No. 19 TACKLING NURSE SHORTAGES IN OECD COUNTRIES (2004) Steven Simoens, Mike Villeneuve and Jeremy Hurst
No. 18 PRIVATE HEALTH INSURANCE IN THE NETHERLANDS. A CASE STUDY (2004) Nicole Tapay and Francesca Colombo
No. 17 SKILL-MIX AND POLICY CHANGE IN THE HEALTH WORKFORCE: NURSES IN ADVANCED ROLES (2004) James Buchan and Lynn Calman
No. 16 SHA-BASED NATIONAL HEALTH ACCOUNTS IN THIRTEEN OECD COUNTRIES: A COMPARATIVE ANALYSIS (2004) Eva Orosz and David Morgan
No. 15 PRIVATE HEALTH INSURANCE IN OECD COUNTRIES: THE BENEFITS AND COSTS FOR INDIVIDUALS AND HEALTH SYSTEMS (2004) Francesca Colombo and Nicole Tapay
No. 14 INCOME-RELATED INEQUALITY IN THE USE OF MEDICAL CARE IN 21 OECD COUNTRIES (2004) Eddy van Doorslaer, Cristina Masseria and the OECD Health Equity Research Group
No. 13 DEMENTIA CARE IN 9 OECD COUNTRIES: A COMPARATIVE ANALYSIS (2004) Pierre Moise, Michael Schwarzinger, Myung-Yong Um and the Dementia Experts’ Group
No. 12 PRIVATE HEALTH INSURANCE IN FRANCE (2004) Thomas C. Buchmueller and Agnes Couffinhal
No. 11 THE SLOVAK HEALTH INSURANCE SYSTEM AND THE POTENTIAL ROLE FOR PRIVATE HEALTH INSURANCE: POLICY CHALLENGES (2004) Francesca Colombo and Nicole Tapay
No. 10 PRIVATE HEALTH INSURANCE IN IRELAND. A CASE STUDY (2004) Francesca Colombo and Nicole Tapay
No. 9 HEALTH CARE SYSTEMS: LESSONS FROM THE REFORM EXPERIENCE (2003) Elizabeth Docteur and Howard Oxley
No. 8 PRIVATE HEALTH INSURANCE IN AUSTRALIA. A CASE STUDY (2003) Francesca Colombo and Nicole Tapay
No. 7 EXPLAINING WAITING-TIMES VARIATIONS FOR ELECTIVE SURGERY ACROSS OECD COUNTRIES (2003) Luigi Siciliani and Jeremy Hurst
No. 6 TACKLING EXCESSIVE WAITING TIMES FOR ELECTIVE SURGERY: A COMPARISON OF POLICIES IN 12 OECD COUNTRIES (2003) Jeremy Hurst and Luigi Siciliani
No. 5 STROKE CARE IN OECD COUNTRIES: A COMPARISON OF TREATMENT, COSTS AND OUTCOMES IN 17 COUNTRIES (2003) Lynelle Moon, Pierre Moïse, Stéphane Jacobzone and the ARD-Stroke Experts Group

DELSA/HEA/WD/HWP(2010)3
67
RECENT RELATED OECD PUBLICATIONS
HEALTH AT A GLANCE 2009: OECD INDICATORS (2009). See http://www.oecd.org/health/healthataglance for more information
ACHIEVING BETTER VALUE FOR MONEY IN HEALTH CARE (2009), OECD HEALTH POLICY STUDIES
OECD HEALTH DATA 2009 (2009), available on CD-ROM (in single-user or network installations). The database can be queried in English, French, German, Spanish and Italian. Japanese and Russian are also available but exclusively in the online version. www.oecd.org/health/healthdata
OECD REVIEWS OF HEALTH SYSTEMS - TURKEY (2009)
THE LOOMING CRISIS IN THE HEALTH WORKFORCE: CAN OECD COUNTRIES RESPOND? (2008)
PHARMACEUTICAL PRICING POLICIES IN A GLOBAL MARKET (2008)
OECD REVIEWS OF HEALTH SYSTEMS - SWITZERLAND (2006)
LONG-TERM CARE FOR OLDER PEOPLE (2005), OECD HEALTH PROJECT SERIES
HEALTH TECHNOLOGIES AND DECISION MAKING (2005), OECD HEALTH PROJECT SERIES
OECD REVIEWS OF HEALTH CARE SYSTEMS - FINLAND (2005)
OECD REVIEWS OF HEALTH CARE SYSTEMS - MEXICO (2005)
PRIVATE HEALTH INSURANCE IN OECD COUNTRIES (2004), OECD HEALTH PROJECT SERIES
TOWARDS HIGH-PERFORMING HEALTH SYSTEMS - POLICY STUDIES (2004), OECD HEALTH PROJECT SERIES
TOWARDS HIGH-PERFORMING HEALTH SYSTEMS (2004), OECD HEALTH PROJECT SERIES
OECD REVIEWS OF HEALTH CARE SYSTEMS - KOREA (2003)
A DISEASE-BASED COMPARISON OF HEALTH SYSTEMS: WHAT IS BEST AND AT WHAT COST? (2003)
MEASURING UP: IMPROVING HEALTH SYSTEMS PERFORMANCE IN OECD COUNTRIES (2002)
A SYSTEM OF HEALTH ACCOUNTS (2000) SHA Revision information and proposals at http://www.oecd.org/health/sha/revision
For a full list, consult the OECD On-Line Bookstore at www.oecd.org,
or write for a free written catalogue to the following address:
OECD Publications Service 2, rue André-Pascal, 75775 PARIS CEDEX 16 or to the OECD Distributor in your country