Embed Size (px)
Citation preview

Framing Business Interests
How Campaigns Affect Firms’ Positions on Preferential Trade Agreements
Version 2.1: August, 2012
Arata Kuno Megumi Naoi Assistant Professor Assistant Professor Department of Policy Studies Department of Political Science Kyorin University University of California, San Diego [email protected] [email protected]
Abstract: What determines firms’ policy positions on preferential trade agreements (PTAs)? Existing theories about PTAs assume a certain distribution of firm preferences and power, but no systematic empirical data exists to verify such theories. Furthermore, studies have assumed that company executives make up their minds in a perfect information environment, in which the distributional effects of PTAs are known to them before signing. This paper challenges these assumptions by using an original survey of firm executives regarding the Trans-Pacific Partnership Agreement (TPP) conducted in Japan in February 2011, before the Japanese government decided to participate in the negotiations. We obtained responses from around 2,100 firms in manufacturing and service sectors. The survey was embedded in the sub-national variations in anti-TPP campaigns in which 24 prefectural governments published estimated costs of joining TPP on the agricultural sector, and the remaining 23 governments did not. After controlling for a host of company and industry-level co-variates and addressing potential endogeneity issues, we found that companies that operated in “negative campaign” prefectures were fifteen percentage points more likely to predict that the TPP would harm their businesses. The findings call for more research on how firms form their policy positions in an imperfect and politicized information environment.
We acknowledge the financial support from JSPS (A: Globalization and Domestic Politics). The survey used in this paper was conducted by Arata Kuno, Megumi Naoi, Michael Plouffe and Ikuo Kume. We thank following individuals for helpful comments on the earlier draft: Masahiro Abe, Lawrence Broz, Christina Davis, Erik Gartzke, Masahiro Endoh, Kazunobu Hayakawa, Koichi Ishikawa, Koichi Kagitani, Fukunari Kimura, Ikuo Kume, Shujiro Urata, Christina Schneider, Ulrike Schaede, Takeo Hoshi, Masahiko Tatebayashi, Eiichi Tomiura, Yoshiko Kojo, Kiichiro Arai, Naofumi Fujimura, Lisa Martin, Toshiyuki Matsuura, Hiroshi Mukunoki, Michael Plouff, Jason Kuo, Weiyi Shi, Maya Oren. For helpful discussions, we thank Peter Cowhey, General Council Ihara, Taro Kono, Ellis Krauss, Takeo Hoshi, Ulrike Schaede, Rachel Swanger, Julia Lowell, Craig McIntosh, Eddy Malesky and Gordon Hanson. Justin Reeves and Yasuko Kohno provided excellent research assistance.

!
! 2!
Introduction What determines firms’ policy positions on public policies? Despite the conventional wisdom that corporations in democracies have substantial influence over public policies, economists and political scientists alike have continued to consider firms’ policy position-taking as a mere reflection of their economic interests.2 The majority of these studies, moreover, have assumed that firm executives operate in a perfect information environment where the distributional effect of a forthcoming policy is well-known to them (exceptions are Bauer, Dexter and Poole 1972; Jo Martin 1995; Kenyon and Naoi 2010). These assumptions diverge from policy-making in the real world where political processes –such as electoral and partisan competition and majority coalition-building on the floor – frame the very information firm executives use to make up their minds about the forthcoming policy.
Assessing the exact effect of these policy campaigns on firm executives, however, is difficult due to the problems inherent in observational studies: firm executives are generally exposed to a massive amount of competing information about the forthcoming policy and thus it is difficult to disentangle which policy information has what effects on them.3 Furthermore, identifying the effect of policy information on firms has inherent problem of reverse causality—namely, it is hard to disentangle whether the government’s information frames firms or firms lobby the government to release information that fits their economist interests. Finally, scholars have used “revealed preferences” through firm behaviors, such as firms’ campaign contributions and anti-dumping filings, as proxy of firms’ policy-positions.4 Yet, firm behavior is not exact proxy of firms’ policy positions, because only a fraction of firms contribute campaign contributions or file dumping claims because of their costs, free-riding problems among firms and the uncertainty regarding the outcome. Scholars also have trouble identifying what policy issues and positions firms contribute money for. This paper is one of the first to systematically analyze firms’ position-taking on economic policy when politicians provide competing information about the distributional implications of the forthcoming policy. We leverage an original survey of Japanese firm executives on Trans-Pacific Partnership Agreement (TPP) embedded in the sub-national variations of policy campaigns, where a half of our respondents were exposed to location-specific anti-TPP campaigns and the rest were not. This variation in firm executives’ exposure to policy campaigns occurred due to the regional variations in anti-TPP campaigns run by prefectural governments, where 24 governments published the estimated TPP’s damage on the prefecture’s agricultural economy, and the remaining 23 governments did not.
The two characteristics of this anti-TPP campaigns allow us to treat the policy campaign as exogenous to firms’ underlying economic interests: (i) the campaign was
!!!!!!!!!!!!!!!!!!!!!!!!!!!!!!!!!!!!!!!!!!!!!!!!!!!!!!!!2 See Alt et al. 1999;Baldwin and Magee 2004; Broz and Plouffe 2010; Gourevitch and Shinn 2005; Hall and Deardorff 2006; Kenyon and Naoi 2010; Magee, Brock and Young 1989; Mares 2004; Malesky 2009; Milner 1988; Moseley 2000; Stratmann 1998. Exceptions are Bauer, Dexter and Poole 1972 and Jo Martin 1995. 3 Public opinion research has extensively studied the effect of electoral campaigns on voters. See Popkin 1991; Druckman 2004; Abrajano 2010a; Vavreck forthcoming. 4 Stratmann 1998; Bermeo and Davis 2009; Naoi and Krauss 2009.

!
! 3!
sector-specific – “negative campaign prefectures” only published their estimated damage on agriculture, and thus manufacturing and service sector firms should not be the ones that lobbied the government to engage in this campaign5; (ii) the campaign was also location-specific, i.e., published estimates were specifically calculated for a given prefectural economy.6
After controlling for a host of firm, industry and prefectural-level co-variates and addressing potential issues of endogeneity, we find that executives of manufacturing and service companies that operated in “negative campaign” prefectures are fifteen percentage point more likely to expect that the conclusion of TPP will have negative effects on their businesses than those in “non-negative campaign” prefectures. The results have broader implications for studies on firms’ position-taking and how business elites form policy positions in an imperfect and politicized information environment.
The remainder of this paper proceeds as follows. The next section discusses key literature on firms’ position-taking, issues that stagnated its progress, and why we focus on Japanese firms’ position-taking on preferential trade agreements to address these issues. Section two describes the domestic politics of joining TPP negotiations and anti-TPP campaigns led by prefectural governments. Section three describes our firm executive survey conducted in Japan before the government decided to participate in TPP negotiations. Section four discusses the results. The final section summarizes the broader implications of our research and future agenda. Business Interests and Public Policy
The influence of corporations on public policies has long been one of the central questions in political economy. Seminal works such as Dahl (1963), Lindblom (1977), Okun (1975), Przeworski (1988; 1990) and Tilly (1992) have studied the tension and affinity between profit-pursuing “homo economicus” – corporations and merchants – and the state. In the past two decades, archival and survey-based data generated a series of studies on firms’ positions on issues such as trade (Davis and Shirato 2007; Milner 1988; Alt et al.1999), social insurance (Jo Martin 1995; Mares 2004), political risks and property rights (Harber et al. 2003; Malesky 2008; Kenyon and Naoi 2010), governance (Gourevitch and Shinn 2005) and exchange rate regimes (Broz and Plouffe 2010).
The majority of these studies, however, assume that firms act on their economic interests and that firm executives have sufficient information to predict the distributional impact of a forthcoming policy change. Accordingly, the scholarly debates are often fought over which economic models account for firms’ preferences, such as the Ricardo-Viner model of trade or the asset specificity model of social insurance. Use of firm executive survey to get at firms’ policy positions has flourished in the past decade, yet, the majority of these studies have continued to treat firm executives’ responses to survey questions as a more or less “true” expression of firms’ economic interests. While analytically convenient, these assumptions diverge from the policy-making in the real
!!!!!!!!!!!!!!!!!!!!!!!!!!!!!!!!!!!!!!!!!!!!!!!!!!!!!!!!5 Some manufacturing industries, such as processed food, might rely on input from domestic agriculture. We address this possibility by clustering error terms by industries, and also by sub-setting the data into different manufacturing industries later. 6 Soga and Machidori 1999, 2003, 2007; Sunahara 2009; Fukumoto and Horiuchi 2011

!
! 4!
world where policy information is highly politicized due to electoral and partisan competitions (Bartel 2008; McCarty, Poole and Rosenthal 2006; Fisman 2001). Two studies are noteworthy exceptions. In their classic book, American business and Public Policy, Bauer, Dexter and Poole (1972) have conducted a survey of around 1,000 American business executives on their attitudes toward trade policy. The book highlights the importance of communication between policy-makers and firm executives and documents that just like ordinary citizens, business elites also make decisions in a less than perfect information environment. Jo Martin (1995) shows that institutional and social contexts shaped firms’ responses to President Clinton’s health care reform in the United States. These findings force us to reconsider the long-held premise that firm executives have easily recognizable “self-interests” and that they are “sophisticates”— who have better information about the market, less likely to be framed by political rhetoric, and behave rationally to maximize their profits. Instead, these studies often point to the executives’ surprising lack of information and their sensitivity to political and social framing. Yet, gauging the exact effect of these policy campaigns on firm executives has been difficult, due to endogeneity and identification issues that are inherent in observational studies as discussed previously. The Research Design We remedy the above issues inherent in observational studies in two ways. First, instead of commonly used “revealed preferences” such as campaign contributions and anti-dumping filing by firms, we conducted an original survey of Japanese firm executives to directly get at their expectations about a forthcoming policy change, i.e., the conclusion of Trans-Pacific Partnership Agreement (TPP). The survey is superior to the revealed preference approach because it is a more independent measure of policy positions. The survey approach also allows us to focus on a forthcoming policy change, rather than tracing firms’ responses to policy changes that have already occurred. Second, we embedded this original survey in the sub-national variations in the anti-TPP campaigns where a half of our respondents were exposed to location-specific, anti-TPP campaigns and others were not.
We focus on TPP because conventional wisdom suggests that trade will be one of the hardest cases to find the effect of elite framing on firm executives. Trade policy is one of the most well-defined policy issues in terms of its distributional implication on firms and industries. As a prominent economist told Bauer, Dexter and Poole in the early 1950s: “Tell me what a businessman manufactures and I will tell you where he stands on foreign trade” (Bauer, Dexter and Poole 1972: p.3). If this view, or any of the established models of trade is true, firm executives should know whether his or her firm will benefit or lose from a forthcoming trade policy change. Accordingly, the room for elite framing and persuasion should remain small. Second, TPP pledges to eliminate tariffs on all items without exceptions within ten years from its conclusion.7 With this “no exception rule”, !!!!!!!!!!!!!!!!!!!!!!!!!!!!!!!!!!!!!!!!!!!!!!!!!!!!!!!!7 TPP aims to promote trade liberalization and economic cooperation in Asia-Pacific region. TPP began as a multilateral trade agreement with four countries in 2006 (New Zealand, Singapore, Chile and Brunei) and currently expanded to add six more countries: Australia, Malaysia, Peru, Japan (under negotiation to join), the United States and Viet Nam. See USTR’s website on TPP: http://www.ustr.gov/tpp (last accessed, December 15, 2011).

!
! 5!
firm executives should have clearer expectations about TPP’s distributional effects than conventional preferential trade agreements, where politicians are able to exclude politically sensitive commodities.8
Finally, we focus on Japan for the combination of a well-defined cleavage in trade politics and highly politicized trade policy information. First, Japan should be a “hard case” to find the effect of elite framing due to the highly-educated nature of firm executives, the constitutional guarantee for media freedom,9 and the well-defined sectoral cleavage in trade politics. More than 90% of firm executives in Japan have completed four-year college or above.10 It is well-documented by the media and scholarly works that manufacturing industries pursue free trade and have very low tariff rates, whereas agriculture is protectionist and remains highly protected. Consistent with this convention, the initial discussion on whether Japanese government should participate in TPP negotiation was fought over the sectoral line between agriculture and manufacture.
Yet, precisely because TPP has set clear expectations about its effects, the debate regarding whether Japan should participate in TPP negotiations has mobilized unprecedented levels of lobbying among special interest groups and the politicians. These campaigns exposed firm executives to massive and competing information about TPP’s effects. This combination of the clarity of economic interests (i.e., “the bench mark”) and the highly politicized policy information (i.e., “the treatment”) provides an ideal case for testing the effect of elites’ framing and persuasion. Furthermore, anti-TPP campaigns run by prefectural governments were largely exogenous to the economic interests of manufacturing and service sector firms. Next section establishes this exogeneity. Anti-TPP Campaigns by Prefectural Governments: Exogenous Political Process The “no exception rule” of TPP’s pledged trade liberalization is expected to hit the Japanese farmers the hardest, as commodities such as rice (tariff rates of 778%), butter (360%) and flour (252%) have been protected with high tariffs.11 The Japan Agricultural Cooperative initiated “the National Campaign to collect 10 million petitions to oppose TPP” in January of 2011, and within ten months, it collected 11 million petitions (i.e., higher than 10% of population over the age 20). Putting the magnitude of this mobilization in context, the campaign to mobilize 10 million petitions for anti-nuclear energy policy after the Fukushima nuclear plant accident has collected less than one-third of the anti-TPP petitions, i.e., 3.2 million.12 32 Japanese language books were published on TPP within a year, and well-selling ones have titles such as TPP Destroys
!!!!!!!!!!!!!!!!!!!!!!!!!!!!!!!!!!!!!!!!!!!!!!!!!!!!!!!!8 Katada and Solis 2009; Katada, Pekkanen and Solis 2007; Krauss and Naoi 2011. 9!The enforcement of this right, of course, varies across issues (e.g., more regulation on loyal family issues, the politicization of Supreme Court, etc). Yomiuri Shimbun, which is the highest selling newspaper in Japan, has been known to be sympathetic to the Liberal Democratic Party, and Asahi Shimbun, which is the second highest selling newspaper, has been known to be more sympathetic to the left. !10 Tachibanaki (1993). 11 Davis 2003. 12 “Datsu genpatsu motome 1000 mannin shomei kaishi”, Asahi Shimbun, June 16, 2011. http://www.asahi.com/special/10005/TKY201106160166.html
!
! 6!
Japan and The Truth about TPP: The American Conspiracy.13 The most popular author of these TPP books, a self-claimed economist “Nakano Takeshi”, has three million hits in the Japanese Google’s search engine as of January, 2012, one-third of “Noda Yoshihiko” (the full name of current Prime Minister Noda). At the national-level, Japan’s joining TPP negotiations has become a wedge issue that crosscuts the partisan divides. Despite that both Prime Ministers Kan (June 2010 to September, 2011) and Noda (September, 2011 to present) of the Democratic Party of Japan showed unwavering support to TPP, only two-third of DPJ legislators explicitly followed the lead. 232 out of 480 Lower-House legislators signed the petition letter to oppose TPP organized by the Japan Agricultural Cooperatives (JA). The petition was widely circulated by the media and the JA and included 97 DPJ legislators (32% of total DPJ legislators) and 92 LDP legislators (85% of total LDP legislators). Public opinion seemed to have been swayed in response to these policy campaigns. During the early phase of discussion on TPP (November of 2010), 43% supported Japan’s participation, and 26% opposed it. Within a year, the public’s support of TPP decreased by 10% points (33%), while opposition increased by 11% points (37%) (TV Asahi’s Public Opinion Surveys, 2010 and 2011).
Bureaucratic organizations have been also divided. The Ministry of Agriculture, Fishery and Forestry (MAFF) and the Ministry of Economy, Trade and Industry (METI) came up with different mathematical formulas to calculate the costs and benefits of concluding TPP on the national economy. The METI estimated the costs of not joining TPP to be 10.5 trillion yen (i.e., equivalent of 1.53% of GDP) and 0.8 million jobs lost, while the Ministry of Agriculture, Forestry and Fishery estimated the costs of joining TPP to be 7.9 trillion yen and 3.4 million jobs lost.14
Prefectural governments followed the ministries’ lead and estimated the costs and benefits of TPP on their prefectural economy. Yet, the governments’ decisions to publish the results of estimates varied across 47 prefectures. [Table 1 here] 24 prefectural governments published the estimated damage of TPP on the agricultural sector only, while 23 prefectures published either both estimated benefits for manufacturing industries and estimated costs for agriculture, or, did not publish any estimates. What is puzzling, however, is that constituents’ interests (measured by % labor force in first industry and % manufacturing value added per GDP in a given prefecture) do account for governors’ and the assembly’s stated positions on TPP, yet they have no systematic effects on prefectural governments’ final decisions to publish the negative estimates only.15 [Table 2 here] Even more surprisingly, prefectural governors or assemblies’ stated policy-positions toward TPP do not systematically account for the governments’ final decisions to publish
!!!!!!!!!!!!!!!!!!!!!!!!!!!!!!!!!!!!!!!!!!!!!!!!!!!!!!!!13 Seven out of 32 authors have Ph.D. degrees, and additional three were “Ph.D. drop outs”. The rest of authors had B.A. or Master’s degree. Among PhDs, only two had PhDs in economics. 14 “TPP fusanka de kikan sangyo no sonshitsu 10.5 cho-yen”, Fuji Sankei Shimbun, October 27, 2010. 15 Prefectural governors representing prefectures with high proportion of labor force in first industry (% First Industry) were more likely to oppose TPP, while those who represent prefectures with high dependence on manufacturing industries (% Manufacturing) supported it. Together, % First Industry and % Manufacturing account for 34% of governors’ position-taking. !
!
! 7!
estimated benefits and/or costs of TPP on the prefectural economy. [see models six and seven of Table 2] Anti-TPP Campaigns as Exogenous to Manufacturing & Service Sector Firms
We present three forms of evidence to demonstrate that anti-TPP campaigns run by prefectural governments were largely exogenous to the economic interests of manufacturing and service sector firms. First, we develop and test a series of hypotheses about the political process in which prefectural governments decided to engage in anti-TPP campaigns, using a wealth of new prefectural-level political and economic data. The results demonstrate that the only factor that systematically accounts for the prefectural governments’ decisions to engage in Negative Campaigns is the level of farm lobby in a given prefecture and even this variable is only significant at the 10% level. Political mobilization, as measured by the levels and nature of partisan competition and interest group endorsement of political candidates during the elections, does not account for the variations in Negative Campaigns. Even more surprisingly, prefectural governors’ and assemblies’ positions on TPP –expressed via surveys and assembly resolutions –do not systematically account for the prefectural governments’ Negative Campaign decisions.
Second, we conduct an instrumental variable regression to test for the endogeneity between the strength of farm lobbying and manufacturing and service sector firm executives’ positions on TPP. The results of Wald and F-tests support that farm lobbying was exogenous to manufacturing and service firm executives’ positions on TPP, and hence support the use of probit models without an instrument.
Finally, we present the results of a series of balance tests between a group of prefectures that only published the estimated damage of joining TPP on agriculture (hereafter “Negative Campaign Prefectures”) and a group of prefectures that published both positive and negative estimates, or, did not publish any estimates at all (“Non-negative Campaign Prefectures”). The results of the balance tests suggest that the treated (“Negative Campaign”) and untreated groups (“Non-Negative Campaign”) are well balanced in their key political and economic co-variates that would predict firm executives’ trade policy positions. We further demonstrate that firm executives’ stated positions on three distributional issues in the preferential trade agreements do not differ systematically between the two prefectural groups. These three issues are: (i) import liberalization on agricultural produce; (ii) import liberalization of manufacturing industries; and (iii) liberalization of foreign markets. Even after controlling for firm executives’ stated positions on these distributional issues, their positions on TPP differ systematically between the Negative Campaign and Non-negative Campaign prefectures. Evidence of Exogeneity (1): The Political Process of Negative Campaigns
First, we discuss how preference divergence among a governor, assembly and
bureaucrats generated stochastic decisions by some prefectural governments to engage in anti-TPP campaigns. We begin with anecdotes. Assembly members in Kyoto prefecture had requested to the section chief of the Agricultural Bureau that they estimate and publish information concerning TPP’s damage on Kyoto’s agricultural economy. Yet,

!
! 8!
the section chief refused to do so, and one of the assembly members suspected that the governor or vice governor pressured the chief not to.16 The governor of Wakayama prefecture had appointed a “Project Team” of bureaucrats to calculate the estimated damages and benefits of TPP. Yet, the Project Team only reported to the governor the estimated damage on agriculture, because they “could not find a trustworthy method to calculate the TPP’s benefits.”17
This divergence of policy preferences among governors, assemblies and bureaucrats is due to three factors: (i) different electoral rules employed for the gubernatorial and assembly elections, (ii) non-concurrent elections for the governor and assembly, and (iii) the budget-maximizing goal of bureaucrats. We elaborate on each point below.
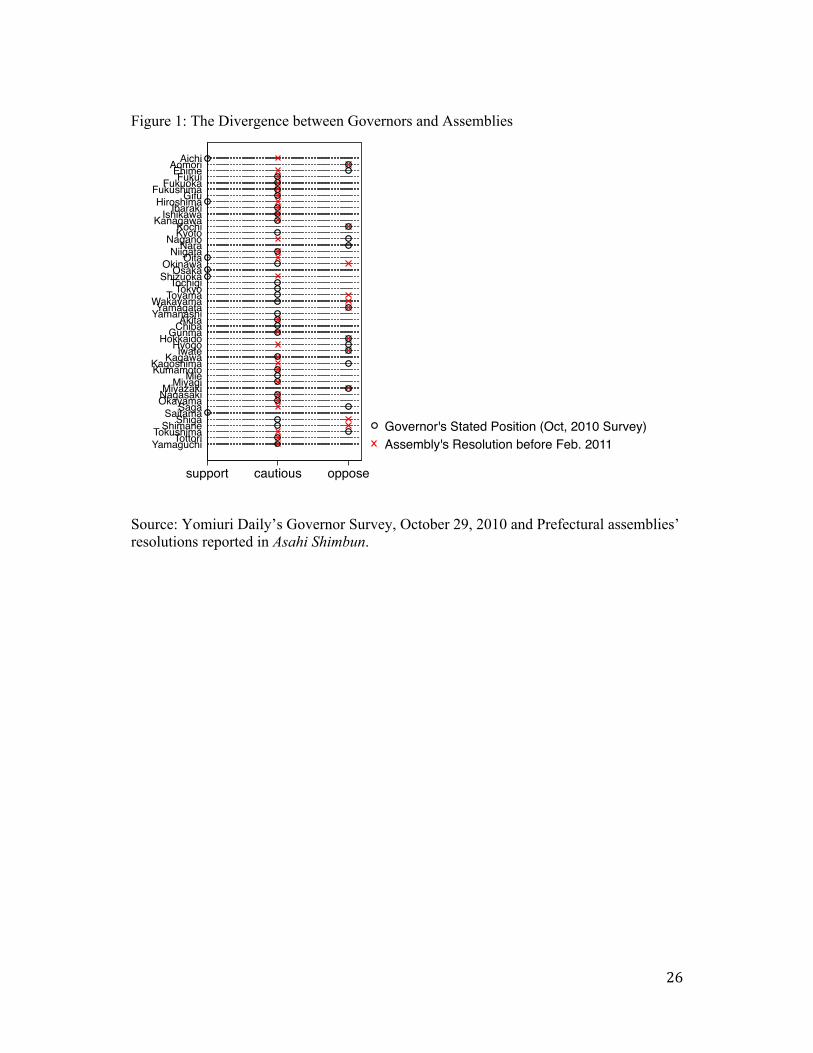
The Japanese prefectural governments employ a presidential system, where voters cast separate votes for a prefectural governor and prefectural assembly members. The electoral systems differ at the two levels: the prefectural governor election employs a single member district system encompassing the entire prefecture, whereas assembly elections use a multi-member district system. Lending support to the established wisdom that a larger constituency size is associated with pro-trade legislators and the president,18 Figure 1 visualizes this divergence: among 47 prefectures, governors and assemblies expressed exact same positions on TPP in 21 prefectures, and governors were more supportive of TPP than assemblies in 11 prefectures,, while in in only 2 prefectures were governors more protectionist than their respective assemblies.19
Second, the majority of these governors were “partisan independents” who have no official affiliations with existing political parties, but received endorsements from a grand coalition of parties during the election. This phenomena called “riding together (ainori)”, where multiple parties endorse one candidate, has been prevalent in local politics since 1990s (Soga and Machidori 2005; Horiuchi 2009; Hamamoto 2011). This makes governors’ position-taking much less catered to partisan constituents and more promiscuous. The two waves of governor surveys on TPP conducted by Yomiuri Daily during falls of 2010 and 2011 lend support to this promiscuity of governors: more than one-third of governors shifted their positions in less than a year [Figure 2 here].20
Third, the preference divergence between governor and assembly is also due to the non-concurrency of their respective elections. Although all the 47 prefectures in 1947 held concurrent elections for the governor and assembly, only 13 prefectures held concurrent elections as of the 2007 election. This change was due to events such as the !!!!!!!!!!!!!!!!!!!!!!!!!!!!!!!!!!!!!!!!!!!!!!!!!!!!!!!!16 Kyoto prefectural assembly member, Umeki Norihide’s blog entry on November 13, 2010. http://umeki.at/webry/info/201011/article_4.html. (last accessed, January 30, 2012). 17 “Wakayamaken shisan”, Yomiuri Shimbun, December 9, 2011. The similar excuse was made at the press conferences held at Saga prefecture (November 19, 2010) and Yamanashi prefecture (October 19, 2011). 18 Rogowski 1987; Karol 2007; Ehrlich 2009; Milner and Tingly n.b. 19 Using prefectural-level expenditure data, Soga and Machidori (2007) found that governors’ partisan affiliation with the left parties in the 1970s was associated with increase in budget items that broadly benefited the welfare of citizens, such as social welfare and education. They also found that in the 2000s after the decentralization reform and with the independent governors, assembly’s partisan composition has more effects on the patterns of local governments’ expenditures. 20 Eleven governors became more protectionist, and five became more supportive of TPP.

!
! 9!
governors’ deaths, scandals and calling early elections that occurred in the majority of prefectures over the period of sixty years. Fukumoto and Horiuchi (2011) leverage this difference in electoral timing as “as if” randomly assigned treatment to estimate electoral fraud. Non-concurrent elections tend to be associated with preference divergence in the two-tiered system (Neto 1997; Samuels 2004; Soga and Machidori 2005, 2007).
Finally, bureaucrats pursue their budget-maximizing goals a la Niskanen (1975) and have diverging preferences from both the governor and the assembly. With the centralized fiscal system, local governments are dependent on the central government’s transfers.21 For the Agricultural Bureau, which is in charge of estimating the TPP’s damages, making a legitimate claim for the need to compensate TPP losers is critical to either maintain or expand their budget. On the other hand, the Commerce and Industry Bureau, which has jurisdiction over manufacturing industries, has no incentives to publish the estimated benefits of TPP, because the positive estimates might reduce their section’s budget.
When the policy positions of the three actors diverge as discussed above, who ultimately wins? Scholars have only come to the consensus that “it depends”. The post-war democratic reform, led by the Allied Occupation, gave equal power to governors and assemblies to ensure checks and balances. Bureaucrats can also leverage their technical expertise and change the course of policy through implementations, as evidenced by “the lack of a trustworthy method” strategy that Wakayama’s Project Team had come up with.22 The formal and informal power structures discussed above do not give an ultimate upper-hand to any of these actors, and hence often, if not always, generate stochastic decisions.
Models one to six in Table 2 present the results of probit estimates of Negative Campaign, using political and economic co-variates. Models seven and eight summarize the results for prefectural governors’ stated positions on TPP in the survey conducted by Yomiuri Daily on November 10th of 2010. Model nine presents the same results for governors’ positions but uses Yomiuri’s 2011 survey. Models ten and eleven summarize the results for prefectural assemblies’ positions on TPP, expressed via assemblies’ resolutions.
Overall, the results suggest that the only variable that accounts for Negative Campaign is the relative strength of the farm lobby, measured by the percentage of primary industry in a given prefecture (% Primary Industry) and the percentage of agricultural value added per prefecture’s gross domestic product (% Agri GDP). These variables are, however, only significant at the 10% level, and also are sensitive to specifications such as the inclusion of control variables. The nature of electoral competition, interest groups’ partisan endorsement and the proximity to the next election do not account for either prefectural governments’ Negative Campaign decisions, or,
!!!!!!!!!!!!!!!!!!!!!!!!!!!!!!!!!!!!!!!!!!!!!!!!!!!!!!!!21 The decentralization reform in 1999 to abolish “delegated functions (kikan inin jimu)”, where local governments carried out the central government’s administrative tasks has reportedly led to the weakening power of local bureaucrats, but empirical evidence on this is still scant. 22 The Local Autonomy Law specifies that a governor can propose legislations and call an early election. Yet s/he is dependent on assembly to legislate policies and electoral cooperation from assembly members, in forms of vote mobilization, is also critical for the governor’s reelection (Natori 2004; Sunahara 2009). Assembly is also given power to cast a non-confidence vote on the governor, but does not possess an agenda-setting power.

!
! 10!
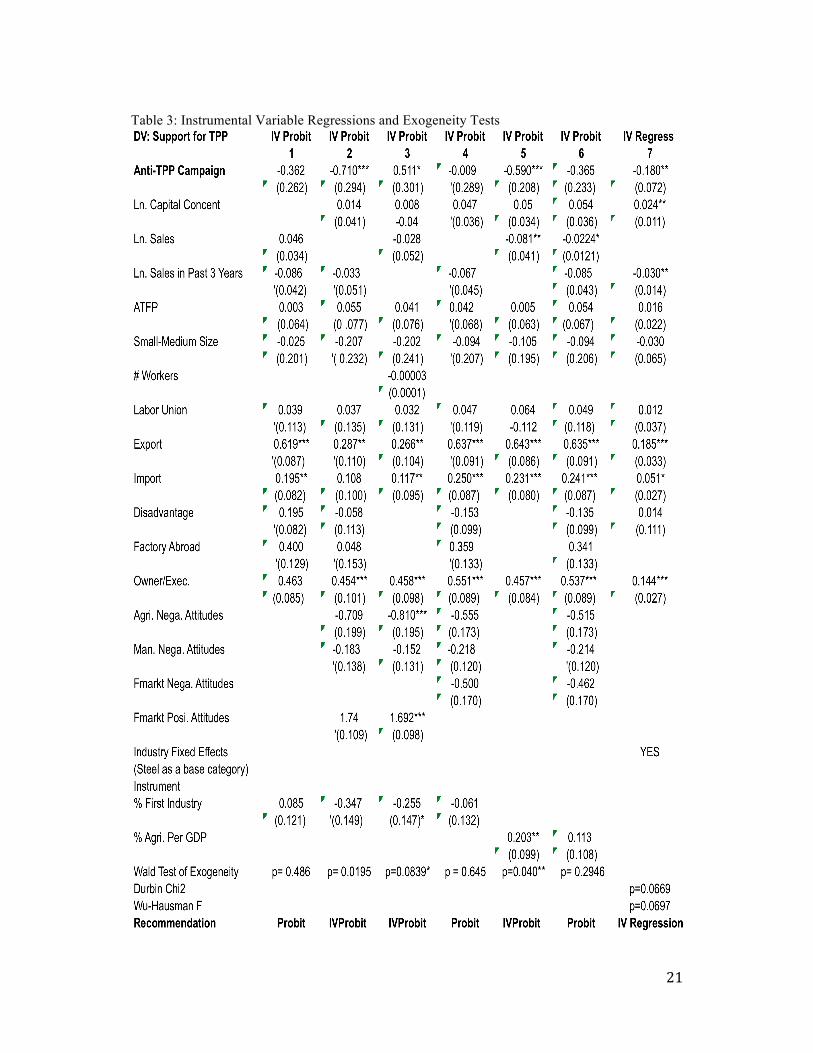
governors’ or assemblies’ stated positions on TPP. The results conform to the narrative above that Negative Campaigns are relatively stochastic decisions by prefectural governments and weakly endogenous to the level of farm lobby in a given prefecture. Evidence of Exogeneity (2): Instrumental Variable Regressions and Exogeneity Tests Second, we conduct a series of instrumental variable regressions where the level of farm lobby is an instrument for prefectures’ decisions to engage in anti-TPP campaigns (Negative Campaign). The farm lobby meets two conditions for an appropriate instrument: (i) farm lobby has predictive power for the Negative Campaign (i.e., endogenous regressors) as shown in Table 2, and (ii) the farm lobby should be exogenous to manufacturing and service sector firms’ positions on TPP (i.e., farm lobby is orthogonal to the error term ui in the model estimating firms’ TPP positions). We use two proxies for the levels of farm lobby, one is the percentage of first industry per prefectural labor force (% First Industry) and another is the percentage of agricultural production per prefecture’s GDP (% Agri. GDP).23
Table 3 demonstrates that Wald and F-tests cannot reject the null-hypothesis (that the farm lobby is exogenous to the Negative Campaign) in three out of seven models and thus suggest that running a probit model without an instrument would be appropriate. When exogeneity was rejected, models two, three, five and seven suggest that the Negative Campaign has systematic reductive effects on firm executives’ positive expectation about the effect of TPP on their businesses. One potential caveat of these exogeneity tests is that the first condition (i.e., exogeneity of the farm lobby for manufacturing and service sector firms’ positions on TPP) cannot be empirically tested.24 For instance, elite mobilization might be an omitted variable determining both the level of farm lobby as well as manufacturing and service sector firms’ positions on TPP. We address this potential weakness by conducting a series of balance tests between Negative Campaign and Non-negative Campaign prefectures in the next section. Evidence of Exogeneity (3): The Balance Tests
Finally, we conducted a series of balance tests to demonstrate that the “usual
suspects”—constituents’ interests, governors’ partisan affiliation and support, the levels of electoral competition at the prefectural and the national level, and the levels of interest group mobilization–do not systematically account for why 23 prefectural governments officially engaged in anti-TPP campaigns, while the rest did not.
!!!!!!!!!!!!!!!!!!!!!!!!!!!!!!!!!!!!!!!!!!!!!!!!!!!!!!!!23 We also used Japan Agricultural Cooperative’s membership per capita in a given prefecture as a third proxy, but the results do not support the endogeneity between the JA membership and firms’ positions on TPP. Ideally, we would like to use farmers’ campaign contribution to legislators as a direct measure for the farm lobby. This data, however, does not exist because Political Finance Law in Japan prohibits industries that receive subsidies from the government to give campaign contribution to politicians and farmers are the prime recipients of government’s subsidies. See Naoi and Krauss 2009. 24 Wooldridge 2002: Chapter 5.

!
! 11!
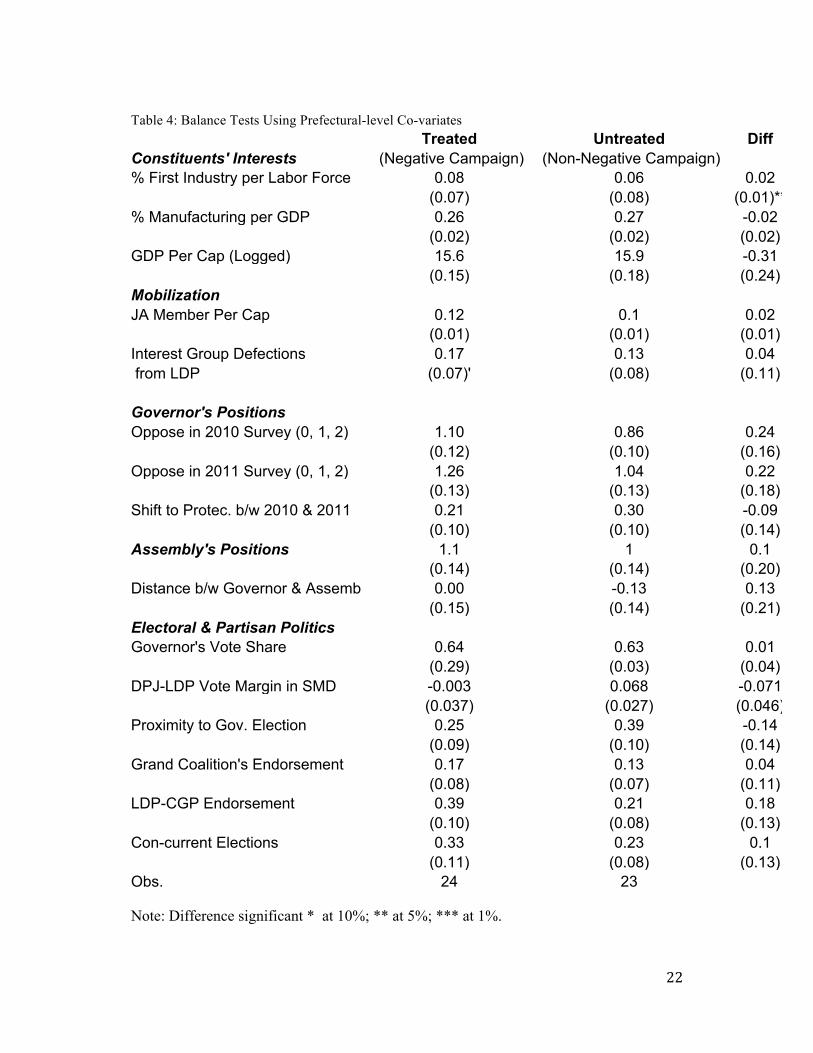
Table 4 summarizes the results of our balance tests using prefectural-level co-variates. 24 prefectures that published the estimated damage of TPP on prefectural economy (“the treated”) and 23 prefectures that did not (“untreated”) are well-balanced in all the possible co-variates except for the percentage of labor force engaged in first industry (agriculture, forestry and fishery) as of 2010. The negative campaign prefectures have a higher percentage of their workforce (by two-percentage points) engaged in the first industry than non-negative campaign prefectures, and this difference is significant at 5% level.
The patterns of partisan and electoral competition in a prefecture, on the other hand, turn out to have no systematic effects on governments’ decisions to engage in negative campaigns.25 These were measured by the vote margin for gubernatorial elections (Vote Margin), patterns of party and interest group endorsements during the gubernatorial elections (Grand Coalition and Interest Group Endorsement, respectively), and the DPJ and LDP vote share differences in single-member districts during the 2009 Lower-House election (DPJ-LDP Vote Margin). Neither of these variables turns out to have systematic effects. The lack of systematic effects of partisan and electoral competition conforms to the conventional wisdom that prefectural governor elections have become increasingly less partisan due to independent candidates and the endorsement of grand coalitions since 2000. Governors facing an election in less than six months were less likely to oppose TPP, which lends support to the idea that governors facing an election have incentives to represent broader constituents (i.e., consumers) than organized interests (i.e., producers).
Table 5 summarizes our balance tests using firm-level co-variates and further confirms that the treated and untreated groups are balanced. The treated and untreated groups are unbalanced in two firm-level co-variates, percentage of small-medium size firms (Small Medium Size Firms26) and percentage of firms that contributed campaign money to parties or legislators in the past five years (Campaign Contribution).27 Firms operating in the negative campaign prefectures are four percentage point more likely to be small-medium size firms than those located in non-negative campaign prefectures, and this difference is significant at 1% level. Firms in negative campaign prefectures are ten percentage points more likely to have contributed campaign money to parties or legislators than those in the non-negative campaign prefectures, and this difference is significant at 1% level. These results are problematic for the purpose of our study, if firms in the negative campaign prefectures lose more (or gain less) from Japan’s participation in TPP due to their size or dependence on politicians.
Yet, four different variables measuring a firm’s “comparative disadvantage” are well-balanced between the treated and untreated groups (R=V Comparative Disadvantage, H=O Comparative Advantage, and Sales Growth and Sales Per Capita).
!!!!!!!!!!!!!!!!!!!!!!!!!!!!!!!!!!!!!!!!!!!!!!!!!!!!!!!!25 High electoral competition, especially in the two-party system, for instance, is likely to be associated with policies favoring broader and unorganized constituents, such as consumers. 26 We used the Japanese government’s definition for small-medium size firm: a firm with less than 300 employees. 27 We asked whether a firm either gave campaign contribution or purchased parties’ or legislators’ fundraising party tickets (“paatee ken”). Due to loser requirements for keeping the record, the fundraising tickets are loopholes for companies who do not want to go on campaign finance record.
!
! 12!
Furthermore, firm executives’ expectations about the effect of following three policies on their businesses are well-balanced between the two prefectural groups: further import liberalization of manufacturing industries (Import Liberalization), further import liberalization of agriculture (Agr. Liberalization) and further import liberalization of foreign market (FMarket Liberalization). The proportion of firms that received government’s subsidy is also well-balanced. These results suggest that we can safely say that the two variables that failed the balance tests are not systematically correlated with firms’ inherent positions on trade liberalization.
We also conducted the balance tests in each of the 18 industries classified in Table 6. Column three of Table 5 lists industries in which the balance tests fail and (+) sign indicates that firms in the treated group (negative campaign prefectures) have higher mean values than the firms in the untreated group, and (-) sign indicates that firms in the treated group has lower mean values than those in the untreated group.
Overall, the balance tests suggest that the treatment (Negative Campaign) is exogenous to manufacturing and service sector firms’ trade policy positions. The Firm Executive Survey
Then, how did these “location-specific” negative campaigns affect firm executives’ expectations about TPP? To answer this question, we conducted an original survey of firm executives in manufacturing and service sectors, a few months after a half of prefectural governments (n=23) published the estimated damage of TPP, and the rest (n=24) had not.28 [See Timeline of Our Survey in appendix] These firm executives are registered monitors at Teikoku Data Bank, a credit research company that has the largest database and credit information of 1.5 million firms in Japan.29
The survey was sent via e-mail to 4,183 registered executives and high-rank employees.30 We solicited the survey responses from all the registered monitors in manufacturing and farming industries. In addition, we solicited the responses from all the monitors in five service industries: construction, restaurants and bars, temporary staff agency, medical and welfare services, and entertainment. These service industries were chosen for the analysis as they are reported to be potential beneficiaries (restaurants and bars and entertainment) and losers (construction and medical and welfare services) of TPP. 53% of firm executives responded, which resulted in 2,217 responses. Table 5 summarizes the distribution of respondents across industries and sectors. The survey asked various questions regarding how policy and environmental changes such as trade and investment liberalization, the partisan change to the Democratic Party of Japan, and the appreciation of Yen affects their businesses. The survey instrument on TPP is as follows:
!!!!!!!!!!!!!!!!!!!!!!!!!!!!!!!!!!!!!!!!!!!!!!!!!!!!!!!!28 Our firm survey was conducted between February 4th and 15th, 2011. Hokkaido prefecture was the first to publish the original calculation of TPP’s costs on its agriculture on October 27th, 2010, and the majority of 23 “negative campaign” prefectures published the estimated costs during November of 2010. 29 Information about Teikoku Data Bank is available here: http://www.tdb.co.jp/index.html. 30 51% of respondents were firm owners or executives, 12% was department director (bucho), 8% are managers or assistant managers, and 30% held other positions.

!
! 13!
“Please tell us how the following changes would affect your business. In answering these questions, please think about its effect on your business, rather than expressing your personal opinions…Conclusion of TPP” (Translation by the authors).31
Respondents choose only one answer from the five options: 1. good effects, 2.
not much effects, 3. bad effects, 4. depends on sections within a firm, 5. don’t know. We construct TPP Support, which is a dichotomous variable and takes a value of one if an executive chose 1. good effects, and zero if s/he chose 2. not much effects or 3. bad effects. Other responses were treated as missing.
Our main co-variate of interests is Negative Campaign, which takes a value of one if a given firm is located in the negative campaign prefectures, and zero otherwise. Following the recommendation from the exogeneity tests discussed above, we control for the importance of agriculture for the prefectural and regional economy. % Primary Industry is the percentage of labor force employed in agriculture, fishery and forestry in a given prefecture. % Agr. GDP is agriculture’s value added per gross prefectural products (%) using Statistics of Prefectural Economy published by the Cabinet Office in 2009.
We also included a host of industry and firm-level co-variates. To test the Ricardo-Viner model of trade, Comparative Disadvantage takes a value of one if a manufacturing firm is in net import sector, and zero otherwise. We matched the industry classification used by Teikoku Data Bank with International Standard Industry Classification (ISIC) and calculate net export and import values in U.S. dollars from 2000 to 2008 using OECD’s Micro Trade Indicators.
To test Melitz’s (2003) firm-level model of trade, we include Capital Concentration, which is a firm’s tangible fixed assets divided by the number of employees. We also control for firms’ productivity, which is proxied by the following three co-variates. ATFP is approximate total factor productivity used in Head and Ries (2003), Labor Productivity is total sales divided by the number of employees, and Sales is the values of sales in 2010. Labor Union takes a value of one if a firm has within-enterprise union, and zero otherwise. Export and Import are dummy variables that each takes a value of one if a firm exports and imports, respectively, and zero otherwise. Factory Abroad takes a value one if a firm has production facilities abroad, and zero otherwise.
Emerging literature on preferential trade agreements has also found that countries’ motive to sign the agreement is not trade, but a better protection of their outward foreign direct investment from expropriation risks (Buthe and Milner 2008; Manger 2009;Tobin and Busch 2010). We control for this by whether firm has a factory abroad as discussed previously (Factory Abroad) and whether firm executives have stated in our survey that foreign market liberalization will have positive or negative effects on their businesses (FMarkt_Positive and FMarkt_Negative, respectively). We also control for respondents-specific characteristics. Owner/Exec. takes a value of one if a respondent was an owner or executive board members of a given firm, and zero otherwise. Because our data is three-tiers (firms, industries and prefectures), we employ a generalized linear latent and mixed model with random intercepts (Gelman 2005; Gelman !!!!!!!!!!!!!!!!!!!!!!!!!!!!!!!!!!!!!!!!!!!!!!!!!!!!!!!!31 The original, Japanese language version is available upon request.

!
! 14!
and Hill 2006). We use probit estimation as the dependent variable is dichotomous. The multilevel model estimates the effects of firm-, industry- and prefectural-level attributes on firms’ positions on TPP, and how these firm-level effects differ within and across industries and prefectures. The Results: Who Support TPP? Table 8 reports the results of multilevel probit estimates of TPP Support (1: Support, 0: Otherwise). Across the models 1 to 3, firm executives operating in Negative Campaign prefectures are nine percentage point more likely to report TPP will have negative effects on their businesses, controlling for a host of firm, respondent, industry and prefectural-level covariates. The results are robust across different specifications.
Between the Ricardo-Viner and Melitz’ heterogeneous firm models, the Melitz’s firm model finds stronger support. Firms with high Capital Concentration are more likely to expect positive effects of TPP on their businesses. Firms’ foreign market engagement— either in a form of Export, Import or having a Factory Abroad — is associated with more positive expectations about TPP’s effect on their businesses. This finding challenges the conventional, operationalization of “comparative disadvantage” industries and electoral districts. Importing firms are as pro-trade as exporting firms. Firms in Comparative Disadvantage sectors are no less positive about the effect of TPP on their businesses, compared to firms in comparative advantage sectors.
The three measures of firm’s productivity (ATFP, Labor Productivity and Sales), however, do not turn out to have systematic effects in most of the models. There are two interpretations for the surprising lack of productivity effects. The first is that Melitz’s firm-level model of trade does not corroborate with the pattern we observe in reality. The second is that executives of small firms might be overestimating the positive effects of TPP than executives in larger firms. Alternatively, executives of small and medium-size firms, which constitute 90% of our sample, might have a lower level of information about TPP than those of large firms, which leads to their skewed understanding of TPP’s distributional effects. Respondent-specific characteristics show interesting results. Controlling for firm-specific and industry-specific attributes, firm owners are more likely to expect the conclusion of TPP will have positive effects on their businesses than other high-rank employees who responded to our survey, such as directors and managing directors. There are two interpretations of this result. One is consistent with Hecksher-Ohlin theorem of trade that capital owners in capital-rich economy (i.e., Japan) will benefit from the freer movement of goods across national borders (i.e., the conclusion of TPP). Despite that we made sure that respondents assess TPP’s expected effect on their businesses and not their personal “opinions”, firm executives might have conflated the two. Second is that those who were selected into executive positions are generally more optimistic about their business prospect than regular employees. Alternative Hypothesis and Robustness Check
Merely showing the correlation between the presence of anti-TPP campaigns and more firms opposing TPP is not sufficient to establish causation. In particular, one could

!
! 15!
argue that the causal story might actually be reverse: manufacturing and service sector firms in negative campaign prefectures have more to lose from TPP, and thus lobbied prefectural governments harder to publish the negative estimates. Although the lack of panel survey data on firm executives somewhat limits our strategies to address this criticism, we demonstrate that firms in Negative Campaign prefectures are no more protectionist than firms in Non-Negative Prefectures if we examine their responses to more generic questions on import liberalization in manufacturing and agriculture.
In conjunction with our TPP question, we asked respondents to assess the effects of “import liberalization of manufacturing goods” and “import liberalization of agricultural goods” on their businesses. Responses by firms located in Negative Campaign prefectures do not systematically differ from firms located in Non-Negative Campaign Prefectures. [See the bottom two rows of Table 5]32 Models two and six of Table 8 further demonstrate that after controlling for firm executives’ positions on agricultural import, manufacturing import and foreign market liberalization, the effect of “Negative Campaign” still remain: fifteen percentage points decrease in firm executives’ positive expectations about the effect of TPP. These results further lend support to our argument that policy campaigns framed business interests, not vice-versa.
Conclusion Despite the established consensus that firms are highly influential actors in
domestic and international politics, we still know very little about how firms take policy positions beyond what economic models have taught us. Our paper has sought to push this important research agenda forward in three ways.
First, this paper has demonstrated that policy information can frame firm executives’ distributional expectations about a forthcoming policy, just like it frames ordinary citizens. When political competition generates competing and biased information about a forthcoming policy, policy campaigns might frame even corporate executives. This finding challenges the existing view of firms as economic agents who merely act on their self-interests. The finding also forces us to take additional care in using firm-level surveys as “true” expressions of firm preferences.
Second, studies on individual attitudes toward globalization have flourished in the past decade, yet only several studies have looked at the effect of elite communication on the formation of mass opinions. Our findings warrant further studies on the effect of policy campaigns on mobilizing protectionist coalitions among the voters and interest groups.
Finally, our paper has provided one of the first tests of competing trade models using a firm executive survey. While economists have often looked down upon the use of actors’ “stated preferences” as unreliable and subjective, we hope to have demonstrated that survey methods have distinct advantages over “revealed preference” approach, because they allow scholars to study how firm executives perceive and expect forthcoming policy changes and document what informational environment they are in.
In concluding, we note two promising lines of future research. First, although our !!!!!!!!!!!!!!!!!!!!!!!!!!!!!!!!!!!!!!!!!!!!!!!!!!!!!!!!32 The difference-in-means tests are robust even if we limit our sample to manufacturing industries.
!
! 16!
study looked at capitalist democracy, the importance of policy campaigns on firm preferences and behaviors is even more salient question in authoritarian regimes. Studying how the highly regulated media and elite communication shape firms’ policy position-taking would be a promising line of future research. Second, the role of traditional and new media in mobilizing coalitions, as seen in Occupy Wall street movement, is an exciting area of new research.

!
! 17!
Bibliography
Abrajano, Marisa. 2010a. Campaigning to the New American Electorate: Advertising to Latino Voters. 2010. Stanford University Press.
Alt, James E., Fredrik Carlsen, Per Heum, and Ka ̊re Johansen. 1999. “Asset Specificity and the Political Behavior of Firms: Lobbying for Subsidies in Norway.” International Organization 53: 99–116.
Bartel, Larry. 2008. Unequal Democracy: The Political Economy of the New Gilded Age.
Bernard, Andrew B., Stephen J. Redding, and Peter K. Schott. 2007b. Comparative Advantage and Heterogeneous Firms. Review of Economic Studies 74 (1):31-66.
Bertrand, Marianne, and Sendhil Mullainathan. 2001. Do People Mean What They Say? Implications for Subjective Survey Data. American Economic Review 91 (2):67-72.!
Broz, J. Lawrence and Michael Plouffe. 2010. “The Effectiveness of Monetary Policy Anchors: Firm-Level Evidence.” International Organization 64, 4 (Fall).
Dahl, Robert. 1963. Who Governs? Democracy and Power in an American City. New Haven, CT: Yale University Press.
Davis, Christina. 2003. Food Fights Over Free Trade: How International Institutions Promote Agricultural Trade Liberalization. Princeton University Press. Princeton, NJ.
Druckman, J. N. 2004. Priming the Vote: Campaign Effects in a U.S. Senate Election. Political Psychology, 25: 577–594.
Head, Keith, and John Ries. 2003. Heterogeneity and the FDI versus export decision of Japanese manufacturers. Japanese and International Economies 17 (4):448-467.
Helpman, Elhanan, Marc J. Melitz, and Stephen R. Yeaple. 2004. Export Versus FDI with Heterogenous Firms. American Economic Review 94 (1):300-316.!
Jo Martin, Cathie. 1995. Nature or Nurture? Sources of Firm Preference for National Health Reform. The American Political Science Review, Vol. 89, No. 4 (Dec., 1995), pp. 898-913 Kenyon, Thomas and Megumi Naoi. 2010.“Policy Uncertainty in Hybrid Regimes: Evidence from Firm-level Surveys,” Comparative Political Studies. Vol.43, No. 4, April 2010.
Krauss, Ellis and Megumi Naoi. 2011. “The Domestic politics of Japan’s Regional Foreign Economic Policies,” a chapter in a book edited by Vinod Aggarwal, The

!
! 18!
Domestic Determinants of Asian Regionalism.
Kuno, Arata and Megumi Naoi. 2011. The Determinants of Firm-level Attitudes Toward TPP: Evidence from a Survey of Japanese Firms,” Keio GCOE Working Paper Series (#DP2011-018), available in Japanese at: http://www.gcoe-econbus.keio.ac.jp/pdf/dp/DP2011-018.pdf.
Gourevitch, Peter, and James Shinn. 2005. Political Power and Corporate Control: The New Global Politics of Corporate Governance. Princeton, NJ: Princeton University Press. Grossman Gene M. and Elhanan Helpman. 1994. “Protection for Sale” American Economic Review Vol. 84, No. 4, pp. 833-850
Magee, Stephen P. 1978. Three Simple Tests of the Stoper-Samuelson Theorem. In Issues in International Economics, edited by P. Oppenheimer. Stockfield, UK:Oriel Press.!
Mayda, Anna Maria, and Dani Rodrik. 2005. Why are some people (and countries) more protectionist than others? European Economic Review 49 (6):1393-1430.
Malesky, Edmund. 2008. “Straight Ahead on Red: How Foreign Direct Investment Empowers Subnational Leaders.” Journal of Politics 70(1):1-23.
Mansfield, Edward and Diana Mutz. 2009. Support for Free Trade: Self-Interest, Sociotropic Politics, and Out-group Anxiety. International Organization. Vol.63, Issue 3.
Stratmann, Thomas. 1998. “The Market for Congressional Votes: Is Timing of Contributions Everything?” Journal of Law and Economics 41(April): 85–113.
Stephen Haber, Armando Razo, Noel Maurer. 2004. The Politics of Property Rights: Political Instability, Credible Commitments, and Economic Growth in Mexico, 1876-1929.
Mares, Isabela. 2003. The Sources of business interest in social insurance: sectoral versus national differences. World Politics 55 (January 2003), 229–58.
Melitz, Marc J. 2003. The Impact of Trade on Intra-Industry Reallocations andAggregate Industry Productivity. Econometrica 71 (6):1695-1725.
Milner, Helen V. 1988. Resisting Protectionism: Global Indus- tries and the Politics of International Trade. Princeton, NJ: Princeton University Press.
Mussa, Michael. 1982. Imperfect factor mobility and the distribution of income. Journal of International Economics 12 (1-2):125-141.!
Okun, Author M. 1975, Efficiency vs. Equality. Washington DC: The Brookings

!
! 19!
Institution.
Popkin, Samuel L. 1994. The Reasoning Voter: Communication and Persuasion in Presidential Campaigns. University of Chicago Press.
Scheve, Kenneth F., and Matthew J. Slaughter. 2001a. What determines individualtrade-policy preferences? Journal of International Economics 54 (2):267-292.
Scheve, Kenneth F., and Matthew J. Slaughter. 2001b. Labor Market Competition and Individual Preferences Over Immigration Policy. Review of Economics and Statistics 83 (1):133-145.
Tilly, Charles. 1992. Coercion, Capital and European States: AD 990 – 1992. Wiley Blackwell.
Tomiura, Eiichi. 2007. Foreign outsourcing, exporting, and FDI: A productivity comparison at the firm level. Journal of International Economics 72 (1):113-127.
Naoi, Megumi and Ikuo Kume. 2011. “Explaining Mass Support for Agricultural Protectionism: Evidence from a Survey Experiment During the Global Recession,” International Organization, Vol.65, No.4.
Naoi, Megumi and Ellis Krauss. 2009. “Who Lobbies Whom: Special Interest Politics under Alternative Electoral Systems,” American Journal of Political Science, Vol.53, No.4. October 2009.
Rogowski, Ronald. 1987. “Trade and Variety of Democratic Institutions.” International Organization 41(2): 203–23.

!
! 20!
Tables and Figures Table 1: The Patterns of Anti-TPP Campaigns by 47 Prefectural Governments Pref. Govts Published Estimated Damages Only Hokkaido、Iwate、Miyagi、Akita、Gunma、Saitama、Chiba、Mie
、Shiga、Hyogo、Tottori、Shimane、Okayama、Yamaguchi、Tokushima、Kagawa、Saga、Nagasaki、Kumamoto, Miyazaki, Kagoshima
Pref Govts Published Estimated Benefits & Damages Kouchi, OhitaPref Govts Published Estimated Benefits Only AichiEstimated Damages Only but Did not Publish Them Aomori, YamagataAgr. Coopratives Estimated & Published Damages Fukui, Ibaragi, Hiroshima, OkinawaSource: Author's data compiled using local newspapers and prefectural governments' websites

Table 2: The Determ
inants of Negative C
ampaigns
DV: O
ppose TPP N
egative N
egative N
egative N
egative N
egative N
egative G
ovenor G
ovenor G
ove2011 A
ssemb
Assem
b
1
2 3
4 5
6 7
8 9
10 11
% First Industry
0.086*
0.08 0.08
0.26 0.23
0.21 0.19
0.2
(0.052)
(0.05)
(0.06)
(0.09)***
(0.10)** (0.06)***
(0.05)*** (0.06)***
% A
gr. GD
P
27.02*
(15.90)
%
Manufacturing
-0.29 0.52
-5.95 -6.34
-5.8 -1.65
-1.5
(2.66)
(2.75)
(3.41)*
(3.55)* (2.80)**
(2.43) (2.48)
Governor's V
ote M
arg
-0.63
0.69
0.5
0.86
(1.41)
(1.56)
(1.67)
(1.27)
Grand C
oalition
-0.42
0.77
-0.93
(0.56)
(0.70)
(0.52)*
Proxim
ity Election
0.34
-0.00000112
0.16
(0.42)
(6.65e-07)*
(0.38)
DP
J-LDP
Vote
Margin
-0.89
0.35
(1.38)
(1.65)
G
overnor's Position
0.34
(2010 S
urvey)
(0.39)
Assem
bly's Position
0.14
(R
esolution)
(0.28)
Obs.
47 47
47 47
47 47
42 47
47 47
47 P
suedo R-square
0.046 0.043
0.044 0.073
0.013 0.004
0.284 0.304
0.226 0.157
0.182 N
ote: Probit estimates. * significant at 10%
; ** at 5%; *** at 1%
.
!
! 21!
Table 3: Instrumental Variable Regressions and Exogeneity Tests
!
! 22!
Table 4: Balance Tests Using Prefectural-level Co-variates Treated Untreated Diff Constituents' Interests (Negative Campaign) (Non-Negative Campaign)
% First Industry per Labor Force 0.08 0.06 0.02
(0.07) (0.08) (0.01)**
% Manufacturing per GDP 0.26 0.27 -0.02
(0.02) (0.02) (0.02)
GDP Per Cap (Logged) 15.6 15.9 -0.31
(0.15) (0.18) (0.24)
Mobilization JA Member Per Cap 0.12 0.1 0.02
(0.01) (0.01) (0.01)
Interest Group Defections 0.17 0.13 0.04 from LDP (0.07)' (0.08) (0.11)
Governor's Positions Oppose in 2010 Survey (0, 1, 2) 1.10 0.86 0.24
(0.12) (0.10) (0.16)
Oppose in 2011 Survey (0, 1, 2) 1.26 1.04 0.22
(0.13) (0.13) (0.18)
Shift to Protec. b/w 2010 & 2011 0.21 0.30 -0.09
(0.10) (0.10) (0.14)
Assembly's Positions 1.1 1 0.1
(0.14) (0.14) (0.20)
Distance b/w Governor & Assemb 0.00 -0.13 0.13
(0.15) (0.14) (0.21)
Electoral & Partisan Politics Governor's Vote Share 0.64 0.63 0.01
(0.29) (0.03) (0.04)
DPJ-LDP Vote Margin in SMD -0.003 0.068 -0.071
(0.037) (0.027) (0.046)
Proximity to Gov. Election 0.25 0.39 -0.14
(0.09) (0.10) (0.14)
Grand Coalition's Endorsement 0.17 0.13 0.04
(0.08) (0.07) (0.11)
LDP-CGP Endorsement 0.39 0.21 0.18
(0.10) (0.08) (0.13)
Con-current Elections 0.33 0.23 0.1
(0.11) (0.08) (0.13)
Obs. 24 23
Note: Difference significant * at 10%; ** at 5%; *** at 1%.

!
! 23!
Table 5: Balance Tests Using Firm-level Co-variates
Negative Campaign Non-Negative Diff
Economic Characteristics R=V Comparative Disadvantage 0.24 0.22 0.02
(import > export) (0.02) (0.01) (0.02) H=O Comparative Disadvantage 1.89 1.87 0.01 (Capital-Labor Ratio) (0.02) (0.01) (0.02) Sales Growth, 2009-2010 -5.99 -7.99 2
(1.55) (1.09) (1.94)
Sales per capita (2010) 45.61 44.16 1.45
(3.19) (1.25) (2.84)
Small Medium Size Firms 0.98 0.94 0.04
(0.006) (0.006) (0.010)***
Num. of Employees 67.22 147.72 80.5
(4.21) (15.24) (22.44)***
Political Mobilization Campaign Contribution 0.46 0.37 0.10
(0.02) (0.37) (0.01)***
Govt. Subsidy 0.5 0.53 -0.03
(0.02) (0.01) (0.02)
Respondents' Characteristics Titles (Owners/Exec. Board) 0.53 0.5 0.03
(0.02) (0.01) (0.02)
Pessimists (Residuals of Obj-Subj) -0.06 -0.08 0.02
(0.04) (0.03) (0.05)
Policy Preferences Stated Position on Import Lib. 0.15 0.16 0.02
(0.01) (0.01) (0.02)
Stated Position on Agr. Lib. 0.09 0.1 0.01
(0.01) (0.01) (0.02)
Note: Difference significant * at 10%; ** at 5%; *** at 1%.

!
! 24!
Table 6: Descriptive Statistics
Obs. % SM Firms Avg. EmployeeCapital Stock
(Avg、Million Yen)Sales in past 3 years(Avg、Million Yen)
Agriculture, Forestry and Fishery 18 88.9% 100.1 925.7 9,210.1Construction 700 98.4% 85.9 321.3 6,569.0Bevarage & Processed Food 156 94.2% 99.1 282.9 6,467.4Textile & Clothing 48 97.9% 64.0 149.4 2,112.2Furniture & Pottery 102 97.1% 91.0 226.9 3,500.5Pulp & Papers 47 100.0% 73.3 39.8 2,505.3Publishing & Printing 89 97.8% 105.6 70.8 3,439.2Chemical Industry 182 92.3% 178.9 1,943.6 14,707.0Steel, Non-Ferrous Metals and Mining 232 96.6% 108.4 179.9 5,209.1Machinary 238 91.6% 181.7 540.5 7,677.5Electronic Machinary 184 91.8% 199.4 1,225.9 10,037.1Transportation 39 79.5% 285.8 398.4 11,517.3Precision Instruments & Medical Equipments 33 90.9% 192.9 1,097.8 7,779.3Other Manufacturing 40 97.5% 72.6 114.8 2,161.6Service (Restaurants & Bars) 17 82.4% 134.9 138.9 4,955.2Service (Entertainment) 28 82.1% 77.3 450.4 11,015.5Service (Temporary Employment Agency) 19 94.7% 57.1 30.9 2,709.4Service (Medical & Welfare) 45 86.7% 96.3 229.8 1,691.5Total 2,217 94.9%Source: Our Firm Executive Survey Table 7: Coding “Comparative Disadvantage” Industries
Trade Balance(Cum. 2000-2008)
R=V Trade Positions
Beverage & Processed Food -324,272.3Textile & Clothing -188,523.0Agriculture, Forestry and Fishery -164,983.7Furniture, Building Materials & Ceramic Industry -140,661.7Other Manufacturing -63,881.1Pulp & Paper -10,637.9Publishing & Printing -6,419.5Steel, Non-ferrous metal, and mining 5,130.8 Comparative AdvantagePrecision and Medical Instruments 109,896.8Chemical Industry 228,613.4Electronic Machinary 483,007.4Machinary Industry 565,134.8Transportation and Equipment Industries 1,108,863.0
Comparative Disadvantage
Source: OECD Website "Micro Trade Indicators (by category of industry, ISIC)"Note: Unit:$U.S. Million.

!
! 25!
Table 8: Firm Executives’ Expectations about TPP DV: Support for TPP Multi-level Multi-level Multi-level Multi-level Multi-level Multi-level
1 2 3 4 5 6Anti-TPP Campaign -0.219** -0.208** -0.207* -0.210* -0.212* -0.209*
(0.102) (0.104) (0.113) '(0.109) (0.109) (0.110) Ln. Capital Concent 0.009 -13.224** 5.690 -6637.728*** 7.853 0.976
(4.728) (5.616) (5.504) '(3.030) (5.872) (14.961)Ln. Sales 0.182 39.770** -16.896 199913.4 -23.382 -2.632
(14.183) (16.848) (16.514) (9.091)*** (17.615) (44.885)Ln. Sales in Past 3 Years -0.169 -0.078* -0.075* -0.076* -0.075* -0.176***
(0.043) (0.045) (0.044) '(0.044) (0.044) (0.040)ATFP -0.134 -39.770** 16.96 -19913.29*** 23.449 2.8
(14.183) (16.848) (16.514) (9.091) (17.615) (44.884) Small-Medium Size -0.127 -0.245 -0.249 -0.251 -0.250 -0.319
(0.215) '( 0.219) (0.209) '(0.210) (0.209) (0.199)# Workers 0.00007 0.00001
(0.0001) (0.0001)Labor Union 0.063 0.096 0.104 0.103 0.102
(0.117) (0.119) (0.122) '(0.122) (0.122)Export 0.679*** 0.708*** 0.729*** 0.730*** 0.731*** 0.631***
(0.091) (0.096) (0.099) '(0.099) (0.099) (0.102)Import 0.263*** 0.249*** 0.273** 0.272*** 0.274*** 0.270***
(0.085) (0.089) (0.090) (0.091) (0.090) (0.090) Disadvantage -0.126 -0.142 -0.188 -0.193* -0.190 -0.236**
(0.112) (0.111) (0.119) (0.116) (0.119) (0.116)Factory Abroad
Owner/Exec. 0.555*** 0.584*** 0.587*** 0.584***(0.094) (0.098) (0.097) (0.098)
Agri. Nega. Attitudes -0.718** -0.659** -0.651** -0.662** -0.644**(0.280) (0.273) (0.272) (0.273) (0.262)
Man. Nega. Attitudes -0.297** -0.235 -0.235 -0.235 -0.222 '(0.141) (0.143) (0.143) (0.143) '(0.136)
Fmarkt Nega. Attitudes -0.577*** -0.577*** -0.577*** -0.524**(0.204) (0.205) (0.205) (0.203)
Fmarkt Posi. Attitudes
% First Industry -0.005 -0.003 -0.003 0.003(0.014) (0.015) (0.014) (0.016)
% Manufac. GDP 1.037*(0.061)
Variance at level 1 0.192 0.178 0.173 0.173 0.173 0.181(Firms) (0.009) '(0.008) (0.008) (0.008) (0.008) (0.008)Variance at level 2 0.111 0.1 0.154 0.163 0.155 0.097(Industry) (0.090) (0.068) (0.094) (0.082) (0.098) (0.063)Variance at level 3 0.001 5.50E-13 0.006 5.99E-09 0.005 0.018(Prefectures) (0.020) (3.040e-07) (0.027) (0.0001) (0.028) (0.028) Note: Multi-level probit estimates. The data is hierarchical at three-levels: firms, industry and prefectures. * significant at 10%; ** at 5%; *** at 1%.
!
! 26!
Figure 1: The Divergence between Governors and Assemblies
support cautious oppose
YamaguchiTottoriTokushimaShimaneShigaSaitamaSagaOkayamaNagasakiMiyazakiMiyagiMieKumamotoKagoshimaKagawaIwateHyogoHokkaidoGunmaChibaAkitaYamanashiYamagataWakayamaToyamaTokyoTochigiShizuokaOsakaOkinawaOitaNiigataNaraNaganoKyotoKochiKanagawaIshikawaIbarakiHiroshimaGifuFukushimaFukuokaFukuiEhimeAomoriAichi
Governor's Stated Position (Oct, 2010 Survey)Assembly's Resolution before Feb. 2011
Source: Yomiuri Daily’s Governor Survey, October 29, 2010 and Prefectural assemblies’ resolutions reported in Asahi Shimbun.

!
! 27!
Figure 2: Governors’ Position-Switching between 2010 and 2011 Surveys
support
cautiousoppose
HyogoYamagata
TokushimaSagaNara
NaganoMiyazaki
KanagawaFukuoka
EhimeAomori
YamanashiYamaguchiWakayama
ToyamaTochigi
ShizuokaShimane
ShigaSaitamaOsaka
NagasakiMiyagi
MieKyoto
KumamotoKochi
KagoshimaKagawa
IshikawaHokkaido
GunmaGifu
FukushimaFukuiChibaAkita
TottoriOkinawa
OitaHiroshima
AichiTokyo
OkayamaNiigata
IwateIbaraki
2010 Governor Survey2011 Governor Survey
Source: Yomiuri Daily’s Governor Survey, October 29, 2010 and November 10, 2011.

!
! 28!
Figure 3: The Divergence between Governors’ Stated Positions and Negative Campaigns
support cautious oppose
YamaguchiTottori
TokushimaShimane
ShigaSaitama
SagaOkayamaNagasakiMiyazaki
MiyagiMie
KumamotoKagoshima
KagawaIwate
HyogoHokkaido
GunmaChibaAkita
YamanashiYamagata
WakayamaToyama
TokyoTochigi
ShizuokaOsaka
OkinawaOita
NiigataNara
NaganoKyotoKochi
KanagawaIshikawa
IbarakiHiroshima
GifuFukushima
FukuokaFukui
EhimeAomori
Aichi
2010 Govenor SurveyNegative Campaigns
Source: Yomiuri Daily’s Governor Survey, October 29, 2010 and Our dataset on Negative Campaigns.
!
! 29!
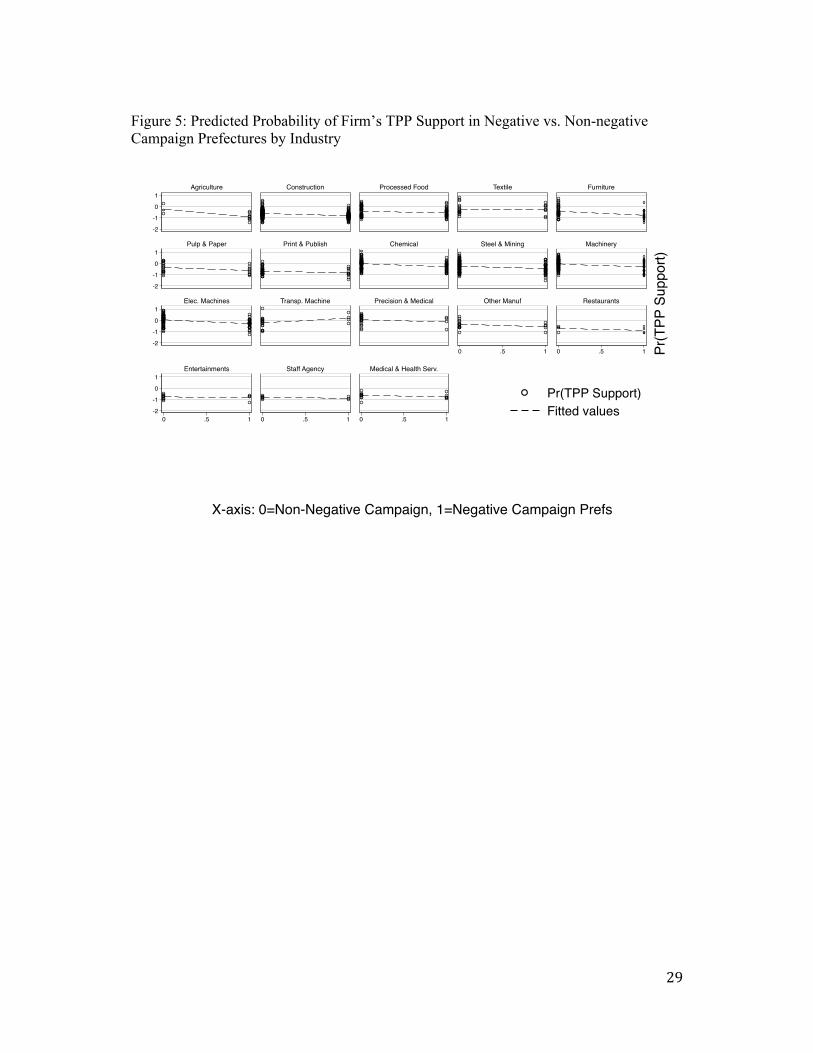
Figure 5: Predicted Probability of Firm’s TPP Support in Negative vs. Non-negative Campaign Prefectures by Industry
-2-101
-2-101
-2-101
-2-101
0 .5 1 0 .5 1
0 .5 1 0 .5 1 0 .5 1
Agriculture Construction Processed Food Textile Furniture
Pulp & Paper Print & Publish Chemical Steel & Mining Machinery
Elec. Machines Transp. Machine Precision & Medical Other Manuf Restaurants
Entertainments Staff Agency Medical & Health Serv.
Pr(TPP Support)Fitted values
Pr(T
PP S
uppo
rt)
X-axis: 0=Non-Negative Campaign, 1=Negative Campaign Prefs

!
! 30!
Appendix:Time-line of Our Survey 2010 October 27: Hokkaido prefecture published the estimated costs of TPP November 11: 1st Wave of Prefectural Governor Survey. 22 prefectures followed Hokkado’s lead and published the estimated costs only. The rest did not. 2011 February 4-15: Our Firm Executive Survey March 11: Earthquake & Tsunami & Fukushima Nuclear Plant Accident April 23: Prefectural Governor Elections for 13 prefectures. November 10: PM Noda declared Japan’s participation in TPP negotiation