Embed Size (px)
Citation preview

Frank J. ChaloupkaChair, WHO Collaborating Centre on the
Economics of Tobacco & Tobacco ControlDistinguished Professor, UIC
The Economics of Tobacco Control – What Have We Learned and What Do
We Need to Know
Research Conference on Tobacco Control in AfricaCape Town, South Africa, 16 July, 2014

2

3
21
The Economics of Tobacco Control

Overview
What have we learned about the economics of tobacco control
What do we still need to know about the economics of tobacco control• Draws on WHO’s NCD research priorities
How can we apply the lessons learned to other public health problems

Tobacco Taxes, Prices, and Tobacco Use

6
Taxes, Prices and Tobacco Use Increases in tobacco taxes that increase
tobacco product prices:• Induce current users to try to quit
Many will be successful in long term
• Keep former users from restarting
• Prevent potential users from starting Particularly effective in preventing transition from
experimentation to regular use
• Reduce consumption among those who continue to use
• Lead to other changes in tobacco use behavior, including substitution to cheaper products or brands, changes in buying behavior, and compensation

7
Taxes, Prices and Tobacco Use
2002 2003 2004 2005 2006 2007 2008 2009 20102,950.0
3,150.0
3,350.0
3,550.0
3,750.0
3,950.0
13.3
13.8
14.3
14.8
15.3
15.8
16.3
16.8
17.3
Cigarette Prices and Cigarette Consumption, Guatemala, Inflation Adjusted, 2002-2010
Consumption Price
Consum
pti
on (
million s
ticks)
Pri
ce (
infl
ati
on a
dju
ste
d,
2010)

8
Source: IARC Handbook 14, 2011
-1.4
-1.2
-1
-0.8
-0.6
-0.4
-0.2
0
1900 1910 1920 1930 1940 1950 1960 1970 1980 1990 2000
Midpoint of period over which study was performed
Shor
t-run
pric
e el
astic
ity o
f dem
and
-1.6
-1.4
-1.2
-1
-0.8
-0.6
-0.4
-0.2
0
1970 1975 1980 1985 1990 1995 2000 2005
Midpoint of period over which study performed
Shor
t-run
pric
e elas
ticity
of d
eman
d
High-Income, Non-US Low/Middle-Income
Elasticity EstimatesAggregate Demand Studies

9
2006 2007 2008 2009 2010 2011 2012 201311
12
13
14
15
16
3.4
3.9
4.4
4.9
5.4
Adult Smoking Prevalence and Cigarette PriceBrazil, Inflation Adjusted, 2006-2013
Adult
Sm
okin
g P
revale
ence
Pri
ce p
er
Pack,
2013 B
RL
Adult Prevalence & Price, Brazil
Sources: Ministry of Health, Brazil; EIU; World Bank

100
50,000
100,000
150,000
200,000
Monthly Quit Line Calls, United States11/04-11/09
4/1/09 Federal Tax Increase
1/1/08 WI Tax Increase

Source: BRFSS, Tax Burden on Tobacco, 2010, and author’s calculations
350 400 450 500 550 600 650 700 750 800 85045
50
55
60
65
70
f(x) = 0.0283499138817126 x + 43.0832236078183R² = 0.371042346639463
Cigarette Prices and CessationUS States & DC, 2009
Average price (in cents)
% E
ver
Sm
okers
Who H
ave Q
uit

12
Source: MTF, Tax Burden on Tobacco, 2011, and author’s calculations
1991 1992 1993 1994 1995 1996 1997 1998 1999 2000 2001 2002 2003 2004 2005 2006 2007$2.50
$3.25
$4.00
$4.75
$5.50
6
11
16
21
26
31
36
Cigarette Price and Youth Smoking Prevalence, United States, 1991-2010
Cigarette Price 12th grade prevalence 10th grade prevalence 8th grade prevalence
Year
Pric
e pe
r pa
ck (
8/11
dol
lars
)
Sm
okin
g P
reva
lenc
e

Taxes, Prices and Health:France, 1980-2010
Source: Jha, et al., in progress
1.0
1.5
2.0
2.5
3.0
3.5
4.0
4.5
5.0
5.5
6.0
1980 1985 1990 1995 2000 2005 2010
Year
Nu
mb
er/
ad
ult
/da
y a
nd
de
ath
ra
tes
50
100
150
200
250
300
Pri
ce
(%
re
lati
ve
to
19
80
)
Lung cancer death rates per 100,000 (divided by four): men age 35-44
Relative price
# cigarettes/adult/day


15
Source: Chaloupka, et al., in progress
Qatar
Luxe
mbo
urg
Switz
erla
nd
Japa
n
Denm
ark
Israe
l
Swed
en
Nethe
rland
s
Finla
ndIta
ly
Greec
e
Spai
n
Hunga
ry
Czech
Rep
ublic
Portu
gal
UKIra
n
Colom
bia
Brazil
China
Tuni
sia
Thai
land
Para
guay
Indo
nesia
Vietn
am Indi
a
Cote
d'Iv
oire
Papu
a New
Gui
nea
Kenya
0%
5%
10%
15%
20%
25%
Relative Income Price for Cigarettes, Selected Countries, 2011
Rela
tive I
ncom
e P
rice (
Perc
enta
ge o
f A
nnual per
capit
a G
DP
requir
ed
to b
uy 1
00 p
acks o
f cig
are
ttes)

16
Source: Chaloupka, et al., in progress
Saudi A
rabia
Denm
ark
Sw
eden
Luxem
bourg
UA
E
Finla
nd
Belg
ium
Gre
ece
Hungary
Canada
Isra
el
Neth
erl
ands
Sw
itze
rland
Italy US
Spain
Chin
a
Mexic
o
Tunis
ia
Chile
South
Afr
ica
Egypt
Para
guay
Indonesi
a
India
Cote
d'Ivoir
e
Papua N
ew
Guin
ea
Kenya
-90%
-70%
-50%
-30%
-10%
10%
30%
50%
70%
90%
110%
Percentage Change in the Relative Income Price of Cigarettes, Selected
Countries, 1996-2011
Perc
enta
ge C
hange in t
he R
ela
tive I
ncom
e P
rice,
1996-2
011
17
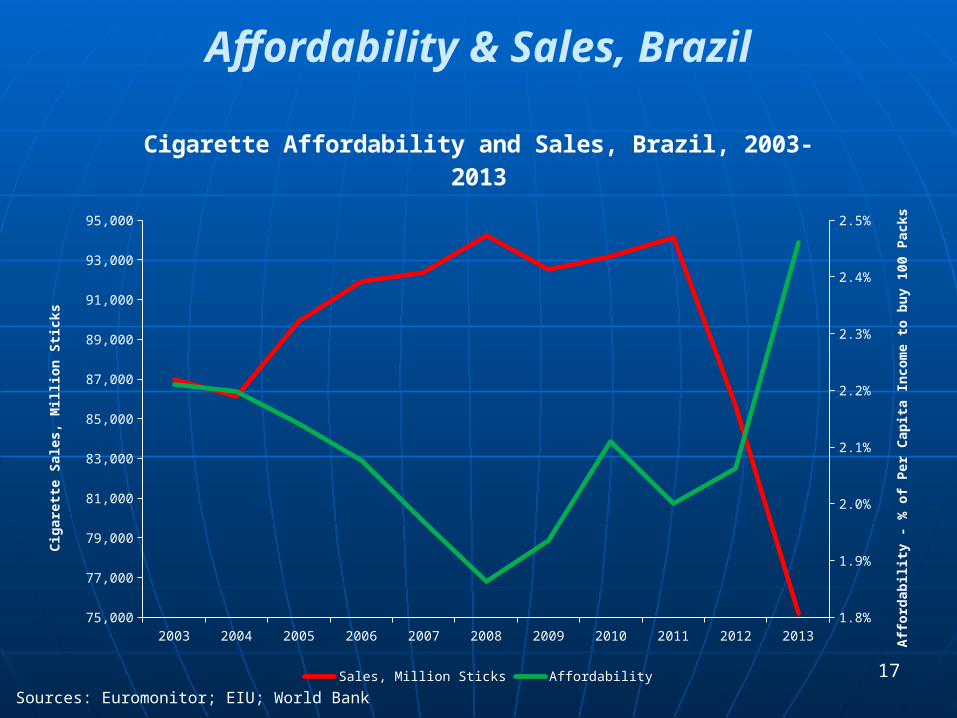
Affordability & Sales, Brazil
Sources: Euromonitor; EIU; World Bank
2003 2004 2005 2006 2007 2008 2009 2010 2011 2012 201375,000
77,000
79,000
81,000
83,000
85,000
87,000
89,000
91,000
93,000
95,000
1.8%
1.9%
2.0%
2.1%
2.2%
2.3%
2.4%
2.5%
Cigarette Affordability and Sales, Brazil, 2003-2013
Sales, Million Sticks Affordability
Cig
are
tte S
ale
s,
Million S
ticks
Aff
ord
abilit
y -
% o
f P
er
Capit
a I
ncom
e t
o b
uy 1
00 P
acks
18
Taxes, Prices and Tobacco Use What do we need to know?
• More country-specific evidence from LMICs Lack of overall price, income elasticity of demand
estimates for most low and middle-income countries Even less known about differential impact of price by
age, socioeconomic status, gender, and other factors Limited evidence from LMICs on impact of taxes and
prices on transitions in tobacco use• Non-linearities in effects of taxes/prices
Changes in elasticity over time, as taxes & prices increase, as incomes rise, etc.
Differential impact of incremental vs. large tax and price increases
Interactions between tax/price and tobacco control policies

19
Taxes, Prices and Tobacco Use
What do we need to know?
• More evidence on the demand for other tobacco products Own price and income elasticities Cross-price elasticities Changes in elasticities in response to new nicotine
products• More evidence on interactions between tobacco
use and other health-related behaviors Alcohol, illicit drug use Diet, activity and obesity

Disposable Electronic CigarettesSales Volume and Price: Total US 2010 -
2012
2010 Q1
2010 Q2
2010 Q3
2010 Q4
2011 Q1
2011 Q2
2011 Q3
2011 Q4
2012 Q1
2012 Q2
2012 Q3
2012 Q4
8
10
12
14
16
18
-
500,000
1,000,000
1,500,000
2,000,000
2,500,000
3,000,000
3,500,000
4,000,000
4,500,000
Real Sales Price Sales Volume
Sale
s P
rice (
in r
eal 2011 Q
4 d
ollars
)
Sale
s V
olu
me (
thou
san
ds o
f p
ieces)

Reusable Electronic Cigarettes Sale Volume and Price: Total US 2010 - 2012
2010 Q1
2010 Q2
2010 Q3
2010 Q4
2011 Q1
2011 Q2
2011 Q3
2011 Q4
2012 Q1
2012 Q2
2012 Q3
2012 Q4
10
15
20
25
30
35
40
-
100,000
200,000
300,000
400,000
500,000
600,000
Real Sales Price Sales Volume
Sale
s P
rice (
in r
eal 2011 Q
4 d
ollars
)
Sale
s V
olu
me (
thou
san
ds o
f p
ieces)

Importance of Tobacco Tax Structure

23
Types of Taxes Variety of tobacco taxes
• Taxes on value of production• Customs duties on tobacco leaf, tobacco products
imports and/or exports• Sales taxes/Value added taxes• Implicit taxes when government monopolizes
production and/or distribution• Excise taxes (or similar taxes)
Many of these are applied to variety of agricultural and/or consumer goods and services
Excise taxes are of most interest given specificity to tobacco products

24
Types of Taxes Excise Taxes
• Two types of excises Specific Taxes: excises based on quantity or weight
(e.g. tax per pack of 20 cigarettes) Ad Valorem taxes: excises based on value of
products (e.g. a specific percentage of manufacturer’s prices for tobacco products)
• Variety of tax systems/structures Uniform systems Mixed systems Tiered systems

Excise systems on cigarettes
Source: WHO 2013
Number of countries,
2012
186 Total covered
56 Specific excise only
50 Ad valorem excise only
60 Mixture of both excises
20 No Excise

Excise systems on cigarettes
Source: WHO 2013
# of countries Country Base of tiers
6 Bangladesh, Mozambique, Philippines, Belarus,
Indonesia, Pakistan Retail price
2 Burkina Faso, Senegal High, standard and low end
cigarettes
1 China Producer price
1 Indonesia Production volume
11 Armenia, Belarus, India, Nepal, Georgia,
Kazakhstan, Kyrgyzstan, Moldova, Papua New Guinea, Tajikistan, Ukraine
filter/non filter
Type
3 Indonesia, India, Philippines hand/machine made
2 Indonesia, Myanmar kretek/white
cigarette, cheerot/cigarette
2 Andorra, Algeria Tobacco content (dark/blonde or
dark/light)
3 Brazil, Mozambique, Uganda soft/hard Packaging
4 India, Nepal, Hong Kong, Sri Lanka Cigarette length
2 Andorra, Uzbekistan Trade (domestic/imported)
2 Belize, New Zealand Weight (tobacco content in
cigarette)
1 Fiji Leaf content (domestic/imported)

Average price and excise tax by tax structure, 2012
Source: WHO 2013
Average excise PPP Average price PPP Excise tax structure
1.57 3.73 Specific only
1.28 2.50 Ad valorem only
1.32 2.86 Mixed system
1.67 3.84 Relying more on specific
1.11 2.29 Relying more on ad
valorem
- 1.70 No excise

28
Cigarette Tax Structure & PricesSelected Countries, 2009-10
Source: Chaloupka, et al., 2014
Roman
ia
Pola
nd
Unite
d St
ates
Thai
land
Indi
a
Ukrai
ne
Mex
ico
Urugu
ay
Egyp
t
China
Bangl
ades
h
Russia
n Fe
dera
tion
Philip
pine
s
Vietn
am
0.00
0.10
0.20
0.30
0.40
0.50
0.60
Sta
ndard
Devia
tion,
Pri
ces o
f Top 5
Bra
nds

29
WHO’s Best Practices in Tobacco Taxation
Simpler is better
• Complex tax structures more difficult to administer
• Greater opportunities for tax evasion and tax avoidance under complex tax structures
• Where existing structure is more complex, simplify over time with goal of achieving single uniform tax

Simplifying the Excise Tax System: Egypt
2009: Tiered specific
Net of tax price per pack (P.T.)
GST/pack (P.T.)
Less than 65 108
More than 65 to 73 112
More than 73 to 84 125
More than 84 to 95 140
More than 95 to 106
153
More than 106 to 300
175
More than 300 to 425
315
More than 425 325
Mixed system 2010 cigarette excise
system: mixture of ad valorem (40% of retail price) and specific (EP 1.25/pack)
2011 cigarette excise system: mixture of ad valorem (50% of retail price) and specific (EP 1.35/pack)
Source: WHO and Ministry of Finance, Egypt.

Simplifying the Excise Tax System: Indonesia
Production tier Production capacity2009 2010 2011
Machine-made kreteks SKM HJE (Rp/stick) HJE (Rp/stick) HJE (Rp/stick)660- 290 310 325 660- 355 669- 375630-660 280 300 315 630-660 345 631-669 355600-630 260 280 295 600-630 325430- 210 230 245 430- 270 549- 285380-430 175 195 210 374-430 235 440-549 245374-380 135 155 170
Hand-made kreteks SKT590- 200 215 590- 255 749- 275550-590 150 165 520-590 195 550-749 205520-550 130 145379- 90 105 125 130349-379 80 95 115 120336-349 75 90 105 110
III > 6 million to 500 million 234- 40 65 75 250- 80White cigarettes SPM
550- 290 310 325 365 680- 380430-550 230 275 295 365375-430 185 225 245 365300- 170 200 215 235 444- 245254-300 135 165 175 190 345-444 195217-254 80 105 110 125
Specific excise / stick (Rp)2012 2013
II> 500 million to 2 billion
I > 2 billion
II > 500 million to 2 billion
I > 2 billion
II > 500 million to 2 billion
I > 2 billion
Source: WHO and Ministry of Finance, Indonesia.
32
WHO’s Best Practices in Tobacco Taxation
Rely more on specific tobacco excises as the share of total excises in prices increases• Greater public health impact of specific excises
given reduced opportunities for switching down in response to tax/price increases
• Sends clear message that all brands are equally harmful
• Produces more stable, higher revenues stream less susceptible to industry price manipulation

Increasing Emphasis on Specific Excise Tax: Mexico
2009:• Ad valorem tax of 150% of pre-tax price to retailer
November 2009:• Added specific tax of 0.80 pesos/pack in 2010• Increased specific tax by 0.40 pesos each year
through 2013 (2.00 pesos/pack)
2010 legislation, effective 2011:• Increased ad valorem tax to 160% of pre-tax price• Raised specific tax immediately to 7 pesos/pack
Source: Cherukapalli, 2013; Waters, et al., 2010

Mexico
Source: Tobacco-Free Kids, 2012

Adoption of Uniform Specific Excise Tax: Philippines
Source: WHO and Ministry of Finance, Philippines.
Net retail price per pack (excluding VAT and excise) 2007 2008 2009 2010 2011 2012
More than Ps. 10 26.1 26.1 27.2 27.2 28.3 28.3
Ps. 6.50 - Ps. 10 10.9 10.9 11.4 11.4 12 12
Ps. 5 - Ps. 6.50 6.7 6.7 7.1 7.1 7.6 7.6
Below Ps. 5 2.2 2.2 2.5 2.5 2.7 2.7
Net retail price per pack (excluding VAT and excise)
2013 2014 2015 2016 2017 2018
More than Ps. 11.5025 27 28 29
Ps. 11.50 and below12 17 21 25
30Annual
4% increase
Cigarette (machine packed) excise tax rate
SIN TAX REFORM ACT, 2012

36
WHO “Best Practices” for Tobacco Excise Taxes
Adopt comparable taxes and tax increases on all tobacco products
• Maximizes public health impact of tobacco tax increases by minimizing opportunities for substitution

37
WHO’s Best Practices in Tobacco Taxation
Set tobacco excise tax levels so that they account for at least 70 percent of the retail prices for tobacco products
• Update of World Bank ‘yardstick’ of any taxes accounting for 2/3 to 4/5 of retail prices
• Well above where most countries are currently
• Further increases in countries that do reach this target

Average Price of the Most Sold Brand & Excise Tax per pack, and Total Tax Share
By Income Group 2012
Source: WHO 2013
High income Upper middle Lower middle Low income China All
5.82
3.29
2.67
1.65
1.18
3.00 3.12
1.57
0.97 0.61
0.31
1.35
65.90%
63.34%
48.72% 50.31%
40.76%
58.40%
Retail price, PPP Excise tax PPP Total tax share (%)
PP
P

39
Tobacco Tax Structure
What do we need to know?
• More evidence on the impact of tobacco tax structure on prices, tobacco use Relative prices within/across product categories Substitution between brands/products
• Evidence on industry responses to alternative tax structures and changes in tax structures Pricing strategies Product characteristics, product mix
• Optimal tax structure for harm minimization Differential taxes based on relative risk?

Globalization of the Tobacco Industry

41
Globalization of Tobacco Industry
• Opening of markets through bilateral, regional, and global trade agreements
• Loosening of restrictions on foreign direct investment
• Privatization of government run tobacco companies
A few significant exceptions
• Consolidation among multinational tobacco companies

42
Trade in Tobacco Products
Impact of freer trade on tobacco use
• Growing evidence that reduction in barriers to trade increase tobacco use
• Impact greater on lower income countries
• Results from increased competition, lower prices, and increased use of sophisticated marketing strategies by multinational tobacco companies
Source: Chaloupka & Laixuthai, 1996; Taylor, Chaloupka, Guindon & Corbett, 2000; Perucic, et al., in progress

43
Direct Investment & Privatization Opening of markets has also resulted in increased
openness to direct investment
• Investment in new production facilities/capacity owned and operated by multinational tobacco companies
By far the most widespread Facilitated by Bilateral Investment Treaties
• Privatization of government owned tobacco companies for example, Turkish TEKEL acquired by BAT in 2008 after being
on the market for many years) Partial privatization of Egypt Tobacco Company (government
still retains controlling interest)
• Joint ventures between local monopoly and multinational tobacco companies
For example, PMI and China National Tobacco company

44
Direct Investment & Privatization Can be good or bad for public health – depends
on how it’s done; “best practices” for public health
• Agreements with multinational tobacco companies can inhibit government’s ability to adopt strong tobacco control policies
E.g. experiences in former Soviet republics where agreements with MTCs prevented significant tax increases and strong tobacco control measures
• Can eliminate conflict of interest between government tobacco production/distribution and tobacco control
E.g. Turkey where sale of TEKEL followed by aggressive implementation of FCTC, including significant regular tax increases, comprehensive smoke-free policy, comprehensive TAPS ban, and more
Source, Yurekli, Shin &Chaloupka, in press

45
Mergers & Acquisitions Considerable consolidation among tobacco
companies
• Acquisition of local cigarette companies by MTCs Acquisition of popular local brands For example, BAT acquisition of Protabaco - 2nd largest
Colombian company - in 2011
• Mergers between local tobacco companies and MTCs For example, Philip Morris International and Fortune Tobacco
Company merge in 2010, creating Philip Morris Fortune Tobacco Company that nearly monopolizes Philippine cigarette market
• Acquisition of one MTC by another MTC For example, Imperial Tobacco Group’s acquisition of Altadis in
2008

46
Mergers & Acquisitions Has led to consolidation/centralization of production
in regional production hubs
• Capitalize on significant economies of scale in production of tobacco products
• Take advantage of regional trade agreements that greatly reduce or eliminate barriers to trade in tobacco products
• Generally located in: Large consuming country within region Country where labor, tobacco leaf, other costs are low
• Case study - Central America BAT Caribbean and Central America hub in Honduras supplies
others in region Philip Morris International subsidiary Tabacalera
Centroamericana in Guatemala does the same Together, 2 companies control nearly all of the market

Cigarette Company Market Shares
Source: Maxwell Tobacco Fact Book, various years; Euromonitor, 2013; note: PMI includes Philip Morris International and Altria Group Inc.
1985-2011, Selected Years
1985 1990 1995 2000 2006 20110%
10%
20%
30%
40%
50%
60%
70%
80%
90%
100%
CNTC PMI BAT JTI ITG Others

48
Mergers & Acquisitions
Increasingly, consolidation across products
• Altria, US’ largest cigarette company, acquisition of US Smokeless Tobacco Company in 2008, largest smokeless company in the US
• Lorillard Inc. acquisition of Blu, a leading e-cigarette company
• JTI’s acquisition of Gryson, a leading RYO/MYO manufacturer in Western Europe
• PMI’s purchase of Jed Rose’s patent for a nicotine inhaler

49
Mergers & Acquisitions Combined with development and marketing
of new products
• Altria, RJR and others develop and market variety of dissolvable products, extending brands across products
• 2011 - BAT creates Nicoventures to develop reduced risk tobacco products, other nicotine delivery products
• 2012 - Altria markets Verve – a non-tobacco, nicotine lozenge
• 2012 – Swisher launches e-cigarettes, e-cigars

50
Marlboro

51
Camel

52

53
Globalization and Tobacco Control
Increasing challenges to national tobacco control policies under trade and investment agreements• Investor-state disputes being brought under Bilateral
Investment Treaties E.g Philip Morris Asia v. Australia under bilateral investment
treaty between Hong Kong & Australia; PMI v. Uruguay under bilateral investment treaty between Switzerland & Uruguay
• State-state disputes being brought in World Trade Organization
E.g. Indonesia v. United States; multiple countries v. Australia
• Challenges in national courts E.g. Australia, United States

54
Trade Disputes US-Thailand and GATT/WTO
• After relatively easy success in Japan, Taiwan, and South Korea, US tried to open Thai cigarette markets
• Thai government fought back
• Key issues: Near total ban on cigarette imports Differential taxes on foreign and domestically produced
cigarettes Comprehensive ban on advertising and promotion
• Dispute brought before GATT in 1990 Ban, differential taxes are violations of agreement Ad/promo ban is allowable Decision depends on whether or not measures are applied
equally to domestic and foreign products
Source: Chaloupka & Laixuthai, 1996

55
Trade Disputes US-Thailand and GATT/WTO
• Article XX of GATT allows for protection of public health over interests in trade:
• “Subject to the requirement that such measures are not applied in a manner which would constitute a means of arbitrary and unjustifiable discrimination between countries where the same conditions prevail, or a disguised restriction on international trade, nothing in this Agreement shall be construed to prevent the adoption or enforcement by any contracting party of measures…necessary to protect human ….health (or) necessary to secure compliance with the laws or regulations which are not inconsistent with the provisions of this Agreement”
Source: Chaloupka & Laixuthai, 1996

56
Trade Disputes Trade dispute between Indonesia and US over
clove cigarettes
• US FDA banned flavored cigarettes (except menthol) under the US Family Smoking Prevention and Control Act
• Indonesia leading exporter of clove cigarettes (kreteks) brought challenge saying ban is discriminatory and unnecessary
• Sept. 2011 – WTO rules that the ban is discriminatory, but not unnecessary given evidence that availability of flavored cigarettes contributes to youth smoking uptake
Calls on US to bring policy into compliance with trade agreements
US appealed, lost; unclear how it will comply

57
Trade Disputes Norway’s ban on retail tobacco product displays
• Challenged by Philip Morris Norway arguing that display ban violated Article 11 of European Economic Area by ‘hindering the free movement of goods’
• European Free Trade Agreement court ruled that the ban effectively restricted imports, but left it to Norway’s court to determine whether or not the public health objective was likely to be met and could not be achieved by less trade restrictive measure
• September 14, 2012, Oslo district court upheld ban:“there exist no other measures that will have an effect
equivalent to that of the Display Ban.” “Absence of visible tobacco products in shops will be vital
both in terms of the absence of advertising effect, and as a part of de-normalisation.”

59
Trade and Investment Disputes Australia’s Plain Packaging Policy
Announced April 29, 2010 Legislation introduced April 7, 2011 Passed House August 24, 2011, Senate November 2,
2011 Phased in by December 1, 2012 Prohibits use of trade marks, symbols, graphics or
images on pack Allows brand, business/company name, variant
name in standard font/position
Coupled with other provisions Graphic warnings expanded (75% front, 90% back) Pack/cigarette specifications Similar details for other tobacco products
60
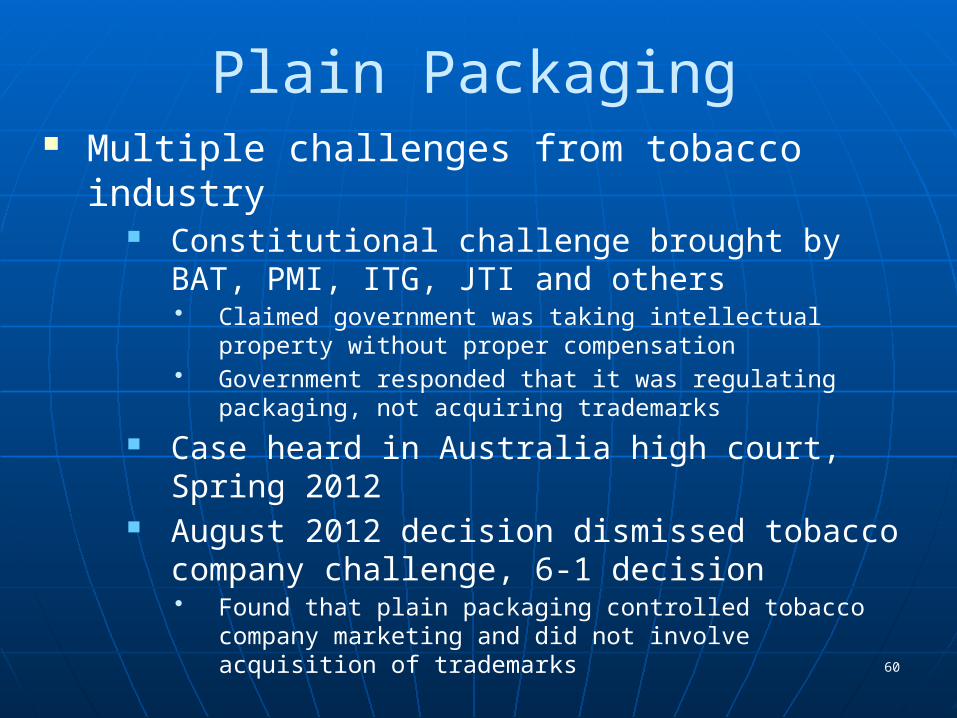
Plain Packaging Multiple challenges from tobacco industry
Constitutional challenge brought by BAT, PMI, ITG, JTI and others• Claimed government was taking intellectual property
without proper compensation• Government responded that it was regulating
packaging, not acquiring trademarks
Case heard in Australia high court, Spring 2012
August 2012 decision dismissed tobacco company challenge, 6-1 decision• Found that plain packaging controlled tobacco company
marketing and did not involve acquisition of trademarks

61
Plain Packaging Multiple challenges from tobacco industry
Pending WTO challenges brought by Ukraine, Indonesia, Dominican Republic, Honduras and Cuba• Trade-Related aspects of Intellectual Property
Rights (TRIPS) Agreement• Technical Barriers to Trade (TBT) Agreement• Harm to domestic industry due to
commoditization of product, falling prices, and increased illicit trade
1993 Hong Kong – Australia Bilateral Investment Treaty challenge• PM-Asia acquisition of PM-Australia in Feb. 2011

62
Investment Disputes PMI 2012 challenge to Uruguay tobacco control
law under bilateral investment treaty between Uruguay and Switzerland
• Three regulations originally at issue: Health warnings covering 80% of cigarette pack “Repulsive and shocking” images used in graphic
warnings (subsequently dropped) “Single presentation” - permission to sell only one
variation per brand (current focus)• PMI argues that these “deprive the company of its
ability to use its legally-protected trademarks and brands”
• Uruguay argues that these are necessary to protect public health
63
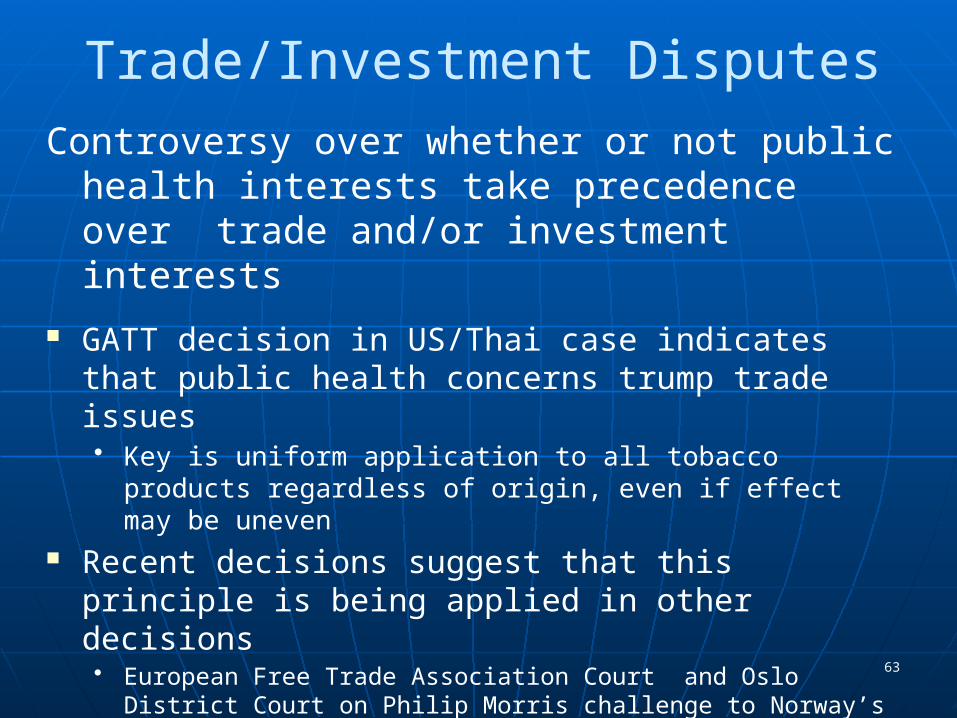
Trade/Investment Disputes
Controversy over whether or not public health interests take precedence over trade and/or investment interests
GATT decision in US/Thai case indicates that public health concerns trump trade issues• Key is uniform application to all tobacco products
regardless of origin, even if effect may be uneven Recent decisions suggest that this principle is
being applied in other decisions• European Free Trade Association Court and Oslo District Court
on Philip Morris challenge to Norway’s tobacco products display ban
• WTO panel decision in Indonesia case• Australia High Court decision on industry challenges to plain
packaging legislation

64
Globalization
What do we need to know?
• Impact of globalization on tobacco use and its consequences Pricing and marketing strategies Product innovation/diffusion
• Research to counter industry challenges to national tobacco control policies under bilateral, regional, and global agreements
• Research on the effects of globalization on tobacco control policies Political economy of tobacco control policies Consequences of delayed, weakened policies

Oppositional Arguments

66
Tobacco Taxes & Tax Revenues
Myth: increases in tobacco taxes will lead to lower tobacco tax revenues given reductions in tobacco use

67
Tobacco Taxes & Tax Revenues
Fact: tobacco tax increases lead to increased tax revenues
• Tobacco taxes account for a fraction of tobacco prices
Increase in tax leads to smaller increase in price
• Reductions in tobacco use less than proportionate to price increase

1970
1972
1974
1976
1978
1980
1982
1984
1986
1988
1990
1992
1994
1996
1998
2000
2002
2004
2006
2008
2010
2012
0
5
10
15
20
25
0
1000
2000
3000
4000
5000
6000
7000
8000
9000
Industry Price Excise Tax VAT Excise Tax Revenues
Rand p
er
Pack
Tax R
evenues,
Million R
and
South AfricaTaxes, Prices, and Tax Revenues, 1970-2012
Inflation Adjusted

69
Tobacco Taxes & the Poor
Myth: tobacco tax increases harm the poor

70
Tobacco Taxes & the Poor
Fact: tobacco use harms the poor

Cycle of tobacco and
poverty
Poor men
smoke
Forgone income 1: More money spent Less money spent on tobacco: on education, nutrition, etc High opportunity cost
Breadwinner gets
sick due to tobacco use
Forgone income 2:
Treatment cost &Lost working days &
income
Forgone income 3:
Breadwinner dies prematurely
Family falls into poverty
Tobacco and Poverty
Source: Yurekli, 2007

72
Poverty and Tobacco Use
Burdens of poverty are compounded by tobacco use• Responsible for impoverishment of over 50
million in China and over 15 million in India
• Crowding out of other spending:• Bangladesh: tobacco money spent
equivalent to:• Males = 1402 calories of rice per day• Females = 770 calories of rice per day
Sources: Hu, et al., 2008; John, et al., 2011; Efroymson, et al., 2001

73
Tobacco Taxes & the Poor
Fact: tobacco tax increases can be progressive• Tobacco use among low-income
populations more responsive to price
Pay smaller share of tax increase Receive greater share of health
benefits from higher tax

Who Pays& Who BenefitsTurkey, 25% Tax Increase
Source: Adapted from Önder & Yürekli, 2014
-36%
-31%
-26%
-21%
-16%
-11%
-6%
-1%
4%
9%
-35.3%
-20.4%-18.5%
-2.2%
8.5%9.7%
Change in Consumption Change in Taxes Paid

Source: Chaloupka et al., in progress; assumes higher income smokers smoke more expensive brands
Who Pays& Who Benefits Impact of Federal Tax Increase, U.S., 2009
<poverty line 1-2* poverty line >2* poverty line0.0%
10.0%
20.0%
30.0%
40.0%
50.0%
60.0%
70.0%
11.9%
20.7%
67.4%
46.3%
29.5%
24.2%
Share of Tax Increase Share of Reduced Deaths

Impact on the Poor• Also need to consider overall fiscal system
Key issue is what’s done with the revenues generated by the tax
Greater public support for tobacco tax increases when revenues are used for tobacco control and/or other health programs
Net financial impact on low income households can be positive when taxes are used to support programs targeting the poor
Concerns about regressivity offset by use of revenues for programs directed to poor

77
Tobacco Control & Employment
Myth: tobacco control will result in significant job losses as tobacco use falls

78
Tobacco Taxes & Employment
Fact: tobacco control results in net increase in jobs in most countries
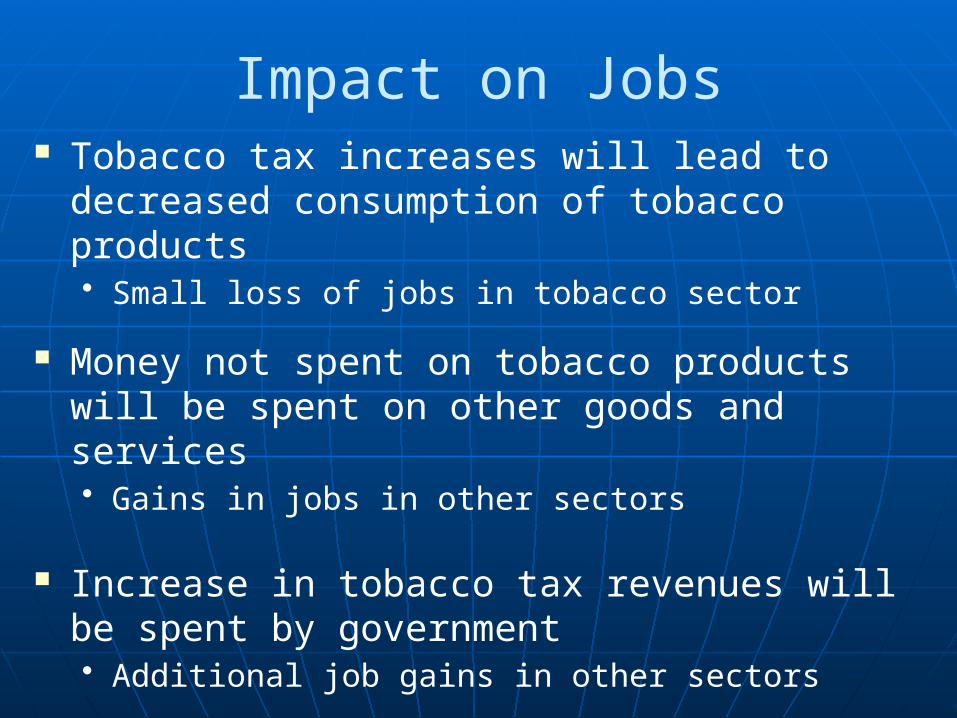
Impact on Jobs Tobacco tax increases will lead to decreased
consumption of tobacco products• Small loss of jobs in tobacco sector
Money not spent on tobacco products will be spent on other goods and services• Gains in jobs in other sectors
Increase in tobacco tax revenues will be spent by government• Additional job gains in other sectors
Net increase in jobs in most countries

80
Tobacco Control & Illicit Trade
Myth: tobacco tax increases and other tobacco control policies will lead to increases in illicit trade, eliminating the public health and revenue benefits of higher taxes

81
Tobacco Taxes & Illicit Trade
Fact: tobacco use falls and tax revenues increase following tax increases even in the presence of illicit tobacco trade
Fact: no evidence that other tobacco control policies lead to increase in illicit trade

82
Tax Avoidance & Evasion Do NOT Eliminate Health Impact of Higher Taxes
Source: Schroth, 2014

83
Cook County Cigarette Tax and Tax Revenues - FY01-FY06
$0.15
$0.35
$0.55
$0.75
$0.95
$1.15
$1.35
$1.55
$1.75
2001 2002 2003 2004 2005 2006
Fiscal Year
Tax
per P
ack
$25,000,000
$45,000,000
$65,000,000
$85,000,000
$105,000,000
$125,000,000
$145,000,000
$165,000,000
$185,000,000
$205,000,000
$225,000,000
Tax
Reve
nues
Tax Revenues
Chicago tax risesfrom 16 to 48 cents
Chicago tax upto 68 cents, 1/1/06Chicago smoking ban, 1/16/06
Tax Avoidance & Evasion Do NOT Eliminate Revenue Impact of Higher Taxes

84
Tobacco Taxes & Illicit Trade
Fact: other factors more important than tobacco taxes and tobacco control policies in explaining illicit trade

85
Determinants of Tax Avoidance & Evasion
• Tax and price differentials More important for individual tax
avoidance and bootlegging Larger scale efforts avoid all taxes

Illicit Cigarette Market Share& Cigarette Prices, 2012
0 2 4 6 8 10 12 140.00%
5.00%
10.00%
15.00%
20.00%
25.00%
30.00%
35.00%
40.00%
45.00%
50.00%
Algeria
ArgentinaAustralia
Austria
Azerbaijan
Belarus
Begium
Bolivia
Bosnia
Brazil
Bulgaria
CameroonCanada
Chile
China
Colombia
Costa RicaCroatia
Denmark
Dominican Republic
Ecuador
Egypt
Estonia
Finland
France
Georgia
Germany
GreeceGuatemala
Hungary
India
Indonesia
IranIreland
IsraelItaly
JapanKazakhstan
Kenya
Latvia
Lithuania
Malaysia
Mexico
MoroccoNetherlands
New Zealand
Nigeria
Norway
Pakistan
Peru
Philippines
Poland
Portugal
South Korea
Turkey
Russia
Saudi Arabia
Serbia
Singapore
Slovakia
Slovenia
South Africa
Spain
Sweden
Switzerland
ThailandMacedonia
Tunisia
Romania
Ukraine
UAE
United Kingdom
USA
Uruguay
Uzbekistan
Venezuela
Vietnam
f(x) = − 0.0075588620251965 x + 0.175221285967319R² = 0.0495903303891168
Price USD
Illici
t tra
de sh
are
as %
of l
egal
ciga
rette
cons
umpti
on
Sources: Euromonitor, WHO

87
• Corruption
• Weak tax administration Absence of tax stamps; weak or non-existent
physical controls; unlicensed manufacturers, distributors, retailers; weak customs authorities
• Poor enforcement Limited resources for border patrols, customs
authorities, etc; low penalties
Determinants of Avoidance & Evasion

88
Smuggling and Corruption, 2011
1 2 3 4 5 6 7 8 9 100
0.05
0.1
0.15
0.2
0.25
0.3
0.35
0.4
0.45
0.5
Algeria
Argentina
Australia
Austria
Azerbaijan
Belarus
Belgium
Bolivia
Bosnia
BrazilBulgaria
0.16
Canada
Chile
China
Colombia
Costa Rica
Croatia
Denmark
Dominican Republic
Ecuador
Egypt
Estonia
Finland
France
GeorgiaGermanyGreece
Guatemala
HungaryIndia
Indonesia
Iran
Ireland
IsraelItaly
JapanKazkhstan
Kenya
Latvia
LithuaniaMalaysia
Mexico
Morocco Netherlands
New Zealand
Nigeria
Norway
Pakistan
Peru
Philippines
Poland
Portugal
South Korea
Romania
Russia
Saudi Arabia
SerbiaSingapore
Slovakia
Slovenia
South Africa
Spain
Sweden
Switzerland
Thailand
MacedoniaTunisia
Turkey
Ukraine
United Arab Emirates
United Kingdom
United States
Uruguay
Uzbekistan
Venezuela
Vietnamf(x) = − 0.0130735750576566 x + 0.202775985117035R² = 0.081456105531796
Transparency Index
illici
t cig
arett
e tr
ade
volu
me
Sources: Euromonitor, Transparency International

89
• Presence of informal distribution channels
e.g. Street vendors, unlicensed distributors
• Presence of criminal networks e.g. Organized crime, terrorist organizations
• Access to cheaper sources e.g. reservations, duty free, cross border
Determinants of Avoidance & Evasion

90
Tobacco Taxes & Illicit Trade
Fact: there exist effective interventions to reduce illicit trade in tobacco products

Cigarette tax and illegal cigarette market, Spain 1991-2008
Spain: Size of contraband cigarette market & total tax level on cigarette price
59.0%
71.7%
71.2% 71.4%
77.6%17.7%
13.6%
2.7%
1.1% 1.0%
21.2%
-3.0%
2.0%
7.0%
12.0%
17.0%
22.0%
% o
f co
ntr
ab
an
d c
igare
ttes i
n d
uty
paid
sale
s
45%
50%
55%
60%
65%
70%
75%
80%
To
tal
tax a
s %
of
Mo
st
Po
pu
lar
Bra
nd
Pri
ce
total tax incidence
% of contraband

92
Combating Tax Avoidance & Evasion
Illicit trade protocol to the WHO FCTC• Adopted November 2012; currently in process
of being signed/ratified; provisions calling for:• Strong tax administration
Prominent, high-tech tax stamps and other pack markings
Licensing of manufacturers, exporters, distributors, retailers
Export bonds Unique identification codes on packages
• Better enforcement Increased resources Focus on large scale smuggling
• Swift, severe penalties• Multilateral/intersectoral cooperation
93
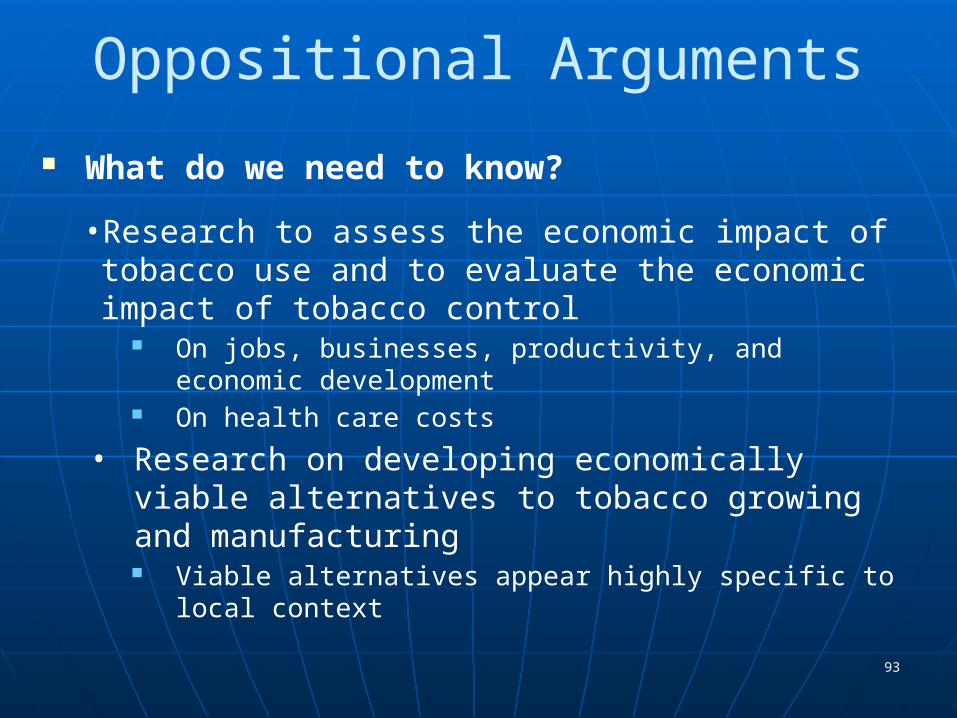
Oppositional Arguments
What do we need to know?
• Research to assess the economic impact of tobacco use and to evaluate the economic impact of tobacco control
On jobs, businesses, productivity, and economic development
On health care costs
• Research on developing economically viable alternatives to tobacco growing and manufacturing Viable alternatives appear highly specific to local
context

94
Oppositional Arguments
What do we need to know?
• Research on the interrelationships between tobacco use and poverty
• the role of tobacco use in causing poverty and compromising other spending
• the differential effect of tobacco control policies & programmes on the poor
• Research on tobacco tax avoidance/evasion Measurement, determinants, and consequences Effectiveness of alternative approaches to
strengthening tax administration

95
Oppositional Arguments
What do we need to know?
• Research on the cost-effectiveness of tobacco control policies, programs and other interventions To identify the ‘optimal policy mix’ called for in
1998 conference

96
Key Tobacco Control PoliciesCost-Effectiveness
Source: WHO, unpublished data
Incr
ease
d ta
xatio
n
Compr
ehen
sive
adve
rtisin
g ba
n
Clean
indo
or a
ir laws
Info
rmat
ion
and
labe
lling
Nicotin
e Rep
lace
men
t the
rapy
$0
$1,000
$2,000
$3,000
$4,000
$5,000
$6,000
High Income Upper Middle Income Lower Middle Income Low Income
Cost
per
DA
LY
Avert
ed

Applying Lessons from the Economics of Tobacco Control
to Other Health-Related Behaviors

98
"Sugar, rum, and tobacco, are commodities which are no where
necessaries of life, which are become objects of almost universal
consumption, and which are therefore extremely proper subjects of
taxation.
Adam Smith, An Inquiry into the Nature and Causes of The Wealth of Nations, 1776
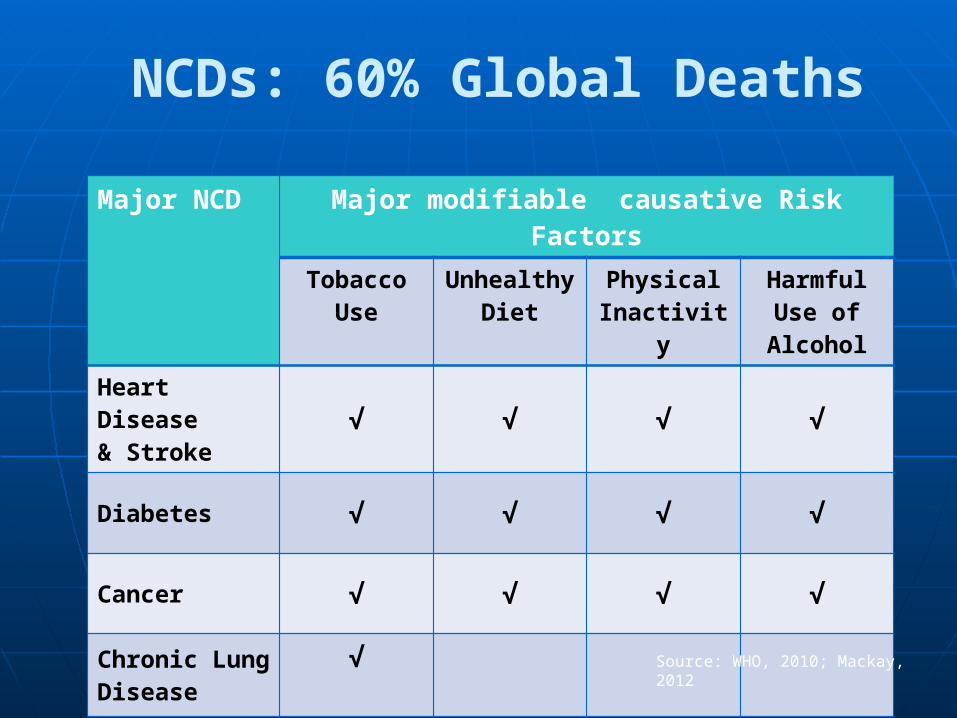
NCDs: 60% Global Deaths
Major NCD Major modifiable causative Risk FactorsTobacco Use Unhealthy
DietPhysical
InactivityHarmful Use
of Alcohol
Heart Disease& Stroke √ √ √ √
Diabetes √ √ √ √
Cancer √ √ √ √
Chronic Lung Disease
√
Source: WHO, 2010; Mackay, 2012

Extensive econometric and other research shows that higher prices for alcoholic beverages significantly reduce drinking:
• 10 percent price increase would reduce:
• Beer consumption by 1.7 to 4.6 percent
• Wine consumption by 3.0 to 6.9 percent
• Spirits consumption by 2.9 to 8.0 percent
• Overall consumption by 4.4 percent
• Heavy drinking by 2.8 percent
• Generally larger effects on youth and young adults
Alcohol Prices and Drinking
Source: Wagenaar et al., 2009; Xu & Chaloupka, 2013

Beer Tax and Binge Drinking Prevalence US States, 2010
Source: Xuan et al., 2013

Extensive econometric and other research shows that higher prices for alcoholic beverages significantly reduce:
• Drinking and driving, traffic crashes, and motor-vehicle accident fatalities
• Deaths from liver cirrhosis, acute alcohol poisoning, alcohol-related cancers, cardiovascular diseases, and other health consequences of excessive drinking
• Violence, including spouse abuse, child abuse, and suicides
• Other consequences of drinking, including work-place accidents, teenage pregnancy, and incidence of sexually transmitted diseases
Alcohol Prices and Consequences
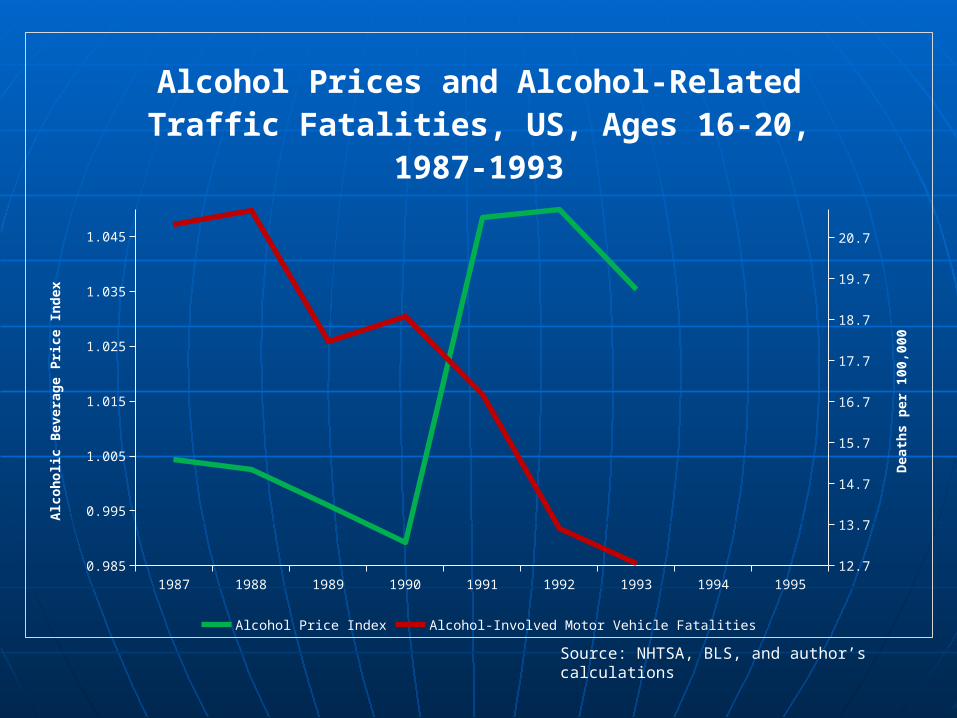
Source: NHTSA, BLS, and author’s calculations
1987 1988 1989 1990 1991 1992 1993 1994 19950.985
0.995
1.005
1.015
1.025
1.035
1.045
12.7
13.7
14.7
15.7
16.7
17.7
18.7
19.7
20.7
Alcohol Prices and Alcohol-Related Traffic Fatalities, US, Ages 16-20, 1987-
1993
Alcohol Price Index Alcohol-Involved Motor Vehicle Fatalities
Alc
oholic B
evera
ge P
rice I
ndex
Death
s p
er
100,0
00

State Cigarette & Beer Tax Increases, 2000-2013
Sources: Campaign for Tobacco Free Kids; NIAAA Alcohol Policy Information System; Brewers Almanac;
2000 2001 2002 2003 2004 2005 2006 2007 2008 2009 2010 2011 2012 20130
5
10
15
20
Cigarettes Alcohol

105
AZ
WY
OR
ID
MT
UTNV
WA
CA
TX
AROK
ND
LA
KS
IANE
SD
CO
NM
MO
MN
TN
AL
KY
OH
MS
MI
IN
GA
FL
PA
ME
NY
WV VA
NC
SC
VT
D.C.
NJ
MD
DE
NHMA
IL
WI
AK
2000s
CT
RI
Decade of Last Permanent Beer Tax Increase
HI
1990s
1980s 1970s
1960s
1950s
1940s or earlier

Average Beer & Cigarette TaxesUnited States, Inflation Adjusted 1973-2012
1973
1975
1977
1979
1981
1983
1985
1987
1989
1991
1993
1995
1997
1999
2001
2003
2005
2007
2009
2011
$0.00
$0.50
$1.00
$1.50
$2.00
Beer Tax Cigarette Tax
Tax P
er
Pack o
f 20 C
igare
ttes &
6 P
ack o
f B
eer,
2012
dollars
Sources: Campaign for Tobacco Free Kids; NIAAA Alcohol Policy Information System; Brewers Almanac; Bureau of Labor Statistics; and authors calculations. Note: 2012 beer tax is through June 2012

Source: Tax Burden on Tobacco, 2011, and author’s calculations
0.850000000000001
1.35
1.85
2.35
2.85
3.35
Alcoholic Beverage & Tobacco Product Prices, Relative to CPI,
1953-2010
Alcoholic Beverages Tobacco Products

Public Health Rationale for SSB Taxes
• Link to obesity• Several meta-analyses conclude that increased
SSB consumption causes increased weight, obesity
• Increased calories from SSBs not offset by reductions in calories from other sources
• Other health consequences• type 2 diabetes, lower bone density, dental
problems, headaches, anxiety and sleep disorders

Soda Consumption & ObesityCalifornia Counties, 2005
Source: Babey, et al., 2009 and authors' calculations.
10 15 20 25 30 35 4040
45
50
55
60
65
70
f(x) = 16.4401260028826 ln(x) + 6.11419822765063R² = 0.665636557713179
% Adults Drinking One or More Sodas per Day
% of Adults
Who Are Overweight or Obese

Evidence on SSB Taxes/Prices & Obesity
• Growing literature demonstrating the higher prices for SSBs lead to reductions in SSB consumption
• Powell et al. (2013) review finds greater impact of SSB only prices; elasticity of -1.2
• Limited, mixed evidence on impact of taxes/prices on weight outcomes
• Small, less than comprehensive sales taxes• Substitution to untaxed products, larger volumes• Some effects among most at-risk populations

Carbonated Beverage Prices & Youth Obesity1995-2009, Inflation Adjusted
Source: BLS; YRBS
1999 2000 2001 2002 2003 2004 2005 2006 2007 2008 2009143
145
147
149
151
153
155
10
10.5
11
11.5
12
12.5
13
Carb. Bev. Obese

States with Sales Taxes on Regular Soda (as of January 1, 2014)

States with Sales Taxes on Bottled Water (Jan. 1, 2014)
Source: Bridging the Gap Research Program, University of Illinois at Chicago, 2014

Importance of Tax Structure From a public health and revenue perspective, specific
excise tax (tax based on quantity/volume) preferable to sales tax or ad valorem excise tax (taxes based on price) for several reasons:
• Included in shelf price, so more apparent to consumer
• Easier administratively
• Reduce incentives for switching to cheaper brands, larger quantities
• Revenues more stable, less subject to industry price manipulation
• Disadvantage of specific tax: need for inflation adjustment

115
Counterarguments
Same as have been raised against tobacco taxes• Employment impact
Recently published research assessing impact of reduced SSB consumption on employment
Forthcoming research assessing impact of reduced alcohol consumption on employment
• Impact on the poor• Tax avoidance/evasion

Summary

117
Counterarguments Much has been learned about the economics of
tobacco and tobacco control over the past decade• Particularly rapid growth in research from LMICs• Key factor in significant tax increases, stronger
tobacco control policies, and implementation of programs and other interventions to reduce tobacco use and its consequences
However, much remains to be learned• Particularly in some regions, including Africa
Many lessons learned can be applied to other health behaviors that contribute to NCDs

For more information:
Bridging the Gaphttp://www.bridgingthegapresearch.org
Tobacconomicshttp://www.tobacconomics.org
@BTGResearch
@tobacconomics