Embed Size (px)
Citation preview
RESEARCH
FRANKFURT OFFICEBI-ANNUAL 2017
KEY FACTSFlächenumsatz: 230.900 m²
Mietverträge < 1.000 m²: 215
Mietverträge > 1.000 m²: 40
Mietverträge > 5.000 m²: 10
Take up: 230,900 sq m
Transactions < 1,000 sq m: 215
Transactions > 1,000 sq m: 40
Transactions > 5,000 sq m: 10
2
Mieten/Leerstand/AngebotDie Spitzenmiete liegt zum Halbjahr 2017 bei € 38,50/m². Dieser Trend wird sich auf-grund knapper Produktverfügbarkeit bei gleichzeitig hoher Nachfrage durch z.B. in-ternationale Banken in einzelnen Teilgebieten des Frankfurter Büromarktes – insbesondere in der Innenstadt und im Bankenviertel – weiter fortsetzen. Die Durchschnittsmiete ist um € 0,10/m² im Vergleich zum Vorjahr auf € 18,90/m² gestiegen.
Die gute Vermietungsleistung und Abgän-ge in Form von Umnutzungen oder Revi-talisierungen veralteter Bürogebäude (ca. 150.000 m² im 1. Halbjahr 2017) lassen den Leerstand auf nunmehr ca. 1.009.880 m², bei einem gleichzeitig gesunkenen Gesamt-flächenbestand von ca. 12.036.298 m² schmelzen. Die aktuell nach wie vor nied-rigen Fertigstellungsraten beeinflussen den Leerstand ebenfalls positiv.
Rents/Vacancy/SupplyBy the end of the first six months of the year, the prime monthly rent had reached € 38.50/sq m. Due to the lack of available product and the high level of demand, es-pecially from the international banks which are focused on specific areas within the city’s office market (principally, the city cen-tre and Banking District), this trend is set to continue. The average monthly rent has also increased by € 0.10/sq m over the past 12 months, now reaching € 18.90/sq m.
Vacancy has fallen to 1,009,880 sq m, based on a reduced total office stock of 12,036,298 sq m. This is due to the com-bination of a good letting performance and the withdrawal of older office space from the market for conversion to other uses or refurbishments (approx. 150,000 sq m in H1 2017). The continued reduced supply pipeline also continues to positively affect vacancy figures.
FLÄCHENUMSATZ Alle Daumen hoch am Frankfurter Bürovermietungsmarkt. Nach dem Rekord-jahr 2016 hält er auch im ersten Halbjahr 2017 weiter Kurs auf Bestmarken. Mit einem Vermietungsvolumen von ca. 230.900 m² Fläche im gif-Gebiet wurde erneut eine Umsatzmarke geknackt (Plus von 8,15 % gegenüber Vorjahres-zeitraum). Insgesamt sind in der Finanzmetropole in den ersten sechs Monaten 265 Miet-vertragsverhandlungen erfolgreich geführt worden. Dabei verzeichneten alle drei Flächensegmente eine hohe Nachfrage. Allein zehn Mietverträge wurden im Flächensegment > 5.000 m² geschlossen. Zum Vergleich: 2015 waren es gerade fünf Mietverträge im Gesamtjahr. Hervorzuheben ist die Anmietung von 11.780 m² im Junghof Plaza durch die Anwaltsozietät Clifford Chance im Bankenviertel. Mit 215 Abschlüssen sehr begehrt waren auch Mietverträge im Segment < 1.000 m². Für das Gesamtjahr 2017 geht Knight Frank von einem erneuten Spitzenergeb-nis aus, das nicht nur deutlich über dem 10-Jahresdurchschnitt von 508.858 m² liegen wird, sondern auch voraussichtlich die Bestmarke von 2016 (531.000 m²) toppen wird.
SPACE TAKE UP Frankfurt’s office letting market has had a brilliant start. The city’s office letting market continued its upward trajectory in the first six months of this year, following a record year in 2016. Once again, the letting take-up volume of approx. 230,900 sq m (in the definined gif-Area) exceeded previous records (up 8.15 % compared to the same period last year). A total of 265 lease contracts were negotiated successfully in the financial metropolis in the first six months, with a high level of demand observed in all three size categories. Ten lease contracts were concluded in the > 5,000 sq m size category alone; by comparison, just five were concluded in this size category in the whole of 2015. The most significant deal was concluded by the legal firm Clifford Chance with 11,780 sq m in the Junghof Plaza in the Banking District. The highest number of deals (215) were concluded in the < 1,000 sq m size category. Once again, Knight Frank expects records to be broken by the end of the year: not just exceeding the 10-year average of 508,858 sq m, but also breaking and thereby beating the 2016 result (531,000 sq m).
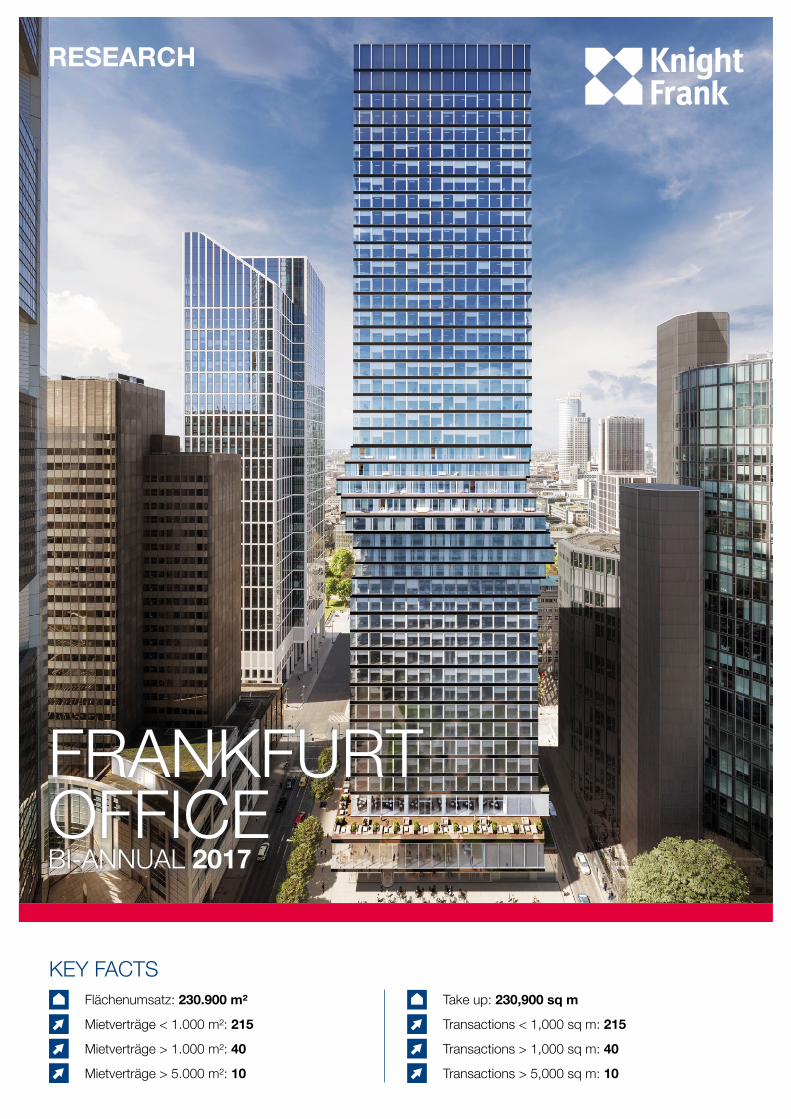
2014 2015 2016 2017
Umsatz (kumulativ) in m2 163.900 178.600 213.500 230.900 Take up (cumulative) sq m
Bestand (kumulativ) in m2 12.144.146 12.190.237 12.110.956 12.036.298 Stock (cumulative) sq m
Leerstand in m2 1.293.357 1.222.927 1.088.217 1.009.880 Vacancy sq m
Leerstandsrate in % 10,7 10,03 9,0 8,4 Vacancy rate in %
Spitzenmiete in € in m2 / Monat 38,00 38,25 38,50 38,50 Prime rent in € / sq m / month
TABELLE 1 · TABLE 1BüromarktdatenOffice market data
Alle Angaben ohne Gewähr. Stand Juli 2017 · All indications are subject to correction. July 2017.
3
Alle Angaben ohne Gewähr. Stand Juli 2017 · All indications are subject to correction. July 2017.
HALBJAHRESBERICHT 2017BI-ANNUAL REPORT 2017
BÜROMARKTBERICHTOFFICE REPORT
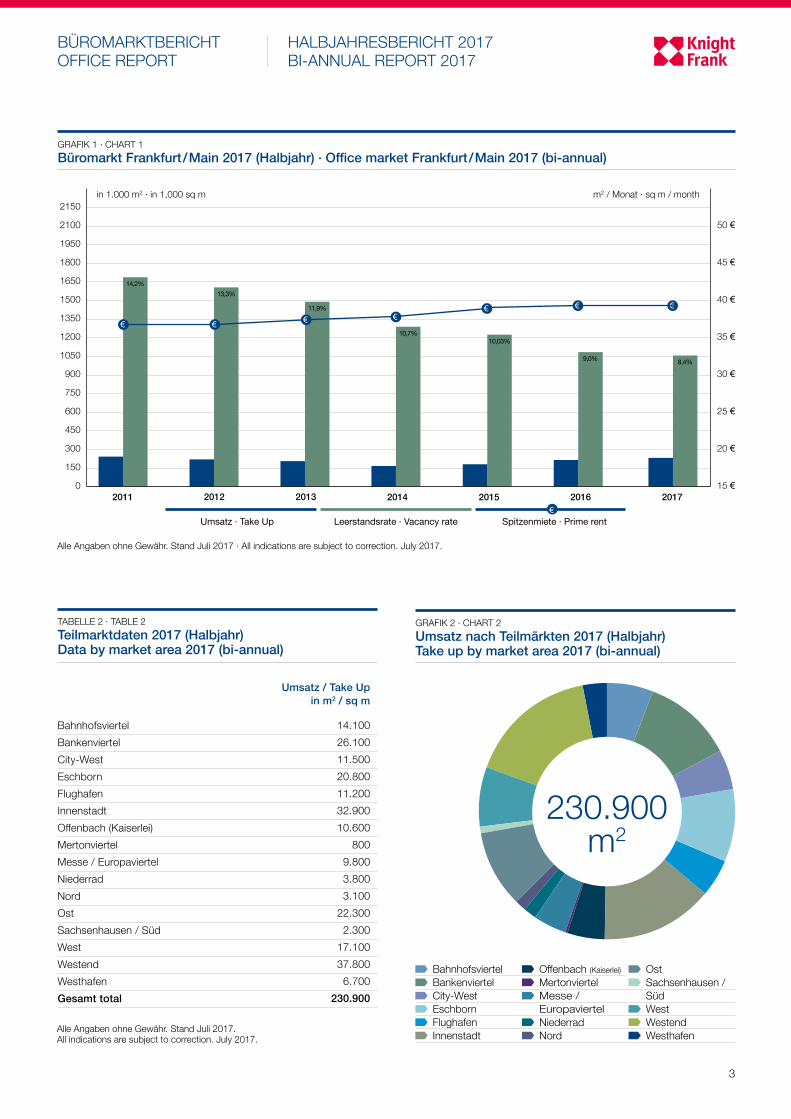
BahnhofsviertelBankenviertelCity-WestEschbornFlughafenInnenstadtOffenbach (Kaiserlei)MertonviertelMesse / EuropaviertelNiederradNordOstSachsenhausen / SüdWestWestendWesthafenGesamt total
Umsatz / Take Up in m2 / sq m
14.10026.10011.50020.80011.20032.90010.600
8009.8003.8003.100
22.3002.300
17.10037.800
6.700230.900
Bahnhofsviertel Bankenviertel City-West Eschborn Flughafen Innenstadt
Offenbach (Kaiserlei) Mertonviertel Messe /
Europaviertel Niederrad Nord
Ost Sachsenhausen /
Süd West Westend WesthafenAlle Angaben ohne Gewähr. Stand Juli 2017.
All indications are subject to correction. July 2017.
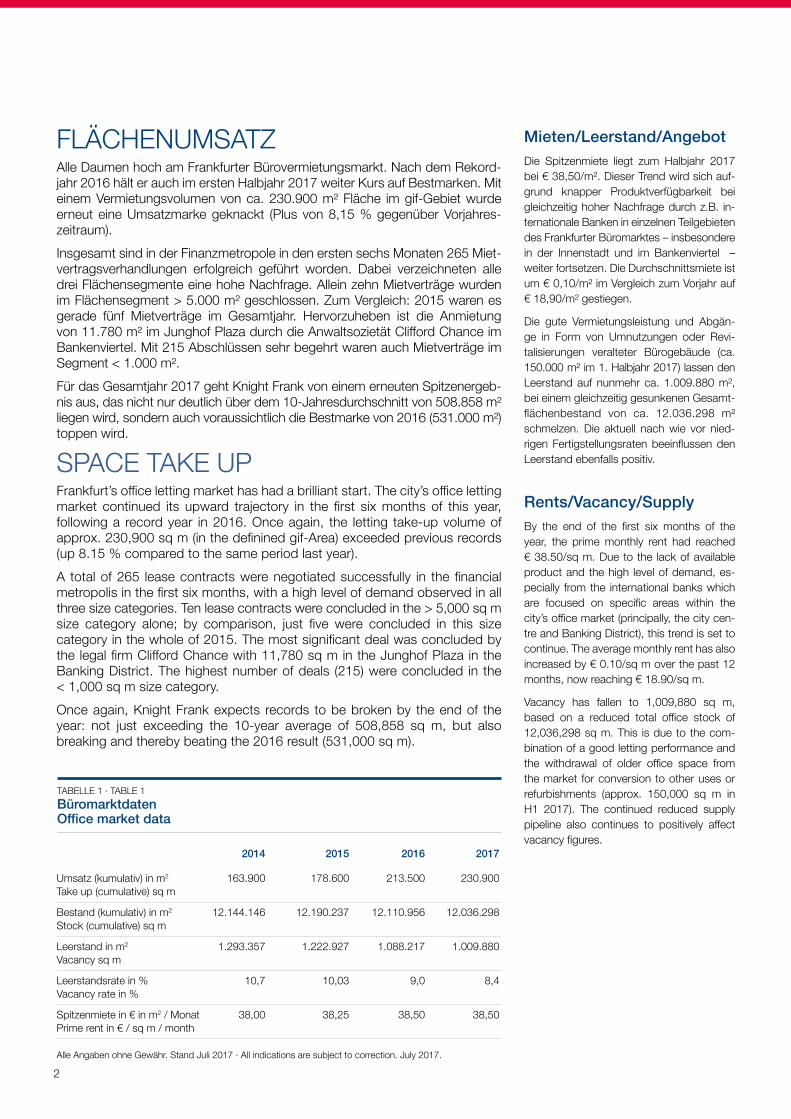
in 1.000 m2 · in 1,000 sq m
2011 2012 2013 2014 2015 2016 2017
Umsatz · Take Up Leerstandsrate · Vacancy rate Spitzenmiete · Prime rent
m2 / Monat · sq m / month2150
2100
1950
1800
1650
1500
1350
1200
1050
900
750
600
450
300
150
0
50 €
45 €
40 €
35 €
30 €
25 €
20 €
15 €
€
11,9%
10,7%10,03%
9,0% 8,4%
14,2%13,3%
€ €€
GRAFIK 1 · CHART 1Büromarkt Frankfurt/Main 2017 (Halbjahr) · Office market Frankfurt/Main 2017 (bi-annual)
GRAFIK 2 · CHART 2Umsatz nach Teilmärkten 2017 (Halbjahr)Take up by market area 2017 (bi-annual)
230.900m2
TABELLE 2 · TABLE 2Teilmarktdaten 2017 (Halbjahr) Data by market area 2017 (bi-annual)
€€ € €
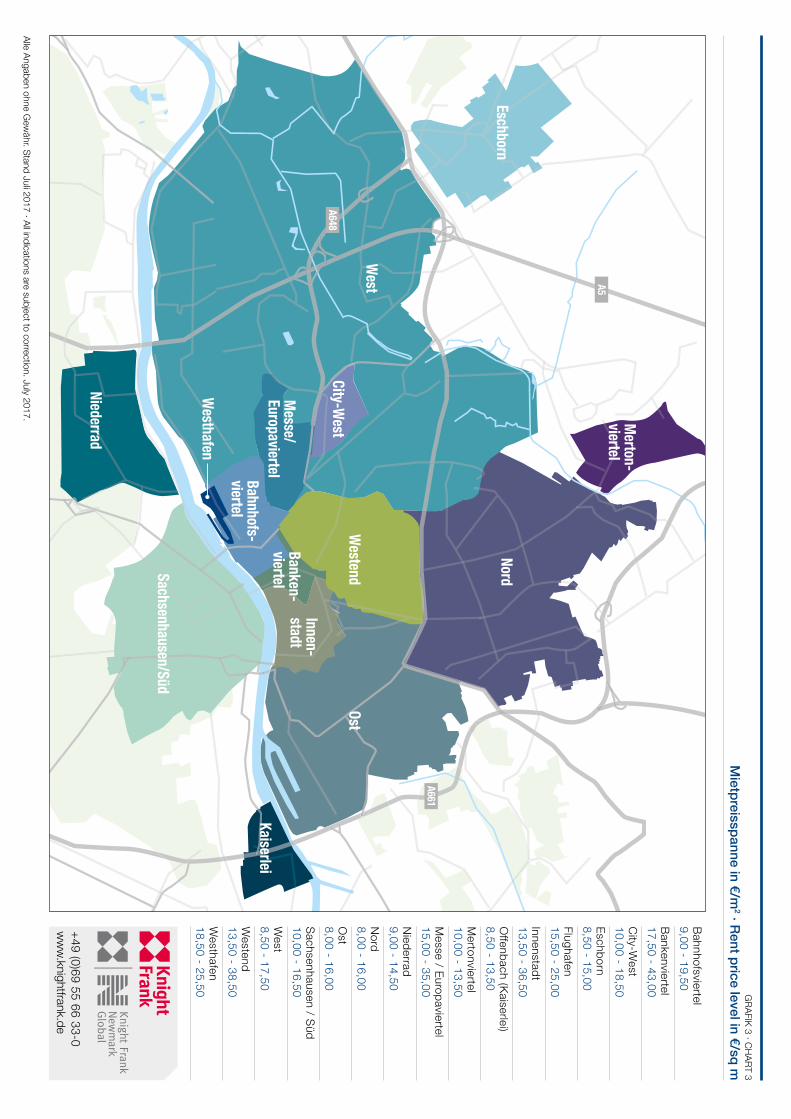
Bahnhofsviertel 9,00 - 19,50Bankenviertel 17,50 - 43,00C
ity-West
10,00 - 18,50 Eschborn 8,50 - 15,00Flughafen 15,50 - 25,00Innenstadt 13,50 - 36,50O
ffenbach (Kaiserlei) 8,50 - 13,50M
ertonviertel 10,00 - 13,50M
esse / Europaviertel 15,00 - 35,00N
iederrad 9,00 - 14,50 N
ord 8,00 - 16,00O
st 8,00 - 16,00Sachsenhausen / Süd 10,00 - 16,50 W
est 8,50 - 17,50W
estend 13,50 - 38,50W
esthafen 18,50 - 25,50
A648
A66
A661
A5
West
City-West
Westend
Ost
Sachsenhausen/Süd
Niederrad
KaiserleiBahnhofs-viertel
Banken-viertel
Westhafen
Innen-stadt
Messe/
Europaviertel
EschbornNord
Merton-
viertel
+49 (0)69 55 66 33-0w
ww.knightfrank.de
Alle Angaben ohne Gew
ähr. Stand Juli 2017 · All indications are subject to correction. July 2017.
GRAFIK 3 · CHART 3
Mietpreisspanne in €/m
2 · Rent price level in €/sq m