Embed Size (px)
Citation preview


CONSOLIDATED FINANCIAL HIGHLIGHTS
STATEMENT OF THE CHAIRMAN
CORPORATE GOVERNANCE• Corporate Governance Framework • Biographies of Board Members • Group Chart • Organization Chart - Fransabank SAL• Executive and Management Committees - Fransabank SAL• Management - Fransabank SAL• Local Banking Subsidiaries - Board of Directors and General Managers• Overseas Banking Subsidiaries and Associate - Board of Directors and General Managers
HISTORICAL MILESTONES
MANAGEMENT REPORT• Lebanon’s Economic Performance in 2016• Consolidated Results of Operations• Main Ratios• Resolutions of Fransabank SAL Ordinary General Assembly• Core Banking Activities
- Investment and Private Banking - Corporate Banking - Retail Banking - China Desk
• Local Subsidiaries and Associate- BLC Bank SAL- Fransa Invest Bank SAL (FIB)- Lebanese Leasing Company SAL (LLC)- Bancassurance SAL- Société Générale Foncière SAL (Sogefon)
• Overseas Subsidiaries and Associate- Fransabank (France) SA- Fransabank El Djazaïr SPA- Fransabank OJSC (Belarus)- Fransabank SAL Iraq branches- United Capital Bank (Sudan)
• Risk Management• Compliance • Human Resources• Information and Communication Technology• Corporate Social Responsibility• Environmental and Social Management System (ESMS)
CONSOLIDATED FINANCIAL STATEMENTS• Independent Auditors’ Report• Consolidated Statement of Financial Position• Consolidated Statement of Profit or Loss• Consolidated Statement of Profit or Loss and Other Comprehensive Income• Consolidated Statement of Changes in Equity• Consolidated Statement of Cash Flows• Notes to the Consolidated Financial Statements
GROUP NETWORK• Lebanon - Parent Company, Subsidiaries and Associates • Overseas Subsidiaries and Branches • Overseas Associate• Representative Offices
CONTENTS
2
6
1013161820212223
26
303243444545454647484848494949505050515151525556585963
66707273747678
130134136136

0
30
60
90
120
150
180
210
(in million of USD)
Net ProfitFor The Financial Year
2015201420132012 2016
+ 5.80% CAGR + 7.27% + 7.79%CAGR CAGR
(in million of USD)
0
3,000
6,000
9,000
12,000
15,000
18,000
21,000
0
1,000
2,000
3,000
4,000
5,000
6,000
7,000
TotalAssets
(in million of USD)
Loans & AdvancesTo Customers (Net)
2015201420132012 2016
160.37
160.75
166.98
179.62 20
0.9
5
18,942
.47
19,993
.66
20,8
54.6
1
15,750
.64
16,964
.39
2015201420132012 2016
4,83
9.17
5,29
2.86 6,28
8.59
5,819.06
6,53
3.39
31.12.13
14,121.09
5,292.86
160.75
1,654.76
16,964.39
14.72%
116
3,265
1,507.5
31.12.12
13,065.30
4,839.17
160.37
1,488.57
15,750.64
12.44%
114
3,227
1,507.5
31.12.14
15,346.48
5,819.06
166.98
1,865.74
18,942.47
15.07%
124
3,416
1,507.5
31.12.15
16,306.91
6,288.59
179.62
1,956.34
19,993.66
14.74%
124
3,493
1,507.5
Customers' Creditor Accounts
Loans & Advances to Customers (net)
Net Profit for the Financial Year
Shareholders' Equity
Total Balance Sheet
Capital Adequacy Ratio
Number of Local Branches
Staff Number
Exchange Rate USD/LBP
as per Basel III as per Basel III as per Basel III as per Basel III
+8.08%
+9.38%
+0.24%
+11.16%
+7.71%
31.12.16
17,007.08
6,533.39
200.95
2,127.06
20,854.61
15.37%
125
3,561
1,507.5
as per Basel III
In million of USD
+8.68%
+9.94%
+3.88%
+12.75%
+11.66%
+6.26%
+8.07%
+7.57%
+4.86%
+5.55%
prog.15/14
prog.14/13
prog.13/12
CONSOLIDATED FINANCIAL HIGHLIGHTS
+4.29%
+3.89%
+11.88%
+8.73%
+4.31%
prog.16/15

0
300
700
900
1,200
1,500
1,800
2,100
2,400
2015201420132012 2016
2015201420132012 20162015201420132012 2016
+ 6.81% CAGR
+ 9.33% CAGR
+ 2.10% CAGR + 4.48% CAGR
0
3,000
6,000
9,000
12,000
15,000
18,000
0
5
10
15
20
25
30
35
40
0
1
2
3
4
5
6
7
8
(in million of USD)
Customers’Creditor Accounts
(in million of USD)
Shareholders’Equity
(in USD)(in million of USD)
Earningsper Common Share
Loans & Advances To Customers To Customers’ Creditor Accounts (%)
0
100
200
300
400
Net InterestIncome
13,065
.30
14,121.0
9
15,346
.48
16,306.91
17,0
07.
08
2,12
7.0
6
1,488
.57
1,654
.76
1,865
.74
1,956
.34
392.
20
360.91
373.00
388.30
396.04
38.4
2%
37.04%
37.48%
38.56%
37.92%
2015201420132012 2016
6.63
6.37 6.59
7.26 7.
90
2015201420132012 2016
FRANSABANK | ANNUAL REPORT 2016 | 2-3

FOLLOW YOURSENSES WITHTHE BELIEF IN
RIGHTEOUSNESS

FRANSABANK | ANNUAL REPORT 2016 | 4-5
S TAT E M E N T O F T H E
C H A I R M A N

We are pleased to report that 2016 wasanother year of solid growth forFransabank Group.
The financial sector is experiencingsubstantial changes directed by internaland external players. Geopoliticalinstability, macroeconomic conditions,changing customer expectations,technological advances, along with astronger competitive market andgreater regulatory pressure, are drivinga more challenging banking environment. Yet, we believe that thesesame changes will lead, as well as, tonew opportunities reinforcing our statusand conveying long-term values for allour stakeholders.
Amidst these developments, theLebanese financial market managed todeliver satisfactory financial results. Atyear-end 2016, total assets of banksoperating in Lebanon grew by 9.7%reaching USD 209 billion and customers’deposits and loans to the private sectorincreased by 7% and 5.4% respectively.
In sync, Fransabank Group’s resultsonce again echoed the strength of ourdiversified business model andconfirmed our hard work to grow into amore customer-centric Bank, embracinga transparent and resourceful financialexperience, and continue to generategreat outcomes.
Shrewdly managing risks and resources,Fransabank Group delivered a netprofit of USD 200.9 million in 2016, upby 11.9% from USD 179.6 million in2015. In this context, Return on AverageCommon Equity (ROACE) reached 11.21%
STATEMENT OF THE CHAIRMAN
Adnan Kassar - Chairman & Adel Kassar - Deputy Chairman
"Fransabank Group’s resultsonce again echoed the strength ofour diversified business model andconfirmed our hard work to grow intoa more customer-centric Bank"

FRANSABANK | ANNUAL REPORT 2016 | 6-7
and Return on Average Assets (ROAA)reached 0.98%. Total assets reachedUSD 20.86 billion, an increase of 4.3%from USD 19.99 billion at year-end 2015.Net loans and advances to customersstood at USD 6.53 billion at year-end2016, up by 3.9% from year-end 2015.Customers’ deposits amounted toUSD 17.01 billion at year-end 2016,an increase of 4.3% from year-end 2015.In addition, the solvency ratio as perBasle III attained 15.4% by end-December2016, exceeding the standards requiredby the Central Bank of Lebanon.
Accordingly, the preceding has advancedFransabank Group’s ranking inLebanon in terms of net profits fromthe fourth position at end 2015 to thethird position at end 2016, sustained itsthird position in terms of total assetsand loans and advances to customersand consolidated its fourth rankingin terms of customer’s deposits.
Furthermore, Fransabank Groupfollows a sound expansion strategygrabbing potential opportunitieswhether internationally or locally.
In this vein, we retain a focusedinternational presence to assist ourcustomers across our countries ofoperation, targeting mainly the well-spread Lebanese Diaspora but alsodrawing foreign customers to our corebusiness. Fransabank intensivelyworked on further developing itsbilateral relations with The Republic ofChina. Through our dedicated ChinaDesk, we have been proactivelydeveloping products and services incorrespondent banking, corporate
banking, SME, and retail, as well as,hosting promotional events in bothcountries. Fransabank is workingtowards the development of trade andtourism for the benefit of its clientele,and for the Chinese companies.
Locally, our “Go Green” Strategycontinued to build on our position andreputation as the Sustainable EnergyFinance (SEF) leader Bank in Lebanonwhereby, we received the highestrecognition from Business for Peaceand were selected to representSustainable Development Goal 13:Climate Action. Fransabank SEF loanwas also recognized as a “replicable”success story, at the Conference ofParties (COP22) in Marrakech, whichthe International Finance Corporation(IFC) will recommend as best practiceto its clients in the Middle East & NorthAfrica region. Further, integratingsustainability in our product portfolio,Fransabank has been helping clientsbetter understand green investments;their long-term benefits for thebusinesses, as well as, combattingclimate change.
In view of that, we have worked in 2016on updating our corporate socialresponsibility strategy for the years2016 to 2018 focusing on integratingcorporate responsibility further in ourcore business. We aim to do this byestablishing common grounds andclear directives on integrating a holisticsustainability approach. As such,Fransabank was much involved inimplementing updated compliancerequirements, whether arising fromlocal or international regulatory bodies;
covering risk management, corporategovernance, anti-money laundering,combatting terrorism financing, FATCA,etc…
Likewise, our approach to improvingquality is proactive. We aim to identifythe needs and expectations of ourcustomers and strive to provide solutions.We sustain our quality throughcontinuously investing in our valuablehuman resources and technology inorder to achieve continued progress.
While we are satisfied with theprogress made by the Group in 2016,we will go on with the fulfilment of ourvision and mission, carrying out ourresponsible strategy while keeping ourcustomers’ at the heart of what we do.In 2017, we will consolidate our effortsto improve the customer experience,sustain a solid financial performance;while reinforcing our compliance andrisk management know-hows over andabove a sound market growth.
With the valuable commitment andcontributions of our shareholders, theunfaltering trust of our customers andcontinued unwavering commitment ofour employees, we will continue topursue our mission to create value forshareholders, customers, employeesand the society at large.
Sincerely,
Adnan Kassar

LISTEN TO THENEED OF
ENSURINGMORAL
PRACTICES
LISTEN TO THENEED OF
ENSURINGMORAL
PRACTICES

FRANSABANK | ANNUAL REPORT 2016 | 8-9
C O R P O R A T E
G O V E R N A N C E

Fransabank Corporate Governance framework revolves essentiallyaround the Corporate Governance Code as adopted by theBoard of Directors in line with the regulatory requirements andinternational best practices. It also includes a set of governancerelated policies and charters, as well as, a Code of Conduct & Ethics.
This framework promotes the commitment of the Bank to thehighest level of transparency, integrity, fairness and accountabilityand helps in disseminating a strong governance culture withinthe Bank by setting the ‘tone at the top’.
The Group’s strategy remains to standardize the implementationof Good Corporate Governance practices across its entities and
to strengthen its governance and control culture, taking intoconsideration the Corporate Governance requirements of hostjurisdictions.
Governance Structure
Fransabank governance structure, which aims to provide anefficient framework for the assignment of responsibility andaccountability, includes the General Assembly of Shareholders;the Board of Directors; the Chairman; the Deputy Chairman;the various Committees; control functions; the external auditors;senior management and the business and support functions.
Fransabank is committed to implement sound Corporate Governance practices,which focus on the main guiding principles of transparency, accountability, integrityand fairness in the treatment of all stakeholders.
CORPORATE GOVERNANCE FRAMEWORK
Corporate Governance
ManagementCommittees
ExecutiveCommittee
RemunerationCommittee
CorporateGovernanceCommittee
BoardRisk
Committee
BOARD COMMITTEES
Board of Directors
GENERAL ASSEMBLY (SHAREHOLDERS)
AuditCommittee
Chairman &Deputy Chairman
General Managers
AML/CFTBoard
Committee
Corporate Governance &Group Risk Management
GroupInternal Audit
External Audit
GroupCompliance
Inspection
Senior Management
Business &Support Functions
Rights of Shareholders
Shareholders enjoy all rights conferred upon them by theLebanese Code of Commerce, including the right to vote at theGeneral Assembly, the right to receive dividends, the right totransfer their shares and the preferential right to subscribe tocapital increases. All common shareholders, including minority
shareholders, enjoy the same rights and benefits and have onevoting right for each common share (the principle of one share,one vote) without limitation. Shareholders who own registeredshares for at least two years are entitled to a double voting rightaccording to Article 117 of the Lebanese Code of Commerce.
Adnan KassarAdel KassarDeutsche Investitions - und Entwicklungsgesellschaft mbH (DEG) (2)Al-Fadl Holdings LimitedThe Public Institution for Social Security – KuwaitOthers (3)
Total Shareholding
(1) Percent of total share capital consisting of 21,500,000 Common Shares as at 31.12.2016(2) Deutsche Investitions - und Entwicklungsgesellschaft mbH DEG is one of Germany’s top development and investment banks. DEG is owned by
Kreditanstalt für Wiederaufbau KfW, which, in turn, is owned by the German Government. (3) Each with less than 2%.
39.5739.605.002.702.00
11.13
100
PERCENT (1)Main Holders of Common Shares as at December 31, 2016
Fransabank Governance Structure

Board of Directors
Fransabank is governed by a Board of Directors, which consistsof twelve members elected by the General Assembly ofshareholders for three years.
The management of the Bank is vested in the Board of Directors,which, at Fransabank, consists of a sufficient mixture of non-executive and independent members. The majority of Boardmembers qualify as non-executive. This composition aims tosafeguard the governance and effectiveness of the Board andto ensure the objective of adding value to all shareholders,investors, clients and community in the short, medium andlong terms.
The Board has overall responsibility of the Bank, includingadopting and overseeing the implementation of the Bank’sstrategic objectives, risk strategy, risk policies, corporategovernance and corporate values, as well as ensuring thatadequate, effective and independent controls are in place.
A charter of the Board of Directors was developed in line withthe prevailing Lebanese laws & regulations and internationalgood practices. The charter aims to define the composition,roles and responsibilities and the authority of the Board ofDirectors, including the adoption of a framework to collectivelyevaluate the Board performance in relation to its compliancewith the Corporate Governance Principles.
During 2016, the Board of Directors has met four times.
In carrying out its oversight responsibilities, the Board issupported by the Corporate Governance Committee, BoardRisk Committee, Audit Committee and the RemunerationCommittee. These committees are chaired by independentnon-executive members.
H.E. Mr. Adnan KassarExecutive Director
Mr. Adel KassarExecutive DirectorMember of the AML/CFT Board Committee
Mr. Antoine Jeancourt GalignaniNon-Executive DirectorChair of the Audit Committee and the Corporate Governance Committee
Mr. Bernd TümmersNon-Executive DirectorMember of the Board Risk Committee
The Public Institution for Social Security - KuwaitNon-Executive Director
Mrs. Magda RizkNon-Executive DirectorChair of the AML/CFT Board Committee
H.E. Mr. Nehmé TohméNon-Executive Director
H.E. Mr. Walid Daouk, Esq.Non-Executive DirectorMember of the Audit Committee, the Corporate Governance Committee, the AML/CFT Board Committee and the Remuneration Committee
Mr. Rafic CharafeddineNon-Executive DirectorChair of the Remuneration Committee
Mr. Nadim KassarExecutive Director
Mr. Henri GuilleminNon-Executive DirectorChair of the Board Risk Committee
Dr. Walid NajaNon-Executive DirectorMember of the Board Risk Committee, the Audit Committee, the Corporate Governance Committee, the Remuneration Committee and the AML/CFT Board Committee
Board Members
FRANSABANK | ANNUAL REPORT 2016 | 10-11

The Corporate Governance Committee, Risk ManagementCommittee and Audit Committee meet at least quarterly andwhen necessary. The Remuneration Committee shall meet atleast semi-annually. A charter was established to eachCommittee, which indicates the Committee’s scope of work,membership structure and composition, meetings, as well as,its roles and responsibilities. The Charters are regularlyupdated to ensure compliance with local and internationalstandards.
During 2016, each of the Corporate Governance Committee,the Board Risk Committee and the Audit Committee held fourmeetings and the Remuneration Committee held two meetings.
Corporate Governance Committee
The responsibility of the Corporate Governance Committee isto provide oversight of all material Corporate Governanceissues affecting the Bank and its subsidiaries and to ensurethat Fransabank Corporate Governance practices are in linewith the regulatory requirements and international bestpractices.
Board Risk Committee
The Board Risk Committee’s responsibilities are to assist theBoard of Directors in fulfilling its risk-related duties and tooversee the proper implementation of the risk managementprinciples. In discharging its responsibilities, the Committeemonitors the Bank’s risk profile through the reports submittedby the Chief Risk Officer to the Board Risk Committee prior topresenting them to the Board of Directors. The Committee isalso responsible for recommending to the Board of Directorsthe Bank’s risk policy including the risk appetite and risktolerance.
Audit Committee
The Audit Committee is established to assist the Board ofDirectors in its oversight responsibilities regarding the:
• Evaluation of the internal control regulations and procedures• Assessment of the qualifications and independence of theexternal auditors
• Supervision of the internal audit’s activities• Integrity of the financial statements• Review of the Bank’s disclosure standards.
Remuneration Committee
The Remuneration Committee ensures that the Bank hascomprehensive remuneration policies and procedures andoversees their implementation.
In December 2016, the Board has established an Anti-MoneyLaundering/Combating the Financing of Terrorism - AML /CFTBoard Committee. The Committee’s charter is underpreparation to be further submitted to the Board of Directorsfor approval.
Management
The Chairman of the Board may suggest to the Board theappointment of one or more General Managers and DeputyGeneral Managers, who shall act for account and under thefull responsibility of the Chairman. In addition, seniormanagement would include heads of key departments tosupport the general management in running the day-to-daymanagement of the Bank.
Specialized Management Committees are established, whosemembers include senior staff, having the responsibility to setstrategies and take decisions as necessary for the developmentof the Bank’s activities.
Control Functions
Fransabank implements sound internal control systemsto ensure appropriate segregation of duties and avoidance ofconflicts of interest within the organization structure.
The Bank recognizes the importance of implementing soundcontrol functions at the Bank including risk management,compliance, internal audit and inspection functions. Thesefunctions ensure that the Bank’s activities are performed inaccordance with the prevailing laws and regulations, as wellas, with the Bank’s policies and procedures.
Charter of Board Committees
Corporate Governance

BIOGRAPHIES OF BOARD MEMBERS
FRANSABANK | ANNUAL REPORT 2016 | 12-13
H.E. MR. ADNAN KASSARChairman of the Board of Directors
H.E. Mr. Adnan Kassar is the Chairman & CEO of Fransabank Group and member of theBoard of Directors of BLC Bank SAL and Fransabank (France) SA. He is also the Chairmanof the Supervisory Board of Fransabank OJSC in Belarus. He and his brother Adel acquiredFransabank in 1980. H.E. Mr. Kassar served as Minister of Economy and Trade in Lebanonfrom 2004 to 2005 and Minister of State in Lebanon from 2009 to 2011. He was the first Arabbusinessman elected Chairman of the International Chamber of Commerce (ICC) andheaded the World Business Organization from 1999 to 2000. He is also former President ofthe Lebanese Federation of Chambers of Commerce, Industry and Agriculture in Lebanonand headed this Federation for over thirty years (from 1972 to 2002). He is the President ofthe Lebanese Economic Organizations and is the Honorary Chairman of the General Unionof Chambers of Commerce, Industry and Agriculture of the Arab Countries which groupsmillions of companies and associations from the 22 member Arab countries. He is theHonorary Chairman of the Silk Road Chamber of International Commerce (SRCIC) electedin 2016. Mr. Kassar has received global awards and high distinguished decorations frommany Heads of States and International Organizations including the Oslo Business for PeaceAward in 2014 and the “China Arab Outstanding Contribution” Award from China’s PresidentXi in 2016. He holds a law degree from Saint Joseph University, Beirut and an HonoraryDoctorate from the Lebanese American University. www.adnankassar.com
Born in 1930 - Lebanon
MR. ADEL KASSARDeputy Chairman of the Board of Directors
Mr. Adel Kassar is the Deputy Chairman and Chief Executive Officer of Fransabank Group.He is the Chairman of the Board of Directors of Fransabank France SA. He is also theChairman of the Board of Directors and General Manager of Bancassurance SAL andLebanese Leasing Company SAL. He is member of the Board of Directors of BLC Bank SALand member of the Supervisory Board of Fransabank OJSC in Belarus. He and his brotherAdnan acquired Fransabank in 1980. He is a former Chairman of the Association of Banksin Lebanon and is the Honorary Consul General of the Republic of Hungary in Lebanon. Heholds a degree in Lebanese and French law from Saint Joseph University, Beirut, affiliatedto the Faculty of Law of Lyon, France.
Born in 1932 - Lebanon
MR. ANTOINE JEANCOURT GALIGNANIChair of the Audit Committee & the Corporate Governance Committee
Mr. Antoine Jeancourt Galignani started his career at the French Ministry of Finance andlater joined Chase Manhattan Bank in New York and Crédit Agricole. He was appointed asManaging Director, then Chairman of Bank Indosuez. He was also member of the Board ofDirectors of Banque Saudi Fransi, in Saudi Arabia and the Chairman and CEO of AGF, whichwas later acquired by Allianz Group and the Chairman of the holding company of SNA. Healso served in numerous Boards such as TOTAL, Bouygues and Société Générale and hechaired the Board of the Institute of International Finance in Washington from 1991 to 1994.Mr. Galignani was until the 1st of December 2012 the Chairman of the Board of EurodisneyFrance. He holds a master degree in economics and political sciences from ENA, France.
Born in 1937 - France

Corporate Governance
MRS. MAGDA RIZKChair of the AML/CFT Board Committee
Mrs. Magda Rizk is the owner and manager of Rizk Real Estate and Agricultural Properties. She chairedthe Remuneration Committee and was member of the Risk Management Committee at FransabankSAL until December 2016. She was also a member of the Audit Committee at Fransabank SAL from2008 to 2012. She is a specialized lawyer in property law and a member of the Beirut Bar Association.She holds a degree in Lebanese and French law from Saint Joseph University, Beirut.
THE PUBLIC INSTITUTION FOR SOCIAL SECURITY – KUWAIT
The Public Institution for Social Security is a public institution which has an independent budgetand is under the supervision of the Minister of Finance. The Institution has a Board of Directors,chaired by the Minister of Finance and a General Manager who is responsible for executing thepolicy as drawn-up by the Board of Directors. The Public Institution for Social Security isrepresented by Mr. Mohammad Al-Qassar in the Board of Directors.
Mr. Bernd Tümmers began his career as business administration trainer in a German manufacturingcompany, followed by being the assistant to the CFO of a large engineering and construction companyin the USA. He joined Deutsche Investitions - und Entwicklungsgesellschaft mbH (DEG), Cologne -member of the KFW Banking Group, as Investment Manager for South East and East Asia in 1980 andthen Head of Department in charge of DEG’s activities in Asia. In 1996, he became Senior VicePresident and served in various management positions; among others, he was responsible for DEG’sinvestments for approximately five hundred companies worldwide with an investment volumeof USD 6 billion. After his retirement in 2012, he founded his own consulting firm and became partnerof AdminiStraight GmbH, a company advising German companies in different fields. He still serves asa member of the Board of Directors in DEG’s few companies. He holds an MBA degree from Universityof Cologne, Germany.
MR. BERND TÜMMERSMember of the Board Risk Committee
Born in 1947 - Germany
Born in 1957 - Lebanon
H.E. Mr. Nehmé Tohmé is the Chief Executive Officer for many contracting companies operating inSaudi Arabia, Qatar and Bahrain. He also established several corporations and was a shareholder,partner or member of the Board of Directors in many companies. He was elected as member ofthe Lebanese Parliament in 2000 and served as Minister of Displaced from 2005 to 2008. He holdsa BS in civil engineering from the American University of Beirut.
H. E. MR. NEHMÉ TOHMÉ
Born in 1939 - Lebanon
H.E. Mr. Walid Daouk, Esq is a specialized lawyer in commercial law, civil and property law. He startedhis career in 1981, as an associate in Takla & Trad law firm becoming thereafter a partner. In 2005, heoccupied the position of Vice Chairman at the International Affairs Commission at the Beirut BarAssociation, and in 2008, he became a member of the Arbitration Commission. In 2011, hewas appointed Minister of Information and Minister of Justice per interim. After the termination ofhis appointment in 2014, he resumed his practice as lawyer and legal consultant in above mentionedfirm. He is a lawyer and legal advisor for multinational and Lebanese companies performing businessin various fields. Also, he is a Board member of many corporations in Lebanon and abroad includingFransabank SAL, Fransabank (France) SA, Fransabank El Djazaïr SPA, BLC Bank SAL, Semiramis SAL,Beirut Waterfront Development SAL, Tourism and Hotel Development Company SAL. He was a memberof the Board of Directors of the Council for Development and Reconstruction of Lebanon (CDR)2001-2004. He is the Commissioner of the Lebanese Government at the Beirut Stock Exchange since1994. He holds a degree in Lebanese and French law from Saint Joseph University, Beirut and hadprepared a degree in Business Management at the Beirut University College.
H.E. MR. WALID DAOUK , ESQ.Member of the Audit Committee, the Corporate Governance Committee, the AML/CFT Board Committee and the Remuneration Committee
Born in 1958 - Lebanon

FRANSABANK | ANNUAL REPORT 2016 | 14-15
MR. NADIM KASSAR
Mr. Nadim Kassar is a General Manager of Fransabank SAL. He is also the Vice Chairman andGeneral Manager of BLC Bank SAL, Founder and Board Member of Fransa Invest Bank SAL (FIB),Founder and Chairman of Fransabank El Djazaïr SPA, Board Member of the Association of Banksin Lebanon since 2001, Vice Chairman and Board Member of USB Bank PLC, Board Member ofLebanese International Finance Executives (LIFE), Co-Manager of A.A. Kassar (France) SARLand General Manager of A.A. Kassar SAL. Mr. Kassar is also a Board Member of the followinginstitutions: MasterCard Incorporated Asia, Pacific, Middle East & Africa, SAMEA Regional Boardof Directors since 2005, NetCommerce, International Payment Network (IPN) SAL, Credit CardManagement, Founder and Board Member of the American Lebanese Chamber of Commerce. Heholds as well the position of Deputy Chairman of Société Financière du Liban SAL. He holdsa bachelor’s degree in Business Administration from the American University of Beirut.
Mr. Rafic Charafeddine is a businessman, and has participations in various companies. He deals inconstruction projects and real estate investments.
MR. RAFIC CHARAFEDDINEChair of the Remuneration Committee
Born in 1939 - Lebanon
Born in 1964 - Lebanon
Dr. Walid Naja is former Chairman of the Banking Control Commission - Central Bank of Lebanon.He previously served as Economic Counselor at the Lebanese Embassy in Washington D.C., andGeneral Manager of the Federation of Chambers of Commerce, Industry and Agriculture inLebanon. He holds graduate degrees in economics and international relations from the AmericanUniversity of Beirut and Yale University, USA.
DR. WALID NAJAMember of the Board Risk Committee, the Audit Committee, the Corporate Governance Committee, the Remuneration Committee and the AML/CFT Board Committee
Born in 1941 - Lebanon
Mr. Henri Guillemin started his career at Crédit Lyonnais. He then joined Indosuez Bank in 1978and was appointed at different management positions in Singapore, Saudi Arabia (Jeddah andRiyadh), Bahrain and Paris. He became Managing Director of Banque Saudi Fransi in Riyadh in1993 for four years and then was promoted Director for the Middle East and Africa region for CréditAgricole Indosuez, based in Paris. Mr. Guillemin was the Managing Director of Crédit AgricoleEgypt SAE, Cairo between 2007 and 2011. He holds a degree in economic sciences from SorbonneUniversity, Paris, as well as a degree in political studies, and an MBA degree from INSEADFontainebleau.
MR. HENRI GUILLEMIN Chair of the Board Risk Committee
Born in 1947 - France

L
G
1
1
BANKS ABROAD
REPRESENTATIVE OFFICES
68%
• Group CMA-CGM (Franco-Lebanese) 25%
• Maghreb Truck Cie SPA Algeria 7%
79.21%**
• BPCE International et Outre Mer (IOM) 20.79%**
20%
• Aref Investment Group Kuwait 25%
• Athman Moushtaraks for Trading Co. - Kuwait 15.02%
• Boubyan Bank KSC Kuwait 21.67%
• Financial Company for Investment & Development Egypt 6.25%
• Al Imtiyaz Investment Co. Kuwait 5.83%
• Others 0.04%
• Riyada Capital - Kuwait 2.92%
• Others 3.31%
91.55%
• Fransa Holding SAL Lebanon 8.41%
Nota: Fransabank Group Chart updated for events occurring up to May 2017.
BLC Bank has two subsidiaries in Lebanon: BLC Finance & BLC Services.
99.25%
Fransabank(France) SAFrance
UnitedCapital BankSudan
FransabankOJSCBelarus
USBBank PLCCyprus
FransabankEl DjazaïrSPA - Algeria
Cuba(Havana)
Ivory Coast(Abidjan)
UAE(Abu Dhabi)
FRANSABANK
** as of 31 March 2016
GROUP CHART
Corporate Governance

50%
• Banque Libano-Française SAL 40%
• BLC Bank SAL 10%
87.49%
• DEG Germany 12.50%
• Others 0.01%
99.88% 99.70% 99.70% 96.70%
68.58% 100%
• Holding M. Sehnaoui 18.44%
• Others 1.87%
• Silver Capital Holding 4.86%
37.067%
BANKS IN LEBANON
COMPANIES IN LEBANON
74 branches in Lebanon and 2 branches in Iraq
49 branches in Lebanon
(F 2
A
6.25%
Lebanese LeasingCompany SAL
Fransabank Insurance Services Co SAL
SogefonSAL
ExpressSARL
Switch & ElectronicServices SAL
BLC BankSAL
BancassuranceSAL
SAL
FransaInvest BankSAL
Bank of Beirut andthe Arab CountriesSAL
FRANSABANK | ANNUAL REPORT 2016 | 16-17

ORGANIZATION CHART - FRANSABANK SAL
Corporate Governance
Boardof Directors
Chairman &Deputy Chairman
Inspection
Compliance
Strategy &Development
CorporateBanking
LegalAffairs
Judicial
GeneralManager
GeneralManager
BranchNetwork
RetailBanking
LoanRecovery
RealEstate
CentralOperations
CreditReporting
& DocumentationCredit
InformationFinancialControl
& AccountingCredit
Appraisal

FRANSABANK | ANNUAL REPORT 2016 | 18-19
RiskManagement
InternalAudit
G GeneralManager
B
Policies& Procedures
InternationalBanking
Treasury &Capital Markets ICT & Projects Engineering
& Logistics Administration HumanResources
Marketing &Corporate
CommunicationOrganization

EXECUTIVE AND MANAGEMENT COMMITTEES – FRANSABANK SAL
Corporate Governance
H.E. Mr. Adnan Kassar Chairman General Manager
& or
Mr. Adel Kassar Deputy Chairman General Manager
Mr. Nadim Kassar General Manager
Mr. Mansour Bteish General Manager
Mr. Nabil Kassar General Manager
H.E. Mr. Walid Daouk, Esq.
Mr. Nabih Saddy Group Chief Financial Officer
Miss Mona Khoury Group Chief Risk Officer (Non-voting Member)
Credit Committees
Asset / Liability Committee
Overseas Expansion Committee
Banking Technology Committee
Information Security Committee
Compliance Committee
Human Resources Committee
Marketing & Corporate Communication Committee
Purchasing Committee
Management Committees
Executive Committee

FRANSABANK | ANNUAL REPORT 2016 | 20-21
MANAGEMENT – FRANSABANK SAL
Mr. Nadim Kassar General ManagerMr. Mansour Bteish General ManagerMr. Nabil Kassar General ManagerDr. Mohamad Daher Deputy General Manager, Head of Corporate Banking Mr. Philippe El Hajj Deputy General Manager, Head of Retail BankingMiss Mona Khoury Deputy General Manager, Group Chief Risk OfficerMr. Nadim Moujaes Deputy General Manager, Head of Strategy & DevelopmentMr. Nabih Saddy Deputy General Manager, Group Chief Financial Officer Mr. Nabil Tannous Deputy General Manager, Head of Treasury & Capital Markets Mr. Wajdi Abi Chacra Secretary General
Mr. Georges Andraos Head of International Banking Mr. Zouheir Chouraiki Group Chief Internal AuditorMr. Fouad Khalifeh Group Chief Compliance Officer Mr. Pierre Posbic Head of OrganizationMr. Antoine Asmar Business Development Consultant, Corporate BankingMr. Roland Tabib Chief Information OfficerMr. Zakaria El Khatib Head of Inspection Mr. Fouad Helou Head of Central Operations Mrs. Dania Kassar Head of Marketing & Corporate Communication Dr. Walid Yazigi Head of Human Resources Mr. Antoine Younes Head of Credit Appraisal Mr. Antoine Zarifeh Head of Small & Medium Enterprises Mr. Khalil Assaf Head of Special CreditsMrs. Gretta Boustany Head of Trade Finance Mrs. Lama Dick Head of Local & Overseas Credit CardsMrs. Lama Ghoutaymi Head of Loan RecoveryMiss Hoda Kadi Head of Policies & Procedures Mrs. Magida Kasbani Head of AdministrationMr. Adel Moubarak Head of Security & Business ContinuityMr. Roger Abboud Head of Credit InformationMrs. Dalal Halabi Head of Credit Reporting & DocumentationMr. Nagi Makhlouf Head of Engineering & Logistics Me. Joumana Oueidat Head of Judicial Mrs. Sawsan Rawda Head of Consumer Protection
Mr. Joseph Akiki Head of Branch Management, Regional Manager, Hamra Main Branch
Mrs. Najwa Sandid Regional Manager, Beirut IMr. Antoine Nehmeh Regional Manager, Beirut IIMr. Francis Abi Nakhoul Regional Manager, Mount Lebanon, Group AMr. Georges Saliba Regional Manager, Mount Lebanon, Group BMr. Amine Abou Mhaya Regional Manager, BekaaMr. Assaad Fadel Regional Manager, SouthMr. Nazih Chaarani Regional Manager, NorthMr. Farouk Chreif Area Manager, BekaaMr. Raed Hajj Area Manager, Beirut I
H.E. Mr. Adnan Kassar Chairman General Manager
Mr. Adel Kassar Deputy Chairman General Manager
General Management
Management
Local Network Management

LOCAL BANKING SUBSIDIARIESBoard of Directors and General Managers
Corporate Governance
LEBANON
BLC BANK SAL
Board of DirectorsH.E. Mr. Maurice Sehnaoui Chairman General Manager
Mr. Nadim Kassar Vice Chairman General Manager
H.E. Mr. Adnan Kassar Member
Mr. Adel Kassar Member
Mr. Nabil Kassar Member
H.E. Mr. Walid Daouk, Esq. Member
Mr. Mansour Bteish Member
H.E. Mr. Nazem El Khoury Member
Mr. Walid Ziade, Esq. Member
Ms. Youmna Ziade Member
H.E. Mr. Ziad Baroud, Esq. Member
Mr. Henri De Courtivron Member
General Manager Mr. Nadim Kassar
FRANSA INVEST BANK SAL
Board of DirectorsMr. Nabil Kassar Chairman General Manager
Fransabank SAL Member
Mr. Nadim Kassar Member
H.E. Mr. Walid Daouk, Esq. Member
Mr. Mansour Bteish Member
Mr. Michel Saroufim Member
Mr. Mohammed Mou'minah Member
Mr. Henri Guillemin Member
Mr. Ghantous Gemayel Member
General Manager Mr. Michel Saroufim
BLC FINANCE SAL
Board of DirectorsMr. Mansour Bteish Chairman
Fransabank SAL Member
Holding M. Sehnaoui SAL Member
General Manager Mr. Mansour Bteish
BLC SERVICES SAL
Board of DirectorsH.E. Mr. Nazem El Khoury Chairman General Manager
BLC Bank SAL Member represented by H.E. Mr. Maurice Sehnaoui
Holding M. Sehnaoui SAL Member represented by H.E. Mr. Maurice Sehnaoui
H.E. Mr. Walid Daouk, Esq. Member
Mr. Walid Ziade, Esq. Member
Mr. Khaled Salman Member
General Manager H.E. Mr. Nazem El Khoury

FRANSABANK | ANNUAL REPORT 2016 | 22-23
OVERSEAS BANKING SUBSIDIARIES & ASSOCIATEBoard of Directors and General Managers
BELARUS
FRANSABANK OJSC
Supervisory BoardH.E. Mr. Adnan Kassar Chairman,
representing Fransabank SAL
Mr. Adel Kassar Deputy Chairman, representing Fransa Holding SAL
Mr. Georges Andraos Member, Independent Director
Mr. Ghantous Gemayel Member, Independent Director
General Manager Mr. Alexandr Ignatov
FRANCE ALGERIA
FRANSABANK (FRANCE) SA
Board of DirectorsMr. Adel Kassar Chairman
BPCE IOM, Deputy Chairman represented by Mr. Philippe Garsuault
Fransabank SAL, Memberrepresented by Mr. Nabil Kassar
H.E. Mr. Adnan Kassar Member
Mr. Mansour Bteish Member
H.E. Mr. Walid Daouk, Esq. Member
Mr. Yvan de La Porte du Theil Member
Mrs. Patricia Lantz Member
Mr. Henri de Courtivron Member
General Manager Mr. Andre Tyan
CYPRUS
USB BANK PLC (Subsidiary of BLC Bank)
Board of DirectorsH.E. Mr. Maurice Sehnaoui Chairman Non Independent, Non-Executive (BLC Bank)
Mr. Nadim Kassar Vice Chairman Non Independent, Non-Executive (BLC Bank)
Fransa Invest Bank SAL, Non Independent, Non-Executiverepresented by Mr. Mansour Bteish (Fransa Invest Bank SAL being a shareholder in BLC Bank)H.E. Mr. Ziad Baroud, Esq. Independent, Non-ExecutiveMr. Henri Guillemin Independent, Non-ExecutiveMr. Agis Taramides Independent, Non-ExecutiveMr. George Galatariotis Independent, Non-ExecutiveMr. George Stylianou Independent, Non-ExecutiveMr. Philippos Philis Independent, Non-ExecutiveMr. Andreas Theodorides Non Independent-Executive Mrs. Despo Polycarpou Non Independent-Executive
General Management Mr. Andreas Theodorides, CEO
SUDAN
UNITED CAPITAL BANK
Board of DirectorsMr. Mohamad Al Adasani Chairman representing Aref Investment Group
Mr. Mansour Bteish Vice Chairman Mr. Abdul Salam Alsaleh Member representing Boubyan BankMr. Ghanem Al Ghanem Member representing Aref Investment Group
Mr. Yousuf El-Thuwaihk Member representing Aref Investment Group
Mrs. Amira Al Alami Member representing Financial Company for Investment and Development - Egypt
Mr. Al Sherif Badur Member Independent DirectorProf. Ahmed Majzoub Ahmed Member Independent DirectorMr. Yousif Ahmed El-Tinay Member General Manager Mr. Yousif Ahmed El-Tinay
FRANSABANK EL DJAZAÏR SPA
Board of DirectorsMr. Nadim Kassar Chairman
Fransabank SAL, Memberrepresented by Mr. Nabil Kassar
CMA CGM SA, Memberrepresented by Mr. Raja Sarkis
Merit Corporation SAL, Memberrepresented by Mr. Raja Sarkis
H.E. Mr. Walid Daouk, Esq. Member
Mr. Mansour Bteish Member
General Manager Mr. Mohammed Tifour

INHALE THEFUTUREOF AN
UNCEASINGLEGACY
INHALE THEFUTUREOF AN
UNCEASINGLEGACY

FRANSABANK | ANNUAL REPORT 2016 | 24-25
H I S T O R I C A L
M I L E S T O N E S

Fransabank issued itsSeries "A" preferredshares for USD 100 millionas additional Tier 1 capital.
Fransabank acquiredFransabank OJSC - Belarus, formerly knownas Golden Taler Bank.
Fransabank was first established in Beirut as afull branch of one of themajor French banks then,Crédit Foncier d’Algérie etde Tunisie (C.F.A.T.).
Fransabank is registeredn° 1 on the list of banksoperating in Lebanon indicating that it is theoldest Bank in the country.
Société Centrale deBanque in Beirut was acquired by BanqueFrançaise pour le Moyen-Orient SAL (B.F.M.O.), aLebanese company whoseshares were predomi-nantly owned by BanqueIndosuez Group.
C.F.A.T. changed itsname to Société Centrale de Banque.
Banque Indosuez (nowCrédit Agricole Corporateand Investment Bank –CACIB which is the investment arm of CréditAgricole SA) was also themajor shareholder ofBanque Sabbag SAL.Banque Indosuez mergedthese two banks underthe name of BanqueSabbag et Française pourle Moyen-Orient SAL.
The Bank’s denominationwas changed to FransabankSAL.
Fransabank concluded a cooperation agreementwith Crédit Agricole SA –France. It led at first to thejoint creation in Paris of Fransabank (France) SA,and to the participation ofCrédit Agricole SA - Francein the shareholding ofFransabank SAL. In linewith its global strategy,Crédit Agricole SA exited from Fransabank(France) SA in 2007 andfrom Fransabank SALshareholding in 2012.
Fransabank acquired37.067% in BBAC SAL.
Fransabank acquired allthe shares of Banque dela Békaa SAL. Subsequently, in 2007,the Bank sold Banque dela Békaa as an emptyshell.
Fransabank was the firstLebanese Bank to enterthe Algerian market withthe opening of its subsidiary Fransabank El Djazaïr SPA.
Fransabank launched itsoperations in Sudanthrough an associatebank, United CapitalBank.
Fransabank acquired BLCBank SAL along with itstwo subsidiaries, BLC Services SAL and BLC Finance SAL.
Fransabank concurrentlypurchased 34% of theshare capital of Fransabank (France) SAheld by Crédit Agricole SA(bringing its participationin the share capital to100%), and sold 40% of theshare capital of Fransabank (France) SA to Financière Océor, a subsidiary of GroupeCaisse d’Epargne (France) -currently BPCE, following which the Bank’sparticipation in the share capital of Fransabank (France) SA became 79.21% as fromMarch 2016.
Fransabank acquired United Bank ofSaudi & Lebanon SAL.
Banque Indosuez soldits shares in BanqueSabbag et Françaisepour le Moyen-OrientSAL to a financial groupheaded by Messrs.Adnan & Adel Kassar.
1921
HISTORICAL MILESTONES
2002 2003 2005 2006 2007 2008
1963 1971 1978 1980 1984

FRANSABANK | ANNUAL REPORT 2016 | 26-27
Fransabank acquired BanqueTohmé sal.
A private placementof shares took place,pursuant to which5% of the Bank’sshares were sold toLebanese, Arab andforeign investors.
The Public Institutionfor Social Security –Kuwait, acquired 2%of the Bank’s sharecapital.
Fransabank concluded an agreement withDeutsche Investitions- und Entwicklungs-gesellschaft mbH(DEG), which led tothe acquisition byDEG of 5% of theBank’s share capital.
Fransabank established theLebanese LeasingCompany SAL.
Fransabank acquired Universal Bank sal.
Fransabank issued its Series "B" preferredshares for USD 85million as additionalTier 1 capital.
BLC Bank SAL acquired 9.9% of USB Bank PLC – Cyprusand increased thisshare gradually toreach 99.25% in July2016.
Fransabank celebrated its 90years anniversary oflegacy and expertise.
Fransabank issuedits Series "C" preferred shares forUSD 75 million asadditional Tier 1capital.
BLC Bank opened itsrepresentative office in Abu Dhabi.
Fransabank acquired the assets & liabilities ofChase ManhattanBank’s branches inBeirut.
Fransa Invest Bank(FIB), the investment banking subsidiary ofFransabank started itsoperations.
Fransabank has setup a China Deskwith the objectiveto promote and facilitate exchangesbetween Lebanon andChinese businessmenby using Fransabankplatform.
Fransabank and Predica SA – the insurance arm ofCrédit Agricole SA –France established Bancassurance SAL.
Fransabank inaugurated its twonew branches in Baghdad and in Erbil-Kurdistan, Iraq.
Fransabank acquired and mergedAhli International Bank SAL.
Fransabank issued itsSeries "D" preferredshares for USD 85 million as additionalTier 1 capital.
Fransabank redeemedits Series "A" preferredshares for USD 100 million and issued Series "E" preferredshares for USD 105 million as additionalTier 1 capital.
Fransabank establisheda representative officein Abidjan - Ivory Coast.
2010 2011 2012 2013 2014 2015
1985 1993 1995 1997 1998 1999 2001

SAVORTHE GREATMOMENTS
OFACCOMPLISHMENT
SAVORTHE GREATMOMENTS
OFACCOMPLISHMENT
SAVORTHE GREATMOMENTS
OFACCOMPLISHMENT
SAVORTHE GREATMOMENTS
OFACCOMPLISHMENT

FRANSABANK | ANNUAL REPORT 2016 | 28-29
M A N A G E M E N T
R E P O R T

LEBANON’S ECONOMIC PERFORMANCE IN 2016
Management Report
Lebanon’s macro economy recorded a relative improvementand better performance in 2016 relative to 2015 due mainly tomore favorable domestic political environment and a decelerationof regional turmoil. This was accompanied by an improvingperformance in the main pillars of the Lebanese economy: thereal-estate sector, the monetary and financial situations, thestrong capital inflows and the balance of payments.
The real sector experienced an improved performance in 2016relative to 2015. The number of real-estate transactionsincreased by 1.4% to reach 64,248 transactions in 2016. Also,the value of real-estate transactions grew by 4.9% to reachUSD 8.4 billion during the same period. The constructionpermits, an indicator of future construction activity and futuresupply in the real-estate sector, slightly decreased by 0.9% toreach 12.2 million square meters in 2016.
Concerning the activity of Beirut International Airport, anindicator of the tourism activity, the total number of passengersincreased by 5.5% to reach 7.6 million passengers in 2016;while hotel occupancy rate, an indicator of hotel activity andtourism as well, increased slightly by 1% to reach 59% in 2016.In general, the tourism activity was healthier in 2016 ascompared to 2015, with the number of tourists increasing
by 11.2% on annual basis to reach nearly 1.7 million touristsin 2016.
In parallel, the banking sector maintained its steady growth in2016, along with relatively better performance for the BeirutStock Exchange (BSE). The banking activity, as provided by theconsolidated balance sheet of commercial and MLT banks inLebanon, has improved in 2016, with consolidated assetsrecording USD 209 billion at end of December 2016, anincrease of 9.7% from the end of December 2015. The sector’sassets constituted nearly 410% of GDP in 2016 relative to 385%in 2015, one of the highest ratios worldwide. Deposits of theprivate sector increased by 7% during this period, reachingUSD 164.5 billion at the end of December 2016 as comparedto USD 153.7 billion at the end of December 2015. Total loansto the private sector increased by 5.4% to USD 58.6 billion atthe end of December 2016, compared to USD 55.6 billion at theend of December 2015, while total loans to the public sectorreached USD 35.4 billion at the end of December 2016, comparedto USD 38.3 billion at the end of December 2015, registering adecrease of 7.6%.
The commercial and MLT banks’ capital base rose by 9.5% toreach USD 19.6 billion at the end of 2016, reflecting a growingcapitalization of the sector.
BANKING SECTOR INDICATORS (COMMERCIAL AND MLT BANKS)
Total assets Total deposits of private sector Total loans to the private sector Total loans to the public sector Banks’ capital base
190.5153.755.638.317.9
+ 9.7%+ 7%
+ 5.4%- 7.6%+ 9.5%
209164.558.635.419.6
2016In billion of USD 2015 Variation
BSE’s activity in 2016 mirrored the activity of the capital market,which was superior to the year 2015. The total trading volumeof BSE increased by 46.8% on an annual basis reaching109.5 million shares at end-2016. The aggregate turnoverincreased by 50% to reach USD 943.2 million during the sameperiod; and the average daily value of trading surged by 49.4%to reach USD 3.90 million at end-2016.
In addition, market capitalization increased by 6.1%, fromUSD 11.22 billion at end-2015 to USD 11.90 billion at end-2016.Its ratio to GDP reached 23.3% at end-2016, reflecting a narrowcapital market in Lebanon. Market capitalization continues tobe dominated by banking stocks, followed by real-estatestocks, and industrial stocks.
BEIRUT STOCK EXCHANGE INDICATORS
Market capitalization (USD, billion)Total trading volume (Shares, million)Aggregate turnover (USD, million)Average daily trading value (USD, million)
11.2274.66292.61
+ 6.1%+ 46.8%+ 50%
+ 49.4%
11.90109.5943.23.90
2016 2015 Variation
Sources: Central Bank of Lebanon and Association of Banks in Lebanon
Sources: BSE and Central Bank of Lebanon
The fiscal conditions remain unfavorable in light of continuedfiscal deficits and growing public indebtedness and the crowding-out effect of private investment initiated and fueled by publicborrowing.
In view of that, public deficit registered USD 5 billion in the year2016, increasing by 28.2% from the year 2015. When deflatedby GDP, the fiscal deficit constituted nearly 9.8% in 2016,relative to 7.9% in 2015. Public revenues increased by 3.1% in2016, but was counterbalanced with a growth in public spendingby 10.4% during the period mentioned above. As a result ofthese developments on the fiscal front, public indebtedness,
increased by 6.5% in gross debt figures over 2015 reachingUSD 74.9 billion at the end of 2016.
Excluding the public sector’s deposits at the Lebanese BankingSystem from the gross debt figures, the net public debtincreased by 6.2% on annual basis to reach USD 65.4 billion atend-December 2016.
On the other hand, the gross debt-to-GDP ratio increased overthe past two years, from 142% in 2015 to 146.9% in 2016. Theseratios are very high by international standards and clearly reflectthe deep fiscal imbalances in Lebanon’s national accounts.

FRANSABANK | ANNUAL REPORT 2016 | 30-31
PUBLIC FINANCE INDICATORS
Public revenues Public expenditures Fiscal deficit Deficit / Expenditures (%) Gross public debt Net public debt Gross public debt / Nominal GDP (%)
9.613.53.9
28.970.361.6142
+ 3.1%+ 10.4%+ 28.2%
-+ 6.5%+ 6.2%
-
9.914.9
533.674.965.4146.9
2016In billion of USD 2015 Variation
Sources: Ministry of Finance and Central Bank of Lebanon
MONETARY SITUATION INDICATORS
Central Bank of Lebanon’s assets in foreign currency Central Bank of Lebanon’s gold reserves Financial sector depositsConsumer Price Index (CPI variation) (%)
35.99.8
72.9- 3.75
+ 10.3%+ 9.2 %+ 14.4%
-
39.610.783.4
- 0.82
2016In billion of USD 2015 Variation
Sources: Central Bank of Lebanon, Association of Banks in Lebanon, and Central Administration of Statistics
FOREIGN TRADE SECTOR INDICATORS
Exports Imports Trade deficit Capital inflows Balance of payments
2.9518.0715.1211.7- 3.4
+ 1%+ 3.5%+ 4%
+ 44.4%-
2.9818.7115.7316.9+ 1.2
2016In billion of USD 2015 Variation
Sources: Higher Customs Council and Central Bank of Lebanon
The monetary authorities have maintained their monetarystabilization and economic stimulus policies during 2016. Also,financial engineering policies were a major focus of the monetaryauthorities in 2016 which reflected positively on the bankingsystem and economy.
Actually, the second half of 2016 witnessed substantial financialinflows driven by the financial engineering operations of theCentral Bank directed to strengthen Lebanon’s foreign assetsand to support the balance sheets of operating banks. Swapoperations between the Central Bank of Lebanon and theMinistry of Finance and between banks and the Central Bankreached around USD 13 billion, raising the Central Bank foreigncurrency denominated assets by 10.3% at the end of 2016 to arecord high of USD 39.6 billion, as compared to USD 35.9 billionat the end of 2015. These operations enhanced the Central
Bank’s foreign-currency reserves, the growth of non-residentdeposits of banks, the banks’ liquidity in Lebanese pounds, and thebanks’ capitalization base and ratios. In addition, gold reserveswere valued at USD 10.7 billion in 2016, as compared toUSD 9.8 billion in 2015. In contrast, the financial sector depositsat the Central Bank reached USD 83.4 billion at end-2016,as compared to USD 72.9 billion at end-2015, with an increaseof 14.4%.
Due to the moderate growth rate recorded and falling oil prices,Lebanon has continued to experience deflation in 2016. Conse-quently, the Consumer Price Index decreased by 0.82% on averagein 2016 as compared to 3.75% in 2015; while the Beirut TradersAssociation-Fransabank Retail Index stood at 54.78 for the fourthquarter of the year 2016 with a minor decrease as compared to55.56 for the fourth quarter of the year 2015.
The balance of payments, mirroring the aggregate foreign sectoractivity, recorded better activity in 2016 relative to 2015, due tothe substantial increase in capital inflows which resulted in anoffsetting of the trade deficit and produced a substantial surplusin the balance of payments.
The trade deficit widened by a moderate growth rate of 4% onannual basis and reached USD 15.73 billion in 2016, as comparedto USD 15.12 billion in 2015, thus reflecting a radical and continuedforeign deficit which represented nearly 31% of GDP in 2016. Thisminor increase in trade deficit was the result of a weak growthin exports of 1% on annual basis reaching USD 2.98 billion in2016, as compared to USD 2.95 billion in 2015, and a growth in
imports of 3.5% reaching USD 18.71 billion in 2016, as comparedto USD 18.07 billion in 2015.
The year 2016 experienced a substantial level of capital inflowsrecording nearly USD 16.9 billion relative to a level of USD 11.7 billionin 2015, an annual increase of 44.4%. These capital inflows wereinduced by a lowering regional turmoil and political tension inLebanon.
The balance of payments achieved a considerable surplus in2016, recording USD 1.2 billion relative to a substantial deficit ofUSD 3.4 billion a year earlier. The surplus recorded in 2016 wasthe first annual surplus since 2010, as the period 2011-2015 experienced continuous deficits.
Economic growth recorded in 2016: 1% according to theInternational Monetary Fund (IMF) and 1.4% according to theInstitute of International Finance (IIF). Economic growth isexpected to continue in 2017 and 2018, with enhanced real
growth rates and controlled inflation rates. Real economicgrowth is estimated at 2% for 2017 and 2.5% for 2018 accordingto the IMF, and 3.3% and 3.5% respectively for 2017 and2018 according to the IIF.

AVERAGE VOLUME OF INTEREST-EARNING ASSETS
Investment securitiesBanks and financial institutionsLoans and advances to customers TOTAL
10,580,883,5317,146,421,7558,400,772,677
26,128,077,963
11,170,362,7057,298,327,3909,049,450,822
27,518,140,917
2016In thousands of LBP 2015
1. NET INCOME
In 2016, Fransabank SAL net income, amounted toLBP 189.40 billion (USD 125.64 million) compared toLBP 184.34 billion (USD 122.28 million) in 2015, an increase of2.75%. This has translated into a Return on Average Assets of0.90% and a Return on Average Common Equity of 9.46%.
In 2016, the Group’s net income amounted to LBP 302.94 billion(USD 200.95 million) compared to LBP 270.78 billion(USD 179.62 million) in 2015, an increase of 11.88%. This hastranslated into a Return on Average Assets of 0.98% anda Return on Average Common Equity of 11.21%.
BREAKDOWN OF INTEREST RECEIVED
In 2016, the Group’s monthly average interest-earning assetsreached LBP 27,518.14 billion (USD 18,254.16 million)compared to LBP 26,128.08 billion (USD 17,332.06 million) in2015 (+ 5.32%). This growth is due to the increase in:- investment securities (+ LBP 589.48 bill ion or c/vUSD 391.03 million),
- loans and advances to customers (+ LBP 648.68 billion or c/vUSD 430.30 million),
- loans to banks and financial institutions plus placementswith banks and financial institutions (+ LBP 151.90 billion orc/v USD 100.77 million).
OverviewIn 2016, the Lebanese economy grew at a marginally higher pace than last year, despite the challenging regional and local marketconditions. Nevertheless, the Lebanese banking sector sustained its growth proving once again its resilience. Similar to the previousyear, Fransabank Group has managed to achieve another satisfactory performance in 2016 backed by a dynamic, well-perceivedand efficiently implemented business strategy.
From loans and advances to customersFrom investment securitiesFrom loans to banks and placements with banksFrom investments at FVTPL TOTAL
636,741,639682,003,635242,587,37748,888,397
1,610,221,048
662,948,953726,164,749243,578,63441,351,223
1,674,043,559
2016In thousands of LBP 2015
1.1 Net Interest Income
In 2016, the Group’s net interest income amounted toLBP 591.24 billion (USD 392.20 million) compared toLBP 597.04 billion (USD 396.04 million) in 2015, a slightdecrease of 0.97%. This decrease is due to the fact thatthe increase during 2016 in interest expense was greater thanthat in interest received.
In 2016, the Group’s interest received amounted to
LBP 1,674.04 billion (USD 1,110.48 million) compared toLBP 1,610.22 billion (USD 1,068.14 million) in 2015, an increase of3.96%. Interest received from loans and advances to customers,investment securities, loans to banks & placements withbanks and investments at Fair Value Through Profit or Loss(FVTPL), represents 39.60%, 43.38%, 14.55% and 2.47%respectively of total 2016 interest income, compared to 39.54%,42.35%, 15.07% and 3.04% respectively in 2015.
CONSOLIDATED RESULTS OF OPERATIONS
Management Report

In 2016, the Group’s interest paid amounted to LBP 1,082.80 billion(USD 718.28 million) compared to LBP 1,013.18 billion(USD 672.10 million) in 2015 (+ 6.87%). In 2016, the largest
single component of interest paid belongs to customers’deposits, which represents 96.98% of the total comparedto 95.86% in 2015.
In 2016, the Group’s monthly average interest-bearing liabilitiesreached LBP 26,516.83 billion (USD 17,589.94 million) comparedto LBP 25,316.21 billion (USD 16,793.51 million) in 2015 (+ 4.74%).
This growth is largely attributed to an increase in the customers’creditor accounts at amortized cost of 6.28%, i.e. LBP 1,467.50 billion(USD 973.47 million).
BREAKDOWN OF INTEREST PAID
FRANSABANK | ANNUAL REPORT 2016 | 32-33
On deposits and borrowings from banks On deposits from customers and related parties at amortized costOn deposits from customers designated at FVTPLOn obligation under finance leaseOn subordinated loansOn bonds issued and Certificates of depositsOn cash contribution to Share Capital
TOTAL
(37,169,074)(969,306,289)
(1,931,890)(325,744)
(3,168,868)(255,015)
(1,026,833)
(1,013,183,713)
(28,999,146)(1,046,538,245)
(3,525,103)(469,809)
(2,236,993)(7,535)
(1,026,833)
(1,082,803,664)
2016In thousands of LBP 2015
AVERAGE VOLUME OF INTEREST-BEARING LIABILITIES
BDL, Banks and financial institutionsLiabilities designated at FVTPLCustomers’ creditor accounts at amortized costBonds issued and Certificates of depositsSubordinated loansCash contribution to Share Capital
TOTAL
1,843,667,36039,185,175
23,367,774,2446,374,884
42,095,01617,113,885
25,316,210,564
1,564,237,58069,938,336
24,835,278,5564,225
30,256,57417,113,885
26,516,829,156
2016In thousands of LBP 2015
1.2 Net Fee and Commission Income
In 2016, the Group’s net fee and commission income reachedLBP 96.37 bill ion (USD 63.92 million) compared toLBP 84.64 billion (USD 56.15 million) in 2015, an increaseof 13.85%.
Fees and commissions received in 2016 reached LBP 118.80 billion(USD 78.80 million) compared to LBP 108.10 bill ion(USD 71.71 million) in 2015, an increase of 9.89%.
Fees and commissions received in 2016 comprise mainly feeson customers’ transactions and commissions on documentary
LCs and on LGs, which represented 71.29% and 27.98%respectively compared to 75.52% and 23.64% in 2015.
Fees and commissions paid in 2016 reached LBP 22.43 billion(USD 14.88 million) compared to LBP 23.46 bill ion(USD 15.56 million) in 2015, a decrease of 4.39%.
Fees and commissions paid in 2016 comprise fees on customers’transactions and commissions on transactions with banks,which represents 79.09% and 20.91% respectively comparedto 85.94% and 14.06% in 2015.
Management Report
1.3 Other Net Gain/(Loss) on Investments at FVTPL
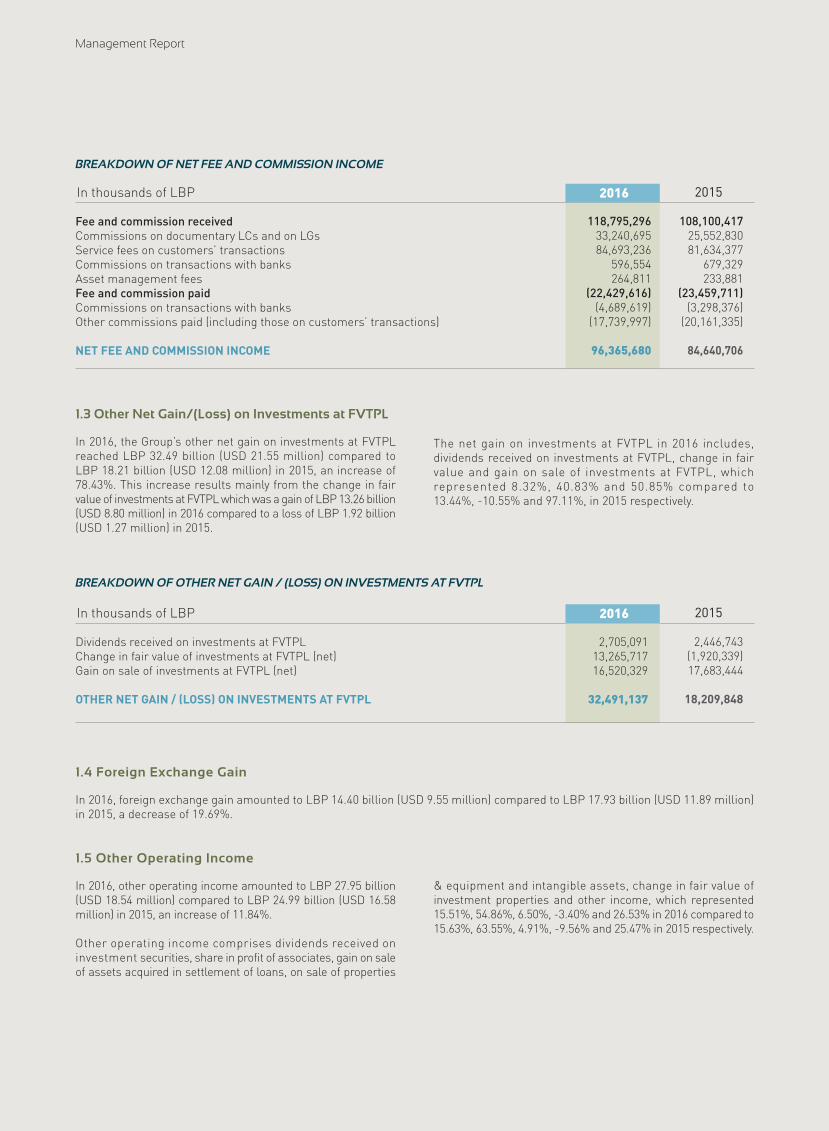
In 2016, the Group’s other net gain on investments at FVTPLreached LBP 32.49 billion (USD 21.55 million) compared toLBP 18.21 billion (USD 12.08 million) in 2015, an increase of78.43%. This increase results mainly from the change in fairvalue of investments at FVTPL which was a gain of LBP 13.26 billion(USD 8.80 million) in 2016 compared to a loss of LBP 1.92 billion(USD 1.27 million) in 2015.
The net gain on investments at FVTPL in 2016 includes,dividends received on investments at FVTPL, change in fairvalue and gain on sale of investments at FVTPL, whichrepresented 8.32%, 40.83% and 50.85% compared to13.44%, -10.55% and 97.11%, in 2015 respectively.
1.4 Foreign Exchange Gain
In 2016, foreign exchange gain amounted to LBP 14.40 billion (USD 9.55 million) compared to LBP 17.93 billion (USD 11.89 million)in 2015, a decrease of 19.69%.
1.5 Other Operating Income
In 2016, other operating income amounted to LBP 27.95 billion(USD 18.54 million) compared to LBP 24.99 billion (USD 16.58million) in 2015, an increase of 11.84%.
Other operating income comprises dividends received oninvestment securities, share in profit of associates, gain on saleof assets acquired in settlement of loans, on sale of properties
& equipment and intangible assets, change in fair value ofinvestment properties and other income, which represented15.51%, 54.86%, 6.50%, -3.40% and 26.53% in 2016 compared to15.63%, 63.55%, 4.91%, -9.56% and 25.47% in 2015 respectively.
BREAKDOWN OF NET FEE AND COMMISSION INCOME
Fee and commission receivedCommissions on documentary LCs and on LGsService fees on customers’ transactionsCommissions on transactions with banksAsset management feesFee and commission paidCommissions on transactions with banksOther commissions paid (including those on customers’ transactions)
NET FEE AND COMMISSION INCOME
108,100,41725,552,83081,634,377
679,329233,881
(23,459,711)(3,298,376)
(20,161,335)
84,640,706
118,795,29633,240,69584,693,236
596,554264,811
(22,429,616)(4,689,619)
(17,739,997)
96,365,680
2016In thousands of LBP 2015
BREAKDOWN OF OTHER NET GAIN / (LOSS) ON INVESTMENTS AT FVTPL
Dividends received on investments at FVTPLChange in fair value of investments at FVTPL (net)Gain on sale of investments at FVTPL (net) OTHER NET GAIN / (LOSS) ON INVESTMENTS AT FVTPL
2,446,743(1,920,339)17,683,444
18,209,848
2,705,09113,265,71716,520,329
32,491,137
2016In thousands of LBP 2015

FRANSABANK | ANNUAL REPORT 2016 | 34-35
BREAKDOWN OF OTHER OPERATING INCOME
Dividends income on investment securitiesShare in profit of associatesGain resulting from the sale of assets acquired in settlement of loans, properties & equipmentand intangible assetsChange in fair value of investment propertiesOther OTHER OPERATING INCOME
3,904,45915,879,755
1,227,694(2,388,213)6,363,237
24,986,932
4,333,68915,330,578
1,818,344(950,806)7,414,504
27,946,309
2016In thousands of LBP 2015
NET ALLOCATION TO PROVISIONS FOR LOANS & ADVANCES TO CUSTOMERS
Allowance for impairment of loans and advances and off Balance Sheet itemsWrite-back of impairment loss on loans and advances and off Balance Sheet itemsBad debts expenseWrite-back of discount on purchased loan portfolio TOTAL
(99,054,299)37,479,478(737,415)352,865
(61,959,371)
(89,729,933)82,313,088(716,318)610,503
(7,522,660)
2016In thousands of LBP 2015
BREAKDOWN OF GENERAL EXPENSES
Staff costsAdministrative expensesDepreciation and amortization of assets TOTAL
(254,007,016)(118,977,713)(30,148,911)
(403,133,640)
(258,267,012)(118,144,447)(30,760,107)
(407,171,566)
2016In thousands of LBP 2015
In 2016, the Group’s net allocation to provisions for loans andadvances to customers amounted to LBP 7.52 billion(USD 4.99 million) compared to LBP 61.96 billion (USD 41.10 million)in 2015, a decrease of 87.86%, which may be described asfollows:
- allowance for impairment of customers’ loans and advancesand off Balance Sheet Items for LBP 89.73 bill ion(USD 59.52 million) compared to LBP 99.05 billion(USD 65.71 million) in 2015, a decrease of 9.41%,
- bad debts expense for LBP 0.71 billion (USD 0.48 million),compared to LBP 0.74 billion (USD 0.49 million) in 2015,
- write-back of impairment loss on loans and advances and offBalance Sheet Items for LBP 82.31 billion (USD 54.60 million),against LBP 37.48 billion (USD 24.86 million) in 2015, anincrease of 119.62%,
- write-back of discount on purchased loan portfolio forLBP 0.61 billion (USD 0.41 million) against LBP 0.35 billion(USD 0.24 million) in 2015, an increase of 73.01%.
1.7 General Expenses
In 2016, the Group’s general expenses comprising staff costs,administrative expenses, depreciation and amortization ofassets, reached LBP 407.17 billion (USD 270.10 million)compared to LBP 403.13 billion (USD 267.42 million) in 2015,an increase of 1% . This increase is due to the following :
- salaries and related charges amounted to LBP 258.27 billion(USD 171.32 million) in 2016 compared to LBP 254 billion(USD 168.50 million) in 2015, an increase of 1.68%,
- administrative expenses amounted to LBP 118.14 billion(USD 78.37 million) in 2016 compared to LBP 118.98 billion(USD 78.92 million) in 2015, a decrease of 0.70%,
- depreciation and amortization of assets amounted toLBP 30.76 billion (USD 20.41 million) in 2016 comparedto LBP 30.15 billion (USD 20 million) in 2015, an increase of2.03%.
1.6 Net Allocation to Provisions for Loans & Advances to Customers

Management Report
1.8 Income Tax and Deferred Tax
The Group’s income tax for the financial year 2016 amountedto LBP 53.98 billion (USD 35.81 million), compared toLBP 58.58 billion (USD 38.86 million) for the financial year2015, a decrease of 7.86%. Deferred tax on associates and
subsidiaries’ profits for the financial year 2016 amounted toLBP 9.15 billion (USD 6.07 million), compared to LBP 8.02 billion(USD 5.32 million) for the financial year 2015, an increase of13.99%.
Soft loans from Banque du LibanLong-term borrowingsBanks and financial institutionsCustomers’ creditor accounts at FVTPLCustomers’ creditor accounts at amortized costSubordinated loanShareholders’ equity
TOTAL
BREAKDOWN OF FUNDING SOURCES AS AT 31 DECEMBER
1.10%4.46%1.00%0.16%
83.17%0.11%
10.00%
100%
323,290,6681,315,013,895295,311,93648,867,277
24,533,805,85631,874,580
2,949,177,947
29,497,342,159
%Amount
273,537,647997,881,769285,611,112136,487,357
25,501,689,77225,499,664
3,206,549,007
30,427,256,328
0.90%3.28%0.94%0.45%
83.81%0.08%
10.54%
100%
Amount %
2016In thousands of LBP 2015
Lebanese PoundsU.S. DollarsEurosOther foreign currencies
TOTAL
FUNDING SOURCES BY CURRENCY AS AT 31 DECEMBER
43.90%47.16%7.26%1.68%
100%
12,949,529,79613,911,098,0772,140,486,375496,227,911
29,497,342,159
%Amount
13,480,881,26714,119,528,8062,197,014,257629,831,998
30,427,256,328
44.31%46.40%7.22%2.07%
100%
Amount %
2016In thousands of LBP 2015
2.1 Funding Sources
As at 31 December 2016, the Group’s funding sourcesamounted to LBP 30,427.79 billion (USD 20,183.92 million)compared to LBP 29,497.34 billion (USD 19,567.06 million) asat 31 December 2015, an increase of 3.15%.
Similar to all other banks in Lebanon, the principal source offunding is customers’ creditor accounts which representedas at 31 December 2016, 84.26% of total funding sources
as compared to 83.33% as at 31 December 2015. Other fundingsources include in addition to the shareholders’ equity whichincludes preference shares, long-term credit lines provided byinternational banks and financial Institutions, deposits ofbanks and financial institutions, subordinated loans and softloans granted by Banque du Liban for the Bank mergers andacquisitions according to the pertinent Lebanese Law ofmergers and acquisitions.
2. TOTAL BALANCE SHEET
As at 31 December 2016, the Group’s Total Balance Sheet amounted to LBP 31,438.32 billion (USD 20,854.61 million) compared toLBP 30,140.45 billion (USD 19,993.66 million) as at year-end 2015, an increase of 4.31%. As at 31 December 2016, theGroup maintained its 3rd rank within the Lebanese banking sector in terms of Total Balance Sheet same as at 31 December 2015.Market share reached 9.36% as at 31 December 2016 compared to 9.85% as at 31 December 2015.

FRANSABANK | ANNUAL REPORT 2016 | 36-37
As at 31 December 2016, 55.69% of the Bank’s major funding sources were denominated in foreign currencies, as compared to56.10% as at 31 December 2015.
Short-term funding (less than 1 year)Medium-term funding (between 1 & 5 years)Long-term funding (more than 5 years)
TOTAL
FUNDING SOURCES BY MATURITY AS AT 31 DECEMBER
86.72%1.72%
11.56%
100%
25,581,376,443505,985,969
3,409,979,747
29,497,342,159
%Amount
25,963,293,028615,534,784
3,848,428,516
30,427,256,328
85.33%2.02%
12.65%
100%
Amount %
2016In thousands of LBP 2015
Customers’ Creditor Accounts
As at 31 December 2016, the Group’s customers’ creditoraccounts at FVTPL and at amortized cost amounted toLBP 25,638.18 billion (USD 17,007.08 million) compared toLBP 24,582.67 billion (USD 16,306.91 million) as at 31December 2015, an increase of 4.29%.
The 4.29% increase was mainly due to the growth in (i) timesaving accounts of LBP 463.15 billion (USD 307.23 million),in ( i i ) term deposits accounts of LBP 446.58 bill ion(USD 296.24 million), in (iii) demand and sight saving accountsof LBP 169.93 billion (USD 112.72 million), in (iv) Customers’
liabilities at Fair Value Through Profit or Loss of LBP 87.62 billion(USD 58.12 million), and in (v) margins and collateral accountsof LBP 85.91 billion (USD 56.99 million). As at 31 December2016, customers’ creditor accounts represent 81.55% of theGroup’s Total Balance Sheet as compared to 81.56% as at31 December 2015.
As at 31 December 2016, the Group maintained its 4th rankwithin the Lebanese banking sector in terms of customers’creditor accounts, with a market share of 9.41% comparedto 9.69% as at 31 December 2015.
BREAKDOWN OF CUSTOMERS' CREDITOR ACCOUNTS BY TYPE AS AT 31 DECEMBER
Customers’ Liabilities at Fair Value Through Profit or Loss (FVTPL)Customers’ liabilities at Fair Value Through Profit or LossRelated parties’ liabilities at Fair Value Through Profit or LossAccrued interestCustomers’ Creditor Accounts at Amortized CostDemand and sight saving accountsTime saving accountsTerm depositsBlocked accountsMargins and collateral accountsRelated parties accountsAccrued interest
TOTAL CUSTOMERS’ CREDITOR ACCOUNTS AT FVTPL & AT AMORTIZED COST
Lebanese PoundsForeign currencies
48,867,27748,485,734
-381,543
24,533,805,8562,392,904,616
13,369,995,9104,890,948,051
72,109,0481,616,394,1462,044,596,684146,857,401
24,582,673,133
39.80%60.20%
136,487,357132,613,147
2,944,192930,018
25,501,689,7722,562,832,319
13,833,140,9585,337,525,209
59,069,4391,702,308,6411,857,623,063149,190,143
25,638,177,129
39.96%60.04%
2016In thousands of LBP 2015

Management Report
BREAKDOWN OF CUSTOMERS’ CREDITOR ACCOUNTS BY AMOUNT AS AT 31 DECEMBER 2016
Amount % % Cum.
1,239,913,710874,271,380
1,176,750,7571,830,316,2712,150,193,1892,491,455,6205,629,292,124
15,392,193,051
8.06%5.68%7.64%
11.89%13.97%16.19%36.57%
8.06%13.74%21.38%33.27%47.24%63.43%
100%
Amount % % Cum.
1,484,887,7121,041,450,2221,385,468,5531,948,939,2071,733,519,9561,183,063,0131,468,655,415
10,245,984,078
14.49%10.17%13.52%19.02%16.92%11.55%14.33%
14.49%24.66%38.18%57.20%74.12%85.67%
100%
A < 50 million50 million ≤ A < 100 million
100 million ≤ A < 200 million200 million ≤ A < 500 million500 million ≤ A < 1.5 billion
1.5 billion ≤ A < 5 billionA ≥ 5 billion
TOTAL 100% 100%
BREAKDOWN OF CUSTOMERS’ CREDITOR ACCOUNTS BY INITIAL MATURITY AS AT 31 DECEMBER 2016
FCsLBP
2,724,801,4221,915,721,6022,562,219,3103,779,255,4783,883,713,1453,674,518,6337,097,947,539
25,638,177,129
10.63%7.47%9.99%
14.74%15.15%14.33%27.69%
10.63%18.10%28.09%42.83%57.98%72.31%
100%
Amount % % Cum.TOTALIn thousands of LBP
100%
Amount % % Cum.
4,501,050,7824,940,475,0593,679,915,4062,063,826,684
45,573,85077,208,60984,142,661
15,392,193,051
29.24%32.10%23.91%13.41%
0.29%0.50%0.55%
29.24%61.34%85.25%98.66%98.95%99.45%
100%
Amount % % Cum.
2,268,473,8614,817,211,0472,843,529,988
199,649,80717,538,55133,603,32465,977,500
10,245,984,078
22.14%47.02%27.75%
1.95%0.17%0.33%0.64%
22.14%69.16%96.91%98.86%99.03%99.36%
100%
P ≤ 1 month1 month < P ≤ 3 months3 months < P ≤ 12 months1 year < P ≤ 3 years3 years < P ≤ 5 years
P > 5 yearsAccrued interest
TOTAL
Number of accountsAverage per account
100% 100%
FCsLBP
6,769,524,6439,757,686,1066,523,445,3942,263,476,491
63,112,401110,811,933150,120,161
25,638,177,129
26.40%38.06%25.44%
8.83%0.25%0.43%0.59%
26.40%64.46%89.90%98.73%98.98%99.41%
100%
Amount % % Cum.TOTALIn thousands of LBP
100%
290,27335,298
325,11247,344
615,38541,662
Shareholders’ Equity
Shareholders’ equity as at 31 December 2016 amounted to LBP 3,206.55 billion (USD 2,127.06 million), compared to LBP 2,949.18 billion(USD 1,956.34 million) as at 31 December 2015, an increase of 8.73%. This increase is mainly due to the incorporation of 2016 net profitsand to the issue of a new series of preference shares by one of the Bank’s subsidiaries.
2.2 Uses of Funds
The Bank uses its funds to comply with Central Banks regulatoryreserve requirements, cash, short term placements and liquidfinancial instruments with international banks and financial
institutions, loans and advances to customers and investmentsecurities.
Cash on handCompulsory / regulatory deposits and Central BanksBanks and financial institutionsInvestment securitiesLoans and advances to customers
TOTAL
BREAKDOWN OF USES OF FUNDS AS AT 31 DECEMBER
0.80%21.70%
4.89%39.70%32.91%
100%
230,236,6856,250,477,1381,409,364,496
11,438,709,6489,480,043,915
28,808,831,882
%Amount
222,382,9417,428,205,7701,407,146,445
11,197,730,7949,849,089,736
30,104,555,686
0.74%24.67%
4.67%37.20%32.72%
100%
Amount %
2016In thousands of LBP 2015

FRANSABANK | ANNUAL REPORT 2016 | 38-39
Lebanese PoundsU.S. DollarsEurosOther foreign currencies
TOTAL
USES OF FUNDS BY CURRENCY AS AT 31 DECEMBER
45.44%45.02%
7.04%2.50%
100%
13,090,621,11512,969,557,592
2,028,544,087720,109,088
28,808,831,882
%Amount
13,693,983,56513,444,842,272
2,201,949,041763,780,808
30,104,555,686
45.49%44.66%
7.31%2.54%
100%
Amount %
2016In thousands of LBP 2015
2016In thousands of LBP 2015
As at 31 December 2016, the Group’s uses of funds amounted to LBP 30,104.56 billion (USD 19,969.85 million) compared toLBP 28,808.83 billion (USD 19,110.34 million) as at 31 December 2015, an increase of 4.50%.
Cash, Central Banks, Banks and Financial Institutions
As at 31 December 2016, Cash, Central Banks and banks &financial institutions portfolio amounted to LBP 9,057.74 billion(USD 6,008.45 million) and constituted 28.81% of total assets
compared to LBP 7,890.08 billion (USD 5,233.88 million) and26.18% of total assets as at 31 December 2015. This representsa year-on-year increase of 14.80%.
Investment Securities
As at 31 December 2016, the Group’s investment securitiesportfolio, which consists of both fixed and variable rates incomesecurities, amounted to LBP 11,197.73 billion (USD 7,428.01 million)compared to LBP 11,438.71 billion (USD 7,587.87 million) as
at 31 December 2015, a decrease of 2.11%. Investment securitiesconstituted 35.62% of total assets as at 31 December 2016compared to 37.95% as at 31 December 2015.
Cash on hand Compulsory / regulatory deposits and Central BanksCompulsory deposits with Central BanksRegulatory placements with Central Banks Current accounts with Central Banks Free placements with Central Banks Blocked deposits with Central BanksRegulatory allowance for country riskAccrued interest Banks and financial institutionsCurrent accounts with banks & FIsTerm placements with banks & FIsBlocked margins with banks & FIsPurchased checks for collection Loans to banks & FIsAccrued interest TOTAL
BREAKDOWN OF CASH, CENTRAL BANKS, BANKS AND FINANCIAL INSTITUTIONS AS AT 31 DECEMBER
2.92%79.22%
8.37%23.50%
2.52%43.00%
0.89%-0.11%1.05%
17.86%4.01%
12.43%0.04%0.48%0.89%0.01%
100%
230,236,6856,250,477,138
660,043,9441,854,217,678
198,611,2603,393,102,147
70,588,203(9,045,000)82,958,906
1,409,364,496316,431,143980,861,501
3,292,00337,564,50370,592,896
622,450
7,890,078,319
%Amount
222,382,9417,428,205,770
738,133,6441,583,627,589
266,033,1044,686,724,169
81,585,869(9,045,000)81,146,395
1,407,146,445476,502,331851,232,219
3,292,00318,841,03656,702,157
576,699
9,057,735,156
2.45%82.01%
8.15%17.48%
2.94%51.74%
0.90%-0.10%0.90%
15.54%5.26%9.40%0.04%0.21%0.62%0.01%
100%
Amount %

Management Report
Securities measured at FVTPLAmortized cost securitiesSecurities measured at fair value through other comprehensive income
TOTAL
BREAKDOWN OF INVESTMENT SECURITIES PORTFOLIO BY CLASSIFICATION AS AT 31 DECEMBER
6.79%90.66%
2.55%
100%
776,960,11410,369,736,891
292,012,643
11,438,709,648
%Amount
815,485,99610,085,227,970
297,016,828
11,197,730,794
7.28%90.07%
2.65%
100%
Amount %
2016In thousands of LBP 2015
Equities and preference sharesLebanese Treasury billsLebanese Government bondsForeign Government bondsForeign bonds issued by banksSubordinated bondsCertificates of deposit issued by Central Bank of LebanonCertificates of deposit issued by banksCorporate bondsAsset-backed securitiesMutual fundAccrued interest
TOTAL
Lebanese PoundsForeign currencies
BREAKDOWN OF INVESTMENT SECURITIES PORTFOLIO BY TYPE AS AT 31 DECEMBER
3.05%27.97%24.20%
2.26%1.72%0.01%
38.13%0.35%0.33%0.44%0.03%1.51%
100%
349,113,0263,199,348,2032,767,589,947
257,887,807196,951,347
1,507,5004,361,355,355
40,439,99738,132,34950,166,749
3,526,818172,690,550
11,438,709,648
68.10%31.90%
%Amount
359,393,3662,760,588,8763,049,815,729
330,118,338152,537,849
1,507,5004,291,945,300
40,366,97616,808,76214,117,711
9,327,904171,202,483
11,197,730,794
56.91%43.09%
3.21%24.65%27.24%
2.95%1.36%0.01%
38.33%0.36%0.15%0.13%0.08%1.53%
100%
Amount %
2016In thousands of LBP 2015
Loans and Advances to Customers
As at 31 December 2016, the Group’s loans and advances tocustomers, net of provisions and unrealized interest for non-performing loans and discount on loan book, amounted toLBP 9,849.09 billion (USD 6,533.39 million) compared toLBP 9,480.04 billion (USD 6,288.59 million) as at 31 December2015, an increase of 3.89%.
As at 31 December 2016, the Group maintained its 3rd rankingwithin the Lebanese banking sector in terms of net loansand advances to customers, with a market share of 9.45%compared to 9.64% as at 31 December 2015.

FRANSABANK | ANNUAL REPORT 2016 | 40-41
BREAKDOWN OF LOANS AND ADVANCES TO CUSTOMERS BY TYPE AS AT 31 DECEMBER
Short term (Commercial loans & other current debtor accounts)Medium & long-term
Consumer loansHousing loansEPH housing loansHousing loans to army personnelEducational loansLoans subsidized by the GovernmentKafalat guaranteed loansCar loansLoans to enterprisesOther loans
Loans and advances to related partiesSubstandard debtsDoubtful, bad debts and purchased loan bookAccrued interest
TOTAL
Less:Provisions and unrealized interest for substandard debtsProvisions and unrealized interest for doubtful and bad debtsDiscount on loan bookCollective provisions for un-classified debts
NET LOANS AND ADVANCES TO CUSTOMERS
Lebanese PoundsForeign currencies
4,390,466,2744,390,732,060
757,402,635803,877,029585,943,124137,571,743
40,916,603391,732,596143,913,501257,072,431
1,262,071,28410,231,114223,032,535144,263,774
1,543,937,08825,325,978
10,717,757,709
(38,892,494)(1,139,841,418)
(6,746,122)(52,233,760)
9,480,043,915
23.48%76.52%
3,284,240,3895,954,534,643
801,945,303951,758,545647,455,569197,086,769
41,949,726381,921,148133,992,419244,767,540
2,513,769,37039,888,25446,029,582169,459,258
1,654,915,03429,658,045
11,138,836,951
(47,852,383)(1,216,306,931)
(5,714,039)(19,873,862)
9,849,089,736
26.16%73.84%
2016In thousands of LBP 2015
ASSET QUALITY AS AT 31 DECEMBER
Regular, watch and unclassified accountsDoubtful & bad debtsSubstandard debtsPurchased loan bookAccrued interest
TOTAL LOANS AND ADVANCES TO CUSTOMERS
Less provisions, discount and unrealized interest for non performing debtsProvisions for doubtful and bad debtsDiscount on loan bookCollective provisions for un-classified debtsCollective provisions for doubtful and bad debtsUnrealized interest for doubtful and bad debtsProvisions for substandard debtsUnrealized interest for substandard debts
NET LOANS AND ADVANCES TO CUSTOMERS
9,004,230,8691,541,710,822
144,263,7742,226,266
25,325,978
10,717,757,709
(1,237,713,794)(349,688,715)
(6,746,122)(52,233,760)(36,398,951)
(753,753,752)(1,132,619)
(37,759,875)
9,480,043,915
9,284,804,6141,652,766,635
169,459,2582,148,399
29,658,045
11,138,836,951
(1,289,747,215)(347,487,659)
(5,714,039)(19,873,862)(39,894,881)
(828,924,391)(1,442,698)
(46,409,685)
9,849,089,736
2016In thousands of LBP 2015
As at 31 December 2016:
• The Group’s doubtful and bad debts, net of provisions, discountand unrealized interest, amounted to LBP 432.89 billion(USD 287.16 million) compared to LBP 397.35 billion(USD 263.58 million) as at 31 December 2015.
• The Group’s provisions, discount and unrealized interest fordoubtful and bad debts amounted to LBP 1,222.02 billion(USD 810.63 million) against LBP 1,146.59 bill ion
(USD 760.59 million) as at 31 December 2015. This placesthe coverage ratio in 2016 at 73.84% compared to 74.26% in2015.
• The Group’s substandard debts, net of provisions and unrealizedinterest, amounted to LBP 121.61 billion (USD 80.67 million)compared to LBP 105.37 billion (USD 69.90 million) as at31 December 2015.

Management Report
ASSET QUALITY RATIOS AS AT 31 DECEMBER
Doubtful and bad debts and purchased loans (net) to Total loans and advances to customers (net)Doubtful and bad debts and purchased loans (net) to Shareholders’ equitySubstandard debts (net) to Total loans and advances to customers (net)Provisions, discount and unrealized interest to Doubtful and bad debts and purchased loansProvisions and unrealized interest for substandard debts to Substandard debts
4.19%13.47%
1.11%74.26%26.96%
4.40%13.50%
1.23%73.84%28.24%
2016 2015
BREAKDOWN OF GROSS LOANS AND ADVANCES TO CUSTOMERS BY AMOUNT AS AT 31 DECEMBER 2016
Amount % % Cum.
677,288,681215,906,610350,079,599692,732,414
1,159,300,7451,730,255,6033,180,938,673
8,006,502,325
8.46%2.70%4.37%8.65%
14.48%21.61%39.73%
8.46%11.16%15.53%24.18%38.66%60.27%
100%
Amount % % Cum.
683,961,625267,417,284680,904,725560,404,169198,174,855156,779,765584,692,203
3,132,334,626
21.83%8.54%
21.74%17.89%
6.33%5.00%
18.67%
21.83%30.37%52.11%70.00%76.33%81.33%
100%
A < 50 million50 million ≤ A < 100 million
100 million ≤ A < 200 million200 million ≤ A < 500 million500 million ≤ A < 1.5 billion
1.5 billion ≤ A< 5 billionA ≥ 5 billion
TOTAL 100% 100%
FCsLBP
1,361,250,306483,323,894
1,030,984,3241,253,136,5831,357,475,6001,887,035,3683,765,630,876
11,138,836,951
12.22%4.34%9.25%
11.25%12.19%16.94%33.81%
12.22%16.56%25.81%37.06%49.25%66.19%
100%
Amount % % Cum.TOTALIn thousands of LBP
100%
3. CAPITAL ADEQUACY RATIO
The Board of Directors has decided to include 2015 and 2016net profits in the calculation of the respective equity ratios. Thisdecision has been taken in anticipation of the 2015 and 2016General Assembly meetings ratification and subject to thededuction of the related estimated dividends distribution. Tonote that the 2016 and 2015 Ordinary General Assemblieswhich were held respectively on 05.06.2017 and 23.05.2016approved the Board a/m decisions. Accordingly, the Group’stotal capital adequacy ratio as at 31 December 2016 is 15.37%(2016 profit included), as compared to 14.74% (2015 profitincluded) as at 31 December 2015.
The capital adequacy ratio is calculated according to CentralBank of Lebanon guidelines, which are in line with the
recommendations of the Committee on Banking Regulationsand Supervisory Practices of the Bank for InternationalSettlements (the Basel III Accord).
On a stand-alone basis, Fransabank’s capital adequacy ratioas at 31 December 2016, stood at 17.37% (2016 profit included),as compared to 16.91% (2015 profit included) as at 31 December2015.
The statutory minimum total capital adequacy ratio requestedby Central Bank of Lebanon is 14% as at end December 2016which was raised from 12% as at end December 2015.
BREAKDOWN OF LOANS AND ADVANCES TO CUSTOMERS BY ECONOMIC SECTOR
Trade & ServicesIndustryConstructionAgricultureRetailMiscellaneous
31.12.1540%
4%
17%
11%
2%
26%
Trade & ServicesIndustryConstructionAgricultureRetailMiscellaneous
31.12.1639%
4%
17%11%
2%
27%

FRANSABANK | ANNUAL REPORT 2016 | 42-43
2016 2015
A. PROFITABILITY
ROAA (Return on Average Assets)ROACE (Return on Average Common Equity)Total interest paid to Total interest receivedNet interest income to Average assetsNet commissions to Net financial revenues (before allocation to provisions)Operating expenses to Net financial revenues (before allocation to provisions) (Cost-to-income ratio)Non-interest income to Net financial revenues (before allocation to provisions)Operating expenses to Average customers’ creditor accountsEPS in USD (Earnings per common share in US Dollar)DPS in USD (Dividend per common share in US Dollar)*Dividend payout ratio (Dividends on common and preferred shares / Net profits)*
B. LIQUIDITY
Average net customers’ loans to Average customers’ creditor accountsAverage customers’ creditor accounts to Average total depositsForeign currency customers’ loans to Foreign currency customers’ creditor accounts
C. CAPITAL ADEQUACY
Shareholders’ equity to Total assetsShareholders’ equity to Loans and acceptancesCapital Adequacy Ratio (as per Basel III)
Common Tier I RatioTier I RatioTotal Capital Ratio
D. ASSET QUALITY RATIOS
Doubtful debts (net) to Total customers’ loans (net)Doubtful debts (net) to Shareholders’ equityProvisions for doubtful debts to Doubtful debtsSubstandard debts (net) to Total customers’ loans (net)Unrealized interest & provisions for substandard debts to Substandard debtsTotal provisions and unrealized interest to Total gross customers’ loans
(*) On an unconsolidated basis.
0.92%10.96%62.92%2.03%10.58%50.37%25.40%1.69%7.261.79
44.91%
38.25%98.26%49.02%
9.78%30.11%
9.53%13.55%14.74%
4.19%13.47%74.26%1.11%26.96%11.55%
0.98%11.21%64.68%1.92%12.28%51.90%24.64%1.62%7.902.12
54.96%
38.49%98.86%47.25%
10.20%31.64%
9.90%13.93%15.37%
4.40%13.50%73.84%1.23%28.24%11.58%
MAIN RATIOS

The Ordinary General Assembly of Fransabank SAL held on 5 June 2017:
• Approved the accounts and the Balance Sheet of Fransabank SAL as at end December 2016
• Acquitted Fransabank SAL Board of Directors for their management of the business activities of the fiscal year 2016
• Decided to allocate out of Fransabank SAL net profit (LBP 189,402,814 thousands) as follows:
- 10% to legal reserve (LBP 18,940,281 thousands),
- LBP 24,000,000 thousands to reserve for general banking risks,
- LBP 9,860,827 thousands to reserve for assets acquired in settlement of bad loans,
- LBP 18,648,475 thousands to general reserve for performing corporate and SME loans,
- LBP 2,303,364 thousands to general reserve for performing retail loans,
- LBP 68.80 billion (LBP 3,200/share) as dividend distribution on common shares, LBP 8,649,281 thousands on preferred
shares - Series B, LBP 7,631,719 thousands on preferred shares - Series C, LBP 8,328,938 thousands on preferred shares
- Series D and LBP 10,684,406 thousands on preferred shares - Series E, representing 36.32%, 4.57%, 4.03%, 4.40% and
5.64% respectively of the Bank’s 2016 net profits.
RESOLUTIONS OF FRANSABANK SAL ORDINARY GENERAL ASSEMBLY
Management Report

FRANSABANK | ANNUAL REPORT 2016 | 44-45
INVESTMENT AND PRIVATE BANKING
2016 was yet another satisfactory year for Fransa Invest BankSAL (FIB), the investment arm of Fransabank whereby itaccomplished several projects and initiatives.
Under the private banking and asset management services,FIB achieved the subsequent:
• Structured for Fransabank a new retail product and was alsodesignated as placement agent for the issue. The structureddeposit was successfully closed in November 2016, raisingover USD 56 million. The product guarantees the investedcapital at maturity as well as annual coupons of 5%. Inaddition, it offers an exposure to a diversified basket ofstocks.
• Designated as project manager by Fransabank for aninaugural fixed income program to be established in 2017.The team began work on the structure, timing and logisticsof the issuance, as well as consulting with potentialinvestors.
• Completed a proposal for the Ministry of Finance for the2016 Republic of Lebanon Eurobond issues, whose objectivewas to refinance Eurobond maturities, including theoutstanding USD 600 million 4.50% April 2016 Eurobond andUSD 400 million 11.625% May 2016 Eurobond.
• Provided a hedging proposal for the Lebanese Governmentand consulted with global banks on the most cost-effectivestrategies that could be undertaken.
• Increased the brokerage client base substantially, withinvestors looking to diversify their investments globally. FIBprovides clients with access to global capital markets.Investments available include common shares, preferredshares, commodities, bonds, futures and options, structuredproducts and funds. FIB also manages its own fund, theFransa Invest Beehive Fund, which is a global balanced fundthat provides exposure mainly to fixed income and equities.
• Expanded its research activities and produced economic andfinancial reports to clients as well as to Fransabankmanagement globally.
• Worked diligently to update all policies and procedures andlegal documents, following the directives to all investmentbanks by the Capital Market Authority (CMA).
At the investment banking services and corporate financelevels, FIB has assessed and evaluated several opportunitiesfor a total transactions value of more than USD 500 million.The opportunities encompassed direct equity investmentopportunities as well as equity and debt placements in additionto debt structuring and arranging.
The team focused its origination efforts on mid-sized firmslooking for capital for transformational actions (regionalexpansion, scale-up, acquisitions, asset purchase, restructuring,deleveraging, etc.), in different sectors such as healthcare,education, retail, digitization, food and beverage, alternativeenergy, tourism, and luxury sectors.
Among transactions under consideration, we mention thefollowing list of potential placements and pipeline of transactions:
• Equity and debt financing of alternative energy projects inthe power production industry exceeding a total financingneed of USD 300 million.
• Acquisition of a regional retail group for an amount exceedingUSD 70 million.
• Bond issue for a financial institution of around USD 35 million.
• Financing of a regional university sponsored by a globallyrenowned institution with international programs, for anamount of USD 25 million.
Two securitization transactions for a total amount ofUSD 5 million involving healthcare and automobile industrieshave been closed. The healthcare entity is a leading and fastgrowing distributor of medical supplies, medical equipmentand pharmaceutical products in the Lebanese market. Theautomobile company is a reference for successful car dealershipsin Lebanon and Levant area. On long-term loan settlementrenegotiation, FIB has managed to recover USD 25 millionexposure from a regional group, and part of a USD 1 billionloan agreement.
On a separate note, FIB continued the follow-up and managementof Fransabank Group and FIB investment portfolios in VentureCapital Funds under Central Bank of Lebanon Circular 331:draw downs and disbursements, general assemblies, reportingand sometimes board meetings (whenever applicable),placements and due diligence in launching stages andpresentations to the relevant committees within the Group. Thecurrent total exposure amounts to USD 22.8 million.
Under Circular 331 activities also, the team has helped severalentrepreneurs articulate their investment proposals andassisted them in pitching to local VC Funds. FIB approach insuch cases is confined to an advisory and placement role, butmay occasionally and exceptionally involve direct investmentsand board representation.
CORPORATE BANKING
Fransabank corporate lending activities achieved once againa remarkable and healthy growth in 2016. Following a provenstrategy of offering diversified and innovative corporate bankingproducts and services to its clientele, the Bank reaffirmed itspioneer role in terms of Sustainable Energy Finance (SEF), andeagerness to always go a step further and expand into newpotential markets, mobilizing its customers with the rightknowledge, expertise, assistance and tools to grow. Projectsspan not only in the Lebanese market but also expand to keymarkets across the globe including the Middle East area, GulfRegion, Africa and China.
With close cooperation with international financial institutionssuch the Agence Française de Développement (AFD), Proparco,Bpifrance, European Investment Bank (EIB), and InternationalFinance Corporation (IFC), Fransabank was able to penetrate
CORE BANKING ACTIVITIES

Management Report
new markets, and support potential businesses especiallywhen focusing on energy efficiency and renewable energy projects.
Focusing on the Bank’s ‘’Go Green’’ strategy via the executionof key and innovative initiatives, Fransabank received twoprestigious awards during the International Beirut EnergyForum 2016:
• Energy Ambassador of the Year 2016 - Lebanese Company
• Energy Awareness Award – for the category of Pioneers ofSustainability
To list selected strategic projects that marked the Bank’sinnovative and distinctive position in 2016 and which will becarried on through 2017:
• Focusing on Green projects and mainly on wind energyprojects and Photovoltaic projects. Several cooperationagreements were signed targeting different sectors such asthe education, municipalities, health, technology, electricityinfrastructure, agriculture, FMCG, real-estate andconstruction sectors.
• Heavily engaging in the development of relations withexisting and potential Lebanese businesses and clientsoperating abroad, as for:- Fransabank Beirut2Beijing 2016 project intended to
connect Lebanese companies that have the capabilitiesand the interest to expand to China, with the right Chineseimporters on one hand, and to intensify the export ofLebanese products to China on the other hand; therefore,contributing to bilateral trade benefits between the twocountries and boosting Lebanon’s economic growth.
• Supporting Lebanon’s oil & gas potential exploitationwhereby Fransabank cooperated with existing and potentialbusinesses and clients in Lebanon and in the region.
• Sustaining the Bank’s contribution to the modernization ofLebanon’s infrastructure supporting investment projects invarious fields.
These projects have enabled the Bank to effectively offerdistinguished, competitive, and diversified corporate bankingproducts and services. In order to maintain this growth andkeep up with corporate clients expectations, Fransabank willrelentlessly develop and train its human capital to continuallyget ahead of clients’ needs. Going forward, the Bank willcontinue on exploring, financing and supporting feasibleprojects, while expanding and strengthening its activity locallyand internationally.
RETAIL BANKING
Fransabank focuses on a three prongs customer-centricstrategy to achieve both short- and long-term business goals.This strategy includes initiatives aimed at deepening customerrelationship, strengthening customer retention, and improvingthe overall customer experience, which is reflected in theincreased sales volumes throughout the year.
In parallel, and to keep up with customers’ changing needs,Fransabank launched different retail projects / initiatives andpromotional campaigns, we list:
• Promoting balanced development by launching a joint projectin collaboration with Michel Issa Foundation and Vitas(microfinance institution), to shed light on the microloansprograms, and support local micro businesses in Jbeil area,particularly remote areas and villages in the region whichsuffer from displacement. Fransabank has taken it uponitself in this initiative the payment of the value of about 20loans and the payment of interest of about 30 loans.
• Conducting periodic Small and Medium Sized Enterprises(SMEs) workshops and seminars throughout Lebanon, thusproviding consultancy services to the Bank's existing andpotential customers.
• Collaborating with the Lebanese American University (LAU)for providing exceptional conditions on the educational loansthat will be granted to LAU students. In addition, the Bankactively promoted its youth product the “LEAD Account” tostudents in different universities.
• Launching of a housing loan campaign promoting an instantcash back of 1% with a maximum amount of LBP 5 million.In parallel, a housing loan protocol was signed with theBeirut Fire Regiment.
• Rewarding loyal cardholders through periodic campaigns;such as 2% to 3% cash back on Fransabank cards, doublefree talk campaign on touch cards, 30% discount on airlinetickets, among others.
• Offering, for the third year in a row, in association withMasterCard, all cardholders the chance to travel and watchlive the UEFA Champions League quarter final, semifinaland final games. Consequently, 14 winners attended theUEFA Champions League.
Fransabank positions customers at the forefront of itsbusiness. In this respect, and as part of its commitment toensure the best service experience, the mystery shoppingresearch project was re-launched in 2016, to monitor andre-assess the customer service quality as compared tothe competition. Through the exercise, an appraisal of thebranches’ service performance and adherence to setstandards was completed out of real life customer experienceswhich in turn helped identify best practices and need gaps. Theproject’s results were generally encouraging with an advancementin the global ranking of Fransabank branches as compared tothe competition.
Moreover, in a competitive market, the Bank’s strengthremains significantly in its efforts to demonstrate transparencytowards its customers by explicating in a simple and clearform their rights and duties. Therefore, in line with the CentralBank of Lebanon circular No. 134, the “Know Your Rights &Duties” initiative was maintained across all branches, in additionto an easy access to the list through the Bank’s website forfurther transparency.
FRANSABANK | ANNUAL REPORT 2016 | 46-47
Social media became one of the essential delivery channels tocommunicate with existing and potential customers. Accordingly,the Bank’s social media activities translated into a highernumber of followers on its Facebook, Twitter and Instagramaccounts. Fransabank Facebook page saw a significantincrease in its fans number with 101,212 fans at the end of2016, compared with 43,404 fans at the end of 2015. The Twitteraccount was on the move mainly during conferences andspecial events, with live tweets reporting main highlights, 610followers were registered in 2016, an increase of 41% ascompared to 2015. As for the Instagram page, followers morethan doubled, topping 1,478 followers in 2016 as compared to677 followers in 2015.
Local Geographical Expansion
Fransabank SAL local branch network maintained its leadingposition as one of largest branch network in Lebanon with 74branches spread across the country. Hence, in line with theBank’s expansion strategy, three branches were inauguratedat Bliss, Hlalyieh and Ras El Nabeh. Similarly, seven new ATMswere installed, of which three on-site machines installedat existing branch premises to optimize clients’ service namelyat Saida, Bauchrieh and Riyak branches; and four off-premisesATMs were installed, to improve clients reach, at the AmericanUniversity of Beirut, the Lawyers Syndicate in the North, Basta– Main Cross Roads of Saleh Ben Yehia, and Bint Jbeil – Rmeich.
Moreover, new premises for branches are scheduled to beinaugurated throughout the upcoming couple of years, mostforthcoming at Adlieh, Tyr (Abbassieh), Akkar (Rahbe) andBaakline. As well, around 10 off-premises ATMs are projectedto be installed at various strategic locations.
On the other hand, it is worth noting that several branches willbe relocated to new premises or to be totally renovated withthe same innovative concept applied in all new branches,which depicts an evolved image of the Bank.
Business Growth
• Clients’ deposits portfolio has shown a steady increase, witha compounded annual growth rate of 9.2% over the past fiveyears. Similarly, total clients’ deposits portfolio grew by 4.5%in 2016.
• SME loans and facilities were steadily increasing with acompounded annual growth rate of 10.3% over the past fiveyears.
• Retail loans recorded more than twofold rise, whilesustaining a compounded annual growth rate of 16.3%over the past five years. Likewise, in 2016, total retailportfolio increased by 15.3% while maintaining a mixedportfolio distributed among housing loans (62%), consumerloans (29%), car loans (6%), and other loans (3%).
• Number of payment cards maintained a steady increase of3.1% in 2016.
• Bancassurance products portfolio registered a compoundedannual growth rate of 8.2% between 2011 and 2016.Similarly, total Bancassurance portfolio progressed by 4.1%throughout 2016.
CHINA DESK
China Desk, a dedicated team established in 2013 at the Bank,aims to make Fransabank Group the preferred partner forChinese banks, companies and entities in Fransabank marketsof operations, as well as local or foreign companies or banksdealing with China. 2016 has witnessed an important event, inCairo, during which Chairman Adnan Kassar received the‘China Arab Outstanding Contribution Award’ from the ChinesePresident Xi Jinping. This award was granted in recognition ofthe outstanding role played by Chairmen, Messrs. Adnan andAdel Kassar, for over 60 years and still ongoing, to promoteand develop China-Arab relations in general and China-Lebanese relations in particular.
2016 also marked the 45th anniversary of the establishment ofdiplomatic relations between China and Lebanon, Fransabank’sChina Desk efforts focused on:
• Establishing and maintaining strategic relations withleading Chinese companies in Lebanon as their trustedbanking partner.
• Promoting Fransabank’s prime banking services to Chinesecompanies operating in the markets where Fransabankoperates.
• Developing the existing correspondent banking relations withChinese banks, as well as, establishing new relations withChinese banks and insurance companies.
• One Belt & One Road to China: Beirut2Beijing: China Desklaunched the One Belt & One Road to China: Beirut2Beijingproject. A Fransabank delegation and 14 large Lebanesecompanies traveled to Beijing to hold Beirut2Beijing. Theevent consisted of a “Lebanese Gourmet Festival” withLebanese chefs offering Lebanese cuisine at Minzu Hotel’s,a Lebanese China Corporate Conference as well as aLebanese Corporate Fair products (chocolate, dairy products,wine, olive oil, soap, nuts, sweets, etc.). Fransabank’s objectivethrough this program was to connect Lebanese companieswho have the size and the interest to go to China with theright Chinese importers and distributors in order to increaseLebanon’s exports to China and boost the economy growth.
• The One Belt & One Road in Lebanon: Beijing2Beirut waslaunched by Fransabank with the visit to Beirut of 30Chinese delegates in November 2016. The project waslaunched to celebrate the 45th anniversary of the establishmentof diplomatic relations between China and Lebanon.Celebrations started at UNESCO Palace with the launchingof the Book “Hand in Hand for 100 years: the stories ofLebanon and China”. The project included a Chinese GourmetFestival in Beirut and a Chinese-Arab Banking Dialogue atthe annual conference of Union of Arab Banks, as well as aseries of high level meetings with Lebanese officials for theChinese delegation.
• On-going efforts are undertaken to get Lebanese and Arabinstitutions to join the Silk Road Chamber of InternationalCommerce (SRCIC).

Management Report
BLC BANK SAL
Despite the political turmoil and the deteriorating macroeconomicconditions, BLC Bank was able to maintain good results at thelevel of both customers’ deposits growth and profitability.
As far as profits are concerned, net income reachedUSD 47.3 million on a consolidated basis by the end of 2016,with an increase of 7% compared to 2015.
On the balance sheet side, BLC Bank total consolidateddeposits stood at USD 4.7 billion, with an increase of 2.4%compared to 2015 noting that the growth scored by BLC Bankin the Lebanese market was at 3%, while the total consolidatedassets remained unchanged at USD 5.7 billion following theredemption of many special loans during 2016. On the otherhand, consolidated customers’ loans stood at USD 1.85 billionunchanged from 2015. Furthermore, BLC Bank’s net spreadreached 2.16% as at 31 December 2016, standing among thebest in the sector. As far as liquidity is concerned, BLCBank maintained a healthy liquidity ratio of 23% as at31 December 2016, which is above the 10% required by theregulator.
BLC Bank’s Capital Adequacy Ratio reached 16.3% comparedto a regulatory requirement of 14% as at 31 December 2016reflecting the solidity of its capital structure and strong abilityto face challenges in period of crisis.
At the level of the Bank’s Cyprus operation and despite thechallenging economic situation, USB is still witnessing acapital adequacy ratio of 14.3% which is above the requiredlevel of 8%. As far as liquidity is concerned, USB maintained ahealthy liquidity ratio in Euro and foreign currency of 30% and93% respectively, above the 20% and 70% regulatory requiredratio.
Throughout 2016, BLC Bank confirmed its status of a flagshipinstitution in the momentum for economic empowerment ofSMEs and women, maintaining its positioning among the leadersboth on the retail and the corporate levels thanks to itspersonal loans, car loans, and Cloud Banking.
As a result of its successful activities, BLC Bank was awardedthe “Best Business Transformation” award from the BankerMiddle East – CPI Financial.
Non-financial services still play an important role in the Bank’soverall strategy with road shows conducted across Lebaneseregions and conferences being organized in addition tomonthly Business Power Sessions covering a wide range oftopics.
In 2016, the “We Initiative” program dedicated to women’seconomic empowerment helped the Bank gain internationalrecognition with several awards being won such as “Best Bank inMENA Supporting Women Owned and Women Run Businessesfor 2015” by the American Chamber of Commerce and“Best Female Empowerment in Banking” from the BankerMiddle East- CPI Financial. Moreover, the Bank won the
Global Banking Alliance for Women (GBA) “Leadership” Awardduring the association’s 15th summit. BLC Bank alsobecame an international reference for best practice andcarried out study tours for other international banks as well asvolunteer mentorship programs for other GBA member banks.
This past year also witnessed BLC Bank - represented byMr. Nadim Kassar – joining as the sole representation fromMENA region the UN Women Empowerment PrinciplesLeadership Group that gathers 35 leaders from the businessand academic worlds as well as members from the civil societyaiming to promote gender equality through social initiatives,women leadership programs in the work place, the promotionof equal rights and their commitment to provide health, safetyand well-being for all employees (women and men alike).
Among the tangible actions in support of entrepreneurs (bothmale and female), BLC Bank has been recognizing theaccomplishments of entrepreneurs through the BrilliantLebanese Awards, in line with the Bank’s belief that their roleis vital to the Lebanese economy. In this regard, BLC Banksuccessfully conducted the fifth edition of the BrilliantLebanese Awards. The Business of the Year, Woman Entrepreneurof the Year and People’s Choice Award were announced ina TV event broadcasted live delivering on its promise tohonor and promote successful Lebanese entrepreneurs.
FRANSA INVEST BANK SAL (FIB)
Fransa Invest Bank, the investment arm of Fransabank, is oneof the leading investment and private banking institution inLebanon. FIB has built its reputation on being at the forefrontof providing a wide range of financial services to a diversifiedclient base including high-net-worth individuals, financialinstitutions, corporations, and governments.
FIB stays abreast of all events in the banking and financialmarkets and their potential impact on the development ofnational, regional and international economies. The Bankdraws on this know-how to provide clients with strategic adviceand develop solutions to meet their investment and financialobjectives.
The Bank’s long-term success is based on core principles ofsuperior client service, teamwork, excellence, andaccountability.
FIB’s activities include:
• Financial Advisory – mergers and acquisitions, equity capitalmarkets, private investments, corporate equity/debt advisory,re-organization and balance sheet re-structuring.
• Equity and Debt Financing – feasibility studies, legal andfinancial due diligence, corporate and project financing,syndicated financing, debt/equity structuring, equityplacements, and debt settlement arrangement.
LOCAL SUBSIDIARIES AND ASSOCIATE

FRANSABANK | ANNUAL REPORT 2016 | 48-49
• Private Banking and Asset Management – offers clients acomplete range of tailor made advice, investment productsand services.
• Capital Markets Services - available through a very wellequipped and staffed trading room, which provides fullbrokerage services to carry out transactions in equities, fixedincome, currencies, commodities, futures and options, withaccess to local, regional and international markets.
• Research - FIB provides in-house research and analysis onfinancial markets, as well as economic and country analysis,supported by international banks and asset managers uponthe request of clients.
LEBANESE LEASING COMPANY SAL (LLC)
The Lebanese Leasing Company (LLC), Fransabank Groupleasing arm maintained good results and performance in 2016.It registered an increase of 12% in terms of net profit reachingUSD 1 million, and an increase of 54% in terms of new loanssigned, leading to a net increase of 18% in total customers’lease portfolio.
LLC carried on, during 2016, with the promotion of loans foreco-friendly industries and energy saving equipment, whichwere financed through the two Sustainable Energy Finance(SEF) loan agreements, signed with the International FinanceCorporation (IFC), in May 2014 and in January 2016respectively, for a total amount of USD 10 million.
BANCASSURANCE SAL
Bancassurance, the life insurance arm of Fransabank Group,rapidly grew to become the first bank insurer and second lifeinsurer among 34 life insurance companies in Lebanon for theyear 2016.
Its main priority is to keep its clients’ needs and wants at theheart of everything it does, owing to the dedication of a highlyqualified team.
Bancassurance was able to end 2016 with outstanding resultsby reaching its financial goals and succeeded in providingsound insurance to its clients through its diversified productsportfolio. Its turnover reached USD 76.03 million with a netprofit increase of 12% reaching USD 16.51 million.
The broad spectrum of Bancassurance products varies frompure life insurance to saving and investment. It includes:
• Term life insurance products for family protection.
• Saving and life insurance plans for retirement, children’seducation and housing.
• Investment and life insurance plans with access tothe international financial markets.
• Compulsory life insurance products covering all types ofloans.
SOCIÉTÉ GÉNÉRALE FONCIÈRE SAL (SOGEFON)
Sogefon - the real estate subsidiary of Fransabank Group hada satisfactory performance in 2016 in spite of the prevailingchallenging economic situation in Lebanon. In view of that,Sogefon maintained a steady growth, reaching a profit margingreater than 10%; thus confirming its dedication and contributionto the Group achievements.
These results were made possible due to the dedication anddynamism of Sogefon team.

The year 2016 has witnessed a spillover of the social andpolitical problems, which had started earlier, bringing with it anumber of major changes in the structure of certaineconomies already suffering from a continuing lack of growth.Devaluations and budget deficits had started disrupting, in2015, various parts of the developing world. Terrorism hasimpacted several countries in the West while wars continued tobe fuelled in parts of the Middle East.
On the international scene, we have experienced the vote inthe UK to leave the European Union in what it became knownas Brexit. The real effect of such a move will however remainto be seen in as far as the extent to which this decision willaffect the relationship between the UK and the rest of Europe.The new US Administration will also definitely bring importantnew strategies, but this however still needs to be closelymonitored as we see at this very early stage of the new eraimportant changes in orientation policies.
In a rather difficult and changing business climate, Fransabankoverseas subsidiaries under the guidance and close monitoringof the parent company have performed well in 2016, most ofthem outperforming their budgets by concentrating on theircore business and tailoring new products for their businessexpansion. Our representative office in Abidjan has reinforcedthe link between the Bank and many countries in West Africaand has contributed to a large extent to widen its customerbase.
Team work was a key element to success, as each unit was incomplete harmony and close coordination with its correspondingdepartment at the parent company which has put at theirdisposal all the financial and logistical support they need inorder to achieve their goals. Also, proper synergy betweenGroup units is maintained for increasing efficiency, streamliningthe activity and increasing the volume of business.
At Fransabank, we certainly look forward to maintain thisgrowth steam in 2017 and with the performance of ourbusiness lines, we are confident that our Group subsidiarieswill continue to meet their qualitative and quantitativeobjectives for the year.
We count much on our management and staff to realize ourforecasts. Needless to say that we also derive pride andconfidence through our outstanding relationships with ourcustomers and our network of correspondents around theworld.
FRANSABANK (FRANCE) SA
Fransabank (France) is gaining more momentum in thecoordination of trade finance and other financing businesseswithin Fransabank Group particularly with its parent companyin Lebanon and Fransabank El Djazaïr in Algeria. The Bankhas also synchronized its activity with the newly establishedoffice in Ivory Coast which will help further expand its businessto other parts of West Africa.
Fransabank (France) benefits from the continuous support ofits shareholders, namely Fransabank SAL - Lebanon andBPCE International - France. In that respect, and in order tosupport growth and meet regulatory constraints, the Bank’sshareholders have doubled its equity in March 2016 to reachnearly Euro 60 million.
Fransabank (France) continued to work on widening itscustomer base and pursed its commercial strategy.
FRANSABANK EL DJAZAÏR SPA
On the social and economic level, the year 2016 was a turningpoint for Algeria: the steep decrease in world oil prices wastranslated in a slowdown in the production and export ofhydrocarbons, which has largely affected the revenues fromoil and the level of foreign exchange reserves. That said, thefinancial policies adopted over the last few years, have enabledAlgeria to master the situation and alleviate the impact whichcould have been more serious.
This situation has been a trigger of the new economic growthmodel adopted by the Government, which relies on sectors ofproduction other than hydrocarbons. However, this hasnot refrained the strong decline of public spending, which todate was the driving force of the internal economic growth.
Despite this unfavorable situation, Fransabank El Djazaïr hassucceeded in realizing a good performance in 2016, both interms of activity and results.
These achievements have been made possible thanks to areorganization of the process and a sustainable commercialeffort endorsed by the parent company, Fransabank SAL,which are customer driven with the main concern to providequality services to its clientele (large corporate clients, SMEsetc…).
Bearing in mind this working spirit, many investmentscontinue to be implemented within the scope of continuallyenlarging the branch network.
Management Report
OVERSEAS SUBSIDIARIES AND ASSOCIATE

FRANSABANK | ANNUAL REPORT 2016 | 50-51
FRANSABANK OJSC (BELARUS)
Recession has prevailed in the Republic of Belarus in 2016,whereby GDP decreased by 2.6% compared with the previousyear. To remedy to this situation, the Belarusian authoritiestook a number of measures in 2016, aiming at combattinginflation and the devaluation of the national currency. TheBelarusian Ruble was re-denominated from BYR to BYN at oneto ten thousand; NBRB’s refinancing rate was decreasedby 6 p.p. to reach 18% p.a., this led to the decrease of averagedebit interest rates compared to 2015, from 35% p.a. to 21%p.a. Average interest rates on deposits have also decreasedfrom 22% p.a. to 19% p.a. during the same period.
In this context, Fransabank OJSC is doing its utmost to managethe still difficult economic situation through maintaining itsdouble-folded strategy: a conservative and careful lendingpolicy and a reduction of expenses to the extent possible.
FRANSABANK SAL IRAQ BRANCHES
Fransabank’s Iraq branches continued to grow in 2016capitalizing on the business expansion and developmentundertaken.
Fransabank considers Iraq to be a promising market in viewof the very strong potential it reserves for the future. Itsubscribed to the capital increase in two steps as required bythe Iraqi Central Bank and began to implement its businessplan to expand the branch network locally.
Fransabank in Iraq has rapidly differentiated itself from itspeers in the local market by aligning itself with the highstandards of its parent company in Lebanon and its affiliatedentities throughout the world.
The synergy between the branches in Iraq and the variousbusiness and support lines at the parent company, as well as,the widely developed network of international correspondentsand local partners of Fransabank Group have enabled theBank to become a reference bank on the Iraqi market, and toturn into an active player in the Iraqi economy.
UNITED CAPITAL BANK (SUDAN)
Sudan has lately seen a number of positive developments froma political perspective namely with regards to fighting terrorismand money laundering. Those developments have contributedto the anticipated partial lifting of the sanctions and the returnof Sudan to the international economic scene. A series ofadditional measures are still awaited in order to reach acomprehensive normalization and the Sudanese authoritiesare doing their utmost towards reaching this goal.
The Bank is continuing to enlarge its customer base andforecasts successful years ahead.

Management Report
RISK MANAGEMENT
RISK MANAGEMENT FRAMEWORK
Fransabank values highly its reputation as a responsible andethical operator in the financial industry. Against this backcloth,the Bank has set risk management as a strategic priority,pursuing a continued improvement of its risk organisation andrisk governance practices. These would support the determinationand monitoring of the Group’s risk appetite and further accompanythe growth of business sophistication and volumes in additionto meeting a higher level of regulatory requirements.
The Bank targets to build effective and intelligent riskmanagement processes, infusing at all hierarchical levels arisk management philosophy that does not solely seek riskavoidance, but embeds risk taking as a means for valuecreation, enabling sound strategy decisions and conductingbusiness activities on a risk-informed basis.
With that end in view, the Bank has committed to invest inhuman resources and information technology systems toupgrade its risk information capabilities, providing the platformfor data collection, aggregation, analysis and communication.
In 2016 and in line with the above, risk management functionat the Bank continued to upscale its efforts towards achievinga more advanced risk management model. Among otherthings, it worked on:
• Cultivating a Bank-wide awareness of risks, promotinginteractions between the different hierarchical levels at theBank for an integrated risk management approach
• Ensuring that policies and procedures are updated andimplemented consistently across all risk categories, businesslines and legal entities. The policies and procedures wouldemphasize the qualitative, as well as, the quantitative factorswith a focus on standardizing the risk management frame-work across the Group
• Linking the risk appetite to the decision-making process,endeavoring to incorporate therein sufficiently severemacro-economic factors in the stress test criteria
• Improving the quality of risk data and risk reporting toprovide for more in-depth and dynamic discussions andhence a sound basis for management decisions.
CAPITAL MANAGEMENT
The Group manages its capital structure to continuouslyremain at adequate comfortable levels to support its riskprofile, growth plans and expansion strategy, as well as toremain well above the regulatory minimum under normal andstressed situations.
In September 2016, Banque du Liban set new minimumCapital ratios to be reached gradually by end 2018 at the threeCapital levels. Total Capital ratio should stand at 15% minimumby end 2018, up from 12% required at end 2015 and 14% at end2016, whereby the Capital Conservation Buffer was increasedto 4.5% up from the current 2.5% and the Systemic Risk CapitalCharge to 2.5% up from 1.5%.
During 2016, Banque du Liban has offered banks to discountLebanese Sovereign securities against their purchase for anequivalent amount of Sovereign securities denominated inUSD whereby the generated net gains would be essentiallydirected to offset provisions to be constituted under theInternational Financial Reporting Standard (IFRS) 9 applicableas of 01.01.2018, hence alleviating the impact of this Standardon the Banks’ profitability.
Therefrom, the residual amount was recorded as DeferredLiabilities accounted for as Tier 2 capital, after allocating a partto the Reserves for Capital Increase; all in conformity withBanque du Liban stipulations in that respect.
As at 31.12.2016, and with more than 60% of FransabankGroup regulatory capital formed of Common Equity Tier 1, theratio of CET 1 Capital to Pillar 1 Risk Weighted Assets stood at9.9% versus the 8.5% minimum regulatory and the TotalCapital ratio at 15.37% as compared to the regulatoryminimum of 14%.
The Group’s Risk Weighted Assets is for more than 88%composed of credit risk, calculated based on the StandardizedApproach.
Fransabank carries out its annual Internal Capital AdequacyAssessment Process (ICAAP) exercise on a consolidated andon standalone basis. The ICAAP is discussed with ExecutiveManagement and submitted to the Board Risk Committee andultimately to the Board of Directors.
Under the ICAAP, which is a Pillar II requirement, banks arerequired to assess the identified material risks other than thePillar 1 risks (Credit, Market and Operational), as well as futureneeds in light of the bank’s planified growth, in addition to itsfinancial position under stress test scenarios.
In addition to Pillar 1 risks, the capital charge under the ICAAPtakes into account the measurement of concentration risk perborrower and per sector, as well as the assessment, underInterest Rate Risk in the Banking Book (IRRBB), of the impactof an increase in interest rates on the Asset/Liability repricingGap. Also, a capital charge is set against the assessment ofthe quality of risk governance and process.
The ICAAP exercise also incorporates the three year budgetfor the assessment of future needs and takes into considerationthe impact of multiple stress test scenarios on the Bank'sfinancial position.
The results of the ICAAP exercise revealed a comfortable levelof the Group’s available CET 1 Capital, Tier 1 Capital and TotalCapital.
Under its Capital Management processes, Fransabank alsomonitors the Leverage Ratio, which is another supplementarynon-risk based measurement, introduced by Basel III frameworkand calculated as Capital to Total On and Off Balance SheetExposure. The Group’s Tier 1 Leverage Ratio exceeds by far theminimum level of 3% proposed by Basel III.

FRANSABANK | ANNUAL REPORT 2016 | 52-53
RISK PROFILE KEY ELEMENTS
The Group’s risk profile reflects a conservative approach,translating the Bank’s strategic objectives, business plan andrisk appetite.
Credit Risk
Fransabank adopts prudent credit standards in designing itscredit policies and procedures.
The Bank customers’ credit risk revolves around traditionallending activities to the different market segments namelycorporate, SME and retail. These would include loans andcontingent liabilities, where losses might occur due to the failureof borrowers or counterparties to meet their contractualobligations.
The Bank manages the levels of credit risk undertaken byplacing limits on the amount of risk accepted in relation to oneborrower or group of related borrowers. Country limits are alsoestablished and reviewed on regular basis.
Credit requests are processed through a uniform creditproposal that assesses the client’s quantitative and qualitativeinformation using the internal risk rating system, whereapplicable. These are therefrom subject to an independentcredit risk assessment. Credit files are submitted for approvalto ad hoc committees and eventually to the Board of Directors.
The Bank’s credit processes are supplemented by regularportfolio reviews focused on countries, regions or specificindustries to ensure portfolio diversification.
The credit risk exposure on banks contracted by Fransbankconsists mainly of short term money market deposits placedwith prime international banks and only in investment graderated countries. These placements are considered as highlyliquid assets and are thus aimed to form part of the Bank’sliquidity cushion.
Fransabank and similar to its peer banks, tolerates a substantialexposure on the Lebanese Sovereign as part of its investmentof surplus funds and given the comparative return potential.The level of exposure is contained within pre-approved limitsset in the Asset Liability Risk Management policy.
The net gains that Fransabank generated in 2016 from thediscount operations offered by Banque du Liban allowed it toconstitute full provisions against the IFRS 9 Expected CreditLosses. For that purpose, the Bank had implemented in thecourse of 2016 the necessary methodologies to calculate theIFRS 9 Expected Credit Losses for all credit risks, encompassingsovereigns, clients and banks. The Bank will be pursuing in2017 the upgrade and automation of the related processes andultimately the implementation of the risk adjusted return oncapital.
Liquidity Risk
Liquidity Risk is defined as the inability of a bank to meet itsobligations in due time and fund increases in assets, withoutincurring unacceptable losses. The fundamental role of banksin the maturity transformation of short-term deposits intolong-term loans makes banks vulnerable to liquidity risk onan institution-specific and market-wide level. Excessiveexposure to liquidity risk will negatively impact the bank’sprofitability in case the bank is obliged to resort to capitalmarkets for funding under unfavorable circumstances. It mustalso be remembered that too much liquidity will, as well, havea negative impact on profitability.
The Bank’s funding strategy is to ensure a solid funding basemainly relying on customers’ deposits. At Fransabank, theseconstitute nearly 90% of the Bank’s total liabilities. Also, 80%of customers’ deposits categorize as retail, being the moststable funding source.
Fransabank liquidity risk management policy sets severalmethods and measures to manage liquidity risk over the short,medium and long term. The Bank recognizes that a criticalelement to resilience to liquidity risk is the availability of anadequate cushion of unencumbered and highly liquid assets.Thus and among other things, the Bank has set a floor to thelevel of money market deposits denominated in foreigncurrencies it places for less than 30 days with prime internationalbanks measured to its customers’ deposits denominated inforeign currencies. These money market deposits are alsodispersed on a number of banks to further ensure the neededdiversification.
With regards to the liquidity requirements under Basel III,namely the Liquidity Coverage Ratio (LCR) and the Net StableFunding Ratio (NSFR), the Lebanese regulator has not issuedyet any directives. At Fransabank, the LCR has been adoptedas a liquidity measure based on an internally developedmethodology, while the NSFR will be introduced in the courseof 2017.
Fransabank follows and tracks the evolution of financialmarkets and assesses their inherent volatility so to detectEarly Warning Indicators that serve as warning signals forprobable liquidity shortages of both specific and systematicnature. In case of any warning signals, the Bank will decide onthe appropriate corrective measures or eventually trigger thecontingency funding plan in order to facilitate and coordinatethe decision making process during a liquidity crisis.
Market Risk
Market Risk is defined as the risk of losses arising fromadverse movements in market prices in on and off-balance-sheetpositions, encompassing interest rate sensitive instrumentsand equities in the trading book, as well as foreign exchange(FX) positions and commodity positions in the banking book.
Fransabank has a low appetite to market risk and limits areset accordingly in the Bank’s market risk management policy.

Management Report
In what concerns securities trading, the Bank holds a smallportfolio consisting mainly of Lebanese Sovereign securities;the Bank also carries FX risk that essentially arises from thetranslation effect of the positions the Bank holds as equityinvestments in some of its banking subsidiaries and that cannotbe hedged against.
Interest Rate Risk in the Banking Book (IRRBB)
IRRBB emerges from the negative re-pricing gap between ratesensitive assets and rate sensitive liabilities. The resultingmismatch between long term assets and short term liabilitiesis inherent in banking activities. Excessive IRRBB can posesignificant threat to a bank’s current capital base and/or futureearnings if not managed appropriately.
At Fransabank, the IRRBB is monitored through two measurementapproaches in order to control the impact of interest rateschanges on the Bank’s balance sheet over both the short term,as well as the long term and to confine them within the presetlimits.
The Earnings at Risk methodology is adopted for a short termhorizon of 1 year and calculates the potential decrease in thesaid year projected net interest income, resulting fromhypothetical increases in interest rates. The Economic Valueof Equity approach calculates the impact of a hypotheticalinterest rate change on a bank’s “Net Worth” as it considersthe potential longer-term impact of interest rates by measuringthe change in the present value in all of the re-pricing buckets.
Operational Risk
Operational Risk is the risk of losses from internal failuresrelating to processing, systems and people, as well as, lossesrelating to external factors such as disasters or changes inlaws and regulations.
The ultimate responsibility of Risk oversight lies with the Boardof Directors. The Board of Directors delegates specific oversightof risk management activities in the Bank to the Board RiskCommittee, which oversees operational risk arising frombusiness and support functions through regular reporting onthe operational risk profile. Senior management ensures aproper segregation of duties and separation of functionsthrough an effective internal control framework referring tothe three lines of defense approach.
The business lines own the risk and act as a first control level.Risk management designs, implements and maintains theoperational risk management framework and, together withthe compliance function, act as the second line of defense andinternal audit as the third.
Fransabank implements sound and reliable set of managementprocesses to identify, assess, control, and monitor operationalrisks, as part of the overall strengthening and continuousimprovement of the controls within the Bank.
The Bank has developed an operational loss incident reportingtool and expanded the collection of operational loss incidents.In addition, risk and control self-assessments are periodicallyconducted by the business and support units in order toevaluate the effectiveness of the internal control system andto eventually recommend corrective actions.
By its nature, operational risk is difficult to eliminate entirely.Fransabank aims to keep it at a minimum by ensuring thatbusiness units and staff identify and manage the risks inherentin the products, activities, processes and systems for whichthey are accountable.
To support this, Fransabank believes that a strong risk cultureis essential; hence, investing in ongoing training and developmentat all staff levels to increase knowledge and promote riskmanagement practices.
INFORMATION SECURITY AND BUSINESS CONTINUITY
Fransabank considers Information security to be of criticalimportance. Consequently, due diligence is applied on thesecurity framework while measures and enhancements areupdated constantly in order to protect the data with respectto its confidentiality, integrity and availability.
That is why Fransabank is currently investing in emergingsecurity technologies in the form of user-behavior analytics todetect malicious attacks, machine learning to focus on anomalousbehavior, data loss prevention controls for mobile devices, andimproved multi-factor authentication for a wide array of services.In this context, a multitude of control and monitoring systemsare now in the scrutiny pipeline, namely the security incidentand event management, the business continuity managementsystem, vulnerability management tool, auditing tool andsandboxing solution.
With respect to the current business continuity site’sreadiness, during the year 2017, the site will be covering allFransabank services even those not classified as critical. Theobjective is to better serve customers and to ensure seamlessshifting of the services from the head office to the disasterrecovery site.
Investment is also done on the security staff members wherethey are constantly encouraged to stay up-to-date in IT securityand acquire specialized certifications in the field of securityand governance, e.g. CISM, CGEIT and CRISC.

FRANSABANK | ANNUAL REPORT 2016 | 54-55
COMPLIANCE
Compliance risk management aims at encouraging, monitoringand controlling the observation of laws, regulations, internalrules - including the compliance principles outlined inFransabank’s Code of Conduct - and established good businessstandards that are relevant to the integrity and, hence, to thereputation of Fransabank. Integrity and ethics are the cornerstone in managing compliance risk and therefore the drivingforce behind everything Fransabank does. Managing integrityrisk is accordingly placed within the scope of the compliancefunction.
The compliance function of Fransabank SAL supports the entityin managing the compliance risks and embedding and improvingthe compliance arrangements in all levels and structures ofthe entity. The compliance function therefore has the followingobjectives:
• To identify, assess, control, monitor, test and report on thecompliance risks faced by Fransabank SAL.
• To assist, support and advise the Board of Directors, top andsenior management of Fransabank SAL, in fulfilling theirresponsibilities to manage compliance risks.
• Foster a compliance culture among staff and enhancingcompliance awareness throughout the organization.
• Implement the compliance program in a fashion that is inline with regulatory environment and expectations.
• Enforce compliance policies and procedures which implementapplicable laws and regulations and adopt industrystandards and best practices.
• Advise any staff member of Fransabank SAL with respect totheir personal responsibility to manage compliance risks.
The Group compliance team is headed by the Group ChiefCompliance Officer who coordinates “overall compliance”within Fransabank Group. He is the internal supervisor andresponsible for ensuring that Fransabank Group operateswithin the defined compliance framework. The Group ChiefCompliance Officer is supported by a number of designatedofficers and controlling bodies within Fransabank’s Grouporganization structures.
The scope of compliance depends on the nature, the size andthe location of business activities. It generally includes:
- Legal/Regulatory Compliance including: compliance withrules & regulations, global reporting (FATCA Act and CommonReporting Standard), and local and international sanctionsand restrictive measures (UN, US, EU and other sanctionsrequirements).
- Anti-Money Laundering and combating the Financing ofTerrorism including: customer acceptance – Know YourCustomer/Customer Due Diligence, transaction monitoring,risk-based classification of customers, and investigation andreporting.
- Capital Markets Compliance including: treatment ofconfidential information, management of conflicts of interest,prevention of insider trading and market manipulation, newproduct approval, and fair treatment of customers.
Governing Principles
AML/CFT
Fransabank Group’s AML/CFT (Anti-Money Laundering/Combatting the Financing of Terrorism) Policy primarily aimsat setting, within the Group, the essential standards forfighting money laundering operations and terrorism financing.Should the applicable AML/CFT laws and regulations of anycountry or jurisdiction require higher standards, FransabankGroup’s overseas subsidiaries and associate banks mustconform to those standards. However, in case the relevantsubsidiary or associate bank comes across any applicable lawthat is inconsistent with the Group’s policy, it must first referto the Group’s compliance department to resolve the conflict.
The AML/CFT Policy also encompasses the followingobjectives:
• Promoting a Know Your Customer (KYC) standard as acornerstone principle for Fransabank Group businessethics and practices:
- Prior to any transaction of any type, FransabankGroup’s entities gather and document the relevantcustomer identification data, along with the backgroundinformation, the purpose and the intended nature of thebusiness.
- Fransabank Group’s entities retain and document anyadditional customer information relevant to the assessmentof the money laundering risk, by adopting a risk-basedapproach which triggers the proper enhanced due diligencefor the relevant customers.
• Enforcing the following additional due diligence measureswhile establishing and maintaining correspondent relations:
- Gathering sufficient documentary evidence on a respondentinstitution, to avoid any relationships with “shell banks”;
- Enquiring about the good reputation of a respondentinstitution from public sources of information, includingwhether it has been subject to a Money Launderingor Terrorist Financing investigation or other regulatory action;
- Verifying, on a periodic basis, that the respondent institutionis implementing sufficient and effective procedures to fightMoney Laundering and Terrorist Financing.
• Monitoring and reporting suspicious transactions/activity:
- Fransabank Group’s entities apply due diligence measureswhenever they detect any unusual or suspicious transactionor activity, taking into account the legal framework of theconcerned institution.
- All suspicious transactions or activities complying with thelaws and regulations of the corresponding jurisdiction arereported.
- The Group’s compliance department is notified of allsuspicious transactions or activities when doubts arise.
• Developing an effective internal control structure where noactivity with a customer is carried out without obtaining inadvance all the required information relating to the customer.

Management Report
• Consolidating, within the Group, the AML/CFT efforts deployedby Fransabank entities.
• Conducting self-evaluation processes on the compliancewith the AML/CFT Policy and measures.
Consequently, the adoption of the AML/CFT Policy is crucial toascertain that all Fransabank Group’s entities, whatever theirgeographic location, fully comply with the enacted AMLlegislation. Thus, the Group is committed to overseeing itsAML/CFT strategies, objectives and guidelines on an ongoingbasis, and supporting an effective AML/CFT Policy within theGroup’s business.
Compliance
Fransabank Group’s Compliance governing principles are asfollows:
• Integrity, ethics and reputation, are vital assets to maintainthe healthy growth of business.
• Management is the owner of compliance to foster the adequateenterprise-wide culture.
• The compliance function is independent from business lines,yet is a shared responsibility of all employees.
• A transparent and constructive relationship between theFransabank’s Group and its’ regulators is maintained.
• Effective monitoring of compliance risks is implemented.
• Timely, accurate and systematic compliance reporting isprovided.
• The compliance function will continue to improve itself byimproving its governance, its measurement methods, itspolicies and procedures, and adopting the industry’s bestpractice in line with local and global developments.
Fransabank’s success derives from the efficiency of theworkflow, the management structure and from the commitmentof all its employees. Accordingly, Fransabank Human ResourcesManagement team is helpful for much more than supervisingthe Bank’s human capital; its control function is guided by along-term vision of building an environment where employeescan grow well and are supported to deliver sustainablebanking performance.
With a population growth of 1.9% in 2016, Fransabank SALstaff totalled 1,712 with a diverse and inclusive workforce thatresponds to all clients’ needs through various skills,knowledge and experience, allowing a broader range ofbusiness opportunities.
In 2016, gender distribution remained unchanged as comparedto the previous three years with female employees consitituitng46% of the population and male employees 54%. Likewise andas part of our continuous efforts to advance women in theworkplace, female representation in managerial positions atFransabank branches (either branch manager or deputybranch manager) comprised 46% of all employees holdingthese ranks in the year 2016, an increase of 1% as comparedto 2015. In addition, the percentage of university degreeholders increased by 3.3% to reach 69.3% of the workforce,this increase resulted from the continuous education policyimplemented by the Bank; while the average age registered is37.1 years.
Continuous education is a key driver to develop the skills andengender diverse thinking and understanding. In view of that,Fransabank seeks to build the capabilities of its employeesthrough training and development programs that wouldposition the Bank for future opportunities by offering efficientquality of services and advisory skills.
During 2016, and on the level of training achievements, theTraining and Development team (T&D) delivered 162,149training hours, an average of 94.7 training hours per employee,covering a wide range of disciplines from banking and financialtechniques, management and behavioral skills, to marketingand selling skills and information technology, as well ascomprehensive programs on the Bank’s regulatory control,risk management and compliance.
Training programs were split into 7% for External Trainings,38% for Internal Seminars and 55% for Orientation programs.Moreover, T&D focused on improving significantly the CentralBank of Lebanon Circular No 103 coverage ratio in Lebanesefinancial regulation exam. In 2016, 94 employees passed thetests (83 in branches and 11 in departments) and were certifiedto reach a cumulative number of 446 employees at year end2016.
HUMAN RESOURCES
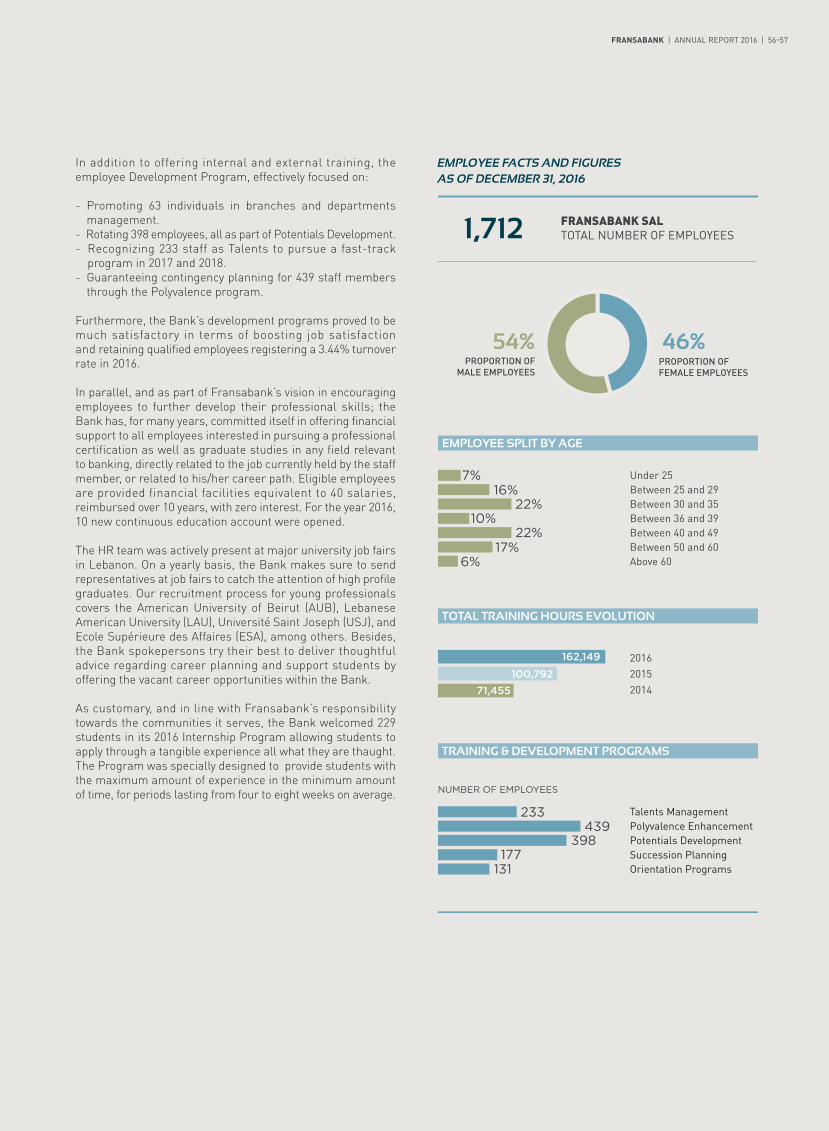
FRANSABANK | ANNUAL REPORT 2016 | 56-57
In addition to offering internal and external training, theemployee Development Program, effectively focused on:
- Promoting 63 individuals in branches and departmentsmanagement.
- Rotating 398 employees, all as part of Potentials Development.- Recognizing 233 staff as Talents to pursue a fast-track
program in 2017 and 2018. - Guaranteeing contingency planning for 439 staff members
through the Polyvalence program.
Furthermore, the Bank’s development programs proved to bemuch satisfactory in terms of boosting job satisfactionand retaining qualified employees registering a 3.44% turnoverrate in 2016.
In parallel, and as part of Fransabank’s vision in encouragingemployees to further develop their professional skills; theBank has, for many years, committed itself in offering financialsupport to all employees interested in pursuing a professionalcertification as well as graduate studies in any field relevantto banking, directly related to the job currently held by the staffmember, or related to his/her career path. Eligible employeesare provided financial facilities equivalent to 40 salaries,reimbursed over 10 years, with zero interest. For the year 2016,10 new continuous education account were opened.
The HR team was actively present at major university job fairsin Lebanon. On a yearly basis, the Bank makes sure to sendrepresentatives at job fairs to catch the attention of high profilegraduates. Our recruitment process for young professionalscovers the American University of Beirut (AUB), LebaneseAmerican University (LAU), Université Saint Joseph (USJ), andEcole Supérieure des Affaires (ESA), among others. Besides,the Bank spokepersons try their best to deliver thoughtfuladvice regarding career planning and support students byoffering the vacant career opportunities within the Bank.
As customary, and in line with Fransabank’s responsibilitytowards the communities it serves, the Bank welcomed 229students in its 2016 Internship Program allowing students toapply through a tangible experience all what they are thaught.The Program was specially designed to provide students withthe maximum amount of experience in the minimum amountof time, for periods lasting from four to eight weeks on average.
EMPLOYEE SPLIT BY AGE
TOTAL TRAINING HOURS EVOLUTION
TRAINING & DEVELOPMENT PROGRAMS
FRANSABANK SALTOTAL NUMBER OF EMPLOYEES
NUMBER OF EMPLOYEES
PROPORTION OFMALE EMPLOYEES
PROPORTION OFFEMALE EMPLOYEES
Under 25Between 25 and 29Between 30 and 35Between 36 and 39Between 40 and 49Between 50 and 60Above 60
1,712
7%16%
22%
201620152014
162,149
10%22%
Talents ManagementPolyvalence EnhancementPotentials DevelopmentSuccession PlanningOrientation Programs
233439
398177
131
17%6%
100,792
71,455
54% 46%
EMPLOYEE FACTS AND FIGURES AS OF DECEMBER 31, 2016

Management Report
INFORMATION AND COMMUNICATION TECHNOLOGY
Technology has always been the main driver of banking servicesand the foundation that empowers work and productivity ofemployees. Fransabank ICT believes that its main prioritiesshouldn’t be only focused on IT automation, integration andre-engineered operational processes that lead to optimizedcosts and increased scale; but also on transforming thecustomer facing front-end. This is achieved by pushing theboundaries to benefit from the emerging digital technologiessuch as mobile, big data analytics, and software-definedtechnology. Such technologies are fundamentally differentfrom the preceding IT-based technologies and touch thecustomers directly creating a source of digital difference thatmatters to value and revenue.
Constantly aligning its products and services, Fransabankworks on offering the best support and ability to successfullydrive business growth and development. In 2016, FransabankICT has achieved several targets through collaborative effortswith IT local and international partners. The Bank’s largeprojects portfolio and the solid foundations that were put inplace along with the large investments in the banking serviceIT applications started flourishing as follows:
Service Delivery EnhancementsWith Fransabank’s mobile-first strategy and the long list ofsupported channels including but not limited to mobile phonesand Apple Watch, the Bank always strives for a better servicedelivery to improve customers’ experience and meet theirexpectations. Accordingly, it plans to enhance its mobileapplications to improve usability and simplicity, and givescustomers a broader access to the information they need at aglance in a fast, secure, and productive manner.
Additionally, the Bank is in the process of upgrading itsCustomer Relationship Management technology to enable awider 360-degree view of the customers and improve informationorganization. This will lead to customer service improvements,automation of everyday tasks, and better analytical data andreporting.
Improved Collaboration and ProductivityAs part of ICT initiatives in developing and deploying collaborationtools and platforms to reach gradually an efficient and securedpaperless environment, Fransabank launched an Intranet Portalplatform that empowers individuals and teams to intelligentlydiscover, share, and collaborate on content from anywhere andon any device. Additionally, the Bank is working on adding acouple of other features such as digital signature/encryption,IP telephony mobility, and Skype for business…
The Bank strongly believes that the advanced intranet portalimplementation will improve collaboration and communication,further consolidate information, as well as, reduce costthrough moving towards a fully paperless environment.
Environmental Footprint ReductionFransabank constantly aims at minimizing its environmentalfootprint. Building on top the momentum of a work environmentin which the use of paper is greatly reduced, the Bank is in theprocess of introducing new technologies in line with the Bank’s“Go Green” strategy.
As such, Fransabank Group has built in 2016 a state-of-the artdata center based on the highest international standards toensure nonstop operation of its banking services at a significantenergy savings and cost. It should be noted that among the
biggest power consumers in the globe are data centers.Therefore, using cutting-edge energy efficient technology inthe data center is the right move to reduce the Bank’senvironmental impact.
On another note, Fransabank adopted a centralized printingsolution across the organization that will offer the ability tocontrol the misuse of paper and set quotas on print jobs. Thiswill allow users to adopt double-sided prints and motivate theusers to minimize the usage of paper as well as save trees.This technology will not only greatly reduce unnecessaryprints, but will provide the essential tools to pin-point the mainareas where prints are still needed so as to transform thoseprocesses to become completely paperless.
Advanced Data Center and Software Defined Data CenterStrategyThe decision to build Fransabank’s new data center was thoughton a 15-year forward strategy based on the Management’sbelief that data is the Bank’s greatest asset and that thesecurity and high availability of a bank’s data is directly relatedto its credibility. As such, it was decided to invest in a future-ready and modular data center that ensures redundancy andavailability across all levels.
Building on top of the successful implementation of a cutting-edge Tier 3 data center that is the most technologicallyadvanced in the region, Fransabank is now investing insoftware-defined technologies that will help scale, automate,and deliver IT services at a much faster rate and lower cost.Equipped with powerful capabilities like compute, storage, andnetwork virtualization along with powerful automation andorchestration tools; the Bank is looking at major operatingexpenses reductions while still meeting the ever-changingbusiness requirements. There are major benefits from suchtechnologies like reducing service deployment times from daysto minutes, eliminating hardware dependencies, addingscalability in storage and networking horizontally and vertically,and automating most of these processes. These benefits willput Fransabank on the right course towards a true InformationTechnology as a service.
New Generation of ATMsFransabank has already started a rollout to add the real-timeon-line cash and check deposit capability to its ATM network.This will push the Bank further towards achieving a 24/7secure operation; enabling customers to deposit cash inreal-time or checks at their convenience.
Online Fraud ProtectionAn ongoing project to protect unauthorized use of credit cardsonline is being implemented. 3D secure code is one of the newfeatures that will be added to the security portfolio of fraudprevention strategy. Hence, whenever customers do an onlinetransaction, the Bank will authenticate the transaction withinseconds and ensure that only the eligible person is making thepurchase.
Next Generation Core BankingIn 2017, Fransabank has successfully launched the new corebanking system based on the market leading technologies andsystems; one of the most challenging initiatives experiencedso far. It required rigorous program implementation to achievea successful and transparent launch that will guaranteesustainable business and technology transformation.

FRANSABANK | ANNUAL REPORT 2016 | 58-59
CORPORATE SOCIAL RESPONSIBILITY
Fransabank’s Corporate Social Responsibility derives from thetop management’s commitment to contribute to a sustainableeconomic development through the Bank’s core business andits employees’ dedication. In 2016, the CSR Strategy wasreviewed and restructured focusing on integrating furthercorporate social responsibility in the core business, henceoptimizing Fransabank’s positive impact on the businesscommunity, the environment and the society.
Accordingly, common grounds and straight directives forintegrating a holistic sustainability approach were necessary.Stakeholders were more closely engaged, the Bank’s employees’culture and habits are being worked upon to instill change,while specific challenges in the societies where we operateneed to be further addressed.
As part of the annual stakeholder engagement sessions andthe materiality assessment exercise, the Bank identified, in2016, strategic themes in areas where it can add value. Materialityassessment was essential in order to determine the matterswhich have the most significant economic, environmental andsocial impact on the Bank, or those matters viewed mostsignificant by its internal and external stakeholders. Therefore,an inclusive process was put into operation.
Our updated CSR strategy for the years 2016 till 2018 prioritizesthe areas where we can have the greatest impact through:
• Sustainable energy financing, which is about showcasingpositive environmental impact through our loans,
• Economic development, which is about promoting ourpositive contribution to the economy through our corporate,SME, consumer and microcredit loans,
• Youth financial education and inclusion, which is abouteducating and integrating the youth in the financial stream,
• Community support, which is about measuring our value-added contribution to the community,
• Responsible employment.
Each strategic line is developed through various tactical CSRactions; some of these actions are already being applied withinthe Bank’s operations such as; programs in youth educationand inclusion, supporting SMEs, sustainable energy financeloans or under study such as how we can better measure thesocietal impact of the initiatives.
The compilation of the 2016 Report takes full consideration ofthe ten principles of the United Nations Global Compact andput great focus on four aspects; the areas of human rights,labour, environment and anti-corruption. The 17 SustainableDevelopment Goals (SDGs), are taken into consideration whilewe have chosen to advance six goals in specific: Goal 4 – QualityEducation, Goal 5 – Gender Equality, Goal 8 – Decent Work andEconomic Growth, Goal 9 – Industry, Innovation and Infrastructure,Goal 11 – Sustainable Cities, and Goal 13 – Climate Action.
Focusing on the above six SDGs, the strategic pillars of CSRReport 2016 consist of:
1. Diligent Governance
Fransabank responsible governance is not limited to anorganizational framework that is in compliance with laws andregulations, but also operates according to high ethicalstandards, including those addressing its human capital,environmental and social challenges.
The Group Anti-Money Laundering Policy commits Fransabankto fulfil regulations governing identification, recording, andarchiving, detecting suspicious transactions and processinginternal suspicious-activity alerts, developing, updating, andimplementing internal policies, procedures, and controls; andcreating staff awareness, setting a staff reliability process, andproviding training. These policies are put into practice at thefront line of the business, and are continually monitored, aswell as, updated at least once a year.
The Bank corporate culture is not only fostered throughtop–down leadership; it also requires employees at all levelsto understand the importance of personal accountability, risk,and values of integrity. Therefore, Fransabank Code ofBusiness Conduct and Ethics is a key tool in guiding employeesto achieve highest ethical business practices. The Code helpsemployees better understand their responsibility to make theright ethical choices, deal with confidential or inside informationor conflicts of interest, promptly report actual or suspectedmisconduct and know to whom concerns should be reported.
Certainly, safeguarding customers’ information is crucial forbuilding trust and providing a secure business environment.Thus, Fransabank regularly performs safety tests on andupgrades for its data and information security systemssafeguarding a sound liability.
2. Accessible Finance
Fransabank believes that today’s economic challenges aresolvable through the implementation of new concepts,partnerships and a reinforced commitment to helping societiesproduce more inclusive economic growth.
Providing financial support and services to companies, smalland medium-sized businesses and individuals, Fransabankoffered the c/v of USD 628.02 million in total performing SMEsloans as end-2016 across Lebanon.
Likewise, Fransabank’s collaboration with Vitas microcreditprogram was sustained believing in its ability to create changein rural and remote areas through its lending activities to smallbusinesses that have growth potential but may not qualify forconventional loans. The microcredit strategy of the Bank givespreference to women owned businesses over any other lender.
In 2016, the total number of microcredit beneficiaries reached3,564 clients, compared with 3,338 clients in 2015. Fransabank’steam efforts were sustained confirming the incessant need ofthe society to access financial facilities and thus contributedto the growth of the Lebanese economy. In chorus, the outstandingamount of microcredit totaled around the c/v of USD 5.97 millionin 2016, compared with USD 5.37 million in 2015; a year-on-year increase of about 11.17%. The total number of sustained

Management Report
jobs reached 5,096 and the number of jobs created stood at460 in 2016. Measuring Fransabank’s value of disbursedmicrocredit loans since 2007 till the end of year 2016, it hascontributed with an amount exceeding the c/v of USD 34.1 mil-lion to 17,031 beneficiaries.
In parallel, Fransabank extends its support to new andestablished small and medium-sized enterprises helpingthem reach their potential. The Bank provides the necessaryexpertise through various initiatives and suitable solutions thatfit their needs. By absorbing risks, providing advice and facil-itating access to capital and financing, it helps companiesachieve their ambitions, creating financial confidence whichhelps them focus on what matters most to their businessgrowth and customers’ expectations.
Moreover, owing to the Central Bank of Lebanon Circular 331,Lebanese banks are encouraged to invest in innovative start-upsin the Lebanese knowledge economy. Accordingly, Fransabankparticipates through direct investments in ready-to-scalestart-ups. Thus, in 2016, we have taken a participation in twonew funds.
In addition, Fransabank carries out extensive researches tokeep up with its customers’ understandings, needs, expectations,opinions, values, and to identify any room for improvement. Inthis respect, a mystery shopper research project wasconducted in 2016, to monitor the Bank’s standing andre-assess the customer service quality and ranking as comparedto the competition. The project covered specific criteria as perthe branches exterior, interior, customer service officers’appearance, behaviors and interaction, in addition to a tele-banking overall evaluation. This self-assessment exerciseproved to be a necessity especially in a highly competitivemarket that increasingly relies on better services and highercustomers’ contentment.
To round up customers’ satisfaction, Fransabank has the dutyof spreading awareness among its customers that would earnthe Bank a level of trust which would not have been establishedotherwise. First, all customers have full access to informationof the terms, conditions, and details of the product or servicesold and can request ample explanations to be sure thathe/she has understood and can abide by them. Employees arerequired to assist customers in taking the convenient decisions,when acquiring one of the products, by assessing the riskassociated to it. Educating customers is key to ensure consumerprotection, and avoid future complaints. Yet, customers aregranted the possibility to raise their concerns, and inquireabout any needed clarification concerning any of the productor service. The Bank is approachable to the clients willing toget in touch or file a complaint; by several means, whetherthrough email, website, call center, or applications availableat all branches.
Nevertheless, Fransabank launched several retail productsand services targeting all segments of the society whetheryouth, business owners, or entrepreneurs, tailored to theirrespective needs.
3. Fostering a Diverse Workplace
By attracting and retaining a competent and devoted work-force, Fransabank solidifies the foundation of the Bank,fostering the principles of teamwork, and building greaterconfidence in its employees and customers. Through theHuman Resources strategy, which covers aspects frommanagerial principles, diversity and inclusion, talent development,to compensations and benefits; Fransabank strives to treat allemployees equally and with respect, and give them chances tolead successful careers.
Keen on attracting diverse backgrounds and gender equality,Fransabank workforce gender segmentation was unchangedin 2016 compared with the previous year, with an employmentshare almost equally distributed between women (46%) andmen (54%). The notion of diversity entails attracting peoplewith diverse experiences to promote further social inclusion,thus, Fransabank employees have different learningapproaches and come from different backgrounds andcultures. To help employees stand out, professional developmentprograms, tools, and courses dedicated to specific lines ofbusinesses across the Bank, are delivered annually. As such,extensive training programs were provided in 2016; a total of1,013 employees completed 162,149 hours of their trainingprograms with an average of 94.7 training hours per employee.
Moreover, corporate volunteerism was further introduced in2016 believing that employees’ voluntary engagement in theirsociety leads to greater benefits to the community and generatesbusiness value, which in return leads to improved employeemotivation and allegiance. In view of that, around 57 employeestook part in two main volunteering activities.
Of course, Fransabank employees have sustained theirindividual financial commitment to the Children Cancer Centerof Lebanon (CCCL). With the 50 new adherents, the CCCLreceived around the c/v of USD 40,605 in 2016, resulting in thecollection of USD 306,132 from 475 Fransabank’s employeesat end of year 2016.
4. Environmental Engagement
Believing that the financial sector can help limit climatechange through a financial infrastructure that supports alow-carbon economy, Fransabank provides through the corebusiness of the Bank and its “Go Green” strategy; SustainableEnergy Financing (SEF) and eco-friendly loans for businessesand individuals, taking the environment and climate changeinto consideration in its products, services and businessconduct. It also works closely with clients to help them meetinternational standards and mitigate risks ensuring that manyof its clients’ practices are best-in-class, as they shareexperiences and best practices with them.
To develop a sound ecosystem, Fransabank creates partner-ships will players in the sustainable energy field whether inLebanon or in the region, and provides its customers with themost complete and global offers. To close the loop, the Bankhas to have extensive knowledge on the different players andtheir roles and responsibilities to initiate, execute, finalize and

FRANSABANK | ANNUAL REPORT 2016 | 60-61
monitor these financed projects. From the year 2014 untilMarch 2017, the total value of SEF eligible projects reachedUSD 104.5 million; while the total projects cost was estimatedat USD 192 million. Total number of SEF projects reached 170projects.
In view of that, Fransabank Environmental and Social ManagementSystem (ESMS) – the review of clients and projects financedfor environmental and social risks – is central to its duediligence and a key pillar of its Sustainable Energy Financeprojects. In addition, the Bank tries to apply the sameconscientiousness over its operations and supply chain tolessen its direct environmental impact, and show bestpractices.
2016 marked the year of achieving results. It was during thisyear that Fransabank have built several partnerships andsigned Memorandums of Understanding to help createbusiness opportunities, develop the SEF ecosystem and createa real cultural shift.
Four Memorandums of Understanding were signed with:
• IPT petrol stations and Phoenix Energy/Indevco Group IPTGas Stations to transform the stations into green andsustainable ones.
• The Lebanese American University (LAU) aiming at launchinga cooperation between both parties to combat climatechange, create public environmental awareness, as well as,for Fransabank’s funding of LAU’s sustainable energy projects.
• The Chamber of Commerce, Industry, Agriculture of Tripoliand North Lebanon and Phoenix Energy to support thecreation of a solar farm destined to generate 5MW electricityto fulfill the needs of four areas in Tripoli.
• The E-Eco Solutions for their Green School CertificationProgram to support schools in their greening process.
It is worth mentioning that, Fransabank Sustainable EnergyFinance strategy received the highest recognition among itsCSR initiatives from Businessworthy, and as such, Fransabank,Chairman Mr. Adnan Kassar, was selected to represent SDG13 - Climate Action. Therefore, as a believer in the impact ofbusiness energy on social progress, Chairman Kassar,supported the Businessworthy Pledge by submitting histhought piece as a commitment to ethical and responsiblevalues. Sharing the commitment is a mean of endorsing theUnited Nations Sustainable Development Goals, agreed on byworld leaders in 2015 and the values we all want by 2030.
Fransabank has been attending the annual Conference ofParties for the past two years. With Sustainable EnergyFinance being at the heart of Fransabank Group’s strategy andpositioning, Fransabank was invited, in 2016, by the InternationalFinance Corporation (IFC), to participate in their panels at the22nd session of the Conference of Parties (COP22) in Marrakech,under the title “Renewables in the Middle East and NorthAfrica: Mission Possible and Green Bonds for GreenEconomies”. Fransabank’s participation was notable; and itsSEF initiative was recognized as a “replicable” success storythat IFC will recommend as best practice to its clients in theMiddle East & North Africa region.
Internally, a comprehensive green audit on FransabankHeadquarters was conducted by the IFC to evaluate the buildingenergy efficiency and come up with applicable solutions to beimplemented in a multi-phase schedule. Among the achievedrecommendations, conventional lighting has been graduallyreplaced with LED lighting, the old air conditioning chillersystem has been substituted with the VRV air conditioningsystem, while a monitoring and targeting program has beencompleted for the VRV system and the infrastructure of theHeadquarters.
In parallel, green initiatives are also targeting Fransabankemployees. When and where possible, Fransabank re-usesand recycles waste through its internal waste managementapproach. To summarize, the consumption of papers, plastics,energy, and other resources has significantly been reduced;while, recycling has been adopted when possible. Additionally,cracked electronics, redundant equipment, or furniture aredelivered to the concerned department to examine their potentialscope for re-use. Other devices not in need are donated toschools or NGOs. Similarly, excavation of waste and debris leftover during branch openings or renewal are sent to disposalareas as designated by municipalities.
5. Social Commitment
Fransabank views its community engagement as a strategicinvestment in the societies in which it operates. As such, theBank supports education projects that empower the nextgeneration, supports youth financial education and inclusionand helps remove social and economic barriers. With atotal investment of around USD 0.9 million in 2016, Fransabankshowcased a sense of unbounded citizenship for about 100benefiters.
In 2016, Fransabank helped educate Lebanese youth toultimately include the young generation in the banking systemand activities; by creating awareness among the future clientsand/or employees of the banking sector. Accordingly,Fransabank educational loans reached an outstanding valueof c/v USD 16.36 million as end of December 2016.
Acknowledging the importance of education in empowering avigorous Lebanese youth, Fransabank launched, in 2016, thesecond edition of its “UDesign” initiative, targeting, exclusively,Lebanese American University (LAU) students in Architecture,Interior Design, Graphic Design, and Fashion Design fields.This second edition aimed at providing LAU students with theopportunity to embody unique ideas, create and prototypeproduct designs catering for Fransabank clientele as proposalsfor end of year corporate gifts.
Fransabank’s youth engagement programs also supportededucation-led projects that help to raise aspirations andconfidence, develop core academic and life skills, and improveaccess to opportunities towards further education andemployment.
The Bank partnered with youth associations and organizationsas well as schools and universities for the development ofseveral initiatives among which the launching of specific products

Management Report
and the arrangement of educational tours. Among our part-ners we list; the Children Youth Finance International(CYFI), the United Nations Development Program (UNDP), theHigher Council for Childhood under the Lebanese Ministryof Social Affairs, other regional and local organiza-t ions and of course major schools and universities inLebanon. Per se, Fransabank participated in the ChildrenYouth Finance International “Global Money Week”, invitingstudents from different schools and universities to attend twocorporate days at Fransabank. Students were given a globaloverview of the banking sector, department visits were organizedalong with a real-world simulation in which students took inthe role of a teller, customer relationship officer, customers…
On the other hand, Fransabank JABAL exhibition wassustained through its 12th edition offering opportunities toenhance the community’s understanding of art on one hand,and sustain the best possible artists for the creative andcultural industries on the other hand. Yet, the 2016 editionmade a turning point; as for the first time, JABAL shed lighton the so-called “Arts Ludiques” through the organization ofan exhibition dedicated to this topic. This new generation ofartists, whose creations revolve around illustrated novels orintimate animation, talked about their experiences, memories,and daily life in Lebanon.
Fransabank was also committed to building stronger and moreinclusive communities, through investments, donations, andcorporate volunteerism, helping people with difficulties see lifefrom a different perspective. Our social capital providedassistance to organizations based on scalable and measurableimpacts and covered all society’s segments from children,youth, women, the elderly, the disabled, and families living insituations of poverty and social isolation.
CORPORATE SOCIAL RESPONSIBILITY REPORTING
This is a summary of our Corporate Social Responsibility(CSR) progress in 2016.
A comprehensive report is published separately. Itlooks at a wider range of topics with an all-embracingcontent about Fransabank CSR strategy, initiatives,facts, figures and case studies. It is issued based onthe Global Reporting Initiative (GRI) and prepared “inaccordance” with GRI G4 guidelines at a “core” level.
For additional information, please be sure to visitFransabank webpage on the following address:
http://www.fransabank.com/English/MediaCenter/Publications/Corporate%20Responsibility%20Report/Pages/CR-Reports.aspx

FRANSABANK | ANNUAL REPORT 2016 | 62-63
ENVIRONMENTAL AND SOCIAL MANAGEMENT SYSTEM (ESMS)
Following the considerable increase in environmental and socialawareness and the urgent need to preserve and improve theopportunities of development for the current and futuregenerations, sustainability is now internationally recognizedas the key concept for the growth of developing economies.
The banking sector is at the heart of the sustainabilitychallenge, with a core responsibility in finding the balancebetween continuous economic growth on one side, and socialequality and efficient environmental management on the other,through its role as the financial intermediary of all otherindustries.
Having realized the importance and urgency of this role,especially in Lebanon amidst the several environmental crisesthat emerged recently, Fransabank has decided to take itsGreen Strategy further to become a “sustainable bank”through the implementation of an Environmental and SocialManagement System (ESMS) within its core businessactivities.
The ESMS is a framework that integrates the management ofEnvironmental and Social risks into the Bank’s credit process,allowing it as such to control and reduce the environmentalimpact of the businesses that the Bank finances.
An environmental and social due diligence is conducted toevaluate the compliance of a project with internationalenvironmental best practices and applicable local laws, basedon assessment of the environmental and social managementpractices in place (waste management, efficiency of resources,labor and working conditions, pollution prevention, communityhealth safety, conservation of biodiversity in proximity of theproject premises, etc…) and on regular onsite visits.
This due diligence will allow the Bank to assign a risk categoryto each project at hand, whereby a high risk category will entailthe establishment of a corrective action plan, the implementationof which is to be followed up closely by the Bank.
This system will urge businesses to identify the practiceshindering environmental and social sustainability, and to takeaction towards reforming these practices, and embracingrenewable energy, clean production practices and soundenvironmental management, until improvement of environmentalstewardship across the country.

SEE THELIGHT SHINING
BRIGHTLYTOWARDSSUCCESS
SEE THELIGHT SHINING
BRIGHTLYTOWARDSSUCCESS
SEE THESEE THELIGHT SHINING
BRIGHTLYTOWARDSSUCCESS
SEE THELIGHT SHINING
BRIGHTLYTOWARDSSUCCESS

FRANSABANK | ANNUAL REPORT 2016 | 64-65
C O N S O L I D A T E D F I N A N C I A L
S T A T E M E N T S

INDEPENDENT AUDITORS’ REPORT
Financial Statements
TO THE SHAREHOLDERSFRANSABANK SALBEIRUT, LEBANON
OPINION
We have audited the accompanying consolidated financialstatements of Fransabank SAL, (the “Bank”) and itssubsidiaries (collectively the “Group”) which comprise theconsolidated statement of financial position as at December 31,2016, and the consolidated statement of profit or loss, consolidatedstatement of profit or loss and other comprehensive income,consolidated statement of changes in equity and the consolidatedstatement of cash flows for the year then ended, and notes tothe consolidated financial statements, including a summary ofsignificant accounting policies.
In our opinion, the accompanying consolidated financial statementspresent fairly, in all material respects, the consolidated financialposition of the Group as of December 31, 2016, and of itsconsolidated financial performance and its consolidated cashflows for the year then ended in accordance with InternationalFinancial Reporting Standards (IFRSs).
BASIS FOR OPINION
We conducted our audit in accordance with International Standardson Auditing (ISAs). Our responsibilities under those standardsare further described in the Auditors’ Responsibilities for theAudit of the Financial Statements section of our report. We areindependent of the Group in accordance with the InternationalEthics Standards Board for Accountants’ Code of Ethics forProfessional Accountants (IESBA Code) together with the Code
of Ethics of the Lebanese Association of Certified PublicAccountants that are relevant to our audit of the consolidatedfinancial statements, and we have fulfilled our other ethicalresponsibilities in accordance with these requirements. Webelieve that the audit evidence we have obtained is sufficientand appropriate to provide a basis for our opinion.
EMPHASIS OF A MATTER
Without qualifying our opinion, we draw attention to Note 9 andNote 22 of the consolidated financial statements, concerningthe balance of the regulatory restricted contribution at December31, 2016 amounting to LBP 356 billion, originating from surplusderived from sale of Lebanese Treasury bills and certificates ofdeposit issued by Central Bank of Lebanon in Lebanese poundsagainst investment in medium and long term LebaneseGovernment bonds and certificates of deposit in foreign currencyissued by the Central Bank of Lebanon, in compliance withCentral Bank of Lebanon Intermediary Circular number 446dated December 30, 2016. According to this Circular, therestricted contribution which is regulated in nature shall be
appropriated, among other things, after deducting the relevanttax liability, to collective provision for credit risks associatedwith the loan book at a minimum of 2% of the weighted Creditrisks, and that in anticipation of the implementation of IFRS 9for Impairment, as and when quantified effective on January 1,2018. By virtue of this Circular, 70% of the remaining residualsurplus once recognized over time shall be treated as non-distributable income designated and restricted only forappropriation to capital increase. In this respect, the Grouprecognized an income of LBP 22 billion reflected in theconsolidated statement of profit or loss.
KEY AUDIT MATTERS
Key audit matters are those matters that, in our professionaljudgment, were of most significance in our audit of the consolidatedfinancial statements of the current period. These matters wereaddressed in the context of our audit of the consolidated
financial statements as a whole, and in forming our opinionthereon, and we do not provide a separate opinion on thesematters.

FRANSABANK | ANNUAL REPORT 2016 | 66-67
Key audit matters
Regulatory Restricted Contribution
During November and December of 2016, the Central Bank ofLebanon issued regulations applicable to all banks operatingin Lebanon with respect to the use of the contribution derivedfrom the special and non-conventional securities arrangementdeals concluded with the regulator. This is a key audit matterin relation to the use, accounting and taxability of the benefitearned.
Impairment of loans and advances
Due to the inherently judgmental nature of the computation ofimpairment provisions for loans and advances, there is a riskthat the amount of impairment may be misstated. The impairmentof loans and advances, as disclosed in Note 8 to the consolidatedfinancial statements, is estimated by management through theapplication of judgment and the use of subjective assumptions.Due to the significance of loans and advances and relatedestimation uncertainty, this is considered a key audit risk. Thecorporate loan portfolio generally comprises larger loans thatare monitored individually by management. The assessment ofloan loss impairment is therefore based on management’sknowledge of each individual borrower. This includes theanalysis of the financial performance of the borrower, historicexperience when assessing the likelihood of incurred losses inthe portfolios and the adequacy of collateral for secure lending.However, the retail loan portfolio generally comprises muchsmaller value loans to a much greater number of customers.Therefore, provisions for other than those that are calculatedon an individual basis, are determined by grouping by productinto homogeneous portfolios.
The portfolios which give rise to the greatest uncertainty aretypically those where impairments are derived from collectivemodels, are unsecured or are subject to potential collateralshortfalls.
How our audit addressed the key audit matters?
We reviewed the accounting use of the benefit associated withthe regulated restricted contribution derived from the specialand non-conventional securities arrangement deals with theregulator, after deducting the relevant tax, in line with theconditions for the designated purpose setup by the regulator.
The risks outlined were addressed by us as follows:
We tested the key controls over the valuation of loans andadvances and related provisions. These included testing:
- System-based and manual controls over the timely recognitionof impaired loans and advances.
- Controls over the impairment calculation models includingdata inputs.
- Controls over collateral valuation estimates.
• For performing customers, we performed detailed testing ona sample of loans and advances to form our own assessmentas to whether impairment events had occurred and to assesswhether impairments had been identified in a timely manner.We challenged the completeness of loans and advancesconsidered to be non-performing and we increased the focuson loans that were not reported as being impaired in sectorsthat are currently experiencing difficult economic and marketconditions.
• For collective impairment allowances, substantially coveredby the regulatory designated deferred liability set upin anticipation of IFRS 9 as referred to under emphasis ofa matter section of our report we critically assessed theManagement estimates and assumptions, specifically inrespect to the inputs to the impairment models and theconsistency of judgement applied in the use of economicfactors, loss emergence periods and the observation periodfor historical default rates.
• For non-performing customers, we tested and challenged thevaluation model used by management where the expectedrecoverable amount from the liquidation of collateraldiscounted is compared to the net carrying value of thecustomer net exposure.

INDEPENDENT AUDITORS’ REPORT
Financial Statements
Carrying value of deferred assets
The Group’s financial position includes deferred assetsprincipally arising from historical business acquisition andcarried over losses of USB Bank PLC in Cyprus. The risk is thatthe book value of the outstanding deferred assets exceeds itsrecoverable amount, and therefore this asset is impaired andshould be written down in value. These deferred assets are off-set against future economic benefits derived from the low yieldfunding provided by the Central Bank of Lebanon and majorpart has been offset in fiscal 2016 from the yield earned oninvestments funded from the release of compulsory reserveexemption. Due to the inherent uncertainty involved in forecastingand discounting future cash flows, which are the basis of theassessment of recoverability, this is a key audit matter.
Goodwill impairment
The Group annually carries out an impairment assessment ofgoodwill using the market transaction approach. The risk isthat the book value of the goodwill exceeds its recoverableamount, and therefore the goodwill is impaired and should bewritten down in value. This is due to the limited and/orrelevance of data that may be available.
Our procedures included assessing the key assumptionsapplied by the Group in determining the recoverable amount.We also considered whether the amortization methodologyadopted best represented the profile of expected futureeconomic benefits. Moreover, during 2016, the low yield fundingprovided by the Central Bank of Lebanon matured and wasreplaced by an exemption for the compulsory reserves up toUSD 200 million. Proceeds of the loan and subsequently thecompulsory reserves are invested in fixed income securities.We assessed appropriation and calculation of these fixedincome securities against deferred assets account.
We assessed the reasonableness of the impairment testingcarried out by management especially in determining the fairvalue of each separate cash generating unit defined andcompared key input such as the multiplier used in recentacquisition transactions.
OTHER INFORMATION
Management is responsible for the other information includedin the Annual Report. The other information does not includethe consolidated financial statements and our auditor’s reportthereon. The Annual Report is expected to be made availableto us after the date of this auditor’s report.
Our opinion on the consolidated financial statements does notcover the other information and we do not express any form ofassurance conclusion thereon.
In connection with our audit of the consolidated financialstatements, our responsibility is to read the other informationwhen it becomes available and, in doing so, consider whetherthe other information is materially inconsistent with theconsolidated financial statements or our knowledge obtainedin the audit, or otherwise appears to be materially misstated.
RESPONSIBILITIES OF MANAGEMENT AND THOSE CHARGED WITH GOVERNANCE FOR THE CONSOLIDATED FINANCIAL STATEMENTS
Management is responsible for the preparation and fairpresentation of the consolidated financial statements inaccordance with IFRSs, and for such internal control asmanagement determines is necessary to enable the preparationof consolidated financial statements that are free from materialmisstatement, whether due to fraud or error.
In preparing the consolidated financial statements, managementis responsible for assessing the Group’s ability to continue as a
going concern, disclosing, as applicable, matters related togoing concern and using the going concern basis of accountingunless management either intends to liquidate the Group or tocease operations, or has no realistic alternative but to do so.
Those charged with governance are responsible for overseeingthe Group’s financial reporting process.
Key audit matters How our audit addressed the key audit matters?

FRANSABANK | ANNUAL REPORT 2016 | 68-69
DFK Fiduciaire du Moyen-Orient Deloitte & Touche
AUDITORS’ RESPONSIBILITIES FOR THE AUDIT OF THE CONSOLIDATED FINANCIAL STATEMENTS
Beirut, LebanonApril 28, 2017
Our objectives are to obtain reasonable assurance aboutwhether the consolidated financial statements as a whole arefree from material misstatement, whether due to fraud or error,and to issue an auditor’s report that includes our opinion.Reasonable assurance is a high level of assurance, but is not aguarantee that an audit conducted in accordance with ISAs,within the framework of local banking laws, will always detecta material misstatement when it exists.
Misstatements can arise from fraud or error and are consideredmaterial if, individually or in the aggregate, they couldreasonably be expected to influence the economic decisionsof users taken on the basis of these consolidated financialstatements.
As part of an audit in accordance with ISAs, we exerciseprofessional judgment and maintain professional skepticismthroughout the audit. We also:
• Identify and assess the risks of material misstatement of theconsolidated financial statements, whether due to fraud orerror, design and perform audit procedures responsive tothose risks, and obtain audit evidence that is sufficient andappropriate to provide a basis for our opinion. The risk of notdetecting a material misstatement resulting from fraud ishigher than for one resulting from error, as fraud may involvecollusion, forgery, intentional omissions, misrepresentations,or the override of internal control.
• Obtain an understanding of internal control relevant to theaudit in order to design audit procedures that are appropriatein the circumstances, but not for the purpose of expressingan opinion on the effectiveness of the Group’s internal control.
• Evaluate the appropriateness of accounting policies used andthe reasonableness of accounting estimates and relateddisclosures made by management.
• Conclude on the appropriateness of management’s use of thegoing concern basis of accounting and, based on the auditevidence obtained, whether a material uncertainty existsrelated to events or conditions that may cast significant doubton the Group’s ability to continue as a going concern. If weconclude that a material uncertainty exists, we are requiredto draw attention in our auditor’s report to the related disclosuresin the financial statements or, if such disclosures are inadequate,to modify our opinion. Our conclusions are based on the auditevidence obtained up to the date of our auditor’s report.However, future events or conditions may cause the Group tocease to continue as a going concern.
• Evaluate the overall presentation, structure and content ofthe consolidated financial statements, including thedisclosures, and whether the consolidated financial statementsrepresent the underlying transactions and events in a mannerthat achieves fair presentation.
• Obtain sufficient appropriate audit evidence regarding thefinancial information of the entities or business activitieswithin the Group to express an opinion on the consolidatedfinancial statements. We are responsible for the direction,supervision and performance of the audit. We remain solelyresponsible for our audit opinion.
We communicate with those charged with governance regarding,among other matters, the planned scope and timing of theaudit and significant audit findings, including any significantdeficiencies in internal control that we identify during our audit.
We also provide those charged with governance with astatement that we have complied with relevant ethicalrequirements regarding independence, and to communicatewith them all relationships and other matters that may reasonablybe thought to bear on our independence, and where applicable,related safeguards.
From the matters communicated with those charged withgovernance, we determine those matters that were of mostsignificance in the audit of the consolidated financial statementsof the current period and are therefore the key audit matters.We describe these matters in our auditor’s report unless lawor regulation precludes public disclosure about the matter orwhen, in extremely rare circumstances, we determine that amatter should not be communicated in our report because theadverse consequences of doing so would reasonably beexpected to outweigh the public interest benefits of suchcommunication.

CONSOLIDATED STATEMENT OF FINANCIAL POSITIONAs at December 31,
Financial Statements
6,480,713,823 1,338,400,921
70,963,5759,480,043,915
11,438,709,648 313,406,593
67,170,770200,601,020
77,443,175394,820,242
12,914,900 54,965,245
210,294,318
341,844,525 798,355,522
1,050,232,734
ASSETS
Cash and Central BanksDeposits with banks and financial institutionsLoans to banksLoans and advances to customersInvestment securitiesCustomers' liability under acceptancesInvestments in associatesAssets acquired in satisfaction of loansInvestment propertiesProperty and equipmentIntangible assetsGoodwillOther assets
TOTAL ASSETS
FINANCIAL INSTRUMENTS WITH OFF-BALANCE SHEET RISKSDocumentary and commercial letters of creditGuarantees and standby letters of creditForward contracts
Notes
56789
1011121213141516
3939
7,650,588,711 1,350,126,934
57,019,5119,849,089,736
11,197,730,794 285,272,135
72,161,135310,720,568
19,077,305412,670,344
13,326,869 54,779,898
165,757,535
31,438,321,475
472,534,919 936,246,378821,417,592
2016LBP’000 2015

FRANSABANK | ANNUAL REPORT 2016 | 70-71
Notes
LIABILITIES
EQUITY
295,311,936 48,867,277
24,533,805,856 313,406,593
1,638,304,563 31,874,580
287,476,89042,222,503
430,000,00035,000,000
492,625,00017,113,885
371,852,429163,798,343 746,945,526 254,304,555
2,511,639,738437,538,209
Deposits and borrowings from banksLiabilities designated at fair value through profit or lossCustomers' accounts at amortized costCustomers' acceptance liabilityOther borrowingsSubordinated loanOther liabilitiesProvisions
TOTAL LIABILITIES
Issued capital - Ordinary sharesIssued capital - Preference sharesShare premium - Preference sharesShareholders’ cash contribution to capitalReservesCumulative change in fair value of financial assetsBrought forward retained earningsNet profit for the year
Equity attributable to the owners of the BankNon-controlling interests
TOTAL EQUITY TOTAL LIABILITIES AND EQUITY
1718191020212223
242626252728
30
29
285,611,112 136,487,357
25,501,689,772 285,272,135
1,271,419,416 25,499,664
677,812,04247,980,970
28,231,772,468
430,000,00035,000,000
492,625,00017,113,885
468,751,514162,436,153 811,566,473 280,074,244
2,697,567,269508,981,738
3,206,549,007 31,438,321,475
2016LBP’000 2015

CONSOLIDATED STATEMENT OF PROFIT OR LOSSFor the year ended December 31,
Financial Statements
3233
3435
36
92237
8
8
5
16 (b)
13, 1438
2230
3030
Interest income Interest expenseNet interest income
Fee and commission incomeFee and commission expenseNet fee and commission income
Net interest and other gain / (loss) on financial assetsat fair value through profit or lossInterest expense on financial liabilitiesdesignated at fair value through profit or loss(Loss) / gain on derecognition of financial assets at amortized costRecognized contributionOther operating income (net)Net financial revenues
Allowance for impairment of loans and advances (net)Bad debts expenseWrite-back of discount on purchased loan portfolioAllowance for off-balance sheet risksRecovery of loans written-off (net)Allowance for deposits with a foreign central bankNet financial revenues after impairment losses
Income originated from contractual future cash flowsStaff costsAdministrative expensesDepreciation and amortizationProvisions for charges (net)
Profit before income tax
Income tax expenseDeferred tax on investees undistributed profits
NET PROFIT FOR THE YEAR
Attributable to:Owners of the BankNon-controlling interests
1,561,332,651 (1,011,251,823)550,080,828
108,100,417 (23,459,711)84,640,706
67,098,245
(1,931,890) 57,567,820
-42,912,224 800,367,933
(61,813,132)(737,415)
352,865 (188,836)
427,147 (9,045,000)729,363,562
11,995,957 (254,007,016)(118,977,713)
(30,148,911)(842,293)
337,383,586
(58,582,776)(8,023,773)
254,304,555 16,472,482270,777,037
1,632,692,336 (1,079,278,561)553,413,775
118,795,296 (22,429,616)96,365,680
73,842,360
(3,525,103) (55,382)
22,154,654 42,342,726 784,538,710
(6,236,555)(716,318)
610,503 (885,152) (295,138)
-777,016,050
- (258,267,012)(118,144,447)
(30,760,107)(3,783,196)
366,061,288
(53,978,044)(9,146,072)
302,937,172
280,074,244 22,862,928302,937,172
Notes 2016LBP’000 2015

FRANSABANK | ANNUAL REPORT 2016 | 72-73
CONSOLIDATED STATEMENT OF PROFIT OR LOSS AND OTHER COMPREHENSIVE INCOMEFor the year ended December 31,
2016LBP’000 2015
91311
270,777,037
5,950,654593,470(40,156)
(343,890)6,160,078
(48,004,694)
(41,844,616)
224,625,4774,306,944
228,932,421
Net profit for the year
Other comprehensive income:Items that will not be reclassified subsequently to profit or loss
Unrealized gain on financial assets designated at fair value through other comprehensive incomeProperty revaluation surplusShare in other comprehensive income of associatesDeferred tax
Items that may be reclassified subsequently to profit or lossCurrency translation adjustment
Total other comprehensive income
TOTAL COMPREHENSIVE INCOME FOR THE YEAR
Attributable to: Owners of the BankNon-controlling interests
Notes
302,937,172
826,191618,147
40,944(39,175)
1,446,107
(5,305,553)
(3,859,446)
299,077,726
285,852,59813,225,128299,077,726

CONSOLIDATED STATEMENT OF CHANGES IN EQUITYFor the year ended December 31,
Financial Statements
Equity Attributable to
LBP’000Preference
Shares
CapitalOrdinaryShares
Shareholders’Cash
Contribution to Capital Reserves
Share Premium on Preference
Shares
BALANCE AS AT JANUARY 1, 2015 420,000,000 34,500,000 485,587,500 17,113,885 318,349,955 8 6 2 1 2 4 2
Dividends paid (Note 31) - - - - - - - ( - ( ( (Issuance of preference shares - 10,500,000 147,787,500 - - - - - - 1 - 1Redemption of preference shares - (10,000,000) (140,750,000) - - - ( - - ( - (Effect of acquisition of additional equity interest - - - - - - ( - - ( 6 -Capital increase and reconstruction 10,000,000 - - - - - ( - - - - -Deferred liabilities - - - - - - 1 - - 1 9 2 Other movement - - - - - - ( - - ( ( (Allocation of 2014 profit - - - - 77,352,668 3 6 ( - - - -Reallocation between reserves and retained earnings - - - - (821,030) - 8 - - - - -Board of Directors’ remuneration in subsidiaries - - - - - - ( - - ( - ( Newly acquired subsidiary by the Cypriot subsidiary - - - - - - - - - - 4 4 Comprehensive income for the year 2015 - - - - (34,349,047) - ( 2 4 2 4 2
BALANCE AS AT DECEMBER 31, 2015 430,000,000 35,000,000 492,625,000 17,113,885 360,532,546 1 7 2 1 2 4 2
Dividends paid (Note 31) - - - - - - - ( - ( ( (Effect of acquisition of additional equity interest - - - - (1,310,859) - 1 - 3 ( 2 -Effect of increase of capital in subsidiary - - - - (10,912,619) - 4 - - ( 7 1 Deferred liabilities - - - - - - 1 - - 1 1 3 Other movement - - - - 949,623 - ( - 3 ( 1 9 Allocation of 2015 profit - - - - 84,043,150 2 5 ( - - - -Issuance of preference shares by a subsidiary - - - - - - - - - - 1 1 Redemption of preference shares by a subsidiary - - - - - - - - - - ( (Reallocation between reserves and retained earnings - - - - (2,000,010) - 2 - - - - -Board of Directors’ remuneration in subsidiaries - - - - - - ( - - ( - ( Derecognition of securities at FVTOCI (Note 9) - - - - - - 2 - ( - - -Comprehensive income for the year 2016 - - - - 5,214,714 - 4 2 5 2 1 2
BALANCE AS AT DECEMBER 31, 2016 430,000,000 35,000,000 492,625,000 17,113,885 436,516,545 3 8 2 1 2 5 3

FRANSABANK | ANNUAL REPORT 2016 | 74-75
the Owners of the Bank
Total Equity
CumulativeChange in
Fair Value ofFinancial Assets Total
Profit for the Year
Retained Earnings
SpecialReserve and
General Reserve onPerforming Loans
Non-ControllingInterests
4 3 4 1 3 8,249,196 693,909,410 238,681,259 159,088,218 2,375,479,423 437,120,305 2,812,599,728
- - - - - - - (92,150,783) - (92,150,783) (9,616,247) (101,767,030) - 1 1 - - - - - - 158,287,500 - 158,287,500
- ( - - - (5,276,253) - - (156,026,253) - (156,026,253) - - - - - - (65,177) - - (65,177) 65,177 -
C 1 - - - - - (10,000,000) - - - - -D - - - - - - 1,607,906 - - 1,607,906 931,395 2,539,301
- - - - - - (8,207) - - (8,207) (135,518) (143,725) - - - - 7 3,070,687 66,107,121 (146,530,476) - - - -
R - - - - ( - 821,030 - - - - -B - - - - - - (110,148) - - (110,148) - (110,148)
- - - - - - - - - - 4,866,153 4,866,153 - - - - ( - (40,156) 254,304,555 4,710,125 224,625,477 4,306,944 228,932,421
4 3 4 1 3 11,319,883 746,945,526 254,304,555 163,798,343 2,511,639,738 437,538,209 2,949,177,947
- - - - - - - (94,297,362) - (94,297,362) (5,128,398) (99,425,760) - - - - ( - 1,250,183 - 30,857 (29,819) 29,819 -
E - - - - ( - 4,699,329 - - (6,213,290) 7,942,124 1,728,834 - - - - - - 1,803,800 - - 1,803,800 1,440,497 3,244,297
- - - - 9 - (2,404,476) - 375,000 (1,079,853) 1,171,859 92,006 - - - - 8 20,915,086 55,048,957 (160,007,193) - - - -
I - - - - - - - - - - 113,062,500 113,062,500 - - - - - - - - - - (60,300,000) (60,300,000) - - - - ( - 2,000,010 - - - - -
B - - - - - - (108,543) - - (108,543) - (108,543) - - - - - - 2,290,743 - (2,290,743) - - -
C - - - - 5 - 40,944 280,074,244 522,696 285,852,598 13,225,128 299,077,726
3 4 4 32,234,969 811,566,473 280,074,244 162,436,153 2,697,567,269 508,981,738 3,206,549,007

CONSOLIDATED STATEMENT OF CASH FLOWSFor the year ended December 31,
Financial Statements
2016LBP’000 2015
Cash flows from operating activitiesProfit for the year before tax 366,061,289 337,383,586Adjustments for:Unrealized (gain) / loss on financial assets at fairvalue through profit or loss 36 (13,265,717) 1,920,339Change in fair value of investment properties 12 950,806 2,388,213Share in profits of associates 37 (15,330,578) (15,879,755)Depreciation and amortization 13, 14 30,760,107 30,148,911Net impairment allowance of loans and advances tocustomers and write-back of discount on purchased loans 8 5,626,052 61,460,267Allowance for term deposits with a foreign central bank 5 - 9,045,000Regulatory allowance / (write-back) for country risk – Deposits with banks 6 70 (5,988)Regulatory (write-back) / allowance for country risk – Loans with banks 7 (19,506) (24,324)Impairment allowance of investment in securities 9 7,030 9,989Recognized contribution 22 (22,154,654) -Income generated from contractual future cash flows 16 - (11,995,957)Loss / (gain) on disposal of property and equipment 37 79,791 (136,847)Loss on disposal of intangible assets 37 4,165 -Gain on disposal of assets acquired in satisfaction of loans 37 (1,902,300) (1,090,847)Provisions 23 9,204,739 8,088,497Interest expense 1,082,803,664 1,013,183,713Interest income (1,674,043,559) (1,610,221,048)Dividend income 36, 37 (7,038,780) (6,351,202) (238,257,381) (182,077,453)
Net decrease in loans to banks 7 13,910,376 215,393,029Net increase in loans and advances to customers 8 (434,877,437) (793,145,272)Net decrease / (increase) in investment securities 9 693,999,008 (1,162,762,270)Net decrease in other assets 16 39,886,726 101,609,271Net increase in compulsory deposits with Central Banks 5 (59,915,853) (203,244,903)Net decrease in deposits and borrowings from banks 17 (9,784,569) (252,724,042)Net increase in customers’ deposits at FVTPL 83,576,062 48,485,734Net increase in customers’ deposits at amortized cost 19 965,551,174 1,387,816,581Net decrease in other liabilities 22 (32,902,766) (59,666,911)Proceeds from disposal of foreclosed assets 3,618,979 3,892,574Settlement of provisions 23 (4,151,519) (3,260,527) 1,020,652,800 (899,684,189)
Interest paid (1,083,829,345) (1,003,025,158)Interest received 1,683,749,438 1,597,157,250Dividends received 15,392,731 14,337,650Income tax paid (53,447,510) (53,785,896)
Net Cash Provided from / (Used in) Operating Activities 1,582,518,114
Notes

FRANSABANK | ANNUAL REPORT 2016 | 76-77
2016LBP’000 2015
Cash flows from investing activities Proceeds from disposal of property and equipment 183,262 466,462 Net (increase) / decrease in placements with banks (609,743,734) 406,488,641Acquisition of property, plant and equipment 13 (45,608,515) (48,359,768)Acquisition of intangible assets 14 (4,249,469) (3,648,010)
Net Cash (Used in) / Provided from Investing Activities (659,418,456) Cash flows from financing activities Issuance of preference shares 26 - 158,287,500Redemption of preference shares - (156,026,253)Issuance of preference shares by a subsidiary 113,062,500 -Redemption of preference shares by a subsidiary (60,300,000) -Decrease in certificates of deposit - (40,702,500)Decrease in subordinated loan (6,374,916) (18,156,473)Net (decrease) / increase in other borrowings 20 (363,116,863) 235,470,732Subscription of capital by non-controlling interests 1,728,834 4,866,153Dividends paid 31 (99,425,760) (101,767,030)
Net Cash (Used in) / Provided from Financing Activities (414,426,205) 81,972,129 Net increase in cash and cash equivalents 508,673,453 91,919,111Unrealized currency translation adjustment and other 4,575,970 (13,542,308)Cash and cash equivalents beginning of year 2,934,462,727 2,856,085,924
CASH AND CASH EQUIVALENTS END OF YEAR 3,447,712,150 2,934,462,727
Notes

1. GENERAL INFORMATION
Fransabank SAL (the “Bank”) is a Lebanese joint-stockcompany registered in the Trade Register under Number25699 and in the Central Bank of Lebanon list of banks undernumber 1. The consolidated financial statements of the Bankcomprise the financial statements of the Bank and those of itssubsidiaries collectively (the “Group”). The Group is primarilyinvolved in investment, corporate and retail banking.
The Bank’s registered address is Fransabank Center, Hamra,P.O. Box 11-0393 Beirut, Lebanon.
No ultimate direct or indirect Company controls the Group. TheGroup is controlled by individual shareholders of the Kassarfamily members.
The consolidated subsidiaries consist of the following asat December 31:
During 2016, the Bank increased its share in the equity stake ofFransabank France SA and Fransabank OJSC by 19.23% and3.47% respectively through additional investment in capital.
Financial information of subsidiaries that have materialnon-controlling interests is provided under Note 29.
The Group has interest in the following associates:
Information on the Group’s associates is provided underNote 11.
Information on other related party relationships is providedunder Note 40.
2. APPLICATION OF NEW AND REVISED INTERNATIONAL FINANCIAL REPORTING STANDARDS (IFRS)
2.1 New and Revised IFRSs Applied with no MaterialEffect on the Consolidated Financial Statements
The following new and revised IFRSs, which became effectivefor annual periods beginning on or after January 1, 2016,have been adopted in these financial statements. The ap-plication of these revised IFRSs has not had any material im-pact on the amounts reported for the current and prior yearsbut may affect the accounting for future transactions orarrangements.
• IFRS 14 Regulatory Deferral Accounts• Amendments to IAS 1 Presentation of Financial Statements
relating to Disclosure initiative• Amendments to IFRS 11 Joint arrangements relating to
accounting for acquisitions of interests in joint operations• Amendments to IAS 16 Property, Plant and Equipment and
IAS 38 Intangible Assets relating to clarification of acceptablemethods of depreciation and amortization
• Amendments to IAS 16 Property, Plant and Equipment andIAS 41 Agriculture: Bearer Plants
• Amendments to IAS 27 Separate Financial Statementsrelating to accounting investments in subsidiaries, jointventures and associates to be optionally accounted for usingthe equity method in separate financial statements
• Amendments to IFRS 10 Consolidated Financial Statements,IFRS 12 Disclosure of Interests in Other Entities and IAS 28Investment in Associates and Joint Ventures relating toapplying the consolidation exception for investment entities
• Annual Improvements to IFRSs 2012 – 2014 Cycle coveringamendments to IFRS 5, IFRS 7, IAS 19 and IAS 34
2.2 New and Revised IFRS in Issue but Not YetEffective
The Group has not yet applied the following new and revisedIFRSs that have been issued but are not yet effective:
New and Revised IFRSs
• Annual Improvements to IFRS Standards 2014-2016 Cycleamending IFRS 1, IFRS 12 and IAS 28. The amendments toIFRS 1 and IAS 28 are effective for annual periods beginning on orafter January 1, 2018, the amendment to IFRS 12 for annualperiods beginning on or after January 1, 2017.
• Amendments to IAS 12 Income Taxes relating to the recognitionof deferred tax assets for unrealized losses. Effective for annualperiods beginning on or after January 1, 2017.
• Amendments to IAS 7 Statement of Cash Flows to providedisclosures that enable users of financial statementsto evaluate changes in liabilities arising from financing activities.Effective for annual periods beginning on or after January 1, 2017.
Country ofIncorporation
Ownership Interest Business
Activity2015%
2016%
Fransa Invest Bank SAL Lebanon 99.99 99.99 Specialized Bank
Fransabank (France) SA France 79.21 59.98 Banking
Lebanese Leasing Lebanon 87.49 87.49 Financial Company SAL Institution
Switch and Electronics Lebanon 99.70 99.70 Financial Services SAL Services
Sogefon SAL Lebanon 99.88 99.88 Real Estate Company
Fransabank Insurance Lebanon 99.70 99.70 InsuranceServices Co. SAL
Fransabank El Djazaïr SPA Algeria 67.99 67.99 Banking
BLC Bank SAL & its Lebanon 74.83 74.83 BankingSubsidiaries(BLC Services SAL, BLC Finance SAL,BLC Invest SAL & USB Bank PLC)
Express SARL Lebanon 98.35 98.35 Restaurant
Fransabank Syria Syria 58.18 65.98 Banking
Fransabank OJSC Belarus 91.55 88.08 Banking
The Kuwaiti LebaneseCompany for Real Estate Lebanon 100 100 Real Estate Services SAL Company
Investee
NOTES TO THE CONSOLIDATED FINANCIAL STATEMENTSFor the year ended December 31, 2016
Financial Statements
Country ofIncorporation
Interests Held BusinessActivity2015
%2016%
Bancassurance SAL Lebanon 60 60 Life InsuranceUnited Capital Bank PLC Republic 20 20 Islamic
of Sudan BankingInternational Payment Lebanon 20.30 20.30 Payment Network SAL Network
Investee

entities undertake risk management activities whenhedging financial and non-financial risk exposures.
- Derecognition: The requirements for the derecognitionof financial assets and liabilities are carried forwardfrom IAS 39.
• IFRS 15 Revenue from Contracts with Customers. Effectivefor annual periods beginning on or after January 1, 2018.
In May 2014, IFRS 15 was issued which established a singlecomprehensive model for entities to use in accounting forrevenue arising from contracts with customers. IFRS 15 willsupersede the current revenue recognition guidance includingIAS 18 Revenue, IAS 11 Construction Contracts and therelated interpretations when it becomes effective.
The core principle of IFRS 15 is that an entity should recognizerevenue to depict the transfer of promised goods or servicesto customers in an amount that reflects the consideration towhich the entity expects to be entitled in exchange for thosegoods or services. Specifically, the standard introduces a5-step approach to revenue recognition:
- Step 1: Identify the contract(s) with a customer.- Step 2: Identify the performance obligations in the contract.- Step 3: Determine the transaction price.- Step 4: Allocate the transaction price to the performanceobligations in the contract.- Step 5: Recognize revenue when (or as) the entity satisfiesa performance obligation.
Under IFRS 15, an entity recognizes when (or as) aperformance obligation is satisfied, i.e. when ‘control’ of thegoods or services underlying the particular performanceobligation is transferred to the customer. Far moreprescriptive guidance has been added in IFRS 15 to deal withspecific scenarios. Furthermore, extensive disclosures arerequired by IFRS 15.
• Amendments to IFRS 15 Revenue from Contracts withCustomers to clarify three aspects of the standard (identifyingperformance obligations, principal versus agent considerations,and licensing) and to provide some transition relief for modifiedcontracts and completed contracts. Effective for annual periodsbeginning on or after January 1, 2018.
• IFRS 16 Leases. Effective for annual periods beginning on or afterJanuary 1, 2019.
IFRS 16 specifies how an IFRS reporter will recognize,measure, present and disclose leases. The standard providesa single lessee accounting model, requiring lessees torecognize assets and liabilities for all leases unless thelease term is 12 months or less or the underlying asset has alow value. Lessors continue to classify leases as operatingor finance, with IFRS 16’s approach to lessor accountingsubstantially unchanged from its predecessor, IAS 17.
• Amendments to IFRS 10 Consolidated Financial Statementsand IAS 28 Investments in Associates and Joint Ventures(2011) relating to the treatment of the sale or contributionof assets from and investor to its associate or joint venture.Effective date deferred indefinitely.
Management anticipates that these new standards, inter-pretations and amendments will be adopted in the Group’sconsolidated financial statements as and when they are applicableand adoption of these new standards, interpretations andamendments, except for IFRS 9, IFRS 15 and IFRS 16, mayhave no material impact on the consolidated financial statementsof the Group in the period of initial application.
• IFRIC 22 Foreign Currency Transactions and AdvanceConsideration. Effective for annual periods beginning on or afterJanuary 1, 2018.
The interpretation addresses foreign currency transactionsor parts of transactions where:- there is consideration that is denominated or priced in a
foreign currency; - the entity recognizes a prepayment asset or a deferred
income liability in respect of that consideration, in advanceof the recognition of the related asset, expense or income;and
- the prepayment asset or deferred income liability is non-monetary.
• Amendments to IFRS 2 Share Based Payment regardingclassification and measurement of share based paymenttransactions. Effective for annual periods beginning on or afterJanuary 1, 2018.
• Amendments to IFRS 4 Insurance Contracts: Relating to thedifferent effective dates of IFRS 9 and the forthcoming newinsurance contracts standard. Effective for annual periodsbeginning on or after January 1, 2018.
• Amendments to IAS 40 Investment Property: Amendsparagraph 57 to state that an entity shall transfer a property to,or from, investment property when, and only when, there isevidence of a change in use. A change of use occurs if propertymeets, or ceases to meet, the definition of investment property.A change in management’s intentions for the use of a propertyby itself does not constitute evidence of a change in use. Theparagraph has been amended to state that the list of examplestherein is non-exhaustive. Effective for annual periods beginningon or after January 1, 2018.
• IFRS 9 Financial Instruments (revised versions in 2013 and2014). Effective for annual periods beginning on or after January 1,2018.
IFRS 9 issued in November 2009 introduced new requirementsfor the classification and measurement of financial assets.IFRS 9 was subsequently amended in October 2010 to includerequirements for the classification and measurementof financial liabilities and for derecognition, The Group hasearly adopted this version of the standard in 2011.
A finalized version of IFRS 9 which contains accountingrequirements for financial instruments, was issued in July2014 replacing IAS 39 Financial Instruments: Recognitionand Measurement. The final version of this standard containsrequirements in the following areas:
- Classification and measurement: Financial assets areclassified by reference to the business model within whichthey are held and their contractual cash flow characteristics.The 2014 version of IFRS 9 introduces a 'fair value throughother comprehensive income' category for certain debtinstruments. Financial liabilities are classified in a similarmanner to under IAS 39, however there are differences inthe requirements applying to the measurement of an entity'sown credit risk.
- Impairment: The 2014 version of IFRS 9 introduces an'expected credit loss' model for the measurement of theimpairment of financial assets, so it is no longer necessaryfor a credit event to have occurred before a credit loss isrecognised.
- Hedge accounting: Introduces a new hedge accountingmodel that is designed to be more closely aligned with how
FRANSABANK | ANNUAL REPORT 2016 | 78-79

Management anticipates that IFRS 15 and IFRS 9 will beadopted in the Group’s consolidated financial statements forthe annual period beginning January 1, 2018 and that IFRS 16will be adopted in the Group’s consolidated financial statementsfor the annual period beginning January 1, 2019. The applicationof IFRS 15 and IFRS 9 may have significant impact on amountsreported and disclosures made in the Group’s consolidatedfinancial statements in respect of revenue from contracts withcustomers and the Group’s financial assets and financialliabilities and the application of IFRS 16 may have significantimpact on amounts reported and disclosures made in theGroup’s consolidated financial statements in respect of itsleases.
However, it is not practicable to provide a reasonable estimateof effects of the application of these standards until the Groupperforms a detailed review.
3. BASIS OF PREPARATION
Statement of Compliance
The consolidated financial statements have been prepared inaccordance with International Financial Reporting Standards(IFRSs).
Basis of Measurement
The consolidated financial statements have been prepared on thehistorical cost basis except for the following measured at fairvalue:
- Financial instruments at fair value through profit or loss.- Investments in equities.- Other financial assets not held in a business model whose
objective is to hold assets to collect contractual cash flowsor whose contractual terms do not give rise solely topayments of principal and interest.
- Derivative financial instruments.
Assets and liabilities are grouped according to their nature andpresented in the consolidated statement of financial positionin an approximate order that reflects their relative liquidity.
Summary of Significant Accounting Policies
Following is a summary of the most significant accountingpolicies applied in the preparation of these consolidated financialstatements:
A. Basis of Consolidation:
The consolidated financial statements of Fransabank SALincorporate the financial statements of the Bank and enterprisescontrolled by the Bank (its subsidiaries) as at the reportingdate. Control is achieved when the Group is exposed, or hasrights, to variable returns from its involvement with theinvestee and has the ability to affect those returns through itspower over the investee.Specifically, the Group controls an investee if and only if theGroup has:
• Power over the investee (i.e. existing rights that give it thecurrent ability to direct the relevant activities of theinvestee);
• Exposure, or rights, to variable returns from its involvementwith the investee, and
• The ability to use its power over the investee to affectits returns.
When the Group has less than a majority of the voting orsimilar rights of an investee, the Group considers all relevantfacts and circumstances in assessing whether it has powerover an investee, including:
• The contractual arrangement with the other vote holders ofthe investee;
• Rights arising from other contractual arrangements;• The Group’s voting rights and potential voting rights.
The Group re-assesses whether or not it controls an investeeif facts and circumstances indicate that there are changes toone or more of the three elements of control.
Consolidation of a subsidiary begins when the Group obtainscontrol over the subsidiary and ceases when the Group losescontrol of the subsidiary. Income and expenses of a subsidiaryacquired or disposed of during the year are included in theconsolidated statement of comprehensive income from thedate the Group gains control until the date the Group ceasesto control the subsidiary.
Total comprehensive income of subsidiaries is attributed to theowners of the Bank and to the non-controlling interests evenif this results in the non-controlling interests having a deficitbalance.
Adjustments are made to the financial statements of thesubsidiaries to bring their accounting policies into line withthose used by the Bank.
All intra-group transactions, balances, income and expenses(except for foreign currency transaction gains or loss) areeliminated on consolidation. Unrealized losses are eliminatedin the same way as unrealized gains, but only to the extent thatthere is no evidence of impairment.
Changes in the Group's ownership interests in subsidiariesthat do not result in the Group losing control over the sub-sidiaries are accounted for as equity transactions. The carryingamounts of the Group's interests and the non-controllinginterests are adjusted to reflect the changes in their relativeinterests in the subsidiaries. Any difference between theamount by which the non-controlling interests are adjustedand the fair value of the consideration paid or received isrecognized directly in equity and attributed to owners of theBank.
Upon the loss of control, the Group derecognizes the assetsand liabilities of the subsidiary, any non-controlling interestsand the other components of equity related to the subsidiary.Any surplus or deficit arising on the loss of control is recognizedin profit or loss. If the Group retains any interest in the previoussubsidiary, then such interest is measured at fair value at thedate that control is lost.
B. Business Combinations:
Acquisitions of businesses are accounted for using the acquisitionmethod. The consideration transferred in a business combinationis measured at fair value, which is calculated as the sum of theacquisition-date fair values of the assets transferred by theGroup, liabilities incurred by the Group to the former owners of
NOTES TO THE CONSOLIDATED FINANCIAL STATEMENTSFor the year ended December 31, 2016
Financial Statements

differences on monetary items receivable from or payable to aforeign operation for which settlement is neither planned norlikely to occur in the foreseeable future, which are recognizedin other comprehensive income, and presented in the translationreserve in equity. These are recognized in profit or loss ondisposal of the net investment.
For the purposes of presenting consolidated financialstatements, the assets and liabilities of the Group's foreignoperations are translated into Lebanese Pound usingexchange rates prevailing at the end of each reporting period.Income and expense items are translated at the averageexchange rates for the period when this is a reasonableapproximation. Exchange differences arising are recognized inother comprehensive income and accumulated in equity(attributed to non-controlling interests as appropriate). Suchexchange differences are recognized in profit or loss inthe period in which the foreign operation is disposed of.
D. Recognition and Derecognition of Financial Assetsand Liabilities:
The Group initially recognizes loans and advances, deposits,debt securities issued and subordinated liabilities on the datethat they are originated. All other financial assets and liabilitiesare initially recognized on the trade date at which the Groupbecomes a party to the contractual provisions of the instrument.
Financial assets and liabilities are initially measured at fairvalue. Transaction costs that are directly attributable to theacquisition or issue of financial assets and financial liabilities(other than financial assets and financial liabilities at fair valuethrough profit or loss) are added to or deducted from the fairvalue of the financial assets or financial liabilities, as appropriate,on initial recognition. Transaction costs directly attributable tothe acquisition of financial assets or financial liabilities at fairvalue through profit or loss are recognized immediately inprofit or loss.
The Group derecognizes a financial asset only when thecontractual rights to the cash flows from the asset expire, orwhen it transfers the financial asset and substantially all therisks and rewards of ownership of the asset to another entity.If the Group neither transfers nor retains substantially all therisks and rewards of ownership and continues to control thetransferred asset, the Group recognizes its retained interest inthe asset and an associated liability for amounts it may haveto pay. If the Group retains substantially all the risks andrewards of ownership of a transferred financial asset, theGroup continues to recognize the financial asset and alsorecognizes a collateralized borrowing for the proceedsreceived.
On derecognition of a financial asset measured at amortizedcost, the difference between the asset’s carrying amount andthe sum of the consideration received and receivable is recognizedin profit or loss.
Debt securities exchanged against securities with longermaturities with similar risks, and issued by the same issuer,are not derecognized because they do not meet the conditionsfor derecognition. Premiums and discounts derived from theexchange of said securities are deferred to be amortized as ayield enhancement on a time proportionate basis, over theperiod of the extended maturities.
the acquiree and the equity interests issued by the Group inexchange for control of the acquiree. Acquisition-related costsare expensed as incurred in profit or loss.
The consideration transferred does not include amounts relatedto the settlement of pre-existing relationships. Such amountsare generally recognized in profit or loss.
Goodwill is measured as the excess of the sum of theconsideration transferred, the amount of any non-controllinginterests in the acquiree, and the fair value of the acquirer'spreviously held equity interest in the acquiree (if any) over the netof the acquisition-date amounts of the identifiable assetsacquired and the liabilities assumed. When the excess isnegative, a bargain purchase gain is recognized immediately inprofit or loss. Where applicable, adjustments are made toprovisional values of recognized assets and liabilities related tofacts and circumstances that existed at the acquisition date.These are adjusted to the provisional goodwill amount. All otheradjustments including above adjustments made after one yearare recognized in profit and loss except to correct an errorin accordance with IAS 8.
Non-controlling interests that are present ownership interestsand entitle their holders to a proportionate share of the entity'snet assets in the event of liquidation may be initially measuredeither at fair value or at the non-controlling interests'proportionate share of the recognized amounts of theacquiree's identifiable net assets. The choice of measurementbasis is made on a transaction-by-transaction basis. Non-controlling interests in business acquisitions transacted so farby the Group were initially measured at the non-controllinginterests’ proportionate share of net assets acquired.
Any contingent consideration payable is recognized at fairvalue at the acquisition date. If the contingent consideration isclassified as equity, it is not remeasured and settlement isaccounted for within equity. Otherwise, subsequent changes tothe fair value of the contingent consideration are recognized inprofit or loss.
C. Foreign Currencies:
The consolidated financial statements are presented inLebanese Pound (LBP) which is the reporting currency of theGroup. The primary currency of the economic environment inwhich the Group operates (functional currency) is the U.S. Dollar.The Lebanese Pound rate has been constant to the U.S. Dollarssince many years.
In preparing the financial statements of each individual groupentity, transactions in currencies other than the entity's reportingcurrency (foreign currencies) are recognized at the rates ofexchange prevailing at the dates of the transactions. At the endof each reporting period, monetary items denominated inforeign currencies are retranslated at the rates prevailing atthat date. Non-monetary items carried at fair value that aredenominated in foreign currencies are retranslated at the ratesprevailing at the date when the fair value was determined.Non-monetary items that are measured in terms of historicalcost in a foreign currency are not retranslated.
Exchange differences on monetary items are recognized inprofit or loss in the period in which they arise except forexchange differences on transactions entered into in order tohedge certain foreign currency risks, and except for exchange
FRANSABANK | ANNUAL REPORT 2016 | 80-81

When the Group enters into transactions whereby it transfersassets recognized on its statement of financial position andretains all risks and rewards of the transferred assets, thenthe transferred assets are not derecognized, for example,securities lending and repurchase transactions.
The Group derecognizes financial liabilities when, and onlywhen, the Group’s obligations are discharged, cancelled orthey expire. The difference between the carrying amount of thefinancial liability derecognized and the consideration paid andpayable, including any non-cash assets transferred orliabilities assumed, is recognized in profit or loss.
E. Classification of Financial Assets:
All recognized financial assets are measured in their entiretyat either amortized cost or fair value, depending on theirclassification.
Debt Instruments
Non-derivative debt instruments that meet the following twoconditions are subsequently measured at amortized cost usingthe effective interest method, less impairment loss (exceptfor debt instruments that are designated as at fair valuethrough profit or loss on initial recognition):• They are held within a business model whose objective is to
hold the financial assets in order to collect the contractualcash flows, rather than to sell the instrument prior to itscontractual maturity to realize its fair value changes, and
• The contractual terms of the financial asset give rise onspecified dates to cash flows that are solely payments ofprincipal and interest on the principal amount outstanding.
Debt instruments which do not meet both of these conditionsare measured at fair value through profit or loss (“FVTPL”).
Even if a debt instrument meets the two amortized cost criteriaabove, it may be designated as at FVTPL upon initial recognitionif such designation eliminates or significantly reduces ameasurement or recognition inconsistency that wouldotherwise arise from measuring assets or liabilities orrecognizing the gains and losses on them on different bases.
Equity Instruments
Investments in equity instruments are classified as atFVTPL, unless the Group designates an investment that is notheld for trading as at fair value through other comprehensiveincome (“FVTOCI”) on initial recognition (see below).
Financial assets at FVTPL are measured at fair value at theend of each reporting period, with any gains or losses arisingon re-measurement recognized in profit or loss.
On initial recognition, the Group can make an irrevocableelection (on an instrument-by-instrument basis) to designateinvestments in equity instruments as at fair value throughother comprehensive income (“FVTOCI”). Investments in equityinstruments at FVTOCI are measured at fair value. Gains andlosses on such equity instruments are recognized in othercomprehensive income, accumulated in equity and are neverreclassified to profit or loss. Only dividend income is recognized inprofit or loss unless the dividend clearly represents a recoveryof part of the cost of the investment, in which case it is recognizedin other comprehensive income. Cumulative gains and losses
recognized in other comprehensive income are transferred toretained earnings on disposal of an investment.
Designation at FVTOCI is not permitted if the equity investmentis held for trading.
Reclassification
Financial assets are reclassified between FVTPL and amortizedcost or vice versa, if and only if, the Group’s business modelobjective for its financial assets changes so its previous modelassessment would no longer apply. When reclassification isappropriate, it is done prospectively from the reclassificationdate.
F. Financial Liabilities and Equity Instruments:
Classification as Debt or Equity
Debt and equity instruments issued by a group entity areclassified as either financial liabilities or as equity in accordancewith the substance of the contractual arrangements and thedefinitions of a financial liability and an equity instrument.
An equity instrument is any contract that evidences a residualinterest in the assets of an entity after deducting all of itsliabilities. Equity instruments issued by the Group are recognizedat the proceeds received, net of direct issue costs.
Repurchase of the Group’s own equity instruments is recognizedand deducted directly in equity. No gain or loss is recognizedin profit or loss on the purchase, sale, issue, or cancellation ofthe Group’s own equity instruments.
The component parts of compound instruments (convertiblenotes) issued by the Group are classified separately as financialliabilities and equity in accordance with the substance of thecontractual arrangements and the definitions of a financialliability and an equity instrument. A conversion option that willbe settled by the exchange of a fixed amount of cash or anotherfinancial asset for a fixed number of the entity’s own equityinstruments is an equity instrument.
Financial Liabilities
Financial liabilities that are not held-for-trading and arenot designated as at FVTPL are subsequently measured atamortized cost using the effective interest method.
Financial liabilities are classified as at FVTPL when the financialliability is either held for trading or it is designated as atFVTPL.
A financial liability other than a financial liability held fortrading may be designated as at FVTPL upon initial recognitionif:• such designation eliminates or significantly reduces a
measurement or recognition inconsistency that wouldotherwise arise; or
• the financial liability forms part of a group of financial assetsor financial liabilities or both, which is managed and itsperformance is evaluated on a fair value basis, in accordancewith the Group’s documented risk management or investmentstrategy, and information about the grouping is providedinternally on that basis; or
• it forms part of a contract containing one or more embeddedderivatives, and the entire combined contract is designated asat FVTPL in accordance with IFRS 9.
NOTES TO THE CONSOLIDATED FINANCIAL STATEMENTSFor the year ended December 31, 2016
Financial Statements

The Group considers evidence of impairment for assets measuredat amortized cost at both specific asset and collective level.
Impairment losses on assets carried at amortized cost aremeasured as the difference between the carrying amount ofthe financial assets and the corresponding estimatedrecoverable amounts. Losses are recognized in profit or loss.If, in a subsequent period, the amount of the impairment lossdecreases, the previously recognized impairment loss isreversed through profit or loss to the extent that the carryingamount of the financial asset at the date the impairmentis reversed does not exceed what the amortized cost wouldhave been, had the impairment not been recognized.
For investments in equity securities, a significant or prolongeddecline in fair value below cost is objective evidence of impairment.
J. Derivative Financial Instruments:
Derivatives are initially recognized at fair value at the date aderivative contract is entered into and are subsequentlyremeasured to their fair value at each reporting date. Theresulting gain or loss is recognized in profit or loss immediatelyunless the derivative is designated and effective as a hedginginstrument, in which event the timing of the recognition inprofit or loss depends on the nature of the hedge relationship.
Embedded Derivatives
Derivatives embedded in other financial instruments or otherhost contracts with embedded derivatives are treated asseparate derivatives when their risks and characteristics arenot closely related to those of the host contracts and thehost contract:
• is not measured at fair value with changes in fair valuerecognized in profit or loss.
• is not an asset within the scope of IFRS 9.
Hedge Accounting
The Group designates certain hedging instruments, whichinclude derivatives, embedded derivatives and non-derivativesin respect of foreign currency risk, as either fair value hedges,cash flow hedges, or hedges of net investments in foreignoperations. Hedges of foreign exchange risk on firm commitmentsare accounted for as cash flow hedges.
At the inception of the hedge relationship, the Group documentsthe relationship between the hedging instrument and thehedged item, along with its risk management objectives andits strategy for undertaking various hedge transactions.Furthermore, at the inception of the hedge and on an ongoingbasis, the Group documents whether the hedging instrumentthat is used in a hedging relationship is highly effective in off-setting changes in fair values or cash flows of the hedged item.
Fair Value Hedge
Changes in the fair value of derivatives that are designated andqualify as fair value hedges are recognized in profit orloss immediately, together with any changes in the fair valueof the hedged item that are attributable to the hedged risk. Thechange in the fair value of the hedging instrument and thechange in the hedged item attributable to the hedged risk arerecognized in the line of the income statement of profit or lossrelating to the hedged item.
G. Offsetting:
Financial assets and financial liabilities are set-off and the netamount is presented in the statement of financial positionwhen, and only when, the Group has currently enforceablelegal right to set-off the recognized amounts or intends eitherto settle on a net basis or to realize the asset and settle theliability simultaneously.
H. Fair Value Measurement of Financial Instruments:
Fair value is the price that would be received to sell an assetor paid to transfer a liability in an orderly transaction betweenmarket participants at the measurement date.
The fair value of an asset or a liability is measured by takinginto account the characteristics of the asset or liability that ifmarket participants would take those characteristics intoaccount when pricing the asset or liability at the measurementdate.
A fair value measurement of a non-financial asset takes intoaccount a market participant's ability to generate economicbenefits by using the asset in its highest and best use or byselling it to another market participant that would use theasset in its highest and best use.
The Group uses valuation techniques that are appropriate inthe circumstances and for which sufficient data are availableto measure fair value, maximizing the use of relevant observableinputs and minimizing the use of unobservable inputs.
For financial reporting purposes, fair value measurement arecategorized into level 1, 2 or 3 based on the degree to whichthe inputs to the fair value measurements are observable andthe significance of the inputs to the fair value measurement inits entirety, which are described as follows:
• Level 1 - Quoted prices (unadjusted) in active markets foridentical assets or liabilities that the entity can access at themeasurement date;
• Level 2 - Inputs, other than quoted prices included withinLevel 1, that are observable for the asset and liability eitherdirectly or indirectly; and
• Level 3 - Inputs are unobservable inputs for the asset orliability.
I. Impairment of Financial Assets:
Financial assets carried at amortized cost are assessedfor indicators of impairment at the reporting date. Financialassets are impaired where there is objective evidence that, asa result of one or more events that occurred after the initialrecognition of the asset, a loss event has occurred which hasan impact on the estimated future cash flows of the financialasset.
Objective evidence that an impairment loss related to financialassets has been incurred can include information about thedebtors’ or issuers’ liquidity, solvency and business and financialrisk exposures and levels of and trends in delinquencies forsimilar financial assets, taking into account the fair value ofcollateral and guarantees.
FRANSABANK | ANNUAL REPORT 2016 | 82-83

Hedge accounting is discontinued when the Group revokes thehedging relationship, the hedging instrument expires or issold, terminated, or exercised, or no longer qualifies for hedgeaccounting. The adjustment to the carrying amount of thehedged item arising from the hedged risk is amortized to profitor loss from that date.
Cash Flow Hedge
The effective portion of changes in the fair value of derivativesthat are designated and qualify as cash flow hedges aredeferred in other comprehensive income. The gain or lossrelating to the ineffective portion is recognized immediately inprofit or loss.
Amounts previously recognized in other comprehensiveincome and accumulated in equity are reclassified to profit orloss in the periods when the hedged item is recognized in profitor loss, in the same line of the statement of profit or loss asthe recognized hedged item. However, when the hedged forecasttransaction results in the recognition of a non-financial assetor a non-financial liability, the gains and losses previouslyrecognized in other comprehensive income and accumulatedin equity are transferred from equity and included in the initialmeasurement of the cost of the non-financial asset or non-financial liability.
Hedge accounting is discontinued when the Group revokes thehedging relationship, when the hedging instrument expires oris sold, terminated, or exercised, or when it no longer qualifiesfor hedge accounting. Any gain or loss recognized in othercomprehensive income and accumulated in equity at that timeremains in equity and is recognized when the forecast transactionis ultimately recognized in profit or loss. When a forecasttransaction is no longer expected to occur, the gain or lossaccumulated in equity is recognized immediately in profit orloss.
K. Loans and Advances:
Loans and advances are non-derivative financial assets withfixed or determinable payments that are not quoted in an activemarket. Loans and advances are disclosed at amortized costnet of unearned interest and after provision for credit losses.Non-performing loans and advances to customers are statednet of unrealized interest and provision for credit lossesbecause of doubts and the probability of non-collection ofprincipal and/or interest.
L. Financial Guarantees:
Financial guarantees contracts are contracts that require theGroup to make specified payments to reimburse the holder fora loss it incurs because a specified debtor fails to make paymentwhen due in accordance with the terms of a debt instrument.These contracts can have various judicial forms (guarantees,letters of credit, and credit-insurance contracts).
Financial guarantee liabilities are initially measured at theirfair value, and subsequently carried at the higher of this amortizedamount and the present value of any expected payment (whena payment under the guarantee has become probable). Financialguarantees are included within other liabilities.
M. Investments in Associates:
An associate is an entity over which the Group has significantinfluence and that is neither a subsidiary nor an interest ina joint venture. Significant influence is the power to participatein the financial and operating policy decisions of the investeebut is not control or joint control over those policies.
The results and assets and liabilities of associates areincorporated in these consolidated financial statements usingthe equity method of accounting, except when the investmentis classified as held for sale, in which case it is accountedfor in accordance with IFRS 5 Non-current Assets Held for Saleand Discontinued Operations. Under the equity method, aninvestment in an associate is initially recognized in theconsolidated statement of financial position at cost andadjusted thereafter to recognize the Group’s share of the profitor loss and other comprehensive income of the associate. Whenthe Group's share of losses of an associate exceeds theGroup's interest in that associate, the Group discontinuesrecognizing its share of further losses. Additional losses arerecognized only to the extent that the Group has incurred legalor constructive obligations or made payments on behalf of theassociate.
Any excess of the cost of acquisition over the Group's share ofthe net fair value of the identifiable assets, liabilities andcontingent liabilities of an associate recognized at the date ofacquisition is recognized as goodwill, which is included withinthe carrying amount of the investment. Any excess of theGroup's share of the net fair value of the identifiable assets,liabilities and contingent liabilities over the cost of acquisition,after reassessment, is recognized immediately in profit or loss.
The entire carrying amount of the investment (includinggoodwill) is tested for impairment in accordance with IAS36 Impairment of Assets as a single asset by comparing itsrecoverable amount (higher of value in use and fair value lesscosts to sell) with its carrying amount, any impairment lossrecognized forms part of the carrying amount of theinvestment. Any reversal of that impairment loss is recognizedin accordance with IAS 36 to the extent that the recoverableamount of the investment subsequently increases.
N. Property and Equipment:
Property and equipment except for buildings acquired prior to1993 are stated at historical cost, less accumulated depreciationand impairment loss, if any.
Depreciation is recognized so as to write off the cost or valuationof property and equipment, other than land and advancepayments on capital expenditures less their residual values, ifany, using the straight-line method over the useful livesestimated as follows:
Buildings 50 Office improvements and installations 5 - 17Furniture, equipment and machines 5 - 12Computer equipment 3 - 5Vehicles 5 - 10
NOTES TO THE CONSOLIDATED FINANCIAL STATEMENTSFor the year ended December 31, 2016
Financial Statements
USEFUL LIFE - YEARS

R. Investment Properties:
Investment properties are measured initially at cost, includingtransaction costs. Subsequent to initial recognition, investmentproperties are measured at fair value, as at the balance sheetdate. Gain or losses arising from changes in the fair values ofinvestment properties are included in the statement of profitor loss. Valuations are carried out by independent qualifiedvaluers on the basis of current market values.
The Group’s Cypriot entity acquires in its normal course ofbusiness properties in satisfaction of debts. These propertiesare directly held by the Group or by special purpose entitiesfor the sole purpose of managing these properties. To reflectthe substance of transactions, these are classified as investmentproperties and are consolidated without the entities beingexplicitly disclosed as subsidiaries.
Transfers are made to or from investment property only whenthere is a change in use. For a transfer from investment propertyto stock of property, the property’s deemed cost for subsequentaccounting is its fair value at the date of change in use.
S. Impairment of Non-Financial Assets:
At the end of each reporting period, the Group reviews the carryingamounts of its non-financial, asset other than investmentproperties and deferred taxes, to determine whether there isany indication that those assets have suffered an impairmentloss. If any such indication exists, the recoverable amount ofthe asset is estimated in order to determine the extent of theimpairment loss (if any). Goodwill is tested annually for impairment.Recoverable amount is the higher of fair value less costs tosell and value in use.
If the recoverable amount of an asset is estimated to be lessthan its carrying amount, the carrying amount of the asset isreduced to its recoverable amount. An impairment loss isrecognized immediately in profit or loss, unless the relevantasset is carried at a revalued amount, in which case theimpairment loss is treated as a revaluation decrease.
Where an impairment loss subsequently reverses, the carryingamount of the asset (cash-generating unit) is increased to therevised estimate of its recoverable amount, but so that theincreased carrying amount does not exceed the carryingamount that would have been determined had no impairmentloss been recognized for the asset (cash-generating unit) inprior years. A reversal of an impairment loss is recognizedimmediately in profit or loss, unless the relevant asset is carriedat a revalued amount, in which case the reversal of the impairmentloss is treated as a revaluation increase.
An impairment loss in respect of goodwill is not reversed.
T. Deferred Assets:
Deferred assets on business acquisition and against contractualprojected cash flows are stated at amortized cost. Such deferredcharges are amortized over the period of related benefitsderiving from the net return of the invested funds fundedthrough committed structured medium term debt the purposeof which is to offset exceptional impairment losses. Amortizationcharge is treated as a yield adjustment to the interest incomeof the invested funds.
The gain or loss arising on the disposal or retirement of anitem of property and equipment is determined as the differencebetween the sales proceeds and the carrying amount of theasset and is recognized in profit or loss.
O. Intangible Assets and Goodwill:
Goodwill
Refer to Note 3B for the measurement of goodwill at initialrecognition arising on the acquisition of subsidiaries. Subsequentto initial recognition, goodwill is measured at cost lessaccumulated impairment losses.
Other Intangible Assets
Other intangible assets consisting of computer software andkey money are amortized over a period of 3 to 5 years and 6.66years respectively and are subject to impairment testing.Subsequent expenditure on software assets is capitalized onlywhen it increases the future economic benefits embodied inthe specific asset to which it relates. All other expenditure isexpensed as incurred.
P. LEASING:
Leases are classified as finance leases whenever the termsof the lease transfer substantially all the risks and rewardsof ownership to the lessee. All other leases are classifiedas operating leases.
Assets held under finance leases are initially recognized asassets of the Group at their fair value at the inception of thelease or, if lower, at the present value of the minimum leasepayments. The corresponding liability to the lessor is included inthe consolidated statement of financial position as a financelease obligation.
Operating lease payments are recognized as an expense ona straight-line basis over the lease term.
Q. Foreclosed Assets:
Policy Applicable to the Lebanese Group Entities
Real estate properties acquired through the enforcement ofcollateral over loans and advances are measured at cost lessany accumulated impairment losses. The acquisition of suchassets is regulated by the local banking authorities who requirethe liquidation of these assets within 2 years from acquisition.In case of default of liquidation the regulatory authorities requirean appropriation of a special reserve from the yearly profitsand accumulated in equity.
Policy Applicable to the Group’s Cypriot Entity
The Group in its normal course of business acquires propertiesin debt satisfaction, which are held either directly or by specialpurpose entities set up for the sole purpose of managing theseproperties with an intention to be disposed of. These propertiesare recognized in the Bank’s consolidated financial statements asstock of property, reflecting the substance of these transactions.The stock of property is measured at the lower of cost and netrealizable value. Net realizable value is the estimated sellingprice, less the estimated costs necessary to make the sale. Ifnet realizable value is below the cost of the stock of property,impairment is recognized in the consolidated statement ofprofit or loss.
FRANSABANK | ANNUAL REPORT 2016 | 84-85

U. Provision for Employees’ End-of-Service Indemnity:
Policy Applicable to the Lebanese Group Entities
The provision for staff termination indemnities is based on theliability that would arise if the employment of all the staff werevoluntary terminated at the reporting date. This provision iscalculated in accordance with the directives of the LebaneseSocial Security Fund and Labor laws based on the number ofyears of service multiplied by the monthly average of the last12 months’ remunerations and less contributions paid to theLebanese Social Security National Fund and interest accruedby the Fund.
Policy Applicable to other Jurisdictions
Obligations in respect of defined benefit pension plans iscalculated separately for each plan by estimating the amount offuture benefit that employees have earned in return for theirservice in the current and prior periods; that benefit is discountedto determine its present value, and any unrecognized past servicecosts and the fair value of any plan assets are deducted.
V. Provisions:
Provision is recognized if, as a result of a past event, the Grouphas a present legal or constructive obligation that can beestimated reliably, and it is probable that an outflow ofeconomic benefits will be required to settle the obligation.Provisions are discounted where the impact is material.
W. Deferred Restricted Contributions:
Restricted contributions derived from special and non-conventional deals arrangement with the regulator aredeferred until designated conditions for recognition are met.At the time income is received, it is deferred under “regulatorydeferred liability” and applied to the designated purposeaccording to the regulator’s requirements.
X. Revenue and Expense Recognition:
Interest income and expense are recognized on an accrualbasis, taking account of the principal outstanding and the rateapplicable, except for non-performing loans and advances forwhich interest income is only recognized upon realization.Interest income and expense include the amortization ofdiscount or premium.
Fee and commission income and expense that are integralto the effective interest rate on a financial asset or liability(e.g. commissions and fees earned on loans) are includedunder interest income and expense.
Other fee and commission income are recognized as the re-lated services are performed.
Interest income and expense presented in the statement ofprofit or loss include:- Interest on financial assets and liabilities at amortized cost.- Changes in fair value of qualifying derivatives, including
hedge ineffectiveness, and related hedged items when in-terest rate risk is the hedged risk.
Interest income on financial assets measured at fair valuethrough profit or loss are presented separately in the statementof profit or loss under “Net Interest and Other Gain / (Loss)
on financial assets at fair value through profit or loss” (See below).
Net Interest and Other Gain / (Loss) on financial assetsmeasured at fair value through profit or loss includes:- Interest income.- Dividend income.- Realized and unrealized fair value changes.- Foreign exchange differences.
Interest expense on financial liabilities designated at fairvalue through profit or loss are presented separately in thestatement of profit or loss.
Dividend income is recognized when the right to receivepayment is established. Dividends on equity instrumentsdesignated as at fair value through other comprehensiveincome in accordance with IFRS 9, are recognized in profitor loss, unless the dividend clearly represents a recoveryof part of the investment, in which case it is presented inother comprehensive income.
Y. Income Tax:
Income tax expense represents the sum of the tax currentlypayable and deferred tax. Income tax is recognized in theconsolidated statement of profit or loss except to the extentthat it relates to items recognized directly in other comprehensiveincome, in which case it is recognized in other comprehensiveincome.
The tax currently payable is based on taxable profit for the year.Taxable profit differs from profit as reported in the consolidatedstatement of profit or loss because of the items that are nevertaxable or deductible. The Group’s liability for current tax iscalculated using tax rates that have been enacted or substantivelyenacted by the end of the reporting period.
Part of debt securities invested in by the Group is subject towithheld tax by the issuer. This tax is deducted at year-endfrom the corporate tax liability not eligible for deferred tax benefit,and therefore, accounted for as prepayment on corporateincome tax and reflected as a part of income tax provision.
Deferred tax is recognized on differences between the carryingamounts of assets and liabilities in the consolidated statementof financial position and the corresponding tax base used inthe computation of taxable profit, and are accounted for usingthe balance sheet liability method. Deferred tax liabilities aregenerally recognized for all taxable temporary differences anddeferred tax assets are recognized to the extent that it is probablethat taxable profits will be available against which deductibletemporary differences can be utilized.
Z. Fiduciary Accounts:
Fiduciary assets are held or invested on behalf of the Group’scustomers on a discretionary basis, non-discretionary basis,or both. The related risks and rewards belong to the accountholders and accordingly, these accounts are reflected asoff-balance sheet accounts.
AA. Cash and Cash Equivalents:
Cash and cash equivalents comprise balances with maturitiesof a period of three months including: cash and balances with thecentral banks and deposits with banks and financial institutions.
NOTES TO THE CONSOLIDATED FINANCIAL STATEMENTSFor the year ended December 31, 2016
Financial Statements

Characteristics of the Financial Asset
Once the Group determines that its business model is to holdthe assets to collect the contractual cash flows, it exercisesjudgment to assess the contractual cash flows characteristicsof a financial asset. In making this judgment, the Groupconsiders the contractual terms of the acquired asset todetermine that they give rise on specific dates, to cash flowsthat solely represent principal and principal settlement andaccordingly may qualify for amortized cost accounting.
Features considered by the Group that would be consistentwith amortized cost measurement include:
• Fixed and / or floating interest rate;• Caps, floors, collars;• Prepayment options.
Features considered by the Group that would be inconsistentwith amortized cost measurement include:
• Leverage (i.e. options, forwards and swaps);• Conversion options; • Inverse floaters;• Variable rate coupons that reset periodically;• Triggers that result in a significant reduction of principal,
interest or both.
B. Key Sources of Estimation Uncertainty:
The following are the key assumptions concerning the future,and other key sources of estimation uncertainty at the reportingdate, that have a significant risk of causing a material adjustmentto the carrying amounts of assets and liabilities within the nextfinancial year.
The Group based their assumptions and estimates on parametersavailable when the consolidated financial statements wereprepared. Existing circumstances and assumptions aboutfuture developments, however, may change due to marketchanges or circumstances arising beyond the control of theGroup. Such changes are reflected in the assumptions whenthey occur.
Allowances for Credit Losses
Specific impairment for credit losses is determined by assessingeach case individually. This method applies to classified loansand advances and the factors taken into consideration whenestimating the allowance for credit losses include the counter-party’s credit limit, the counterparty’s ability to generate cashflows sufficient to settle his advances and the value of collateraland potential repossession.
Loans and advances that have been assessed individually andfound not to be impaired and all individually insignificant loansand advances are then assessed collectively, in groups of assetswith similar risk characteristics, to determine whether provisionshould be made due to incurred loss events for which there isobjective evidence but whose effects are not yet evident.
The collective assessment takes account of data from the loanportfolio (such as credit quality, levels of arrears, credit utilization,loan to collateral ratios, etc…), concentrations of risks, economicdata and the performance of different individual groups.
4. CRITICAL ACCOUNTING JUDGMENTS ANDKEY SOURCES OF ESTIMATION UNCERTAINTY
In the application of the Group’s accounting policies, which aredescribed in Note 3, the directors are required to makejudgments, estimates and assumptions about the carryingamounts of assets and liabilities that are not readily apparentfrom other sources. The estimates and associated assumptionsare based on historical experience and other factors that areconsidered to be relevant. Actual results may differ from theseestimates.
The estimates and underlying assumptions are reviewed on anongoing basis. Revisions to accounting estimates are recognizedin the period in which the estimate is revised or in the futureperiods if the revision affects both current and future periods.
A. Critical Accounting Judgments in Applying the Group’s Accounting Policies:
In the process of applying the Group’s accounting policies,management has made the following judgments, apart fromthose involving estimations, which have the most significanteffect in the amounts recognized in the financial statements.
Going Concern
The Group’s management has made an assessment of theGroup’s ability to continue as a going concern and is satisfiedthat the Group has the resources to continue in business forthe foreseeable future. Furthermore, management is notaware of any material uncertainties that may cast significantdoubt upon the Group’s ability to continue as a going concern.Therefore the consolidated financial statements continue to beprepared on the going concern basis.
Classification of Financial Assets
Business Model
The business model test requires the Group to assess whetherits business objective for financial assets is to collect thecontractual cash flows of the assets rather than realize theirfair value change from sale before their contractual maturity.The Group considers at which level of its business activitiessuch assessment should be made. Generally, a businessmodel can be evidenced by the way business is managed andthe information provided to management. However the Group’sbusiness model can be to hold financial assets to collectcontractual cash flows even when there are some sales offinancial assets. While IFRS 9 provides some situations wheresuch sales may or may not be consistent with the objective ofholding assets to collect contractual cash flows, the assessmentrequires the use of judgment based on facts and circumstances.
In determining whether its business model for managingfinancial assets is to hold assets in order to collect contractualcash flows the Group considers:
• The frequency and volume of sales;• The reasons for any sales;• How management evaluates the performance of the portfolio;• The objectives for the portfolio.
FRANSABANK | ANNUAL REPORT 2016 | 86-87

5. CASH AND CENTRAL BANKS
Cash on hand Current accounts with Central Bank of Lebanon Current accounts with other Central BanksTerm placements with Central Bank of LebanonTerm placements with other Central BanksBlocked accounts with Central Bank of Lebanonunder Intermediate Circular 313Blocked accounts with Central Bank of LebanonAccrued interest receivableRegulatory allowance for country risk TOTAL
of whichCompulsory/RegulatoryDeposits
Balance
-630,890,175
29,153,7691,854,217,678
-
----
230,236,685 686,306,260 172,348,944
5,108,544,983138,774,842
70,563,203 25,000
82,958,906 (9,045,000)
222,382,941 864,674,974 139,491,774
6,177,769,61792,582,141
81,585,869-
81,146,395(9,045,000)
7,650,588,711
-694,940,913
43,192,7311,583,627,589
-
----
2,321,761,233
of whichCompulsory/RegulatoryDeposits
Balance
Compulsory deposits under current accounts with CentralBank of Lebanon are in Lebanese Pounds and non-interestearning. These deposits are computed on the basis of 25% and15% of the average weekly sight and term customers’ depositsin Lebanese Pounds subject to certain exemptions, in accordancewith the local banking regulations. These deposits are notavailable for use in the Group’s day to day operations.
Regulatory deposits under term placements with Central Bankof Lebanon are in foreign currencies and made in accordancewith local banking regulations which require banks to maintaininterest earning placements in foreign currency to the extentof 15% of customers’ deposits in foreign currencies, certificatesof deposit and borrowings acquired from non-resident financialinstitutions.
Blocked accounts with the Central Bank of Lebanon underIntermediary Circular No. 313 represent transitory deposits to
be granted to the Bank’s customers, pursuant to certainconditions, rules and mechanism following Central Bank ofLebanon Basic Decision No. 6116 of March 7, 1996 and itsamendments against facilities granted from the Central Bankof Lebanon (Note 20).
During 2016, the Group was exempted from compulsoryreserves in foreign currency, for one year, up to USD 200 million.Subsequent to the financial position date, the exemption wasrenewed for an additional one and a half year to offset the re-maining outstanding deferred assets (Refer to Notes 9 and 16).
During the year 2015, the Group provided for deposits held withthe Central Bank of Iraq-Kurdistan in the aggregate amountof LBP 9.04 billion (USD 6 million) under provision allowancein the consolidated statement of profit or loss.
December 31, 2016LBP’000 December 31, 2015
NOTES TO THE CONSOLIDATED FINANCIAL STATEMENTSFor the year ended December 31, 2016
Financial Statements
Determining Fair Values
When the fair values of financial instruments recorded in thestatement of financial position cannot be measured based onquoted prices in active markets, their fair value is measuredusing valuation techniques including the Discounted CashFlow (DCF) model, as described in Note 45.
The inputs in these models are taken from observable marketswhere possible. Where practical, the discount rate used in themark-to-model approach included observable data collectedfrom market participants, including risk free interest rates andcredit default swap rates for pricing of credit risk (both ownand counter party), and a liquidity risk factor which is added tothe applied discount rate. Changes in assumptions about anyof these factors could affect the reported fair value of the sovereignbonds including Central Bank certificates of deposit.
Unobservable inputs are used to measure fair value to the extentthat observable inputs are not available, thereby allowing forsituations in which there is little, if any, market activity for theasset or liability at the measurement date. However, the fair valuemeasurement objective should remain the same; that is, an exitprice from the perspective of a market participant that holds theasset or owes the liability. Unobservable inputs are developedbased on the best information available in the circumstances,which may include the reporting entity's own data.
Impairment of Goodwill
The Group tests annually whether goodwill has suffered anyimpairment in accordance with the accounting policy underNote 3S. The recoverable amount is deemed to be the value inuse using a discounted cash flow model. This requires the directorsto estimate the future cash flows and a suitable discount rate.

FRANSABANK | ANNUAL REPORT 2016 | 88-89
Checks in course of collection Current accounts with banks and financial institutionsCurrent margin accounts with banks and financial institutions Term placements with banks and financial institutionsTerm placements with related banks and financial institutionsBlocked margins with banks and financial institutionsAccrued interest receivableRegulatory allowance for country risk TOTAL
37,564,503294,559,904
21,872,614975,650,518
5,210,9833,292,003
251,771 (1,375)
2016LBP’000
6. DEPOSITS WITH BANKS AND FINANCIAL INSTITUTIONS
2015
18,841,036 467,364,139
9,139,566 846,392,217
4,840,0023,292,003
259,345 (1,374)
1,350,126,934
Balance January 1 Additions (Note 38) Write-back (Note 38)Effect of exchange rates changes BALANCE DECEMBER 31
2,751188,508
(194,496)4,612
1,375
The movement of the regulatory allowance for country risk was as follows:
1,37570
-(71)
1,374
2016LBP’000 2015
Balance January 1 Additions (Note 38) Write-back (Note 38)Effect of exchange rates changes BALANCE DECEMBER 31
70,66852
(24,376)(25,421)
20,923
20,92312,602
(32,108)(131)
1,286
2016LBP’000 2015
7. LOANS TO BANKS
2016LBP’000 2015
Loans to banks are reflected at amortized cost and consist of the following:
Regular performing accounts Accrued interest receivableRegulatory allowance for country risk TOTAL
70,613,819 370,679(20,923)
70,963,575
56,703,443 317,354 (1,286)
57,019,511
The movement of the regulatory allowance for country risk during 2016 and 2015 was as follows:
As a guarantee of performing loans in the amount ofLBP 55.49 billion (LBP 66.12 billion in 2015), the borrower
has pledged in favor of the Group regular and performing notesreceivable against housing loans granted to its customers.

8. LOANS AND ADVANCES TO CUSTOMERS
NOTES TO THE CONSOLIDATED FINANCIAL STATEMENTSFor the year ended December 31, 2016
Financial Statements
2016LBP’000 2015
December 31, 2016LBP’000 December 31, 2015
The carrying value of loans and advances to customersinclude accidentally temporary debtors with carryingvalue amounting to LBP 60.5 billion as of December 31,2016 (LBP 51.7 billion in 2015).
The carrying value of loans and advances to customersinclude loans to related parties in the aggregate ofLBP 46 billion as of December 31, 2016 (LBP 223.1 billionin 2015) (See Note 40).
Regular and Watch ListRetail Customers:Mortgage loans 1,796,300,883 - - - 1,796,300,883 1,527,391,896 - - - 1,527,391,896Personal loans 801,945,303 - - - 801,945,303 757,402,635 - - - 757,402,635 Car loans 244,767,540 - - - 244,767,540 257,072,431 - - - 257,072,431Credit cards 52,059,248 - - - 52,059,248 54,932,193 - - - 54,932,193 Educational loans 41,949,726 - - - 41,949,726 40,916,603 - - - 40,916,603 Other 42,415,010 - - - 42,415,010 24,182,484 - - - 24,182,484 Loans to staff 8,627,911 - - - 8,627,911 8,892,014 - - - 8,892,014 2,988,065,621 - - - 2,988,065,621 2,670,790,256 - - - 2,670,790,256Regular and Watch ListCorporate Customers:Corporates 4,440,148,704 - - - 4,440,148,704 4,389,712,048 - - - 4,389,712,048Small and medium enterprises 1,856,590,289 - - - 1,856,590,289 1,943,728,565 - - - 1,943,728,565 6,296,738,993 - - - 6,296,738,993 6,333,440,613 - - - 6,333,440,613Accrued interest receivable 29,658,045 - - - 29,658,045 25,325,978 - - - 25,325,978
Allowance for CollectivelyAssessed Loans:Regular and watch list loans (including allowance for country risk) - - - (19,873,862) (19,873,862) - - - (52,233,760) (52,233,760) Total regular and watch list 9,314,462,659 - - (19,873,862) 9,294,588,797
Non-Performing Accounts:Purchased loan book 2,148,399 - - - 2,148,399 2,226,266 - - - 2,226,266Substandard 169,459,258 (46,409,685) - (1,442,698) 121,606,875 144,263,774 (37,759,875) - (1,132,619) 105,371,280 Doubtful 1,428,983,470 (705,792,109) (3,488,513) (249,062,302) 470,640,546 1,335,408,492 (641,446,036) (4,490,488) (258,031,757) 431,440,211Bad 223,783,165 (123,132,282) (2,225,526) (98,425,357) - 206,302,330 (112,307,716) (2,255,634) (91,656,958) 82,022
Collectively Allowance:Doubtful and bad - - - (39,894,881) (39,894,881) - - - (36,398,951) (36,398,951)
Total non-performing 1,824,374,292 (875,334,076) (5,714,039) (388,825,238) 554,500,939 1,688,200,862 (791,513,627) (6,746,122) (387,220,285) 502,720,828
TOTAL 11,138,836,951 (875,334,076) (5,714,039) (408,699,100) 9,849,089,736
GrossAmount
UnrealizedInterest
Discount onLoan Book
ImpairmentAllowance
CarryingAmount
GrossAmount
UnrealizedInterest
Discount onLoan Book
ImpairmentAllowance
CarryingAmount
Balance January 1 Additions Recoveries (Note 32)Write-offTransfer to off-balance sheetReclassification to / from allowance accountEffect of exchange rates changes BALANCE DECEMBER 31
883,193,629125,488,425 (14,836,404)
(203,546,220)-
7,965,314(6,751,117)
791,513,627
The movement of unrealized interest was as follows:
791,513,627139,633,833 (10,775,781)(41,061,065)
(990,779)(15,075)
(2,970,684)
875,334,076

FRANSABANK | ANNUAL REPORT 2016 | 90-91
2016LBP’000 2015
Balance January 1 Additions Recoveries Net allowance charge
Write-back against deferred assets (Note 16)Write-offTransfer to off-balance sheetReclassification to/from unrealized interestEffect of exchange rates changes BALANCE DECEMBER 31
448,023,90598,809,904
(36,996,772)61,813,132
(10,083,886)(19,454,598)
(1,278,921)(7,965,314)
(31,600,273)
439,454,045
The movement of allowance for impairment of loans and advances was as follows:
The allowance of impairment of loans and advances includes ageneral allowance for credit risk linked to country risk in theamount of LBP 6.8 billion (LBP 17.8 billion during 2015). This
allowance is calculated on the basis of a stress test scenarioperformed on Syrian credit risk exposure.
Balance January 1 Additions RecoveriesWrite-off BALANCE DECEMBER 31
7,209,597 -
(352,865)(110,610)
6,746,122
The movement of the discount on purchased loan book was as follows:
439,454,04588,545,038
(82,308,483)6,236,555
-(21,993,919)
(765,140)15,075
(14,247,516)
408,699,100
6,746,122 38,227
(610,503)(459,807)
5,714,039
2016LBP’000 2015
9. INVESTMENT SECURITIES
Equities and preference shares Lebanese Treasury bills Lebanese Government bonds Foreign Government bonds Foreign bonds issued by banksSubordinated bonds Certificates of deposit issued by Central Bank of Lebanon Certificates of deposit issued by banks Corporate bonds Asset-backed securitiesMutual fund
Accrued interest receivable TOTAL
Investment securities are allocated as follows:
39,963,028106,605,386
79,849,482282,922,775136,435,848
-140,489,175
-9,515,804
-9,327,904
805,109,40210,376,594
815,485,996
22,413,5102,653,983,4902,969,966,247
47,195,56316,102,001
1,507,5004,151,456,125
40,366,9767,292,958
14,117,711-
9,924,402,081160,825,889
10,085,227,970
297,016,828----------
297,016,828-
297,016,828
359,393,3662,760,588,8763,049,815,729
330,118,338152,537,849
1,507,5004,291,945,300
40,366,97616,808,76214,117,711
9,327,90411,026,528,311
171,202,483
11,197,730,794
Fair Value ThroughProfit or Loss
Amortized Cost(Net of Impairment
Allowance)
Fair Value ThroughOther Comprehensive
Income Total
December 31, 2016LBP’000

Equities and preference shares Lebanese Treasury bills Lebanese Government bonds Foreign Government bonds Foreign bonds issued by banksSubordinated bonds Certificates of deposit issued by Central Bank of Lebanon Certificates of deposit issued by banks Corporate bonds Asset-backed securitiesMutual fund
Accrued interest receivable
37,701,873103,961,207144,857,715
-180,339,789
-298,237,506
---
3,526,818768,624,908
8,335,206
776,960,114
19,398,5103,095,386,9962,622,732,232
257,887,80716,611,558
1,507,5004,063,117,849
40,439,99738,132,34950,166,749
-10,205,381,547
164,355,344
10,369,736,891
292,012,643----------
292,012,643-
292,012,643
349,113,0263,199,348,2032,767,589,947
257,887,807196,951,347
1,507,5004,361,355,355
40,439,99738,132,34950,166,749
3,526,81811,266,019,098
172,690,550
11,438,709,648
Fair Value ThroughProfit or Loss
Amortized Cost(Net of Impairment
Allowance)
Fair Value ThroughOther Comprehensive
Income Total
LBP’000 December 31, 2015
Investments at fair value through profit or loss include an amountof LBP 1.9 billion (LBP 914 million during 2015) representing theGroup’s share in start-ups established based on a co-sharingagreement with the regulator providing the funding.
The Group’s business model for debt securities in the Cypriot entitywas amended during 2016. As a result, the Group reclassified a
carrying amount of LBP 231.6 billion from securities frominvestments at amortized cost to investments at fair valuethrough profit or loss. Positive change in fair value of the securitiesduring 2016 amounted to LBP 10.5 billion and was recorded under“Net interest and other gain / (loss) on investment at fair valuethrough profit or loss” in the consolidated statement of profit orloss (Note 36).
Investments at Amortized CostBelow are the details of investments classified at amortized cost with related fair value at December 31:
Preference shares 22,413,510 - - 22,413,510 22,413,510Lebanese Treasury bills 2,653,983,490 - 38,705,536 2,692,689,026 2,696,647,078Lebanese Government bonds 2,969,966,247 - 37,273,513 3,007,239,760 2,798,279,450Foreign Government bonds 47,195,563 - 415,928 47,611,491 47,611,491Foreign bonds issued by banks 16,129,779 (27,778) 97,244 16,199,245 16,632,434Subordinated bonds 1,507,500 - 97,516 1,605,016 1,605,016Certificates of deposit issued by Central Bank of Lebanon 4,151,456,125 - 83,908,505 4,235,364,630 4,216,761,540Certificates of deposit issued by banks 40,366,976 - 106,973 40,473,949 40,402,687Corporate bonds 7,292,958 - 96,738 7,389,696 7,846,203Asset-backed securities 14,117,711 - 123,936 14,241,647 13,546,860
TOTAL 9,924,429,859 (27,778) 160,825,889 10,085,227,970 9,861,746,269
AmortizedCost
Allowancefor
Impairment
AccruedInterest
ReceivableCarryingValue Fair Value
December 31, 2016LBP’000
Preference shares 19,398,510 - - 19,398,510 19,398,510Lebanese Treasury bills 3,095,386,996 - 45,730,740 3,141,117,736 3,121,567,483Lebanese Government bonds 2,622,732,232 - 33,359,887 2,656,092,119 2,667,267,088Foreign Government bonds 257,887,807 - 4,497,215 262,385,022 271,748,998Foreign bonds issued by banks 16,633,331 (21,773) 171,548 16,783,106 17,041,626Subordinated bonds 1,507,500 - 97,516 1,605,016 1,605,016Certificates of deposit issued by Central Bank of Lebanon 4,063,117,849 - 80,036,218 4,143,154,067 4,137,026,582Certificates of deposit issued by banks 40,439,997 - 107,137 40,547,134 40,472,305Corporate bonds 38,132,349 - 114,009 38,246,358 39,034,435Asset-backed securities 50,166,749 - 241,074 50,407,823 50,407,823
AmortizedCost
Allowancefor
Impairment
AccruedInterest
ReceivableCarryingValue Fair Value
LBP’000 December 31, 2015
NOTES TO THE CONSOLIDATED FINANCIAL STATEMENTSFor the year ended December 31, 2016
Financial Statements

The Group has Treasury bills classified at amortized cost withcarrying value of LBP 627 billion as of December 31, 2016 thatare pledged against soft loans and credit facility granted byCentral Bank of Lebanon – (Notes 20(e), 20(f) and 43)(LBP 658 billion in 2015).
During 2016, the Group entered into several sale transactionsof Lebanese Treasury bills and certificates of deposit issuedby Central Bank of Lebanon in Lebanese Pound having a nominalvalue of LBP 1,003 billion concluded simultaneously with theacquisition of medium and long term Lebanese Governmentbonds and certificates of deposit issued by Central Bank ofLebanon in U.S. Dollar with a nominal value of USD 669 millionfunded from the Group’s Treasury in foreign currencies heldwith correspondent banks.
The resulting surplus of the inter-related transactions indicatedabove, derived from the special and non-conventional dealsarrangement with the regulator, amounting to LBP 356 billion,net of tax in the amount of LBP 63 billion, was credited to“Regulatory deferred liability” under other liabilities in theconsolidated statement of financial position. (Refer to Note 22).
The Group has Lebanese Government bonds classified atamortized cost with carrying value of LBP 302 billion that arepledged against the release of the compulsory reserve (Note 5).
At the beginning of 2016, the Group sold the pledged LebaneseTreasury bills in Lebanese Pounds, having a nominal value of
LBP 297 billion, to settle the revolving loan in the amount ofLBP 300 billion which matured on January 10, 2016 (Refer toNote 16). This transaction resulted in a gain on sale (net of tax)of LBP 20 billion. In line with the above and following CentralCouncil decision dated January 26, 2016, the Group wasexempted from compulsory reserves in foreign currency up toUSD 200 million. This reserve was invested in LebaneseGovernment bonds which were pledged against the reserve.Interest income on these bonds during 2016 amounted toLBP 14 billion (net of tax) which was offset, together with theabove gain on sale, against the deferred assets account (Note16).
The Group has Lebanese Government bonds classified at amortizedcost with carrying value of LBP 373 billion as of December 31,2015 that were pledged against a stand-by line facility funded bythe Central Bank of Lebanon – (Notes 20(e) and 43).
During 2015, the Group derecognized investments at amortizedcost with a carrying value of LBP 1,009 billion, thus resultingin a realized gain of LBP 58 billion recognized in the consolidatedstatement of profit or loss.
During 2015, the Group exchanged certificates of deposit issuedby Central Bank of Lebanon and Lebanese Government bondswith short term maturities having aggregate carrying value ofLBP 39.7 billion against certificates of deposit, LebaneseGovernment bonds and Lebanese Treasury bills with long termmaturities.
Investments at amortized cost are segregated over the remaining periods to maturity as follows:
Lebanese Treasury bills:Up to one year1 year to 3 years3 years to 5 years5 years to 10 years
Lebanese Government bonds:Up to one year1 year to 3 years3 years to 5 years5 years to 10 yearsBeyond 10 years
Foreign Government bonds:Up to one year1 year to 3 years3 years to 5 years5 years to 10 years
Foreign bonds issued by banks:1 year to 3 years3 years to 5 years5 years to 10 years
Subordinated bonds:1 year to 3 years
150,975,465 1,001,716,965
557,482,564 1,342,558,990 3,052,733,984
151,360,538 621,722,958 523,645,208 672,179,176 647,243,618
2,616,151,498
92,125,491 19,672,739
100,626,170 45,641,385
258,065,785
1,039,0899,276,406 6,331,500
16,646,995
1,507,5001,507,500
150,967,3781,005,294,082
561,102,5661,378,022,9703,095,386,996
152,565,685619,427,442524,073,557677,859,636648,805,912
2,622,732,232
92,059,95419,672,739
100,741,05945,414,055
257,887,807
1,039,0899,236,9206,335,549
16,611,558
1,507,5001,507,500
151,151,1231,012,682,411
557,952,1881,354,051,0213,075,836,743
151,742,408616,988,559516,482,717692,020,124656,673,393
2,633,907,201
92,094,83319,672,739
108,304,86447,179,347
267,251,783
1,039,0899,495,4406,335,549
16,870,078
1,507,5001,507,500
6.257.337.508.31
8.276.616.047.176.76
1.902.214.694.06
7.0014.29
6.71
6.75
Remaining Period to Maturity
449,030,665 869,924,364 432,457,000878,252,010
2,629,664,039
266,405,487621,336,065 592,687,942 572,932,913 912,782,205
2,966,144,612
35,551,563 6,820,0004,824,000
-47,195,563
7,540,7224,522,500 4,048,996
16,112,218
1,507,5001,507,500
448,505,434873,117,367433,843,662898,517,027
2,653,983,490
266,422,813618,341,367597,732,641574,058,038913,411,388
2,969,966,247
35,551,5636,820,0004,824,000
-47,195,563
7,527,0844,525,9214,048,996
16,102,001
1,507,5001,507,500
455,958,631881,488,158431,352,658889,142,095
2,657,941,542
265,997,183592,126,698582,131,682507,800,564812,949,810
2,761,005,937
35,551,5636,820,0004,824,000
-47,195,563
8,106,0354,380,1594,048,996
16,535,190
1,507,5001,507,500
6.717.527.128.08
8.445.467.366.336.91
7.805.006.20
-
9.537.005.54
6.75
RedemptionValue
Amortized Cost(Net of Impairment) Fair Value Average
Interest Rate %Redemption
ValueAmortized Cost(Net of Impairment) Fair Value Average
Interest Rate %
December 31, 2016LBP’000 December 31, 2015
FRANSABANK | ANNUAL REPORT 2016 | 92-93

NOTES TO THE CONSOLIDATED FINANCIAL STATEMENTSFor the year ended December 31, 2016
Financial Statements
Certificates of deposit issued by Central Bank of Lebanon:Up to one year1 year to 3 years3 years to 5 years5 years to 10 yearsBeyond 10 years
Certificates of deposit issued by banks:Up to one year1 year to 3 years
Corporate bonds:Up to one year1 year to 3 years3 years to 5 years5 years to 10 years
Assets-backed securities:1 year to 3 years3 years to 5 years5 years to 10 yearsBeyond 10 years
Preference shares redeemable starting:From 1 yearFrom 2 yearsFrom 3 yearsFrom 4 yearsFrom 5 years
278,000,000602,612,500342,038,000723,978,750
2,093,416,7504,040,046,000
-40,418,300 40,418,300
21,108,4446,586,5603,670,3286,907,519
38,272,851
-308,063
49,858,686-
50,166,749
1,507,50010,552,500
3,015,0004,323,510
- 19,398,510
279,708,348603,482,653345,898,807738,354,245
2,095,673,7964,063,117,849
-40,439,99740,439,997
21,057,5106,469,7333,672,1636,932,943
38,132,349
-308,063
49,858,686 -
50,166,749
1,507,50010,552,500
3,015,0004,323,510
- 19,398,510
283,130,903614,422,825340,756,073734,597,999
2,084,082,5644,056,990,364
-40,365,16840,365,168
21,107,4776,591,5003,695,7157,525,734
38,920,426
-313,901
48,258,156 -
48,572,057
1,507,50010,552,500
3,015,0004,323,510
- 19,398,510
8.147.967.048.068.69
-5.38
0.500.331.094.91
-7.005.63
-
-----
Remaining Period to Maturity
469,612,50088,038,000
302,000,0001,841,128,7501,437,691,7504,138,471,000
40,356,533-
40,356,533
-376,430
2,379,0404,517,1647,272,634
105,461-
14,012,250-
14,117,711
11,303,2355,080,275
-3,015,000 3,015,000
22,413,510
469,743,30687,148,338
305,285,6411,850,643,4601,438,635,3804,151,456,125
40,366,976-
40,366,976
-375,617
2,393,2904,524,0517,292,958
105,461-
14,012,250-
14,117,711
11,303,2355,080,275
-3,015,000 3,015,000
22,413,510
472,394,76182,904,292
304,833,1031,872,841,1251,399,879,7544,132,853,035
40,295,714-
40,295,714
-412,532
2,532,0324,804,9017,749,465
101,406-
13,321,518-
13,422,924
11,303,2355,080,275
-3,015,000 3,015,000
22,413,510
7.975.307.647.728.28
5.38-
-6.254.755.00
7.00-
6.33-
-----
RedemptionValue
Amortized Cost(Net of Impairment)
Fair Value Average Interest Rate %
RedemptionValue
Amortized Cost(Net of Impairment)
Fair Value Average Interest Rate %
December 31, 2016LBP’000 December 31, 2015
Investments at Fair Value Through Other Comprehensive Income
Quoted equitiesUnquoted equities
TOTAL
13,056,775283,960,053
297,016,828
11,749,756171,111,051
182,860,807
Cost CarryingValue
Cumulative Changein Fair Value
1,307,019112,849,002
114,156,021
December 31, 2016LBP’000
Quoted equitiesUnquoted equities
TOTAL
12,919,633279,093,010
292,012,643
11,612,614173,476,969
185,089,583
Cost CarryingValue
Cumulative Changein Fair Value
1,307,019105,616,041
106,923,060
LBP’000 December 31, 2015

FRANSABANK | ANNUAL REPORT 2016 | 94-95
On November 2, 2015, Visa Inc. and Visa Europe Ltd announcedan agreement for Visa Inc. to acquire Visa Europe Ltd.Consequently, the Cypriot entity booked a positive change in fairvalue of its investment of EUR 1.7 million (C/V LBP 2.9 billion)recorded under “Net change in fair value of investments at fairvalue through other comprehensive income” in the consolidated
statement of profit or loss and other comprehensive income.During 2016, an additional positive change in fair value ofEUR 115 thousands (C/V LBP 191 million) was recognized beforethe investment was fully sold. Gain on sale of LBP 3.1 billionwas transferred from other comprehensive income to retainedearnings.
Acceptances represent documentary credits which the Grouphas committed to settle on behalf of its customers againstcommitments by those customers (acceptances). The commitments
resulting from these acceptances are stated as a liability in thestatement of financial position for the same amount.
Even though, the Group’s interest in Bancassurance SAL is60%, the Group determined that it does not control this entityon the basis that according to the shareholders’ agreement,
the relevant activities of Bancassurance are directed on thebasis of 75% votes of the Board of Directors which does notgive the Group power over the investee.
10. CUSTOMERS’ LIABILITY UNDER ACCEPTANCES
11. INVESTMENTS IN ASSOCIATES
Investments in associates, which are not listed, are as follows:
Bancassurance SALUnited Capital BankInternational Payment Network SAL TOTAL
43,727,949 21,971,715
1,471,106
67,170,770
Interest Held %
60.0020.0020.30
60.0020.0020.30
LebanonRepublic of Sudan
Lebanon
51,889,303 18,730,441
1,541,391
72,161,135
Country of Incorporation 2016 2015 2016LBP’000 2015
2016LBP’000 20152016 2015
The following table summarizes the financial information of Bancassurance and United Capital Bank before intercompany eliminations:
BANCASSURANCE UNITED CAPITAL BANK
Cash and banks 113,103,774 114,510,875 169,646,558 117,457,915Loans and advances - - 241,391,778 219,975,082Investment securities 437,469,433 363,118,610 20,498,736 98,458,763Other investments - - - -Other assets 32,120,374 21,518,063 26,898,461 34,853,153Deposits from banks - - (35,005,622) (40,443,190)Deposits from customers - - (140,462,842) (102,291,679)Equity of unrestricted investment account holders - - (81,729,152) (145,225,296)Bank borrowings (29,278,182) (11,247,936) - -Insurance contracts liabilities (471,591,748) (419,461,400) - -Other liabilities and provisions (12,059,818) (12,275,986) (107,580,847) (72,921,622)Net assets 69,763,833 56,162,226 93,657,070 109,863,126
GROUP'S SHARE IN NET ASSETS (EXCLUDING GOODWILL) 41,858,300 33,697,336 18,731,414 21,972,625
Net revenues 53,220,780 50,409,623 16,678,006 25,000,110Net income from financial assets at FVTPL 736,353 (570,400) - -Claims paid and change in insurance liabilities (19,586,672) (17,033,219) - -Other income (net) 6,145 41,067 10,690,637 9,285,149Operating expenses (8,428,174) (9,617,035) (22,280,795) (17,233,095)Income tax expense (1,055,560) (1,010,285) (3,464,257) (4,624,886)Net profit for the year 24,892,872 22,219,751 1,623,591 12,427,278
GROUP'S SHARE IN NET PROFIT 14,935,723 13,331,851 324,570 2,485,364

NOTES TO THE CONSOLIDATED FINANCIAL STATEMENTSFor the year ended December 31, 2016
Financial Statements
2016LBP’000 2015
2016LBP’000
LBP’000
2015
Balance January 1 Unrealized gain / (loss) through other comprehensive incomeDividends received Share in net profit (Note 37)Board of Directors' remunerationCurrency translation adjustment
BALANCE DECEMBER 31
59,825,856 (40,156)
(7,986,448)15,879,755
(110,148)(398,089)
67,170,770
Below is the reconciliation of the carrying amount of investments in associates:
67,170,770 40,944
(8,353,951)15,330,578
(108,543)(1,918,663)
72,161,135
12. ASSETS ACQUIRED IN SATISFACTION OF LOANS / INVESTMENTS PROPERTIES
This section represents foreclosed real estate properties acquired through enforcement of security over loans and advances to customers.
Assets acquired in satisfaction of loans - LebanonAssets acquired in satisfaction of loans – SyriaStock of property - Foreign operations Investment properties - Foreign operations TOTAL
200,601,020--
200,601,02077,443,175
278,044,195
12.1 Assets Acquired in Satisfaction of Loans - Lebanon
According to the Lebanese banking regulations, the acquisitionof assets in settlement of loans requires the approval of thebanking regulatory authorities and these are classified as “Assetsacquired in satisfaction of loans” and should be liquidated
within 2 years. In case of default of liquidation, a regulatoryreserve should be appropriated from the yearly net profits overa period of 5 or 20 years as applicable. These assets arecarried at cost less impairment allowance.
Gain on disposals amounted to LBP 1.9 billion (LBP 1.1 billion in 2015) recorded under other income in the statement of profit orloss (Note 37).
Movement of the account of assets acquired in satisfaction of loans and related impairment allowance is summarized as follows:
Balance January 1, 2015Foreclosures DisposalsBalance December 31, 2015ForeclosuresDisposalsTransfer to property and equipment
BALANCE DECEMBER 31, 2016
216,157,240168,342
94,394,986310,720,568
19,077,305
329,797,873
ImpairmentAllowanceCost Carrying
Value
214,610,4382,664,228
(2,877,450)214,397,216
20,403,244(1,755,671)(3,130,345)
229,914,444
(13,871,919)-
75,723 (13,796,196)
-38,992
-
(13,757,204)
200,738,5192,664,228
(2,801,727)200,601,020
20,403,244(1,716,679)(3,130,345)
216,157,240
The fair values of the assets acquired in satisfaction of loans and investment properties exceeds their carrying value as at December 31,2016 and 2015.

FRANSABANK | ANNUAL REPORT 2016 | 96-97
LBP’000
12.2 Assets Acquired in Satisfaction of Loans - Syria
During 2016, the Syrian subsidiary acquired real estates in satisfaction of loans. According to the Article 100/2/B of Law 23 of year2002, these assets should be liquidated within 2 years. These assets are carried at cost.
12.3 Stock of Property
During 2016, the Cypriot subsidiary transferred the majority of its properties previously classified as investment properties to stockof property.
12.4 Investment Properties
Foreclosed assets acquired by the Group’s foreign entities are presented separately under investment properties and are measuredat fair value. The table below shows the reconciliation of the carrying amounts:
Balance January 1, 2015ForeclosuresRevaluation loss - Note 37 Effect of exchange rates changesBalance December 31, 2015 ForeclosuresTransfer to stock of propertyRevaluation loss - Note 37 Effect of exchange rates changes
BALANCE DECEMBER 31, 2016
56,402,50629,478,488(2,388,213)(6,049,606)77,443,175
4,160,131(59,077,406)
(950,806)(2,497,789)
19,077,305
LBP’000
Balance January 1, 2016Transfers from investment properties ForeclosuresEffect of exchange rates changes
BALANCE DECEMBER 31, 2016
-59,077,40636,805,914(1,488,334)
94,394,986
The movement of stock of property was as follows:
Investment properties are categorized as Level 2 fair valuessince they are based on real estate market values made byindependent real estate experts.
During 2015, the Group’s Cypriot entity acquired 75% equitystake in an entity having a primary activity of holding andadministrating a commercial property held under a long-term
lease. The property and the respective finance lease obligationamounted to LBP 26 billion (C/V EUR 16 million) and LBP 6.6 billion(Note 22) respectively. Out of the LBP 26 billion, LBP 7 billionwas classified under owned properties to be used as a newhead office for the Cypriot entity (Note 13). Interest expense onFinance lease obligation during 2016 amounted to LBP 470 million(LBP 325 million during 2015) (Note 33).
LBP’000
Balance January 1, 2016 Foreclosures BALANCE DECEMBER 31, 2016
- 168,342
168,342
The movement was as follows:

NOTES TO THE CONSOLIDATED FINANCIAL STATEMENTSFor the year ended December 31, 2016
Financial Statements
13. PROPERTY AND EQUIPMENT
Balance as at December 31,
2016
Cost/Revaluation:Owned properties 330,821,969 15,658,833 - 628,680 3,130,345 (3,519,344) 346,720,483Furniture, equipment and computer 115,348,177 9,613,338 (3,164,154) 15,295 - (741,050) 121,071,606Vehicles 5,960,437 675,016 (473,562) - - (42,716) 6,119,175Office improvements and installations 109,053,922 10,614,949 (577,835) - - (641,720) 118,449,316Building under finance lease (Note 12.4) 6,995,480 168,758 - - - (356,462) 6,807,776 568,179,985 36,730,894 (4,215,551) 643,975 3,130,345 (5,301,292) 599,168,356
Accumulated Depreciation (205,622,641) (27,056,132) 3,952,498 (25,828) - 1,584,701 (227,167,402)Provision for Impairment (2,808,460) - - - - - (2,808,460)Advance payments 35,071,358 8,877,621 - - - (471,129) 43,477,850
CARRYING VALUE 394,820,242 412,670,344
Balance at January 1, 2016
Additions and Transfers from
Advance Payments
Retirements RevaluationAdjustment
Transfer from Assets Acquired in Satisfaction of Loans
Currency TranslationAdjustmentLBP’000
Balance as atDecember 31,
2015
Cost/Revaluation:Owned properties 337,963,096 8,928,007 (35,994) 613,936 (362,871) - (16,284,205) 330,821,969Furniture, equipmentand computer 110,809,478 10,882,806 (2,958,086) 3,564 - - (3,389,585) 115,348,177Vehicles 5,522,527 1,017,966 (296,591) - - - (283,465) 5,960,437Office improvementsand installations 105,399,788 6,198,557 (134,937) - 26,642 - (2,436,128) 109,053,922Building under financelease (Note 12.4) - 7,162,264 - - (92,818) - (73,966) 6,995,480 559,694,889 34,189,600 (3,425,608) 617,500 (429,047) - (22,467,349) 568,179,985
Accumulated Depreciation (186,769,053) (26,498,797) 3,095,993 (24,030) 66,176 - 4,507,070 (205,622,641)Provision for Impairment (3,171,331) - - - 362,871 - - (2,808,460)Advance payments 21,441,604 14,170,168 - - - (34,147) (506,267) 35,071,358
391,196,109 394,820,242
Balance at January 1, 2015
Additions and Transfers from
Advance Payments
Retirements RevaluationAdjustment
Transfer toIntangibleAssets
TransferbetweenAccounts
Currency TranslationAdjustmentLBP’000
14. INTANGIBLE ASSETS
Balance as at December 31,
2016
Cost:Purchase software 44,485,676 2,909,104 - (242,677) 47,152,103 Licenses 449,064 520,862 (8,308) (23,419) 938,199 Key money 196,017 - - - 196,017 45,130,757 3,429,966 (8,308) (266,096) 48,286,319 Accumulated Depreciation:Purchase software (35,504,594) (3,560,523) - 130,588 (38,934,529)Licenses (157,277) (139,432) 4,143 6,148 (286,418)Key money (156,822) (4,020) - - (160,842) (35,818,693) (3,703,975) 4,143 136,736 (39,381,789)
Advance payments 3,602,836 819,503 - - 4,422,339
CARRYING VALUE 12,914,900 13,326,869
Additions and Transfers from
Advance Payments
RetirementsCurrency TranslationAdjustment
Balance at January 1, 2016LBP’000

FRANSABANK | ANNUAL REPORT 2016 | 98-99
Balance as atDecember 31,
2015
Cost:Purchase software 42,373,258 2,942,582 - 34,147 (864,311) 44,485,676Licenses 501,624 129,348 (467) - (181,441) 449,064Key money 196,017 - - - - 196,017 43,070,899 3,071,930 (467) 34,147 (1,045,752) 45,130,757Accumulated Depreciation:Purchase software (32,446,397) (3,536,005) - - 477,808 (35,504,594)Licenses (99,319) (110,089) 467 - 51,664 (157,277)Key money (152,802) (4,020) - - - (156,822) (32,698,518) (3,650,114) 467 - 529,472 (35,818,693)
Advance payments 3,069,531 576,080 - - (42,775) 3,602,836
13,441,912 12,914,900
Balance at January 1, 2015
Additions and Transfers from
Advance Payments
RetirementsTransfer fromProperty andEquipment
Currency TranslationAdjustmentLBP’000
2016LBP’000 2015
15. GOODWILL
Goodwill is derived from acquisition of control of subsidiaries as follows:
Goodwill Allocated to BLC BankThe recoverable amount is determined based on fair value lesscost of disposal which is determined to be higher than the
asset’s carrying value using the market comparabilityapproach of similar transaction.
Fransabank OJSC - BelarusBLC Bank SALUSB Bank PLC (Cyprus)Ahli International Bank SAL (merger) TOTAL
720,704 44,095,440
6,061,592 4,087,509
54,965,245
720,704 44,095,440
5,876,245 4,087,509
54,779,898
EuroCounter Value in
LBP’000
Goodwill Allocated to USB BankThe movement of goodwill during 2016 and 2015 was as follows:
Balance as at January 1, 2015 3,681,188 6,750,819Effect of exchange rates changes - (689,227)Balance as at December 31, 2015 3,681,188 6,061,592Effect of exchange rates changes - (185,347)
BALANCE AS AT DECEMBER 31, 2016 3,681,188 5,876,245
Goodwill from Merger of Ahli International Bank SALOn July 31, 2014, the Group acquired “Ahli International Bank SAL“for a consideration of USD 103 million and then it was fullymerged within the Group’s accounts. This transaction resulted
in a goodwill for the amount of LBP 4.09 billion representingthe excess of the consideration paid over the fair value of thenet assets of “Ahli International Bank SAL” and the deferredassets (Note 16).

2016 2015
2016LBP’000
LBP’000
2015
2016LBP’000 2015
16. OTHER ASSETS
Deferred assets on acquisition of Ahli International Bank SALDeferred assets on acquisition of Bank Lati SAL TOTALAmortization charge for the year
35,803,1251,027,819
36,830,944 (8,762,139)
The unamortized balance of deferred assets on business acquisitions is allocated as follows at December 31:
Amortization charge is treated as a yield adjustment to the interest income on the pledged Lebanese Treasury bills acquired fromthe soft loan proceeds.
Deferred assets on business acquisitions (a) Deferred assets against future cash flows (b)Derivative assets held for risk management (c) Deferred tax asset (d) Regulatory blocked deposit (e) Assets in process of acquisition in settlement of loans (f) Deferred charges Collateral on dealings with "Visa International" PrepaymentsForeign exchange operations Accrued incomeDoubtful claims by banksProvision on doubtful claims by banksSundry accounts receivable Allowance for doubtful accounts receivable (g) TOTAL
36,830,94461,944,371
- 3,092,751
17,305,003 1,011,272
- 1,809,462
28,636,742 -
1,305,606 1,246,368
(1,246,368)62,119,443(3,761,276)
210,294,318
(a) Deferred assets on business acquisition represent whatwas compensated by the Central Bank of Lebanon in the formof future cash flows and benefits originated from the soft loansgranted to the Group (refer to Note 20 f).
The Group is amortizing these deferred assets against thereduction of future economic benefits derived from the softloans and thus the carrying value of these deferred assetscorresponds to the present value of future cash flows expectedto be derived from the soft loans.
28,642,50026,935,864
3,495,5431,304,905
17,301,910 1,011,272 1,029,1981,828,414
27,363,456 863,425
1,154,1211,222,206
(1,222,206)58,588,203(3,761,276)
165,757,535
28,642,500-
28,642,500 (8,188,444)
(b) Net outstanding deferred assets amounting to LBP 27 billioncorrespond to the Bank’s Cypriot subsidiary carried over lossesincurred since the crisis in Cyprus occurred up to December 31,2015. These deferred assets are offset against future economicbenefits derived from the low yield funding amounting toLBP 300 million provided by the Central Bank of Lebanon
referred to in Note 20, which were redeemed and replaced byexemption from compulsory reserves up to USD 200 millionduring 2016. Proceeds of the loan and the compulsory reservesare invested in fixed income securities whose return isappropriated to deferred assets.
The movement of deferred assets against future cash flows during the years 2016 and 2015 was as follows:
Net carrying value as at January 1, 61,944,371 84,954,950Deferred assets originated was offset topresent value of contracted future cash flow - 11,995,957Write-back of provision on recovered debt (Note 8) - (10,083,886)Write down during the year (35,051,351) (15,495,266)Effect of foreign currency exchange differences 42,844 (9,427,384) NET CARRYING VALUE 26,935,864 61,944,371
NOTES TO THE CONSOLIDATED FINANCIAL STATEMENTSFor the year ended December 31, 2016
Financial Statements

2016LBP’000 2015
(d)Deferred tax asset represents deferred tax on losses incurredby a Group entity, which can be brought forward against futureprofits.
(e) The regulatory blocked deposits represent non-interestearning compulsory deposits placed with the Lebanese Treasuryand Central Bank of Syria upon the inception of banks accordingto Article 132 of the Lebanese Code of Money and Credit andArticle 19 of the Syrian Law No.28 respectively and are refundablein case of cease of operations.
(f) Foreclosed assets not yet registered represent the value ofloans written-off against enforcement of real estate securityheld and will be reallocated to “Assets Acquired in Settlementof Loans” when the registration in the name of the Groupis finalized.
(g)The majority of the allowance for doubtful accounts receivablerelate to old advances made in previous years againstpurchases of property and equipment.
17. DEPOSITS AND BORROWINGS FROM BANKS
18. LIABILITIES DESIGNATED AT FAIR VALUE THROUGH PROFIT OR LOSS
Current deposits of banks and financial institutionsCurrent deposits - Central Bank of Lebanon Current deposits - Central Bank of Syria Current deposits - Related partiesMoney market deposits - Central Bank of Syria Money market deposits - Banks and financial institutions Money market deposits - Related parties Other short term borrowings Accrued interest payable Accrued interest payable - Related parties
TOTAL
42,472,817 115,037
- 82,963
93,578,48083,242,762 41,166,000 34,087,576
559,224 7,077
295,311,936
72,696,377 33,922
7,859,200 68,603
46,683,59892,955,46331,925,80032,738,103
635,930 14,116
285,611,112
LBP’000
Customers’ deposits with guaranteed capital at fair value through profit or loss Accrued interest payable
TOTAL
48,485,734381,543
48,867,277
2016
135,557,339930,018
136,487,357
Certain deposits from customers have been designated at fairvalue through profit or loss as they are matched with anembedded derivative. An accounting mismatch would arise ifcustomers’ deposits were accounted for at amortized cost,because the related derivative is measured at fair value withmovements in the fair value taken through the statement of
profit or loss. By designating those deposits from customersat fair value, the movements in the fair value of these depositsare recorded in the statement of profit or loss. Theseinstruments provide notional amounts protection for customers ofLBP 136 billion equivalent to 100% of the initially investedamount (LBP 49 billion in 2015).
FRANSABANK | ANNUAL REPORT 2016 | 100-101
2015
(c) The derivative assets held for risk management consist of the following:
The OTC structured derivative is designated as a fair valuehedge. The OTC structured derivative represents an embedded
derivative in 2 structured deposit product which guarantee aminimum redemption value of 100% (Note 18).
Fair Value as at December 31,
2016LBP’000
Over-The-Counter (OTC) structured derivative 3,495,543

NOTES TO THE CONSOLIDATED FINANCIAL STATEMENTSFor the year ended December 31, 2016
Financial Statements
LBP’000
Customers’ deposits with guaranteed capital at fair value through profit or loss Accrued interest payable
TOTAL
--
-
2016
2,944,19217,085
2,961,277
2015
Liabilities designated at fair value through profit or loss include related parties deposits as follows:
LBP’000
Customers’ deposits at fair value through profit or loss Related derivative contracts - Note 16
48,485,734-
2016
135,557,3393,495,543
2015
The fair value recognized on these deposits and the related derivatives is as follows:
2016LBP’000 2015
2016LBP’000 2015
19. CUSTOMERS’ ACCOUNTS AT AMORTIZED COST
2,572,710,258 20,994,565,046
1,407,246,780
114,290,043 130,013,643
71,721,22861,952,631
149,190,143 25,501,689,772
Deposits from customers:- Current / demand deposits - Term deposits - Collateral against loans and advances
Margins and other collateral:- Margins for irrevocable import letters of credit - Margins on letters of guarantee - Other margins - Blocked accounts
Accrued interest payable TOTAL
2,406,461,965 20,080,920,063
1,549,108,044
120,003,339 82,808,302 72,342,61675,304,126
146,857,401
24,533,805,856
9,877,9391,823,898,879
20,942,913
20,1402,883,192
21,864,980 1,879,488,043
Deposits from related parties:- Current / demand deposits - Term deposits - Collateral against loans and advances
Margins and other collateral: - Margins on letters of guarantee - Blocked accounts
Accrued interest payable TOTAL
13,557,349 1,819,976,102
199,551,681
8,316,474 3,195,078
18,615,693
2,063,212,377
Customers’ deposits include related parties deposits detailed as follows:
Deposits at amortized cost are allocated by brackets of deposits as follows:
Less than LBP 200 million From LBP 200 million to LBP 1.5 billion Above LBP 1.5 billion TOTAL
3,911,806,487 38 3,226,870,526 21 7,138,677,013 3,682,459,163 36 3,921,027,503 26 7,603,486,666 2,651,718,428 26 8,107,807,665 53 10,759,526,093 10,245,984,078 100 15,255,705,694 100 25,501,689,772
LBP Base Accounts
Total Deposits% to Total DepositsTotal Deposits
F/Cy Base Accounts% to Total Deposits Total
December 31, 2016LBP’000

FRANSABANK | ANNUAL REPORT 2016 | 102-103
Less than LBP 200 million From LBP 200 million to LBP 1.5 billion Above LBP 1.5 billion
3,698,364,359 38 3,205,961,190 22 6,904,325,549 3,418,787,092 35 3,804,448,555 26 7,223,235,647 2,666,056,845 27 7,740,187,815 52 10,406,244,660 9,783,208,296 100 14,750,597,560 100 24,533,805,856
LBP Base Accounts
Total Deposits% to Total DepositsTotal Deposits
F/Cy Base Accounts% to Total Deposits Total
December 31, 2015LBP’000
2016LBP’000 2015
Deposits from customers at amortized cost include coded depositaccounts totaling LBP 358.10 billion (LBP 333.50 billion in2015). These accounts are subject to the provisions of Article3 of the Lebanese Banking Secrecy Law dated September 3,1956 which provides that the Bank’s management, in the normalcourse of business, cannot reveal the identities of these
depositors to third parties, including its independent publicaccountants.
Deposits from customers include fiduciary deposits receivedfrom resident and non-resident banks for a total amount ofLBP 41 billion and LBP 627 billion respectively (LBP 40 billionand LBP 463 billion respectively in 2015).
20. OTHER BORROWINGS
Borrowings from European Investment Bank (a)Borrowing from Agence Française de Développement (b)Borrowings from International Finance Corporation (c)Borrowings from Arab Trade Financing Program (d)Borrowings from Central Bank of Lebanon (e)Soft loans from Central Bank of Lebanon (f)Revolving loan from Central Bank of Lebanon (g)Borrowing from the German Investment and Development Company - DEG (related party) (h)Borrowing from SANAD (i)Accrued interest payable
TOTAL
80,913,7815,153,780
19,597,50021,758,069
877,084,076321,833,963300,000,000
4,522,5002,261,2505,179,644
1,638,304,563
97,049,1841,665,397
57,736,74725,926,207
810,793,308273,068,463
- 3,015,000
753,7501,411,360
1,271,419,416
(a) Borrowings from European Investment Bank:Borrowings from European Investment Bank represent termborrowings to finance loans extended to customers. Theseborrowings are divided into 2 types, a 12 years line of credit fortouristic loans and a 10 years line of credit for industrial loans.These borrowings mature in 2019, 2020, 2022, 2024, 2025 and 2026.
(b) Borrowing from Agence Française de Développement:The borrowing from Agence Française de Développementrepresents a 10 years line of credit for a limit of Euro 15 million(LBP 25 billion) and is granted to help the small and mediumenterprises that were affected by the July and August 2006Lebanon war. This borrowing matures in 2017.
(c) Borrowings from International Finance Corporation:During 2014, the Group obtained a borrowing from InternationalFinance Corporation representing a 7 years line of credit for a limitof USD 3 million (LBP 5 billion). This borrowing is payable throughfixed semi-annual installments starting June 2016.
During 2015, another borrowing in the amount of USD 10 millionwas granted to the Group to be used to finance eligible sustainableenergy finance projects. This borrowing is to be settled semi-annually starting June 2016. This borrowing matures in 2024.
During 2016, 2 new borrowings in the amount of USD 20 millionand USD 7 million were granted to the Group. These borrowingsare to be settled semiannually starting June 2018 and January
2018 respectively. These borrowing mature in 2026 and 2023respectively.
(d) Borrowings from Arab Trade Financing Program:The borrowing from Arab Trade Financing Program represents2 revolving line of credit for USD 15 million (LBP 23 billion) andUSD 4 million (LBP 6 billion) granted in years 2000 and 2011to support inter-Arab Trade exchanges. These borrowingsmature in 2017.
(e) Borrowings from Central Bank of Lebanon:During year 2011, the Group obtained borrowings from CentralBank of Lebanon representing 2 loans of 5 years line of creditfor a limit of USD 200 million each (LBP 301 billion). The Grouputilized only USD 110 million and USD 125 million from theseborrowings and they matured during 2016. These lines ofcredit were collateralized by Lebanese Government bonds(Notes 9 and 43).
Borrowings from Central Bank of Lebanon includes also facilitiesin the aggregate amount of LBP 810.8 billion (LBP 522.8 billionas at December 31, 2015) following Central Bank of LebanonBasic Decision No. 6116 of March 7, 1996 and its amendmentsby which the Bank benefited from credit facilities grantedagainst loans that the Bank has granted, on its own responsibility,to its customers, pursuant to certain conditions, rules andmechanism. Part of these facilities is collateralized byLebanese Treasury bills (Notes 9 and 43).

NOTES TO THE CONSOLIDATED FINANCIAL STATEMENTSFor the year ended December 31, 2016
Financial Statements
2016LBP’000 2015
2016LBP’000 2015
2016LBP’000 2015
(f) Soft Loans from Central Bank of Lebanon:
This caption represents soft loans granted by the Central Bank of Lebanon as detailed below:
Soft loan against merger with Ahli International Bank SALAdditional soft loan against merger with Bank Lati SAL 3 Soft loans against providing liquidity to cover 60% of the replacementvalue of buildings and equipment pertaining to four of the Bank'sclients that were directly damaged from the July 2006 Lebanon war:
- Loan 1- Loan 2- Loan 3
Soft loan against subsidized loan granted by the Group
CARRYING VALUE
Maturity DateDate Granted
243,589,40048,765,500
10,858,000774,000
17,734,000113,063
321,833,963
December 21, 2020August 11, 2016
September 2, 2017June 29, 2017
March 21, 2019December 30, 2021
December 26, 2014August 18, 2011
February 18, 2010July 8, 2010
March 29, 2012December 30, 2015
Soft loans are secured against pledged Lebanese Treasury bills (Notes 9 and 43).
243,589,400-
10,858,000774,000
17,734,000113,063
273,068,463
(g) Revolving Loan from Central Bank of Lebanon:On December 30, 2013, the Group obtained a revolving loan inthe amount of LBP 300 billion from the Central Bank ofLebanon for a period of one year maturing on December 31,2014 and renewable for one additional year. This loan bears anaverage interest rate of 2.5% per annum and is collateralizedby Lebanese Treasury bills (Note 9). The purpose of this loanis to provide low cost funding that allows the Group to generatepositive spread over short term facilities expandable at therequest of the borrower until the purpose of the debt to offsetthe Group’s losses arising from its Cypriot subsidiary isachieved. This revolving loan matured and was settled inJanuary 2016.
(h) Borrowing from The German Investment and DevelopmentCompany – DEG (related party):The borrowing from The German Investment and DevelopmentCompany – DEG represents a loan for a limit of USD 6 million(LBP 9 billion), payable through 12 semi-annual payments ofUSD 500,000 each starting June 2013.
(i) Borrowing from SANAD:The borrowing from SANAD (a non-resident specialized investmentfund) represents a loan for USD 5 million (LBP 7.54 billion)obtained on December 28, 2011. The proceeds of the loan areto finance micro, small, and medium enterprises in Lebanon.This borrowing is payable through 10 semi-annual paymentsof USD 500,000 each starting July 2012.
744,712,41549,449,250
286,685,204557,457,694
1,638,304,563
The remaining contractual maturities of borrowings are as follows:
The Group has not had any defaults of principal, interest or other breaches with respect to these borrowings.
Less than one year From 1 to 3 years From 3 to 5 years Over 5 years TOTAL
58,127,83467,676,205
281,173,341864,442,036
1,271,419,416
21. SUBORDINATED LOAN
31,874,580Loan from Proparco (7.61%) 25,499,664
This caption represents a loan according to a contract signedbetween the Bank and “Proparco” on January 19, 2010 for anamount of USD 21,144,000 and is to be settled over a period of10 years including a 6-year grace period. The Group started to
accrue interest effective June 30, 2010 and this interest is payableon July 15 of each year starting year 2011. Repayment of principalstarts on July 15, 2016. USD 16,915,200 was outstanding as atDecember 31, 2016 (USD 21,144,000 as at December 31, 2015).

FRANSABANK | ANNUAL REPORT 2016 | 104-105
2016LBP’000 2015
22. OTHER LIABILITIES
32,054,50118,817,49139,955,687
4,091,43415,030,996
2,306,057 37,191,597 63,657,678
2,8132,466,083 2,149,635 6,575,635
--
63,177,283
287,476,890
Current tax liability (a) Deferred tax liability on items recognized in other comprehensive income (Note 28) Deferred tax liability on undistributed profits of subsidiaries and associates of the BankOther deferred income tax liability Withheld and other taxes payable Due to the Social Security National Fund Checks and incoming payment orders in course of settlement Accrued expenses Accrued interest payable - Cash contribution to capitalAccrued interest payable - Subordinated loan Financial guarantee contracts issuedFinance lease obligation (Note 12.4) Regulatory deferred liability (b)Tax on regulatory deferred liability (b)Sundry accounts payable TOTAL
32,225,43618,481,66642,633,669
2,206,90013,379,470
2,400,91725,187,457 59,795,279
2,8062,243,7312,194,456 6,506,123
355,522,415 62,739,24952,292,468
677,812,042
2016LBP’000 2015
(a) Below is the reconciliation of income tax expense:
337,383,586
51,326,6467,256,130 58,582,776
(26,293,295)2,039,033
38,796(2,312,809)
32,054,501
Profit before tax
Income tax on enacted applicable rates Effect of non-deductible expense and non-taxable income Income tax expense Less: Tax paid in advance Net effect of deferred tax assets (Note 16 (d))Deferred tax on temporary differences Effect of exchange rates changes CURRENT TAX PAYABLE
366,061,288
61,963,878(7,985,834) 53,978,044
(20,719,134)1,787,846
26,492(2,847,812)
32,225,436
(b) In accordance with the Central Bank of Lebanon IntermediaryCircular number 446 dated December 30, 2016, banks shouldrecord the surplus derived from sale of Treasury bills andcertificates of deposit in Lebanese Pound against investmentin medium and long term Lebanese Government bonds andcertificates of deposit in foreign currency issued by the CentralBank of Lebanon under deferred liability which is regulated innature, and shall be appropriated, among other things, afterdeducting the relevant tax liability, to collective provision forcredit risks associated with the loan book at a minimum of 2%of the weighted credit, and that in anticipation of implementationof IFRS 9 for Impairment, as and when quantified effective onJanuary 1, 2018. By virtue of this Circular, 70% of the remainingresidual surplus once recognized over time shall be treated asnon-distributable income designated and restricted only forappropriation to capital increase.
During the year 2016, as a result of several transactionsderived from the special and non-conventional deals arrangementwith the Central Bank of Lebanon, the Group received a surplusof LBP 440 billion of which an amount of LBP 22 billion wasrecognized in the statement of profit or loss. The remaining sur-plus of LBP 356 billion, net of tax in the amount of LBP 62.7 billion,was credited to “Regulatory deferred liability” under otherliabilities and deferred as restricted contribution in antici-pation of expected loss provisions that will be deemed to benecessary along with the application of IFRS 9 in accordance withthe Central Bank of Lebanon requirements as indicated above(refer to Note 9).

2016LBP’000
This account is summarized as follows:
Total surplus (Note 9) Recognized contribution Deferred regulatory liability Tax on deferred regulatory liability DEFERRED REGULATORY LIABILITY – NET OF TAX
440,416,318(22,154,654)418,261,664(62,739,249)
355,522,415
NOTES TO THE CONSOLIDATED FINANCIAL STATEMENTSFor the year ended December 31, 2016
Financial Statements
2016LBP’000 2015
2016LBP’000 2015
2016LBP’000 2015
23. PROVISIONS
Provisions consist of the following:
The movement of provision for staff termination indemnities is as follows:
Provision for staff termination indemnities Provision for contingencies Provision for loss on foreign currency positionProvision for off-balance sheet risk TOTAL
31,794,3139,573,170
258,735596,285
42,222,503
33,660,174 12,747,041
260,450 1,313,305
47,980,970
Balance January 1Additions - EmployeesAdditions - Legal expensesWrite-backSettlements BALANCE DECEMBER 31
27,322,5267,189,969
48,622 -
(2,766,804)
31,794,313
31,794,3134,543,740
- (21,470)
(2,656,409)
33,660,174
The movement of the provision for contingencies was as follows:
Balance January 1Net additions (Note 38)Write-off against devaluation of investmentSettlementsReallocation from other liabilities Effect of exchange rates changes BALANCE DECEMBER 31
10,383,677 862,616
(299,798)(193,925)
-(1,179,400)
9,573,170
9,573,170 3,795,602
-(1,329,293)
897,872(190,310)
12,747,041

FRANSABANK | ANNUAL REPORT 2016 | 106-107
2016LBP’000 2015
24. SHARE CAPITAL
At December 31, 2016 and 2015, the authorized ordinary sharecapital of the Bank was LBP 430 billion consisting of21,500,000 fully paid shares of LBP 20,000 each.
Up to 2016 year-end, the Bank has established a fixed exchangeposition in the amount of USD 118,179,889 (USD 56,988,889 upto 2015) authorized by Central Bank of Lebanon to hedge itsequity against exchange fluctuations within the limit of 60% ofequity denominated in Lebanese Pounds.
25. SHAREHOLDERS’ CASH CONTRIBUTION TO CAPITAL
The shareholders’ cash contribution to capital is for a totalamount of LBP 17.1 billion (USD 11,352,494) as at December31, 2016 and 2015 and it is subject to a yearly interest of 6%payable from unrestricted profits after securing the approvalof Central Bank of Lebanon.
This sort of financial instrument is accounted for in foreigncurrency and therefore allows hedging against nationalcurrency exchange fluctuation.
26. PREFERENCE SHARES
On September 30, 2010, the Bank issued 425,000 non-cumulativeconvertible redeemable Series “B” preference shares withnominal value of LBP 20,000 each at an issue price of USD 200per share. These shares may be redeemed within 60 days ofthe ordinary general assembly of shareholders held to approvethe accounts of the Bank for the year 2016 and within 60 daysfollowing the date of each subsequent ordinary generalassembly of shareholders held to approve the annual accountsof the Bank for the immediate preceding fiscal year. The Bankdistributed USD 13.5 per preference share Series “B” during2016 and 2015.
On December 21, 2012, the Bank issued 375,000 non-cumulativeredeemable Series “C” preference shares with nominal valueof LBP 20,000 each at an issue price of USD 200 per share.These shares may be redeemed within 60 days of the ordinarygeneral assembly of shareholders held to approve theaccounts of the Bank for the year 2017 and within 60 daysfollowing the date of each subsequent ordinary generalassembly of shareholders held to approve the annual accountsof the Bank for the immediate preceding fiscal year. The Bankdistributed USD 13.5 per preference share Series “C” during2016 and 2015.
On December 15, 2014, the Bank issued 425,000 non-cumulativeredeemable Series “D” preference shares with nominal valueof LBP 20,000 each at an issue price of USD 200 per share.These shares may be redeemed within 90 days of the ordinarygeneral assembly of shareholders held to approve the accountsof the Bank for the year 2019 and within 90 days following thedate of each subsequent ordinary general assembly of share-holders held to approve the annual accounts of the Bank forthe immediate preceding fiscal year. The Bank distributedUSD 13.5 per preference share Series “D” during 2016 andUSD 13 during 2015.
On December 2015, the Bank issued 525,000 non-cumulativeredeemable Series “E” preference shares with nominal valueof LBP 20,000 each at an issue price of USD 200 per share.These shares may be redeemed within 90 days of the ordinarygeneral assembly of shareholders held to approve the accountsof the Bank for the year 2020 and within 90 days followingthe date of each subsequent ordinary general assembly ofshareholders held to approve the annual accounts of the Bankfor the immediate preceding fiscal year. The Bank distributedUSD 13.5 per preference share Series “E” during 2016computed from the date of issuance till end of year 2015.
27. RESERVES
Reserves consist of the following:
Legal reserve (a) Reserve for general banking risks (b) Reserve for assets acquired in satisfaction of loans - Note 12 Owned buildings revaluation reserve Foreign currency translation reserveSpecial reserve (c)General reserve for performing loans (d) TOTAL
159,713,578 234,682,845
65,875,409 44,171,033
(143,910,319)9,169,252 2,150,631
371,852,429
184,877,183276,132,516
81,557,477 45,430,877
(151,481,508)9,693,062
22,541,907
468,751,514

NOTES TO THE CONSOLIDATED FINANCIAL STATEMENTSFor the year ended December 31, 2016
Financial Statements
(a) The legal reserve is constituted in conformity with therequirements of the Lebanese Money and Credit Code onthe basis of 10% of net profit. This reserve is not availablefor distribution.
(b) The reserve for general banking risks is constituted accordingto local banking regulations, from net profit, on the basis of aminimum of 2 per mil and a maximum of 3 per mil of the totalrisk weighted assets, off-financial position risk and globalexchange position as defined for the computation of the solvencyratio at year-end. The cumulative reserve should not be lessthan 1.25% at the end of the 10th year (2007) and 2% at the endof the 20th year (2017). This reserve is constituted in LebanesePound and in foreign currencies in proportion to the compositionof the Group’s total risk weighted assets and off-financialposition items. This reserve is not available for distribution.
(c)The special reserve is made based on regulatory requirements,in connection with the uncovered portion of the doubtful debtsoutstanding as at June 30, 2003.
(d) In compliance with the basic circular no. 81 issued by theCentral Bank of Lebanon, the Bank is required to transfer fromnet profit to general reserve for performing loans the equivalentof:
• 0.5% of retail loans that are less than 30 days past due(subject to deductions of some guarantees received) togeneral reserve for the year 2014 in addition to a percentageof 0.5% yearly over a six year period starting 2015.
• 0.25% of performing corporate loans to general reserve asof end of 2014. This reserve should increase to 0.5% as ofend of 2015, 1% as of end of 2016 and 1.5% as of end of 2017.The Bank is exempted from this general reserve if thebalance of collective provision is not less than 0.25% of theperforming corporate loans portfolio as of end of 2014, 0.5%as of end of 2015, 1% as of end of 2016 and 1.5% as of end of2017.
28. CUMULATIVE CHANGE IN FAIR VALUE OF FINANCIAL ASSETS
This caption represents the cumulative change in fair value of investment securities at fair value through other comprehensiveincome. It consists of the following:
Cumulative unrealized gain on investments at fair valuethrough other comprehensive income (Note 9) Less: Deferred tax liability (Note 22) Net Share of non-controlling interests (Note 29) SHARE OF OWNERS OF THE BANK
185,089,583 (18,817,491)166,272,092 (2,473,749)
163,798,343
182,860,807(18,481,666)164,379,141(1,942,988)
162,436,153
2016LBP’000 2015
29. NON – CONTROLLING INTERESTS
Non-controlling interests represent the minority share in the subsidiaries’ equities as follows:
Capital Change in fair value of investment securities through other comprehensive income (Note 28)Preference shares Reserves and retained earnings Profit for the year TOTAL
167,364,0292,473,749
195,975,00155,252,94816,472,482
437,538,209
190,763,8981,942,988
248,737,501 44,674,423 22,862,928
508,981,738
2016LBP’000 2015

FRANSABANK | ANNUAL REPORT 2016 | 108-109
The following table summarizes financial information of subsidiaries that have material Non-Controlling Interests (NCI) beforeintra-group eliminations:
NCI percentage 25.17% 32.00%Cash and banks 1,752,457,466 105,132,852Loans and advances 2,793,969,001 310,937,636Investment securities 3,736,173,120 7,290,713Foreclosed assets and investment properties 199,438,474 -Other assets 151,435,961 66,787,416Deposits from banks (41,905,644) (104,496)Deposits from customers (7,070,929,041) (292,857,693)Borrowings and subordinated bonds (411,374,820) -Other liabilities and provisions (238,065,403) (19,971,493)
NET ASSETS 871,199,114 177,214,935Carrying amount of NCI 219,280,817 56,708,779
Net financial revenues 235,388,966 26,143,912Net allowance for impairment of loans (21,558,198) 2,220,443Other income (net) 1,734,696 -Operating expenses (131,789,334) (13,785,606)Income tax expense (12,403,283) (4,079,138)Other Comprehensive Income (OCI) 1,157,840 (5,364,068)
TOTAL COMPREHENSIVE INCOME 72,530,687 5,135,543
Profit allocated to NCI 18,076,263 3,359,873OCI allocated to NCI 322,831 (1,777,984)
BLC Bankand its DirectSubsidiaries
Fransabank El Djazaïr SPA
December 31, 2016LBP’000
NCI percentage 25.17% 32.00%Cash and banks 1,492,644,455 167,717,684Loans and advances 2,880,136,463 172,687,242Investment securities 3,897,427,383 221,018Foreclosed assets and investment properties 167,243,874 -Other assets 187,522,364 48,918,903Deposits from banks (1,127,863) (99,205)Deposits from customers (6,907,917,692) (201,635,092)Borrowings and subordinated bonds (848,034,636) -Other liabilities and provisions (106,230,205) (12,505,705)
NET ASSETS 761,664,143 175,304,845Carrying amount of NCI 191,710,865 56,097,550
Net financial revenues 236,106,192 20,757,998Net allowance for impairment of loans (36,253,113) 738,696Other income (net) 12,528,899 -Operating expenses (131,303,002) (12,766,544)Income tax expense (14,568,728) (2,344,213)Other Comprehensive Income (OCI) 3,514,734 (36,982,970)
TOTAL COMPREHENSIVE INCOME 70,024,982 (30,597,033)
Profit allocated to NCI 16,674,071 2,043,500 OCI allocated to NCI 909,670 (11,731,249)
BLC Bankand its DirectSubsidiaries
Fransabank El Djazaïr SPA
December 31, 2015LBP’000

NOTES TO THE CONSOLIDATED FINANCIAL STATEMENTSFor the year ended December 31, 2016
Financial Statements
Ownersof the Bank
Non-Controlling Interests Total
30. PROFIT FOR THE YEAR
The consolidated profit is allocated as follows between the Bank and its subsidiaries (after intra-group eliminations):
TotalOwners
of the BankNon-Controlling
Interests
Income of the Bank 192,235,564 - 192,235,564 Income of subsidiaries:- Fransa Invest Bank SAL 10,863,116 - 10,863,116- Fransabank (France) SA 2,005,032 1,337,908 3,342,940- Lebanese Leasing Company SAL 1,217,188 173,884 1,391,072- Switch and Electronics Services SAL 373,596 - 373,596- Sogefon SAL (148,125) - (148,125)- Fransabank El Djazaïr SPA 4,342,437 2,043,500 6,385,937- Fransabank Insurance Services SAL 3,028,176 - 3,028,176- BLC Bank SAL and Subsidiaries 49,836,177 16,674,071 66,510,248- Express SARL 69,592 - 69,592- Fransabank Syria (5,502,667) (2,786,979) (8,289,646)- Fransabank OJSC 2,676,170 362,170 3,038,340- Kuwaiti Lebanese Company for Real Estate Services SAL - - -Deferred tax on profit from associates and subsidiaries (6,691,701) (1,332,072) (8,023,773)
254,304,555 16,472,482 270,777,037
Income of the Bank 201,407,106 - 201,407,106Income of subsidiaries:- Fransa Invest Bank SAL 11,828,806 - 11,828,806- Fransabank (France) SA 3,925,957 1,030,434 4,956,391- Lebanese Leasing Company SAL 1,366,175 195,168 1,561,343- Switch and Electronics Services SAL 379,305 - 379,305- Sogefon SAL (63,937) - (63,937)- Fransabank El Djazaïr SPA 7,139,730 3,359,873 10,499,603- Fransabank Insurance Services SAL 3,369,083 - 3,369,083- BLC Bank SAL and Subsidiaries 53,296,584 18,076,263 71,372,847- Express SARL (23,857) - (23,857)- Fransabank Syria 2,086,447 1,478,300 3,564,747- Fransabank OJSC 2,958,719 273,088 3,231,807- Kuwaiti Lebanese Company for Real Estate Services SAL - - -
Deferred tax on profit from associates and subsidiaries (7,595,874) (1,550,198) (9,146,072)
TOTAL 280,074,244 22,862,928 302,937,172
Year Ended December 31, 2015
Year Ended December 31, 2016LBP’000
LBP’000
2016LBP’000 2015
31. DIVIDENDS PAID
The following dividends were declared and paid by the Group:
LBP 2,700 per ordinary share paid by the Bank from 2015 net income (LBP 2,500 during 2015 paid from 2014 net income)
Dividends paid to preference sharesDividends paid by subsidiaries to non-controlling interests
52,500,000
29,497,59319,769,437
58,050,000
24,727,02716,648,733

FRANSABANK | ANNUAL REPORT 2016 | 110-111
2016LBP’000 2015
2016LBP’000 2015
32. INTEREST INCOME
33. INTEREST EXPENSE
235,232,701 4,375,070
214,716 682,003,635
2,764,890 619,262,404
2,584,767 14,836,403
52,056 6,009
1,561,332,651
Interest income from:Deposits with Central Banks Deposits with banks and financial institutions Deposits with related party banks and financial institutions Investment securities Loans to banks Loans and advances to customers Loans and advances to related parties Interest recognized on impaired loans and advances to customers (Note 8) Interest recognized on impaired loans transferred to off-balance sheet Other
TOTAL
Interest income realized on impaired loans and advances tocustomers represent recoveries of interest. Accrued intereston impaired loans and advances is not recognized until recovery /rescheduling agreements are signed with customers.
Interest income on investments at fair value through profit orloss is reflected separately under “net interest and other gain /(loss) on investments securities at fair value through profit orloss” (Note 36).
232,273,604 9,227,043
413,447 726,164,749
1,664,540 649,101,608
2,987,62510,775,782
75,076 8,862
1,632,692,336
Interest expense on:Deposits and borrowings from Central BanksDeposits and borrowings from banks and financial institutions Customers’ deposits at amortized cost Related parties’ deposits at amortized cost Other borrowings (Note 20) Borrowings from related party (Note 20)Subordinated loansObligation under finance lease (Note 12.4)Certificates of depositsBonds issued by bank Shareholders’ cash contribution to capital (Note 25)
TOTAL
34,330 5,032,865
927,162,068 42,144,221 31,880,923
220,956 3,168,868
325,744 248,815
6,2001,026,833
1,011,251,823
23,311 4,858,335
995,230,196 51,308,04923,937,121
180,379 2,236,993
469,809 -
7,5351,026,833
1,079,278,561
Interest expense on customers’ accounts designated at fair value through profit or loss is reflected separately on the face of theconsolidated statement of profit or loss.
2016LBP’000 2015
34. FEE AND COMMISSION INCOME
Commission on documentary credits Commission on letters of guarantee Service fees on customers’ transactions Commission on transactions with banks Asset management fees TOTAL
13,825,960 11,726,870 81,634,377
679,329 233,881
108,100,417
Fee and commission income include fee and commission from related parties with immaterial amounts.
18,091,36415,149,33184,693,236
596,554 264,811
118,795,296

NOTES TO THE CONSOLIDATED FINANCIAL STATEMENTSFor the year ended December 31, 2016
Financial Statements
2016LBP’000 2015
2016LBP’000 2015
2016LBP’000 2015
2016LBP’000 2015
35. FEE AND COMMISSION EXPENSE
36. NET INTEREST AND OTHER NET GAIN / (LOSS) ON INVESTMENTS AT FAIR VALUE THROUGHPROFIT OR LOSS
37. OTHER OPERATING INCOME (NET)
Commission on transactions with banks and financial institutions Sundry TOTAL
3,298,37620,161,335
23,459,711
Fee and commission expenses include fee and commission to related parties with immaterial amounts.
4,689,61917,739,997
22,429,616
Dividends income on investment securitiesShare in profits of associates (Note 11) Foreign exchange gain Gain on disposal of assets acquired in satisfaction of loans (Note 12.1)Change in fair value of investment properties (Note 12.4)(Loss) / gain on disposal of property and equipmentLoss on disposal of intangible assets Other operating income – Net TOTAL
3,904,459 15,879,755 17,925,292
1,090,847(2,388,213)
136,847-
6,363,237
42,912,224
Interest incomeDividends incomeNet unrealized gain / (loss)Net realized gain TOTAL
48,888,3972,446,743
(1,920,339)17,683,444
67,098,245
41,351,2232,705,091
13,265,71716,520,329
73,842,360
4,333,68915,330,578 14,396,417
1,902,300(950,806)
(79,791)(4,165)
7,414,504
42,342,726
38. PROVISIONS FOR CHARGES (NET)
Regulatory allowance for country risk – Deposit with banks (Note 6)Regulatory allowance for country risk – Loans to banks (Note 7) Write-back of impairment allowance of investment in securities (Note 9)Provision for contingencies (Note 23) TOTAL
(5,988)(24,324)
9,989 862,616
842,293
70(19,506)
7,030 3,795,602
3,783,196

FRANSABANK | ANNUAL REPORT 2016 | 112-113
2016LBP’000 2015
39. FINANCIAL INSTRUMENTS WITH OFF-BALANCE SHEET RISKS
40. BALANCES / TRANSACTIONS WITH RELATED PARTIES
The guarantees and standby letters of credit and the documentaryand commercial letters of credit represent financial instrumentswith contractual amounts representing credit risk. The guaranteesand standby letters of credit represent irrevocable assurancesthat the Group will make payments in the event that a customercannot meet its obligations to third parties and are not differentfrom loans and advances on the statement of financial position.
However, documentary and commercial letters of credit, whichrepresent written undertakings by the Group on behalf of acustomer authorizing a third party to draw drafts on the Groupup to a stipulated amount under specific terms and conditions,are collateralized by the underlying shipments documents ofgoods to which they relate and, therefore, have significantly lessrisks.
In the ordinary course of its activities, the Group conductstransactions with related parties including shareholders,directors, subsidiaries and associates. Also, the Group conducts
sale and purchase transactions of investment securities withsubsidiary banks and these transactions are made at net bookvalue of the financial instruments.
Some loans and advances are covered by real estate mortgageto the extent of LBP 2.6 billion (LBP 3.4 billion in 2015) and bypledged deposits of the respective borrowers to the extent ofLBP 17.5 billion (LBP 198 billion in 2015) and by pledgedsecurities to the extent of LBP 4.3 billion in 2015.
The remunerations to executive management amounted toLBP 39.5 billion during 2016 (LBP 38.8 billion during 2015).This includes accrued remuneration payable to the Bank’schairman and vice chairman calculated on the basis of 8% ofprofit before tax.
Term placements with banks 6 4,840,002 5,210,983Deposits from banks 17 68,603 82,963Money market deposits from banks 17 31,925,800 41,166,000Borrowings 20 3,015,000 4,522,500Direct facilities & credit balances- Loans and advances 8 46,029,582 223,032,535- Deposits at fair value through profit or loss 18 2,944,192 -- Deposits at amortized cost 19 1,857,623,063 2,044,596,684Indirect facilities- Letters of guarantees 105,121 8,408,430
Accrued interest receivable: - Loans and advances 8 17,599 74,121
Accrued interest payable: - Money market deposits from banks 17 14,116 7,077- Deposits at fair value through profit or loss 18 17,085 -- Deposits at amortized cost 19 21,864,980 18,615,693- Borrowings 20 6,831 9,068- Cash contribution to capital 25 2,806 2,813
Statement of profit or loss accounts: - Interest income from deposits with banks 32 413,447 214,716- Interest income from loans and advances 32 2,987,625 2,584,767- Interest expense on deposits at fair value through profit or loss 26,501 -- Interest expense on deposits at amortized cost 33 51,308,049 42,144,221- Interest expense on borrowings from related parties 33 180,379 220,956- Interest expense on cash contribution to capital 33 1,026,833 1,026,833
Notes
Balances and transactions with related parties are as follows:

NOTES TO THE CONSOLIDATED FINANCIAL STATEMENTSFor the year ended December 31, 2016
Financial Statements
2016LBP’000 2015
41. CASH AND CASH EQUIVALENTS
42. DISTRIBUTION BY GEOGRAPHICAL LOCATION
CashCurrent accounts with Central BanksTime deposits with Central Banks (maturities of 3 months or less)Checks in course of collectionCurrent accounts with banks and financial institutionsTime deposits with banks and financial institutions (maturities of 3 months or less)
TOTAL
230,236,685 215,865,729
1,162,077,342 37,564,503
316,431,143 972,287,325
2,934,462,727
222,382,941301,461,420
1,589,932,62318,841,036
476,502,331838,591,799
3,447,712,150
Cash and cash equivalents for the purpose of the statement of cash flows statement consist of the following:
The following non-cash transactions were excluded from thestatement of cash flows:(a) Positive change in fair value of investment securities at fair
value through other comprehensive income of LBP 826 millionand related deferred tax liability of LBP 39 million during 2016(LBP 6 billion and related deferred tax liability ofLBP 344 million during 2015).
(b) Foreclosed assets in settlement of loans in the amount ofLBP 61.5 billion during 2016 (LBP 32 billion during 2015).
(c) Transfer of LBP 3 billion from assets acquired in satisfactionof loans to property and equipment.
(d) Transfer of LBP 59 billion from Investment property to assetsacquired in satisfaction of loans.
(e) Transfer of LBP 898 million from other liabilities to provisions.(f) Change in derivative assets held to risk management in the
amount of LBP 3.5 billion.(g) Surplus of LBP 440 billion recorded under other liabilities
resulting from sale of investment securities during 2016.(h) Transfer of LBP 34 million from property and equipment to
intangible assets during 2015.(i) Write-back of provision on recovered debt recorded as
deferred asset against loans and advances in the amountof LBP 10 billion during 2015.
Below is the distribution of assets and liabilities and statement of profit or loss by geographical location of various Group entities:
42.1 Distribution of Assets and Liabilities by Geographical Location
ASSETS:Cash and banks 8,593,333,253 96,290,088 51,223,020 105,132,852 9,387,840 145,348,592 9,000,715,645Loans to banks 56,759,583 - - - 259,928 - 57,019,511Loans and advances to customers 8,447,422,658 60,355,920 471,796,805 310,937,636 39,002,723 519,573,994 9,849,089,736Investments securities 10,800,974,995 45,146,067 15,202,588 7,290,713 32,477,660 296,638,771 11,197,730,794Customers' liability under acceptances 235,751,263 - 24,639,239 24,881,633 - - 285,272,135Investments in associates 72,161,135 - - - - - 72,161,135Goodwill 54,779,898 - - - - - 54,779,898Other assets 677,887,728 23,540,769 3,290,753 66,787,416 15,508,696 134,537,259 921,552,621
TOTAL ASSETS 28,939,070,513 225,332,844 566,152,405 515,030,250 96,636,847 1,096,098,616 31,438,321,475
LIABILITIES:Deposits and borrowings from banks 125,550,080 113,518,000 41,174,150 20,971 3,104,507 2,243,404 285,611,112Customers' accounts at FVTPL 136,487,357 - - - - - 136,487,357Customers' accounts at amortized cost 23,857,926,500 137,366,713 217,236,523 292,857,693 32,870,713 963,431,630 25,501,689,772Customers' acceptance liability 235,751,263 - 24,639,239 24,881,633 - - 285,272,135Other borrowings 1,271,419,416 - - - - - 1,271,419,416Subordinated loan 25,499,664 - - - - - 25,499,664Other liabilities and provisions 683,147,932 3,481,484 4,161,502 19,971,493 321,554 14,709,047 725,793,012
TOTAL LIABILITIES 26,335,782,212 254,366,197 287,211,414 337,731,790 36,296,774 980,384,081 28,231,772,468
Lebanon Syria France Algeria Belarus Cyprus Total
December 31, 2016LBP’000

FRANSABANK | ANNUAL REPORT 2016 | 114-115
ASSETS:Cash and banks 7,350,322,477 115,852,427 58,664,142 167,717,684 14,759,335 111,798,679 7,819,114,744Loans to banks 66,799,768 - - - 4,163,807 - 70,963,575Loans and advances to customers 7,780,150,295 79,521,323 444,262,747 172,687,242 419,536,338 583,885,970 9,480,043,915Investments securities 11,089,781,839 45,238,422 15,202,265 221,018 26,453,247 261,812,857 11,438,709,648Customers' liability under acceptances 251,860,907 - 18,787,173 42,640,726 - 117,787 313,406,593Investments in associates 67,170,770 - - - - - 67,170,770Goodwill 54,965,245 - - - - - 54,965,245Other assets 708,170,897 22,511,327 1,940,605 48,918,903 15,616,443 98,915,480 896,073,655
LIABILITIES:Deposits and borrowings from banks 71,866,094 167,077,098 51,477,739 12,863 4,878,142 - 295,311,936Customers' accounts at FVTPL 48,867,277 - - - - - 48,867,277Customers' accounts at amortized cost 23,016,185,084 155,843,415 167,153,945 201,635,092 33,451,826 959,536,494 24,533,805,856Customers' acceptance liability 251,866,907 - 18,781,173 42,640,726 - 117,787 313,406,593Other borrowings 1,638,304,563 - - - - - 1,638,304,563Certificates of deposit - - - - - - -Subordinated loan 31,874,580 - - - - - 31,874,580Other liabilities and provisions 290,487,005 2,783,036 3,380,499 12,505,705 284,908 20,258,240 329,699,393
Lebanon Syria France Algeria Belarus Cyprus Total
December 31, 2015LBP’000
42.2 Distribution of Statement of Profit or Loss by Geographical Location
Net interest income 466,352,909 5,500,812 14,173,255 17,904,132 8,732,076 40,750,591 553,413,775Net fee and commission income 80,007,429 1,774,881 2,644,355 7,903,642 1,393,050 2,642,323 96,365,680Investments at fair value throughprofit or loss 63,403,115 - - - - 10,439,245 73,842,360Liabilities designated atfair value through profit or loss (3,525,103) - - - - - (3,525,103)Other operating income 37,157,001 755,162 630,370 336,138 2,962,802 445,871 42,287,344Impairment of loans and advances 9,963,607 2,344,678 (861,432) 2,220,443 (1,017,068) (20,172,888) (7,522,660)Recognized contribution 22,154,654 - - - - - 22,154,654Other expense (346,143,756) (6,828,142) (6,887,033) (13,785,606) (6,733,870) (30,576,354) (410,954,761)Income tax expense (46,281,752) (821,297) (2,490,083) (4,079,138) (305,774) - (53,978,044)Deferred tax on investeesundistributed profits (9,146,073) - - - - - (9,146,073)
TOTAL 273,942,031 2,726,094 7,209,432 10,499,611 5,031,216 3,528,788 302,937,172
Lebanon Syria France Algeria Belarus Cyprus Total
Year Ended December 31, 2016LBP’000

NOTES TO THE CONSOLIDATED FINANCIAL STATEMENTSFor the year ended December 31, 2016
Financial Statements
43. COLLATERAL GIVEN
Net interest income 464,461,101 5,547,470 12,245,389 12,816,960 7,575,661 47,434,247 550,080,828Net fee and commission income 67,689,794 1,959,089 2,305,780 7,555,325 2,186,064 2,944,654 84,640,706Investments at fair value through profit or loss 67,098,245 - - - - - 67,098,245Liabilities designated at fair valuethrough profit or loss (1,931,890) - - - - - (1,931,890)Other operating income 93,339,567 1,949,204 453,924 385,713 5,618,557 (1,266,921) 100,480,044Impairment of loans and advances (13,557,184) (11,927,572) (1,916,157) (738,696) (2,162,842) (31,656,920) (61,959,371)Regulatory allowance for countryrisk - Deposits with Central Banks (9,045,000) - - - - - (9,045,000)Income originated from contractualfuture cash flows 11,995,957 - - - - - 11,995,957Other expense (340,995,340) (6,609,037) (6,855,280) (12,766,544) (7,339,434) (29,410,298) (403,975,933)Income tax expense (53,810,291) (25,617) (1,709,318) (2,344,213) (693,337) - (58,582,776)Deferred tax on investeesundistributed profits (8,023,773) - - - - - (8,023,773)
Lebanon Syria France Algeria Belarus Cyprus Total
Year Ended December 31, 2015LBP’000
Financial assets given as collateral are as follows at December 31:
Corresponding FacilitiesRedemption Valueof Pledged Assets Nature of Facility Amount of Facility Maturity Date
Treasury bills at amortized cost 10,858,000 Soft Loan 10,858,000 September 2, 2017Treasury bills at amortized cost 774,000 Soft Loan 774,000 June 29, 2017Treasury bills at amortized cost 17,734,000 Soft Loan 17,734,000 March 21, 2019Treasury bills at amortized cost 243,589,400 Soft Loan 243,589,400 December 21, 2020Lebanese Government bonds at amortized cost 301,500,000 Exemption of 301,500,000 July 1, 2018 regulatory reserve Treasury bills at amortized cost 338,437,440 Facilities 387,050,712 Over 5 yearsTreasury bills at amortized cost 16,198,370 Facilities 423,742,597 Over 5 years TOTAL 929,091,210 1,385,248,709
December 31, 2016LBP’000

FRANSABANK | ANNUAL REPORT 2016 | 116-117
Corresponding FacilitiesRedemption Valueof Pledged Assets Nature of Facility Amount of Facility Maturity Date
Treasury bills at amortized cost 10,858,000 Soft Loan 10,858,000 September 2, 2017Treasury bills at amortized cost 774,000 Soft Loan 774,000 June 29, 2017Treasury bills at amortized cost 48,765,500 Soft Loan 48,765,500 August 11, 2016Treasury bills at amortized cost 17,734,000 Soft Loan 17,734,000 March 21, 2019Treasury bills at amortized cost 243,589,400 Soft Loan 243,589,400 December 21, 2020Treasury bills at amortized cost 300,000,000 Revolving loan from 300,000,000 December 31, 2015 Central Bank of LebanonLebanese Government bonds at amortized cost 174,267,000 Stand-by line facility 165,825,000 Up to 5 yearsLebanese Government bonds at amortized cost 198,990,000 Stand-by line facility 188,437,500 Up to 5 yearsTreasury bills at amortized cost 35,744,910 Facilities 309,124,740 Over 5 yearsTreasury bills at amortized cost 247,250 Facilities 213,696,836 Over 5 years
1,030,970,060 1,498,804,976
December 31, 2015LBP’000
44. RISK MANAGEMENT OF FINANCIAL INSTRUMENTS
Risk Management Framework
The Group is exposed to different types of risk mainly creditrisk, liquidity risk, market risk and operational risk. Theserisks are inherent in the Group’s activities but are managedthrough an ongoing process of identification, measurement,monitoring and mitigation.
The Board of Directors, the Risk Management Committee andthe Risk Management Division are responsible for overseeingthe Group’s risks, while the Internal Audit Department has theresponsibility independently to review the implemented riskmanagement process to ensure adequacy and effectiveness ofthe risk control procedures. The Risk Management Divisionensures that the capital is adequate to cover all types of risksthat the Group is exposed to and monitors compliance with riskmanagement policies, procedures and risk limits. The Groupassesses its risk profile to ensure that it is in line with theBank’s risk strategy and objectives. The Board of Directorsreceives quarterly risk reports on the Bank’s risk profile andcapital management process.
Credit Risk
Credit risk is defined as the potential that a bank’s borroweror counterparty fails to meet its obligations in accordance withagreed terms. The goal of Fransabank credit risk managementis to maximize Bank’s risk-adjusted rate of return bymaintaining credit risk exposure within the acceptable limitsconsistent with prudential thresholds stipulated by the CentralBank of Lebanon and the Banking Control Commission.Fransabank SAL manages the credit risk inherent in theentire credit portfolio as well as the risk in individual credits.The role of credit risk management is to continuously identify,measure, control, monitor, and report on credit risk to theBoard.
Management of credit risk mainly includes:
a) Identifying credit risk through implementing creditprocesses related to credit origination, analysis, approvaland review.
b) Measuring credit risk by ensuring that the Bank has enoughcapital to cover unexpected losses from its credit portfolio.
c) Mitigating credit risk by ensuring the implementation of asound internal control system and that credits areadequately collateralized.
d) Monitoring credit risk by ensuring that credit exposures arewithin internal and regulatory set limits.
e) Reporting on credit risk is realized through regular andtimely escalation of credit risk reports based on the reportinglines which are evidenced by the Bank’s organizationalchart’s hierarchal levels.
Measurement of Credit Risk
Loans and Advances to Customers
In measuring credit risk of loans and advances, the Bankconsiders the following:
• Ability of the counterparty to honor its contractualobligations based on the account’s performance, recurringoverdues and related reasons, the counterparty’s financialposition and effect thereto of the economic environmentand market conditions;
• Exposure levels of the counterparty and unutilized creditlimits granted;
• Exposure levels of the counterparty with other banks;
• Purpose of the credit facilities granted to the counterpartyand conformity of utilization by the counterparty.

NOTES TO THE CONSOLIDATED FINANCIAL STATEMENTSFor the year ended December 31, 2016
Financial Statements
In accordance with Central Bank of Lebanon circular No.58 the Group’s customers are categorized into six classificationsas described below:
Standard monitoring
CLASSIFICATION DESCRIPTION
Indicates that borrowers are certainly able to honor their commitments.Some of the indicators related to this category are: continuous cashinflows, and availability of updated financial statements.
Indicates that borrowers have an adequate ability to honor theircommitments. Major characteristics of this category are inadequatedocumentation regarding borrower’s activity and declining profitability.
Indicates that borrowers are still able to honor their commitments withthe existence of some weaknesses that may reduce ability to settle.Some indicators related to this category are delayed payments (60 to90 days), decline in profitability and cash flows, excess over limit ofmore than 10%, more than one time debt rescheduling andborrower highly relying on leverage and rising conflict amongshareholders.
Indicates that borrowers' ability to serve their commitments is inquestion and depending on the improvement of financial andeconomic conditions on the liquidation of available collateral. The maincharacteristics of this category are repetitive overdues between 90 and180 days, inability to cover interest payments for more than 6 months,remarkable decrease in cash flows and losses incurred for over threeconsecutive years. In this case, the Group considers interests andcommissions as unrealized but does not establish an allowance forimpairment.
Indicates that the Group may not be able to recover loan in full.Major indicators are no movement for over six months and borroweris unable to settle rescheduled commitments. In this case, the Groupconsiders interests and commissions as unrealized and establishedan allowance for impairment accordingly.
Indicates that commitments cannot be recovered. Some signals of thiscategory would be inexistence of collateral, low value of collateraland / or, losing contact with the borrower. In this case, the bank considersinterests and commissions as unrealized, ceases their accumulation,and provides the whole amount of the exposure’s balance.
1Follow-up2Special mention3
Substandard4
Doubtful5
Bad6

FRANSABANK | ANNUAL REPORT 2016 | 118-119
2016LBP’000 2015
2016LBP’000 2015
Loans’ classifications are assessed and updated regularly.
Note 8 discloses the distribution of loans and advances to customers by classification.
Most of customers’ exposures represent credit facilities granted to corporations which do not have external credit rating.
Loans classified in categories 1, 2 and 3 include the following past due but not impaired exposures:
Less than 30 days Between 30-60 days Between 60-90 days Between 90-180 days Beyond 180 days TOTAL
79,896,68347,546,668
124,894,11065,602,305 97,763,348
415,703,114
LebanonCyprusSyria TOTAL
361,710,03327,095,00026,898,081
415,703,114
Above past due accounts relate to Group entities operating in the following geographies:
59,850,16532,969,21136,120,56474,966,642
156,008,965
359,915,547
354,424,4473,256,6002,234,500
359,915,547
Limiting of Credit Risk
The Bank manages the levels of credit risk undertaken byplacing limits on the amount of risk accepted in relation to oneborrower, and/or groups of related borrowers. Such risk ismonitored on a revolving basis and subject to an annual ormore frequent review, when considered necessary.
Exposures to any one borrower including banks are furtherrestricted by sub-limits covering on and off-financial positionexposures. Country limit are also set by the Bank. Actualexposures against limits are monitored on a regular basis.
Debt Investment Securities and Other Bills
The risk of the debt instruments included in the investment portfolio relates mainly to sovereign risk (including Central Bank ofLebanon) to the extent of 95% in 2016 (94% in 2015).

NOTES TO THE CONSOLIDATED FINANCIAL STATEMENTSFor the year ended December 31, 2016
Financial Statements
Concentration of Credit Risk by Geographical Location (Major Financial Assets)
Other specific control and mitigation measures are outlined below:
a) Collateral:
The principal collateral types for loans and advances consistof mortgages over real estate properties and bank guarantees.
The Group will seek additional collateral from the counterpartyas soon as impairment indicators are noticed for the relevantindividual loans and advances.
b) Netting Arrangements:
The Group enters into netting arrangements with counter-parties having a significant volume of transactions in order torestrict its exposure to credit losses. These arrangements donot generally result in an offset of assets and liabilities balancesin the statement of financial position.
Financial Assets:Cash and Central Banks 7,373,613,317 152,892,698 - 124,082,696 - - 7,650,588,711Deposits with banks and financial institutions 44,895,294 157,845,587 160,537,887 822,980,401 122,087,326 41,780,439 1,350,126,934Loans to banks 56,759,583 - - 259,928 - - 57,019,511Loans and advances to customers 8,178,333,523 553,016,013 6,825,018 813,562,326 133,178,412 164,174,444 9,849,089,736Investments securities 10,688,832,550 7,290,713 36,336,752 459,213,475 6,057,304 - 11,197,730,794
TOTAL 26,342,434,267 871,045,011 203,699,657 2,220,098,826 261,323,042 205,954,883 30,104,555,686
Lebanon Middle East & Africa North America Europe Gulf Other Total
2016LBP’000
Financial Assets:Cash and Central Banks 6,122,929,928 300,557,798 - 57,226,097 - - 6,480,713,823Deposits with banks and financial institutions 116,966,894 140,429,613 98,654,395 708,905,169 258,798,395 14,646,455 1,338,400,921Loans to banks 67,160,747 (188) 314,220 3,488,796 - - 70,963,575Loans and advances to customers 7,937,570,819 394,519,397 6,635,182 858,870,268 149,204,514 133,243,735 9,480,043,915Investments securities 10,935,561,628 221,018 27,491,777 444,379,825 6,062,280 24,993,120 11,438,709,648
Lebanon Middle East & Africa North America Europe Gulf Other Total
2015LBP’000
Market Risks
Market risk is defined as the risk of losses in on and off-financialposition, arising from adverse movements in market prices.The risks subject to Market Risk include: Interest Rate Riskand Equity Risk in the trading book, Foreign Exchange Risk andCommodities Risk.
The overall authority for market risk is vested in ALCO.
Foreign Exchange Risk
Foreign exchange risk arises from the exposure on bankingassets and liabilities, denominated in foreign currencies.

FRANSABANK | ANNUAL REPORT 2016 | 120-121
December 31, 2016LBP’000
Assets and liabilities are segregated as follows by major currencies:
LBP USD Euro Other Total
ASSETSCash and Central Banks 4,661,366,148 2,454,977,134 442,409,696 91,835,733 7,650,588,711Deposits with banks and financial institutions 28,016,043 924,073,024 178,455,838 219,582,029 1,350,126,934Loans to banks 55,805,299 954,284 105,619 154,309 57,019,511Loans and advances to customers 2,576,269,250 5,725,945,280 1,108,103,871 438,771,335 9,849,089,736Investment securities 6,372,526,825 4,338,892,550 472,874,017 13,437,402 11,197,730,794Customers' liability under acceptances 453,229 228,002,689 50,892,000 5,924,217 285,272,135Investments in associates 53,430,694 18,730,441 - - 72,161,135Assets acquired in satisfaction of loans 48,730,931 167,426,309 94,394,986 168,342 310,720,568Investment properties - - 19,077,305 - 19,077,305Property and equipment 324,815,231 (1,049,974) 15,644,686 73,260,401 412,670,344Intangible assets 9,990,699 - 1,251,551 2,084,619 13,326,869Goodwill 48,903,653 - 5,876,245 - 54,779,898Other assets 70,297,086 62,276,913 7,075,024 26,108,512 165,757,535
TOTAL ASSETS 14,250,605,088 13,920,228,650 2,396,160,838 871,326,899 31,438,321,475
LIABILITIESDeposits and borrowings from banks 15,806,089 156,302,306 66,186,884 47,315,833 285,611,112Liabilities designated at fair valuethrough profit or loss - 136,487,357 - - 136,487,357Customers' accounts at amortized cost 10,245,984,078 12,623,285,572 2,093,749,270 538,670,852 25,501,689,772Customers' acceptance liability 453,229 228,002,689 50,892,000 5,924,217 285,272,135Other borrowings 1,084,342,680 185,400,347 1,676,389 - 1,271,419,416Subordinated loan - 25,499,664 - - 25,499,664Other liabilities 589,237,636 51,920,973 20,891,763 15,761,670 677,812,042Provisions 38,369,852 2,843,393 416,165 6,351,560 47,980,970
TOTAL LIABILITIES 11,974,193,564 13,409,742,301 2,233,812,471 614,024,132 28,231,772,468
NET ASSETS 2,276,411,524 510,486,349 162,348,367 257,302,767 3,206,549,007

NOTES TO THE CONSOLIDATED FINANCIAL STATEMENTSFor the year ended December 31, 2016
Financial Statements
December 31, 2015LBP’000
LBP USD Euro Other Total
ASSETSCash and Central Banks 2,961,949,018 2,875,140,596 383,338,707 260,285,502 6,480,713,823Deposits with banks and financial institutions 46,825,775 987,367,608 154,465,315 149,742,223 1,338,400,921Loans to banks 66,485,253 4,184,730 314,515 (20,923) 70,963,575Loans and advances to customers 2,225,539,849 5,892,602,357 1,055,363,794 306,537,915 9,480,043,915Investment securities 7,789,821,220 3,210,262,301 435,061,756 3,564,371 11,438,709,648Customers' liability under acceptances 150,000 237,633,523 56,065,908 19,557,162 313,406,593Investments in associates 45,199,055 21,971,715 - - 67,170,770Assets acquired in satisfaction of loans 57,627,071 142,973,949 - - 200,601,020Investment properties - - 77,443,175 - 77,443,175Property and equipment 311,835,034 68,129,152 15,906,030 (1,049,974) 394,820,242Intangible assets 10,538,518 - 39,926 2,336,456 12,914,900Goodwill 48,903,653 - 6,061,592 - 54,965,245Other assets 83,603,912 100,559,026 9,828,140 16,303,240 210,294,318
LIABILITIESDeposits and borrowings from banks 12,367,726 154,839,829 94,453,738 33,650,643 295,311,936Liabilities designated at fair value through profit or loss - 48,867,277 - - 48,867,277Customers' accounts at amortized cost 9,783,208,197 12,284,002,960 2,005,842,470 460,752,229 24,533,805,856Customers' acceptance liability 150,000 237,633,523 56,065,908 19,557,162 313,406,593Other borrowings 1,149,207,020 483,909,747 5,187,796 - 1,638,304,563Subordinated loan - 31,874,580 - - 31,874,580Other liabilities 178,279,674 71,107,761 26,820,099 11,269,356 287,476,890Provisions 34,779,558 1,508,100 1,045,378 4,889,467 42,222,503
Interest Rate Risk
Financial assets and financial liabilities are allocated by maturity bands as follows:
FINANCIAL ASSETS:Cash and Central Banks 1,269,500,152 2,832,799,277 1,450,936,830 2,097,352,452 7,650,588,711Deposits with banks and financial institutions 438,156,086 911,970,848 - - 1,350,126,934Loans to banks 317,354 15,333,157 32,669,000 8,700,000 57,019,511Loans and advances to customers 891,706,817 7,096,003,532 998,452,203 862,927,184 9,849,089,736Investment securities 543,788,703 1,544,013,514 3,110,755,690 5,999,172,887 11,197,730,794
TOTAL 3,143,469,112 12,400,120,328 5,592,813,723 8,968,152,523 30,104,555,686
FINANCIAL LIABILITIES:Deposits and borrowings from banks 40,734,023 242,480,729 - 2,396,360 285,611,112Liabilities designated at fair value through profit or loss 930,018 - 135,557,339 - 136,487,357Customers' accounts at amortized cost 2,175,141,031 23,196,340,996 120,949,283 9,258,462 25,501,689,772Other borrowings 1,411,360 459,171,396 322,070,558 488,766,102 1,271,419,416Subordinated loan - 6,374,916 19,124,748 - 25,499,664
TOTAL 2,218,216,432 23,904,368,037 597,701,928 500,420,924 27,220,707,321
Not Subjectto Interest
Less than1 Year
1 to 5Years
Over5 Years Total
December 31, 2016LBP’000

FRANSABANK | ANNUAL REPORT 2016 | 122-123
FINANCIAL ASSETS:Cash and Central Banks 1,114,682,182 2,329,680,233 1,525,275,780 1,511,075,628 6,480,713,823 Deposits with banks and Financial institutions 341,904,786 996,496,135 - - 1,338,400,921 Loans to banks 1,231,958 18,439,616 53,582,001 (2,290,000) 70,963,575 Loans and advances to customers 707,448,947 7,223,792,858 837,993,209 710,808,901 9,480,043,915 Investment securities 519,079,797 753,683,832 4,029,640,486 6,136,305,533 11,438,709,648
FINANCIAL LIABILITIES:Deposits and borrowings from banks 42,520,949 252,790,987 - - 295,311,936Liabilities designated at fair value through profit or loss 381,543 - 48,485,734 - 48,867,277Customers' accounts at amortized cost 2,100,701,532 22,368,969,257 63,174,200 960,867 24,533,805,856Other borrowings 5,179,643 1,067,145,261 317,646,704 248,332,955 1,638,304,563Subordinated loan - 7,968,645 23,905,935 - 31,874,580
Not Subjectto Interest
Less than1 Year
1 to 5Years
Over5 Years Total
December 31, 2015LBP’000
Liquidity Risk
Liquidity risk is the risk of being unable to meet net fundingrequirements. Liquidity risk can be caused by market disruptionsor credit downgrades, which may cause certain sources offunding to dry up immediately. To face this risk, managementdistributes its sources of funding and manages its assets
according to a cash policy that seeks to preserve an adequateliquidity balance and financial instruments than can be readilyliquidated in the financial market. Management manages thematurities of its assets and liabilities in a way to provide andmaintain a satisfactory liquidity ratio.
The table below shows the allocation of financial liabilities based on the earliest possible contractual maturity (undiscountedvalues). The expected maturities vary significantly from the contractual maturities, namely with regard to customers’ deposits:
FINANCIAL LIABILITIES:Deposits and borrowings from banks 179,991,028 103,223,724 - 2,396,360 285,611,112Liabilities designated at fair value through profit or loss - 930,018 135,557,339 - 136,487,357Customers' accounts at amortized cost 21,647,998,814 3,723,384,359 121,048,139 9,258,460 25,501,689,772Other borrowings 19,238,367 36,559,677 339,804,558 875,816,814 1,271,419,416Subordinated loan - 6,374,916 19,124,748 - 25,499,664
TOTAL FINANCIAL LIABILITIES 21,847,228,209 3,870,472,694 615,534,784 887,471,634 27,220,707,321
Up to3 months
3 monthsto 1 year
1 to 5years Total
Over5 years
December 31, 2016LBP’000
FINANCIAL LIABILITIES:Deposits and borrowings from banks 198,814,065 77,497,871 19,000,000 - 295,311,936Liabilities designated at fair value through profit or loss - 381,543 48,485,734 - 48,867,277Customers' accounts at amortized cost 20,779,574,150 3,674,810,994 78,459,846 960,866 24,533,805,856Other borrowings 321,383,928 423,328,486 336,134,454 557,457,695 1,638,304,563Subordinated loan - 7,968,645 23,905,935 - 31,874,580
21,299,772,143 4,183,987,539 505,985,969 558,418,561 26,548,164,212
Up to3 months
3 monthsto 1 year
1 to 5years Total
Over5 years
December 31, 2015LBP’000

NOTES TO THE CONSOLIDATED FINANCIAL STATEMENTSFor the year ended December 31, 2016
Financial Statements
45. FAIR VALUE OF FINANCIAL ASSETS AND LIABILITIES
The following table shows the carrying amounts and fairvalues of financial assets and liabilities recognized in theconsolidated financial statements, including their levels inthe fair value hierarchy. It does not include financial assets
and financial liabilities which are not measured at fairvalue and where the directors consider that the carryingamounts of these financial assets and liabilities are reasonableapproximations of their fair value:
Note CarryingAmount Level 1
FAIR VALUE
Level 2 Level 3 TOTAL
Financial Assets Measured at Fair Value:Investments at fair value through profit or loss:
Equities and preference shares 9 39,963,028 35,667,506 - 4,295,522 39,963,028Lebanese Treasury bills 9 108,942,160 - 108,942,160 - 108,942,160Lebanese Government bonds 9 80,962,632 - 80,962,632 - 80,962,632Foreign Government bonds 9 287,121,146 - 287,121,146 - 287,121,146Foreign bonds issued by banks 9 136,733,181 - 136,733,181 - 136,733,181Certificates of deposit issued by Central Bank of Lebanon 9 142,928,321 - 142,928,321 - 142,928,321Corporate bonds 9 9,517,624 - 9,517,624 - 9,517,624Mutual fund 9 9,327,904 - 9,327,904 - 9,327,904
Investments at fair value through other comprehensive income:Quoted equities 9 13,056,775 13,056,775 - - 13,056,775Unquoted equity 9 239,467,645 - - 239,467,645 239,467,645Other unquoted equities 9 44,492,408 - - 44,492,408 44,492,408
TOTAL 1,112,512,824 48,724,281 775,532,968 288,255,575 1,112,512,824
Financial Assets Measured at Amortized Cost:Term placement with Central Bank of Lebanon 5 5,774,658,786 - 5,936,535,424 - 5,936,535,424Loans and advances to banks 7 57,019,511 - 47,976,703 - 47,976,703Loans and advances to customers 8 9,849,089,736 - 9,741,398,035 - 9,741,398,035Preference shares 9 22,413,510 - 22,413,510 - 22,413,510Lebanese Treasury bills 9 2,692,689,026 - 2,692,689,026 - 2,692,689,026Lebanese Government bonds 9 3,007,239,760 - 3,007,239,760 - 3,007,239,760Foreign Government bonds 9 47,611,491 - 47,611,491 - 47,611,491Foreign bonds issued by banks 9 16,199,245 5,128,814 11,070,431 - 16,199,245Subordinated bonds 9 1,605,016 - 1,605,016 - 1,605,016Certificates of deposit issued by Central Bank of Lebanon 9 4,235,364,630 - 4,235,364,630 - 4,235,364,630Certificates of deposit issued by banks 9 40,473,949 - 40,473,949 - 40,473,949Corporate bonds 9 7,389,696 - 7,389,696 - 7,389,696Asset- backed securities 9 14,241,647 - 14,241,647 - 14,241,647
TOTAL 25,765,996,003 5,128,814 25,806,009,318 - 25,811,138,132
Financial Liabilities Measured at Fair Value:Liabilities designated at fair value through profit or loss 18 136,487,357 136,487,357 - - 136,487,357
TOTAL 136,487,357 136,487,357 - - 136,487,357
Financial Liabilities Measured at Amortized Cost:Other borrowings 19 1,271,419,416 - 1,277,991,653 - 1,277,991,653Subordinated loan 20 25,499,664 - 28,271,002 - 28,271,002
TOTAL 1,296,919,080 - 1,306,262,655 - 1,306,262,655
December 31, 2016LBP’000

FRANSABANK | ANNUAL REPORT 2016 | 124-125
9 3 3 - 4 3 9 1 - 1 - 1 9 8 - 8 - 8
9 2 - 2 - 2 9 1 - 1 - 1
9 1 - 1 - 1 9 9 - 9 - 9
9 9 - 9 - 9
9 1 1 - - 1
9 2 - - 2 2 9 4 - - 4 4
1 4 7 2 1
5 5 - 5 - 5 7 5 - 4 - 4 8 9 - 9 - 9
9 2 - 2 - 2 9 2 - 2 - 2 9 3 - 3 - 3
9 4 - 4 - 4 9 1 5 1 - 1
9 1 - 1 - 1 9 4 - 4 - 4 9 4 - 4 - 4
9 7 - 7 - 7 9 1 - 1 - 1
2 5 2 - 2
1 1 1 - - 1
1 1 - - 1
1 1 - 1 - 1
2 2 - 2 - 2
1 - 1 - 1
Note CarryingAmount Level 1
FAIR VALUE
Level 2 Level 3 TOTAL
Financial Assets Measured at Fair Value:Investments at fair value through profit or loss:
Equities and preference shares 9 37,701,873 32,658,903 - 5,042,970 37,701,873Lebanese Treasury bills 9 105,600,971 - 105,600,971 - 105,600,971Lebanese Government bonds 9 167,966,737 - 25,632,031 - 25,632,031Foreign Eurobonds issued by banks 9 180,671,358 - 180,671,358 - 180,671,358Certificates of deposit issued by Central Bank of Lebanon 9 302,290,477 - 302,290,477 - 302,290,477Mutual fund 9 3,526,818 - 3,526,818 - 3,526,818
Investments at fair value through other comprehensive income:Quoted equities 9 12,919,633 12,919,633 - - 12,919,633Unquoted equity 9 240,533,685 - - 240,533,685 240,533,685Other unquoted equities 9 38,559,325 - - 38,559,325 38,559,325
Financial Assets Measured at Amortized Cost:Term placement with Central Bank of Lebanon 5 4,587,562,527 - 4,879,895,444 - 4,879,895,444Loans and advances to banks 7 70,963,575 - 62,023,016 - 62,023,016Loans and advances to customers 8 9,480,043,915 - 9,375,287,767 - 9,375,287,767Preference shares 9 19,398,510 - 19,398,510 - 19,398,510Lebanese Treasury bills 9 3,141,117,736 - 3,121,567,483 - 3,121,567,483Lebanese Government bonds 9 2,656,092,119 - 2,667,267,088 - 2,667,267,088Foreign Government bonds 9 262,385,022 - 271,390,213 358,785 271,748,998Foreign bonds issued by banks 9 16,783,106 4,782,534 12,259,092 - 17,041,626Subordinated bonds 9 1,605,016 - 1,605,016 - 1,605,016Certificates of deposit issued by Central Bank of Lebanon 9 4,143,154,067 - 4,137,026,582 - 4,137,026,582Certificates of deposit issued by banks 9 40,547,134 - 40,472,305 - 40,472,305Corporate bonds 9 38,246,358 - 39,034,435 - 39,034,435Asset-backed securities 9 50,407,823 - 50,407,823 - 50,407,823
Financial Liabilities Measured at Fair Value:Liabilities designated at fair value through profit or loss 18 48,867,277 48,867,277 - - 48,867,277
Financial Liabilities Measured at Amortized Cost:Other borrowings 19 1,638,304,563 - 1,632,301,832 - 1,632,301,832Subordinated loan 20 31,874,580 - 35,338,753 - 35,338,753
December 31, 2015LBP’000

NOTES TO THE CONSOLIDATED FINANCIAL STATEMENTSFor the year ended December 31, 2016
Financial Statements
There have been no transfers between Level 1, Level 2 andLevel 3 during the period.
The directors consider that the carrying amounts of cash,compulsory and other short term deposits with Central Bank,
deposits from banks and accounts payable approximate theirfair values due to the short-term maturities of these instruments.For customers’ accounts, this is largely due to their short termcontractual maturities.
Valuation Techniques, Significant Unobservable Inputs, and Sensitivity of the Input to the Fair Value
The following table gives information about how the fair values of financial instruments included in the consolidated financialstatements, are determined (Level 2 and Level 3 fair values) and significant unobservable inputs used:
FinancialInstruments
Date of Valuation Valuation Technique and Key Inputs
SignificantUnobservable
Inputs
Lebanese Treasury bills 31-Dec-16/15 DCF at a discount rate determined based on the yield curve applicable to N/A Lebanese Treasury bills, adjusted for illiquidity
Certificates of deposits in LBP 31-Dec-16/15 DCF at a discount rate determined based on the yield curve applicable to N/Aissued by Central Bank Lebanese Treasury bills, adjusted for illiquidity
Certificates of deposits in foreign 31-Dec-16/15 DCF at discount rates based on observable yield curves at the N/Acurrencies issued by Central Bank measurement date
Lebanese Government bonds 31-Dec-16/15 DCF at discount rates determined based on the yield on USA Treasury bills N/A and the Credit Default Swap applicable to Lebanon subject to illiquidity factor Term deposits with 31-Dec-16/15 DCF at discount rates based on observable yield curves at the N/ACentral Bank of Lebanon measurement date Loans and advances to customers 31-Dec-16/15 DCF at discount rates based on average rate of return of the receivables N/A bearing fixed interest rate for more than one year
Foreign Government bonds 31-Dec-16/15 Quoted prices for similar assets in active markets N/A
Unquoted equity at FVTOCI 31-Dec-16/15 Income approach (DCF)
Other unquoted equities at FVTOCI 31-Dec-16/15 N/A N/A
Other borrowings 31-Dec-16/15 DCF at discount rates based on average rate of return of the payables N/A bearing fixed interest rate for more than one year
Subordinated loan 31-Dec-16/15 DCF at discount rates based on average rate of return of the payables N/A bearing fixed interest rate for more than one year
Yearly growth rate 1%; discount rate 12%; growth
rate at perpetuity 2%

FRANSABANK | ANNUAL REPORT 2016 | 126-127
46. CAPITAL MANAGEMENT
The Group manages its capital to comply with the capitaladequacy requirements set by the Central Bank of Lebanon,the Group’s lead regulator. The Group’s foreign entities are alsorequired to respect particular ratios according to the competentauthorities of supervisions.
The Group’s capital is split as follows:
Common Tier I Capital: Comprises share capital after deductionof Treasury shares, certain reserves from appropriation of
profits, retained earnings. Goodwill is deducted from Tier ICapital.
Tier I Capital: Comprises Common Tier I capital, shareholders’cash contribution to capital and preference shares.
Tier II Capital: Comprises qualifying subordinated liabilities,collective impairment allowance and cumulative change in fairvalue for investment at fair value through other comprehensiveincome.
The consolidated financial statements were approved by the Bank’s Board of Directors in its meeting held on April 27, 2017.
The Group has complied with the imposed capital requirements throughout the period.
Tier I capitalOf which: Common Tier I
Tier II capitalTotal regulatory capital Credit risk Market risk Operational risk RISK-WEIGHTED ASSETS OF CREDIT, MARKET AND OPERATIONAL RISKS Capital adequacy ratio:COMMON TIER ITIER I TOTAL CAPITAL (TIER I AND II)
2,318,904,000 1,631,062,000
202,486,0002,521,390,000
15,137,737,000587,042,000
1,382,957,000
17,107,736,000
9.53%13.55%14.74%
2,550,213,0001,812,198,000
263,224,0002,813,437,000
16,179,280,000704,664,000
1,424,620,000
18,308,564,000
9.90%13.93%15.37%
2016LBP’000 2015
47. APPROVAL OF THE FINANCIAL STATEMENTS

TOUCH THEMERIT
IN EVERYEXPANSION
TOUCH THEMERIT
IN EVERYEXPANSION
TOUCH THETOUCH THEMERIT
IN EVERYEXPANSION
TOUCH THEMERIT
IN EVERYEXPANSION

G R O U P
N E T W O R K
FRANSABANK | ANNUAL REPORT 2016 | 128-129

Bancassurance SAL
International Payment Network SAL
PARENT COMPANY
Fransabank SAL74 branches
• 21 branches in Beirut
• 26 branches in Mount Lebanon
• 10 branches in Northern Lebanon
• 7 branches in Bekaa Region
• 10 branches in Southern Lebanon
SUBSIDIARIES
ASSOCIATED COMPANIES
BLC Bank SAL (with BLC Services & BLC Finance)49 branches
• 8 branches in Beirut
• 20 branches in Mount Lebanon
• 6 branches in Northern Lebanon
• 3 branches in Bekaa Region
• 4 branches in Southern Lebanon
• 8 branches non-operational
Fransa Invest Bank SAL (FIB)
Société Générale Foncière SAL (Sogefon)
Lebanese Leasing Company SAL (LLC)
Fransabank Insurance Services Company SAL
Switch & Electronic Services SAL
Société Express SARL
Group Network
LEBANON PARENT COMPANY, SUBSIDIARIES AND ASSOCIATES
Subdivided as follows:
• 74 Fransabank branches
• 49 BLC Bank branches
• 1 branch for Fransa Invest Bank
124BRANCHES

FRANSABANK | ANNUAL REPORT 2016 | 130-131
Fransabank SAL
HEADQUARTERS
Fransabank Center, Hamra Str., P.O.Box 11-0393 Riad El Solh Beirut 1107 2803 LebanonTel (961) 1 340180/8 - (961) 1 745761/4 - (961) 3 650700Fax (961) 1 354572Cable FRANSBANKSwift FSAB LB BX Email [email protected] www.fransabank.comCall Center (961) 1 734000 - 1552Forex Tel (961) 1 343706 - (961) 1 344216Reuters FRBK
Retail@FransabankFransabank Center, Hamra Str., Ground FloorTel (961) 1 340180/8 - Fax (961) 1 740281
BEIRUTAdliehSequoia Center (facing Palais de Justice), Sami El Solh Str., Ashrafieh,Tel (961) 1 427219 - (961) 1 427203
Ain El MreissehNawrass Bldg., Opposite Ain El Mreisseh MosqueTel (961) 1 373240/1/2 | Fax (961) 1 373243
Ashrafieh (Rmeil)Akra Bldg., St. Louis Str., Rmeil Tel (961) 1 571844/499 | Fax (961) 1 446804
Ashrafieh (Sassine)Notre Dame Center, Sassine SquareTel (961) 1 203466/7 | Fax (961) 1 200651
Ashrafieh (Sodeco)Dakota Bldg., SodecoTel (961) 1 423573/4/5 - (961) 70 677360 | Fax (961) 1 423577
Bab IdrissFransabank Bldg., (Ex. Ahli International Bank Bldg.),Omar Daouk Str., Bab Idriss, Beirut Central DistrictTel (961) 1 970951 | Fax (961) 1 970952
BadaroKhatoun Bldg., Badaro Str.Tel (961) 1 387024 - (961) 1 386900/1 | Fax (961) 1 390409
BlissBliss 697 Bldg., facing the police station, Bliss StrTel (961) 1 370434 – (961) 1 371 434 | Fax (961) 1 360434
Foch Focheville Bldg., Foch Str. Beirut Central DistrictTel (961) 78 809280 - (961) 1 998230/240 | Fax (961) 1 998230
Hamra Fransabank Center, Hamra Str., 1st FloorTel (961) 1 340180/1/8 - (961) 1 750679 | Fax (961) 1 341413
Hamra (Sadat)Itani Bldg., Sadat Str.Tel (961) 1 743135/6 | Fax (961) 1 743138
JnahAssaf Bldg., Adnan El Hakim Str.Tel (961) 1 857972/3/4 | Fax (961) 1 857972
Mar Elias Metco Center, Moussaitbeh, Mar Elias Str.Tel (961) 1 818529/30 - (961) 1 817770 | Fax (961) 1 300617
Moussaitbeh Al Lou’loua Bldg., Selim Salam Str. Tel (961) 1 308791/2/3 - (961) 70 677651 | Fax (961) 1 305189
Ras El Nabeh La Cité Bldg., Bechara El Khoury Str. Tel: (961) 1 663118/119 | Fax (961) 1 663117
Saifi Andraos Bldg., El-Arz Str.Tel (961) 1 442418 - (961) 3 650703 - (961) 1 585899 | Fax (961) 1 442417
StarcoStarco Center, Bloc C, Omar Daouk Str.Tel (961) 1 367346/8 | Fax (961) 1 367350
Tabaris Saifi 311 Bldg., Fouad Chehab AvenueTel (961) 1 203422 - (961) 1 328600 | Fax (961) 1 201141
Tarik Jdide Kassar Bldg., Loubos Str.Tel (961) 1 702930/1 - (961) 3 650705 | Fax (961) 1 309090
VerdunVerdun 730 Center, Rachid Karame Str., 1st FloorTel (961) 1 788690/1/2/3/4 - (961) 3 650709 | Fax (961) 1 788691
Verdun (Mazraa)Diamond Tower, Rachid Karame Str., 1st FloorTel (961) 1 797079 | Fax (961) 1 797082
MOUNT LEBANON
Aley Said Chehayeb Bldg. (DANA), Main RoadTel (961) 5 557042/3/4 | Fax (961) 5 557046
Antelias Order Antonin Maronite Bldg., Catholicossat Armenien Str.Tel (961) 4 417240/1 | Fax (961) 4 412990
BaaklineAkram El Eid Center, El MarjTel (961) 5 303005 - (961) 5 301267 | Fax (961) 5 303006
BauchriehBakhos & Aoun Bldg., Square One CenterTel (961) 1 897490/1/2 | Fax (961) 1 898786
Bikfaya Adel Dagher Bldg., Bikfaya SquareTel (961) 4 986901/2 - (961) 70 910700 | Fax (961) 4 986903

Bourj El Brajneh Ahmad Nabbouh Bldg., Ain El Sekkeh, Dr. Hosni Jalloul Str.Tel (961) 1 453200/1 - (961) 3 740410 | Fax (961) 1 453203
Bourj HammoudHarboyan Center, Near St. Vartan Church,Bourj Hammoud entrance, 2nd FloorTel (961) 1 258101/2/3 | Fax (961) 1 264446
Chehim Wehbe Center, Main RoadTel (961) 7 241916/7 | Fax (961) 7 241921
Chiyah Tayyar Bldg., facing Moawad junctions, Ghobeiri Blvd., ChiyahNext to the Ministry of LaborTel (961) 1 279671/3 - (961) 3 740412 | Fax (961) 1 279680
ChoueifatMahmoud El Kheshen Bldg., Haret Al Oumara, Saida Main RoadTel (961) 5 431152 - (961) 5 431178 | Fax (961) 5 431183
DoraKassardjian Bldg., Dora Highway, 1st Floor Tel (961) 1 899121 | Fax (961) 1 894721
Elyssar (Mazraat Yachouh)Fransabank Bldg., Mazraat Yachouh, Bikfaya Main RoadTel (961) 4 914803/4/7 | Fax (961) 4 914805
Furn El Chebbak Saadeh Center, Facing Planete Abraj, Beirut/Damascus Str.Tel (961) 1 293025/6 | Fax (961) 1 293027
Galerie Semaan Hadath, Galerie Semaan Bldg. & Str. Tel (961) 5 957657 - (961) 5 954630 | Fax (961) 5 954632
Hadath Bechara Beik Karam Str., Al Saha, Near Al Saydeh Church, Main RoadTel (961) 5 463975/7 | Fax (961) 5 463980
Hazmieh Unigroup Bldg., Sayyad SquareTel (961) 5 459602 - (961) 5 450350 | Fax (961) 5 457312
Jal El Dib Le Baron Center, Jal El Dib Highway, 1st FloorTel (961) 1 889884/5 | Fax (961) 1 902959
Jbeil Byblos Sun Bldg., Jbeil RoundaboutTel (961) 9 945108 - (961) 3 650719 | Fax (961) 9 540968
Jdeideh Barbar Bou-Jawdeh Bldg. & Str., 1st FloorTel (961) 1 881680 | Fax (961) 1 883891
JouniehSaint Paul Center, P.T.T. Str.Tel (961) 9 830190/1 | Fax (961) 9 830192
KaslikDamaa Center, Zouk HighwayTel (961) 9 210769 | Fax (961) 9 210773
Mansourieh Maalouf Center, Opposite P.T.T., Main RoadTel (961) 4 409840/1 | Fax (961) 4 409840
Mreijeh Chahine Bldg., Hadi Nasrallah Blv.Tel (961) 1 469014/015/016 | Fax (961) 1 469006
SarbaAntoine & Youssef Kallas Bldg., Sarba HighwayTel (961) 9 640293 - (961) 9 640060 | Fax (961) 9 640543
Sin El FilKibinian & Kazangian Bldg., Delta Center, Horch TabetTel (961) 1 510571/2/3 - (961) 3 650708 | Fax (961) 1 481680
Zouk Zouk Mosbeh, Jeita Main RoadTel (961) 9 217271/2/3 | Fax (961) 9 219696
NORTH
ChekkaRagheb Center, Main RoadTel (961) 6 540642/3 | Fax (961) 6 545035
Dahr El Ain Michel Frangieh Bldg., Main Road Dahr El Ain, KouraTel (961) 78 809580/680 | Fax (961) 6 418860/1
HalbaMarwan Ibrahim Bldg., Main RoadTel (961) 6 693330/1/2 | Fax (961) 6 692001
Meryata Ayoush Bldg., Ardeh Str.Tel (961) 6 255560/1/2 | Fax (961) 6 255564
Tripoli (Abou Samra)Sayadi Bldg., Saadoun SquareTel (961) 6 424617/9 | Fax (961) 6 424611
Tripoli (Al Mina)Hassan & Hassane Abbas Bldg., Bawabet Al Mina Str.Tel (961) 6 611524 - (961) 6 611249/50 | Fax (961) 6 611250
Tripoli (Gemmayzat)Fattal Bldg., Gemmayzat Str.Tel (961) 6 430012/3 | Fax (961) 6 625735
Tripoli (Maarad)Ordre des Ingénieurs Bldg. , « Damm et Farez » DistrictTel (961) 78 809780 | Fax (961) 6 411514
Tripoli (Tell)Gaston Habib Bldg., Kayal SquareTel (961) 6 442815 - (961) 6 441881/2 | Fax (961) 6 441881/2
Zgharta El-Kareh & Zakhia Center, Road 1, Zgharta El-AbbehTel (961) 6 667951/2/3 - (961) 70 676255 | Fax (961) 6 667956
BEKAA
Baalbeck Mohammad Said El Lakiss Bldg., Ras Al-Ayn, Main RoadTel (961) 8 378800/1/2 - (961) 8 371800/1 | Fax (961) 8 370379
BednayelAli Fouad Sleiman Bldg., Main RoadTel (961) 8 911124/5 | Fax (961) 8 911124
Group Network

Chtaura Haddad Bldg., Main RoadTel (961) 8 541988 - (961) 8 542498 | Fax (961) 8 543843
Laboue Near Laboue Square, Main RoadTel (961) 8 230801/2/3 | Fax (961) 8 230805
RiyakHosch Hala, Main RoadTel (961) 8 900333/444/555 | Fax (961) 8 900107
Zahle (Barbara)Ghossain Bldg., St. Barbe Str.Tel (961) 8 811060 - (961) 8 803715 | Fax (961) 8 822335
Zahle (Warde)Warde Center, Main RoadTel (961) 8 803566 - (961) 8 821411 | Fax (961) 8 810187
SOUTH
Bint JbeilFransabank Bldg., Saf El-Hawa, Main RoadTel (961) 7 450701/2/3/4 - (961) 3 239092 | Fax (961) 7 450701
Ghazieh Khalifeh Center, Ghazieh, Main RoadTel (961) 7 224430/60 | Fax (961) 7 224480
Hlalyeh Bdeir Bldg., Chammah Str., New Majdelyoun HighwayTel (961) 71 255585 - 71 255570 | Fax (961) 71 515132
Jezzine St. Therese Center, Jezzine HighwayTel (961) 7 780941 - (961) 7 780052 | Fax (961) 7 780941
MarjeyounFarid Hamra Bldg., Main RoadTel (961) 7 830139/140 - (961) 3 334923 | Fax (961) 7 830139
Nabatieh Kodeih Center, Sabbah Str.Tel (961) 7 760258 - (961) 7 764264 | Fax (961) 7 761750
NakouraHamzeh Bldg., Near UNIFIL, Main Road, 1st FloorTel (961) 7 460235/6/7 - (961) 3 067702 | Fax (961) 7 460236
Saida Fransabank Bldg., Riad El Solh Str.Tel (961) 7 722180/1 - (961) 3 650701 | Fax (961) 7 721194
TyrAbou Saleh Bldg., Senegal Str., Tyr Main Entrance, 1st FloorTel (961) 7 345253 - (961) 7 345315 | Fax (961) 7 345308
Tyr (Abbassieh)Khalaf Bldg., Jal El Bahr, Main RoadTel (961) 7 740388 - (961) 7 740486 | Fax (961) 7 740084
OFF-PREMISES ATMs
Beirut
• Achrafieh, ABC Mall• Adlieh, General Security• American University of Beirut• Basta, Main cross road of Saleh Bin Yehya• Beirut Central District, UFA Insurance• Mar Elias, Caserne El Helou• Verdun, Verdun 732 Center
Mount Lebanon
• Aley, Obeid Supermarket Kabrechmoun• Aoukar, US Embassy• Bauchrieh, Chaer Center• Bourj Hammoud, Total Medawar• Dbayeh, Club La Marina• Faraya, Mema Gas Station• Ghazir, Açaf Flora• Hazmieh, City Center Beirut• Jbeil, Cordahi Center• Jounieh, Caliprix Supermarket• Yarzeh, Ministry of Defense
North
• Ehden, Sérail Hotel • Kalamoun, Miramar Hotel• Ordre des Avocats de Tripoli et du Liban Nord
Bekaa
• Zahle, Tell Chiha Hospital
South
• Nakoura, United Nations Center• Rmeich, Choufani Center• Tyr, Electricité du Liban
FRANSABANK | ANNUAL REPORT 2016 | 132-133

LEBANON – SUBSIDIARIES & ASSOCIATES
BLC BANK SAL
BLC Bank Bldg., Adlieh SquareP.O.Box 11-1126 Beirut, LebanonTel (961) 1 387000
(961) 1 429000Fax (961) 1 616984Email [email protected] www.blcbank.com
FRANSA INVEST BANK SAL (FIB)
Fransabank Center, Hamra Str., 1st FloorP.O.Box 11-0393 Riad El Solh Beirut
1107 2803, LebanonTel (961) 1 745978/9Fax (961) 1 351030Email [email protected] www.fibleb.com
LEBANESE LEASING COMPANY SAL (LLC)
Fransabank Center, Hamra Str., 2nd Floor P.O.Box 11-0144 Beirut, LebanonTel (961) 1 738610/1/2/3
(961) 1 750310/1Fax (961) 1 738614Email [email protected]
BANCASSURANCE SAL
Semiramis Bldg., Weygand Str., Bab ldriss,4th Floor (opposite to Beirut Souks)P.O.Box 11-6729 Beirut, LebanonTel / Fax (961) 1 960 100Email [email protected] www.ebancassurance.com
SOCIÉTÉ GÉNÉRALE FONCIÈRE SAL (SOGEFON)
Fransabank Center, Hamra Str., 6th Floor P.O.Box 11-0393 Riad El Solh Beirut
1107 2803, LebanonTel (961) 1 749418Fax (961) 1 340180 - Ext. 1816
FRANSABANK (FRANCE) SA
Headquarters & Main Branch104, Champs-Elysées Avenue, 75008 Paris, FranceTel (33) 1 53 76 84 00Fax (33) 1 45 63 57 00Swift FRAF FR PPEmail [email protected] www.fransabank.fr
FRANSABANK EL DJAZAÏR SPA
Headquarters & Main Branch45B, Lot Petite Provence, Sidi Yahia, Hydra, 16405, Algiers, AlgeriaTel (213) 21 48 12 96 / 21 48 27 48 - HeadquartersTel (213) 21 48 00 29 / 21 48 02 12 - Main BranchFax (213) 21 60 66 06 Swift FSBK DZ ALEmail [email protected] www.fransabank.dz
New Headquarters & New Main Branch(under construction)Résidence des Pins, Bloc A, Commune de Chéraga, Algiers, Algeria
Oran Cité Dar El Beida, Cooperative El-Zouhour, no.12, Oran, AlgeriaTel (213) 41 46 09 06 / 41 46 07 02Fax (213) 41 46 07 05
ConstantineCité Ali Besbes, Lot G no 23, Sidi Mabrouk, Constantine, AlgeriaTel (213) 31 62 93 66 / 31 62 96 28Fax (213) 31 63 06 40
BlidaAvenue Mokhtar Kertli, Lotissement Les Palmiers no. 01, Blida, AlgeriaTel (213) 25 22 47 61/69/71, (213) 25 22 48 04 / 42 60 Fax (213) 25 22 48 29
Setif Nouvelle zone urbaine secteur A, lotissement 06 N.65 (boulevard des entrepreneurs), Sétif, AlgeriaTel (213) 36 51 41 57, (213) 36 51 35 98, (213) 36 51 41 35 Fax (213) 36 51 44 14
FRANCE
ALGERIA
Group Network
OVERSEAS SUBSIDIARIES AND BRANCHES

FRANSABANK | ANNUAL REPORT 2016 | 134-135
BELARUS
FRANSABANK OJSC
MinskHeadquarters & Main Branch95A, Nezavisimosty Avenue,220012 Minsk, Republic of BelarusTel (375) 17 389 36 36 Fax (375) 17 389 36 37Swift GTBN BY 22Email [email protected] www.fransabank.by
Branch 1 4 Kalvariyskaya Str., 220004 Minsk, Republic of BelarusTel (375) 17 389 37 57 Fax (375) 17 210 07 15
Branch 2 9 Dombrovskaya Str., 220140, Minsk, Republic of BelarusTel (375) 17 389 37 47Fax (375) 17 313 29 08
Branch 37 Jinovitcha Str., 220124, Minsk, Republic of BelarusTel (375) 17 389 37 77, (375) 29 344 82 07
Gomel5A Krasnoarmeiskaya Str., 246017 Grodno, Republic of BelarusTel (375) 15 277 35 30Fax (375) 15 277 04 06
BrestBranch 116 Masherova Ave, 224035 Brest, Republic of BelarusTel /Fax (375) 16 250 88 35
Branch 246 Sovetskaya Str., 224005 Brest, Republic of BelarusTel/Fax (375) 16 220 99 51
Lida12, Knyaza Gedimina Blvd., 231291 Lida, Republic of BelarusTel (375) 15 452 88 58Fax (375) 15 460 61 37
IRAQ
FRANSABANK SAL, IRAQ BRANCHES
Erbil Headquarters & BranchSt. 100m, Facing Cristal Erbil Hotel, Kurdistan Region, IraqTel (964) 750 760 9118 / (964) 771 822 9164
(964) 751 751 3030 / (964) 751 046 0516 Email [email protected]
[email protected]@fransabankiraq.com
Baghdad Dr. Salman Faek Str., Al Wahad District 902/14, Bldg. no 48Karrada, Baghdad, IraqTel (964) 771 822 9163 / (964) 781 452 6312
(964) 781 452 6321 / (964) 772 917 8437Email [email protected]
CYPRUS
USB BANK PLCSUBSIDIARY OF BLC BANK
Headquarters 83 Digeni Akrita Avenue, 5th Floor, 1070 Nicosia, CyprusTel (357) 22 88 33 33Fax (357) 22 87 58 99Swift UVNK CY 2NEmail [email protected] www.usbbank.com.cy
14 branches subdivided into 5 branches in Nicosia3 branches in Limassol3 branches in Paphos2 branches in Famagusta 1 branch in Larnaca

Group Network
SUDAN
UNITED CAPITAL BANK
Headquarters & Main Branch Plot 411, Square 65, Mamoun Beheiry Str., South the Green SquareP.O.Box 8210 Al Amarat, Khartoum, SudanTel (249) 183 24 77 00 - Headquarters Fax (249) 183 23 50 00 - Headquarters Fax (249) 183 24 84 90 - Main BranchSwift CBSK SD KHEmail [email protected] www.bankalmal.net
Khartoum Plot 130, Square 8, Industry Str., Khartoum North (Bahri)P.O.Box 1173 Khartoum, SudanTel (249) 185 32 44 80 Fax (249) 185 32 40 01
RabakPlot 390, Square 3, RabakP.O.Box 203 Rabak, SudanTel (249) 572 82 94 80Fax (249) 572 82 94 81
Omdurman Plot 6, Square 4/5, Alarda North, South Hilal Stadium, OmdurmanP.O.Box 1500 Khartoum, SudanTel (249) 183 73 19 99 Fax (249) 183 73 19 98
IVORY COAST (ABIDJAN)
FRANSABANK SAL
Acacias Bldg., Clozel Str. - Plateau, Abidjan, Ivory CoastTel (225) 57 07 42 75 / (961) 3 23 58 03Fax (225) 20 24 26 82Email [email protected]
CUBA (HAVANA)
FRANSABANK SAL
Calle 72 n 505 e/5ta - AVE. y 5ta A, Miramar Playa - Ciudad de la Havana - CubaTel (537) 204 92 72 / 204 93 05/6Fax (537) 204 92 73Email [email protected]
UAE (ABU DHABI)
BLC BANK SAL
Khalidiya Park Bldg., 1st Floor, Khalidiya Str.P.O. Box 6204, Abu Dhabi, UAETel (971) 2 65 05 777Fax (971) 2 65 05 778Email [email protected] www.blcbank.com
REPRESENTATIVE OFFICESOVERSEAS ASSOCIATE

FRANSABANK | ANNUAL REPORT 2016 | 136-137

This page was intentionally left blank.