Embed Size (px)
Citation preview

FRCR/MSc_US1 AJW - 2014
Diagnostic Ultrasound
Amanda Watson
Ultrasound PhysicsDepartment of Clinical Physics
F-Block BasementWestern InfirmaryGlasgow G11 6NT
0141 211 2129
Vascular Laboratory, L9, WIG0141 211 2551

FRCR/MSc_US1 AJW - 2014
Week 1 – Basics to B-Mode, SafetyRITI 8a_120,121,122,123
Week 2 - Doppler Ultrasound, ArtefactsRITI 8a_129, 130, RITI 8a_134
Week 3 (March) – FRCR only - Multiple choice

FRCR/MSc_US1 AJW - 2014
Ultrasound in context
http://www.england.nhs.uk/statistics/wp-content/upl oads/sites/2/2013/04/KH12-release-2012-13.pdf

FRCR/MSc_US1 AJW - 2014
Same phenomenon as audible sound (non-ionising!)
Mechanical vibrations of particles of the medium of propagation
Propagates through tissue as a longitudinal wave� Particles do not move through the medium - they oscillate about
their mean positions in the direction of sound propagation� Energy is transferred as kinetic energy of particles
Beyond human perception i.e. > 20 kHz
Most clinical applications use ultrasound in the range 2 to 15 MHz
Fundamental Principles – What is Ultrasound?

FRCR/MSc_US1 AJW - 2014
Sound travels in the form of a wave.Sound waves transmit vibrational energy
Tissue transmits longitudinal waves
Wave motion leads to regions of compression and rarefraction - “peaks”and “troughs”
The transducer is essentially a vibrating piston in contact with tissue.
Mechanical Pressure Waves
λλλλ = c/f
Wavelength/Frequency is an important parameter in ultrasound as it is related to the spatial resolution of ultrasound.
Penetration of ultrasound is also frequency dependent.

FRCR/MSc_US1 AJW - 2014
The Speed of Sound, c, is a property of the material that the sound is propagating through.
c = √√√√(K/ρρρρ)Where K is the bulk modulus (stiffness) of the material and ρρρρ is the density (weight per unit volume)
Speed of Sound
Material Speed of Sound (m/s)
Air 330 Water 1480
Fat 1460 Liver 1555 Blood 1560 Kidney 1565 Bone 3190 - 3406
Average Soft Tissue
1540
Ultrasound machines are calibrated with an “average soft tissue” speed of sound of 1540 m/s .
This allows the position of echoes to be determined using the Range Equation

FRCR/MSc_US1 AJW - 2014
Ultrasound: The Pulse Echo Principle

FRCR/MSc_US1 AJW - 2014
The Pulse-Echo Technique
Pulses are needed to give positional information
Use the Range Equation!

FRCR/MSc_US1 AJW - 2014
2
cTD =
The Pulse-Echo Technique
The Range Equation - the round-trip time for an echo at a d istance D from a pulse transmitter is T = 2D/c where c is the spee d of sound.

FRCR/MSc_US1 AJW - 2014
Time or Depth Gain Compensation - weak echoes at depth may need to be boosted and strong echoes near the surface may need to be suppressed.

FRCR/MSc_US1 AJW - 2014
Swept Gain CompensationSwept gain, compensates for the loss of signal at depth due to
attenuation. The scanner will perform this automatically.
TGC or DGC slider controls allow the user to apply local amplification of suppression of signals. It can be useful for minimizing bright signals close to the surface

FRCR/MSc_US1 AJW - 2014
A plot of the amplitude of the signal along one beam is known as A-Mode . This technique is sometimes used in ophthalmology.
Alternatively the different signal amplitudes and positions can be represented by “dots” of grey with the shade of grey dependant on the signal amplitude

FRCR/MSc_US1 AJW - 2014
B- Mode
In B-mode each peak of intensity is represented by a dot. The intensity or brightness of the dot depends on the amplitude. An image may be built up by sweeping a beam through a plane of tissue to build up a single “frame” of an image. If the sweeping is done fast enough, then the image will be able to respond to changes occurring in the scan plane in real time.

FRCR/MSc_US1 AJW - 2014
The rate of sweeping is the frame rate
The number of beam positions making up the image is the beam density or number of scan lines

FRCR/MSc_US1 AJW - 2014

FRCR/MSc_US1 AJW - 2014
If a single B-Mode scan line is fixed in space, then the echoes can be mapped in time. This is known as M-Mode and is used for assessing moving structures - Cardiology

FRCR/MSc_US1 AJW - 2014
Ultrasound Generation, Detection, Focusing and Resolution

FRCR/MSc_US1 AJW - 2014
Transducer Technology
PiezoelectricityTransducer ConstructionArrays and beam-forming Resolution/Penetration limitations

FRCR/MSc_US1 AJW - 2014
Piezoelectricity
Ultrasound transducers contain a piezoelectric ceramicor crystal - usually lead zirconate titanate, PZT.The piezoelectric effect is the conversion of electrical energyinto mechanical energy (movement).
Receive Transmit

FRCR/MSc_US1 AJW - 2014
Transducer Construction
The transducer will have a resonant frequency or frequency bandwidth at which it is most efficient. Depends on the thickness of the element. λ = 2 x thickness
Backing material produces dampening to shorten pulse lengths.
The impedance of the transducer differs greatly from that of tissue so the front face must be “matched ” to improve transmission - quarter wavelength matching is used.
Coupling gel is important to eliminate reflections from air between the transducer face and the skin

FRCR/MSc_US1 AJW - 2014
Frequency, Bandwidth and Resolution
The bandwidth is the spread of frequencies contained within a pulse.
Longer pulses give a “purer tone” i.e. just one frequency … but the pulse length will affect the axial resolution

FRCR/MSc_US1 AJW - 2014
Axial Resolution
Axial resolution depends on the pulse duration (PD)
PD = N / f
where N is the number of cycles in the pulse and f is the frequency
Good dampening and higher frequencies give shorter pulse lengths
FRCR/MSc_US1 AJW - 2014
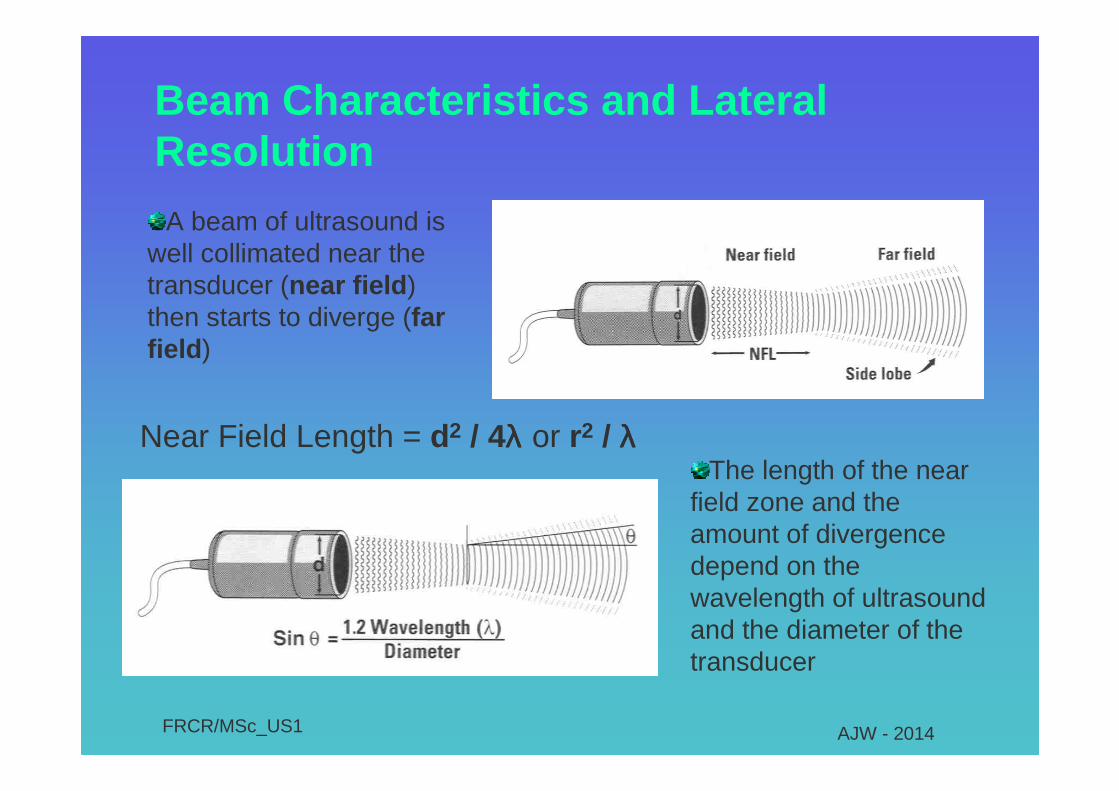
Beam Characteristics and Lateral Resolution
A beam of ultrasound is well collimated near the transducer (near field ) then starts to diverge (far field )
The length of the near field zone and the amount of divergence depend on the wavelength of ultrasound and the diameter of the transducer
Near Field Length = d2 / 4λλλλ or r2 / λλλλ

FRCR/MSc_US1 AJW - 2014
Beam Shape and Lateral Resolution
The beam shape will therefore depend on the wavelength (or frequency) and size of the transducer.
Lateral resolution is determined by the beam shape
The beam width can be made more narrow by focusing and electronic beamforming

FRCR/MSc_US1 AJW - 2014
Electronic scanning using arrays
Electronic scanning produces well defined narrow beams of ultrasound.
A: A beam is formed from a group of elementsB: One element is dropped from the right and one picked up on the left.

FRCR/MSc_US1 AJW - 2014
Dynamic Apertures
Varying the number of elements used to form the beam helps control the beam width at depth.

FRCR/MSc_US1 AJW - 2014
Phased Arrays have asmall “footprint” butuse electronic beam steering to give a widefield of view.

FRCR/MSc_US1 AJW - 2014
Conventional Focusing
Focusing narrows the beam and locally improves lateral resolution

FRCR/MSc_US1 AJW - 2014
Electronic Focusing
The use of electronic arrays makes it easy to focus at different depths to improve the image quality.
Transmit focusing
Receive focusing

FRCR/MSc_US1 AJW - 2014
To have three focal zones on at the one time would mean threesweeps for each complete frame this will slow down the frame rate.
OK for relatively still tissues but not so good for movingstructures - e.g. heart, foetus.
Multiple Focal Zones

FRCR/MSc_US1 AJW - 2014
Beam Dimensions - Summary
Lateral resolution is determined by the beam shape which depends on frequency, and beamforming(focus, aperture size)
Axial resolution depends on pulse length which depends on frequency and number of cycles
Slice thickness depends on element height i.e. transducer construction

FRCR/MSc_US1 AJW - 2014
Temporal Resolution & Frame Rates
As ultrasound imaging is a real time technique, the frame rate is important. But there often is a trade off between image quality and frame rates e.g. multiple focal zones.
Many image enhancement features require more time for processing >> they can compromise the real time nature of ultrasound.
T = 2D/c = 13µs x D

FRCR/MSc_US1 AJW - 2014
Frame rate
A deeper image requires more time to process each scan line - so slower frame rates
More scan lines will give a better image but slower frame rates
A wider field of view with the same image quality will give a lower frame rate.

FRCR/MSc_US1 AJW - 2014
Frame Rates

FRCR/MSc_US1 AJW - 2014
Frame Rates

FRCR/MSc_US1 AJW - 2014
Reflection and Scatter

FRCR/MSc_US1 AJW - 2014
Ultrasound in TissueAs an ultrasound wave propagates through tissue, it is attenuated.
Attenuation is caused by
•Absorption
•Reflection•Refraction•Scattering
Ultrasound images rely on the ultrasound being reflectedfrom the underlying tissue.
Reflection may be total or partialPartial reflection may be specular or diffuseScattering gives characteristic “texture”
In soft tissue, absorption account for up to 90% of the total attenuation of the ultrasound beam. Absorption falls off exponentially with distance, the same fraction of the incoming energy is lost in each unit distance travelled.

FRCR/MSc_US1 AJW - 2014
12
12
ZZ
ZZr
+−=
The amount of reflection depends on the different valuesof impedance, Z, of the tissues.
The pressure amplitude reflection coefficient, r
For intensity use R=r 2
cZ ×= ρ
density Speed of sound
Interface r MUSCLE/BLOOD 0.07%
FAT/MUSCLE 1.08%
SOFT TISSUE/WATER 0.23%
SOFT TISSUE/AIR 99.9%
SOFT TISSUE/BONE 41.2%
Low values of r mean that the ultrasound can penetrateto the tissues below.
High values mean most is reflected
Non-perpendicular reflective interfaces cause refraction
KZ ⋅= ρ
c = √√√√(K/ρρρρ)

FRCR/MSc_US1 AJW - 2014
Non-perpendicular reflection/transmission causes reflections and transmission at different angles.
sin θθθθ2/sin θθθθ1 = C2/C1
θ2
θ1
Non-perpendicular reflection/transmission also causes refraction at the interface i.e. a change of direction

FRCR/MSc_US1 AJW - 2014
Scattering gives tissues their characteristic “texture” inthe ultrasound image.
•Hyperechoic - higher scattering levels than the surrounding
•Hypoechoic - lower scattering levels than the surrounding
•Rayleigh scatterers -much smaller than the wavelength

FRCR/MSc_US1 AJW - 2014
is the process by which some of the mechanical energy of the ultrasound is converted into heat in the tissues.
In soft tissue, absorption account for up to 90% of the total attenuation of the ultrasound beam. Absorption falls off exponentially with distance, the same fraction of the incoming energy is lost in each unit distance travelled.
The absorption coefficient µa depends on the characteristics of the medium and is also approximately proportional to ultrasound frequency.
The intensity, I, at a distance x can be expressed by:
I=I0exp(- µa x) where I0 is the initial intensity at x = 0,
Absorption

FRCR/MSc_US1 AJW - 2014
This parameter takes account of Absorption and Scattering
The attenuation coefficient is proportional to frequency (some cases closer to f2). As with the absorption coefficient it is expressed in decibels.
Medium αααα (dB/cm/MHz) HVL at 3 MHz (cm) Blood 0.2 5 Liver 0.6 1.7
Muscle 1 1
Fat 0.4 – 1.4 2.5 – 0.7
Bone 22 0.04
Water 0.0022 (dB/cm/MHz2) 150 Air 1.6 (dB/cm/MHz2) 0.2
Ultrasound Attenuation Coefficient
Lower frequencies can penetrate further than higher frequ encies

FRCR/MSc_US1 AJW - 2014
But remember the relationship between frequencyand wavelength?
c = f *λλλλ
High frequencies have smaller wavelengths whichmeans they have narrower beam widths and can be used to image smaller targets. i.e. They have better resolution.
Generally: Penetration Resolution
Penetration Resolution
Resolution vs. Penetration Trade - Off

FRCR/MSc_US1 AJW - 2014
The B-Scanner

FRCR/MSc_US1 AJW - 2014
Signal Processing
Beamformer and pulserTransmit powerAmplification and gainDemodulation and rejectionDigitisation, dynamic range and CompressionScan ConverterSummary of scan controlsIntroduction to tissue harmonic imagingSpatial compounding

FRCR/MSc_US1 AJW - 2014
Signal Processing – How to make an image
For each received echo weneed to know two things:
� Where it comes from• Range equation,
received beam
� What shade of grey togive it
• Dynamic range, compression

FRCR/MSc_US1 AJW - 2014
Signal Processing
Transmitter or PulserProvides the electrical signal for the excitation of the transducer. The amplitude of the output pulses may be controlled by the user using the Output Power Control

FRCR/MSc_US1 AJW - 2014
Receiver and Processing
Amplification - Pre-amplification will have already been completed in order to make very small signals large enough for further processing and to protect the amplifier from excessively large signals.
Digitisation – in modern scanners is done at an early stage making the processing of signals into images much faster.
The degree of amplification is known as the gain.
Digitisation

FRCR/MSc_US1 AJW - 2014
GainOverall Gain
Swept Gain or CompensationAutomatically compensates for the attenuation at depth

FRCR/MSc_US1 AJW - 2014
Dynamic Range and CompressionThe dynamic range of image display devices (i.e. the number of different shades of grey that can be displayed) is considerably lower than the dynamic range that can be handled by the receiver. The signal therefore has to be compressed (large signals reduced and small signals boosted) to make it suitable for display.

FRCR/MSc_US1 AJW - 2014
60dB 40dB
High dynamic range gives more greysLower dynamic range gives more contrast

FRCR/MSc_US1 AJW - 2014
Scan Converter
The memory device in which images are formed, stored, made suitable for "real-time" display on a monitor or for output to various hard-copy devices.
The digital matrix is a straight forward rectangular array for linear transducers e.g. one column of pixels for each element or beam.
Curved or phased arrays and any beam steering require more complex vector considerations to form the image. Widely spaced scan lines will require interpolation i.e. the pixels in between lines will be assigned an average value based on the surrounding pixel values.

FRCR/MSc_US1 AJW - 2014
Summary of Image Controls
Patient DetailsApplication Preset TransducerFrequency(Monitor)DepthFocal zones (number and position)GainsOutput PowerDynamic rangeZoom (read and write)

FRCR/MSc_US1 AJW - 2014
Tissue Harmonic Imaging
Harmonic imaging is a technique that takes advantage of the fact that as the ultrasound propagates in tissue, the waveform within the pulse is distorted so that the returning echoes will contain, not just the fundamental frequency, but a small amount of signal at twice the fundamental frequency i.e. the first harmonic frequency.
direction of propagation
Pure Tone Increasing Harmonics
C+∆C
C-∆C
C~1.5 km/s

FRCR/MSc_US1 AJW - 2014
fo 2fo
C onven tion a l Im aging :reverb no ise a t fo= > ____
H arm onic Im aging :R ece iver rem oves fo
& reverb n o ise
Spectral analysis allows the first harmonic (2 x fundamental) frequency to be extracted from the receive signal.
The harmonic signal has not suffered from the aberrations and distortions of subcutaneous fat and is a “cleaner” signal.

FRCR/MSc_US1 AJW - 2014
Conventional imaging ignores the harmonic content and displays the fundamental. Reverberations from the ribs will appear below the ribs.
Harmonic imaging will only display the information from below the ribs - cutting out the reverberation clutter.
FRCR/MSc_US1 AJW - 2014
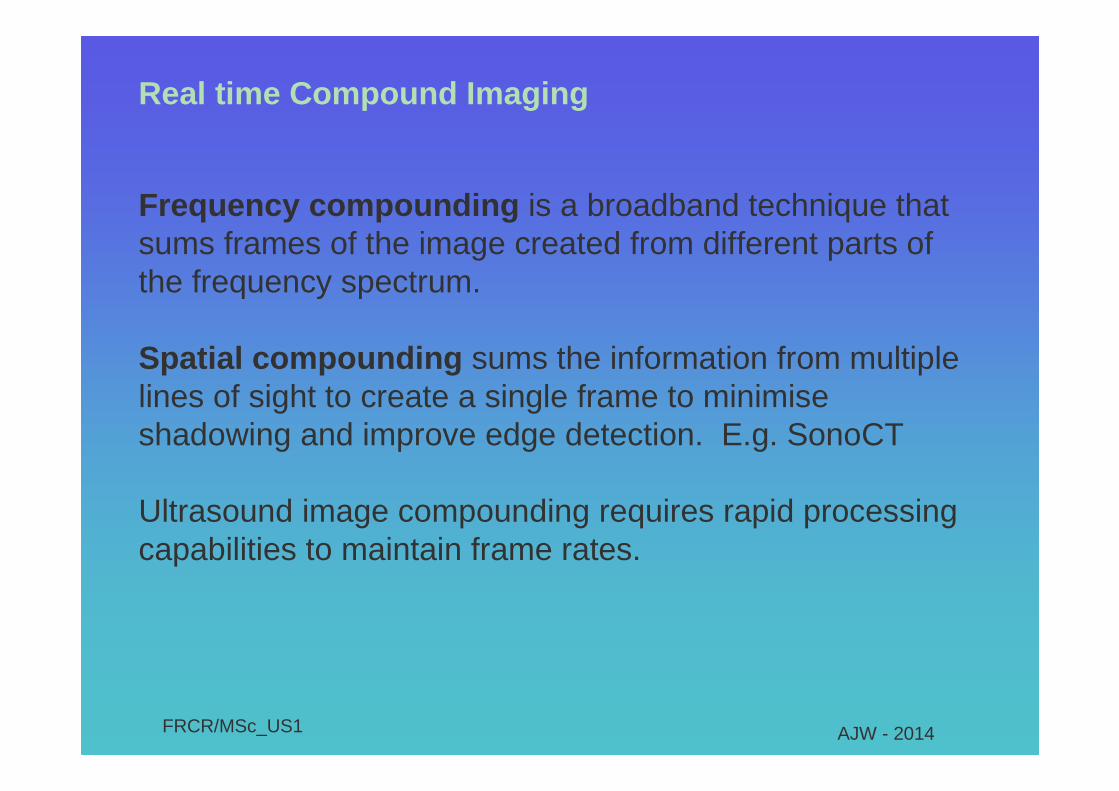
Real time Compound Imaging
Frequency compounding is a broadband technique that sums frames of the image created from different parts of the frequency spectrum.
Spatial compounding sums the information from multiple lines of sight to create a single frame to minimise shadowing and improve edge detection. E.g. SonoCT
Ultrasound image compounding requires rapid processing capabilities to maintain frame rates.

FRCR/MSc_US1 AJW - 2014
Spatial compounding

FRCR/MSc_US1 AJW - 2014

FRCR/MSc_US1 AJW - 2014
Sources of Information
Textbooks – Old ones good for the fundamentals, newer ones will bring technology up to date e.g.
� Diagnostic Ultrasound: Physics and Equipment by Peter Hoskins, Abigail Thrush, Kevin Martin, Cambridge University Press, 2010
� Ultrasound Physics and Instrumentation by Wayne R. Hedrick, David L. Hykes, and Dale E. Starchman, Mosby, 2005
� Essentials of Ultrasound Physics by James A. Zagzebski, Mosby, 1996
Images in this presentation are fromHoskins and Zagzebski.

FRCR/MSc_US1 AJW - 2014
Sources of Information
Hangiandreou NJ. AAPM/RSNA physics tutorial for residents. Topics in US: B-mode US: basic concepts and new technology. Radiographics. 2003 Jul-Aug;23(4):1019-33 http://radiographics.rsnajnls.org/cgi/content/full/23/4/1019

FRCR/MSc_US1 AJW - 2014
Any Questions?


![Ultrasound Imaging Physics(Basic Principles)[1]](https://img.pdfslide.net/doc/110x75/5526da784a795911118b458d/ultrasound-imaging-physicsbasic-principles1.jpg)