Embed Size (px)
Citation preview

FRDC FINAL REPORT
RE-ASSESSING GIANT CRAB (Pseudocarcinus gigas) SIZE LIMITS TO OPTIMISE VALUE AND SUSTAINABILITY OF THE FISHERY Caleb Gardner, Philippe Ziegler and Sarah Jennings FRDC Project No. 2006/022

National Library of Australia Cataloguing-in-Publication Entry Gardner, Caleb , 2009 – Re-assessing giant crab (Pseudocarcinus gigas) size limits to optimise value and sustainability of the fishery Bibliography Includes index ISBN 978-1-86295-543-1 The views opinions expressed in this report are those of the author/s and not necessarily those of the Tasmanian Aquaculture and Fisheries Institute or the University of Tasmania. The University of Tasmania does not accept any responsibility for the contents of this report, and shall not be liable for any loss or damage that may be occasioned directly or indirectly through the use or, or reliance on, the contents of this publication. Enquires should be directed to: Dr Caleb Gardner Tasmanian Aquaculture and Fisheries Institute University of Tasmania Private Bag 49, Hobart, Tasmania 7001 © The Tasmanian Aquaculture and Fisheries Institute, University of Tasmania 2009. Copyright protects this publication. Except for purposes permitted by the Copyright Act, reproduction by whatever means is prohibited without the prior written permission of the Tasmanian Aquaculture and Fisheries Institute.

Giant Crab Size Limits
FRDC Final Report 2006/022 Page i
Table of Contents
NON-TECHNICAL SUMMARY .............................................................................................................. 1
1. ACKNOWLEDGEMENTS .............................................................................................. 3
2. BACKGROUND ................................................................................................................ 3
2.1 PROJECT DEVELOPMENT AND PLANNED OUTCOMES ............................................................. 4 2.2 PERFORMANCE INDICATORS ................................................................................................. 4
2.3 BUILDING ON PREVIOUS RESEARCH ...................................................................................... 5
3. NEED .................................................................................................................................. 6
4. OBJECTIVES .................................................................................................................... 6
5. HAS HARVESTING OF GIANT CRABS INFLUENCED THE REPROD UCTIVE SUCCESS OF FEMALE GIANT CRABS? ............................................................................................ 7
5.1 ABSTRACT ............................................................................................................................ 7 5.2 INTRODUCTION ..................................................................................................................... 7 5.3 METHODS ............................................................................................................................. 8 5.4 RESULTS ............................................................................................................................... 9 5.5 DISCUSSION ........................................................................................................................ 11
6. RE-EVALUATION OF SIZE LIMITS AND TOTAL ALLOWABLE CA TCH TO OPTIMISE BIOLOGICAL AND ECONOMIC OBJECTIVES IN TASM ANIA’S GIANT CRAB FISHERY 13
6.1 INTRODUCTION ................................................................................................................... 13 6.2 METHODS ........................................................................................................................... 14 6.2.1 Biological and harvest submodel ....................................................................................... 14 6.2.2 Economic submodel ........................................................................................................... 18 6.2.3 Harvest strategy evaluation ................................................................................................ 21 6.3 RESULTS ............................................................................................................................. 23 6.3.1 Management scenarios under the current TAC .................................................................. 23 6.3.2 Size limits changes under the current TAC ........................................................................ 29 6.3.3 Different size limit combinations and TACC changes ....................................................... 32 6.3.4 Sensitivity of outcomes to different cost levels.................................................................. 35 6.4 DISCUSSION ........................................................................................................................ 36 6.4.1 Revenue ............................................................................................................................. 36
6.4.2 Fishing costs ...................................................................................................................... 36
6.4.3 Best strategy ...................................................................................................................... 36
6.4.4 Lowering size limits for males ........................................................................................... 37
7. BIOLOGICAL STOCK ASSESSMENT MODEL ....................................................... 38
7.1 BASIC DYNAMICS................................................................................................................ 38 7.2 RECRUITMENT .................................................................................................................... 39 7.3 EGG PRODUCTION ............................................................................................................... 39 7.4 SELECTIVITY....................................................................................................................... 40 7.5 CATCHES ............................................................................................................................ 40 7.6 LIKELIHOOD FUNCTIONS FOR MODEL FITTING ..................................................................... 40 7.7 EQUILIBRIUM STATE ........................................................................................................... 42
8. BENEFITS AND ADOPTION ....................................................................................... 43
9. FURTHER DEVELOPMENT ........................................................................................ 44

Giant Crab Size Limits
FRDC Final Report 2006/022 Page ii
10. REFERENCES ................................................................................................................. 45
11. APPENDIX 1: INTELLECTUAL PROPERTY ................. .......................................... 46
12. APPENDIX 2: STAFF ..................................................................................................... 46
Giant Crab Size Limits
FRDC Final Report 2006/022 Page 1
2006/022 Re-assessing giant crab (Pseudocarcinus gigas) size limits to optimise value and sustainability of the fishery.
INVESTIGATORS: Caleb Gardner, Philippe Ziegler, Sarah Jennings
ADDRESS: University of Tasmania Tasmanian Aquaculture and Fisheries Institute Private Bag 49 Hobart 7000 Telephone: 03 6227 7233 Fax: 03 6227 8035
Objectives
1. Describe the reproductive status of the fished giant crab population and compare it to that of the virgin population.
2. Assess the implications of changes in current size limits, and document options that best balance the aims of optimising value while rebuilding stocks.
NON-TECHNICAL SUMMARY
OUTCOMES ACHIEVED
This project led to rule changes in the Tasmanian giant crab fishery estimated to: - increase net present value of future profits from the fishery (discount rate
7%) by around $1 million or 15%; - increase egg production marginally (by around 3%); - reduce inter-annual variability in business earnings; and - reduce any ecosystem effects of fishing by increasing the size of the giant
crab stock.
The project saw a shift in focus of the fishery away from measuring benefit from the fishery in terms of gross value of product (GVP; around $2 million for this fishery) to a focus on profit.
These changes occurred through bioeconomic modeling that identified a more optimal combination of size limits and TAC.
Future changes resulting from the project are expected through ongoing application of the bioeconomic modelling capacity developed through this project. Opportunity for this type of research also exists in larger crustacean fisheries.

Giant Crab Size Limits
FRDC Final Report 2006/022 Page 2
The giant crab fishery is a small volume, deep water fishery with catches regulated by size limits and individual transferable quota. The rules for this fishery have evolved through time without any review of their overall mix or outcomes from an economic perspective.
This project examined changes in egg production of the stock, with a strong focus on fertilisation success of female crabs. This particular issue arose from concerns early in the development of the fishery that removal of large-claw males through fishing could impact on future egg production. Similar observations of “sperm limited” crab populations have been reported from many other crab fisheries.
Samples were collected from the first year or two of the fishery (1994/95) when the stock was virtually untouched, which was an unusual and valuable data set. Samples of egg masses and sperm storage organs collected again in 2008/09 through this project indicated that fertilisation capacity was unaffected through fishing over the previous 15 years. The implication of this result is that management metrics that utilise potential egg production as a proxy for reproductive output of the stock are appropriate, and that conservation of spawning biomass is a higher priority than protection of large-claw morphotype males.
Biological and economic information were combined in a length- and sex-based bio-economic stock model. This was used to compare alternative combinations of size limits for each sex with different TACCs in an attempt to improve both profitability and biological measures of stock health.
Bio-economic modelling indicated that the current TACC and size limit combination was a poor strategy because of likely further decreases in exploitable biomass and catch rates, plus high volatility from year to year. Over the projected period of 10 years, predicted decreases in stock were expected to result in substantially raised fishing costs. In contrast, exploitable biomass and catch rates stabilised or slightly increased under a reduced catch of 50t or 40t. The current TACC produced the highest variability in economic estimates and the lowest egg production levels of the scenarios examined.
Several options were identified for improving the net present value (NPV) of the fishery and egg production concurrently. First, the current size limits for males could be selectively lowered to provide females with greater protection from fishing than males. For example, reducing the male size limit to 130 mm CL but retaining the female size limit at 150 mm CL would result in a median increase in NPV from AU$ 6.8 million to AU$ 11.1 million and increased egg production from 31.2% to 32.1% of the unfished level (Table 4).
Secondly, changes in size limits could be combined with more optimal TACCs. Lowering the TACC from 60t to 40t was estimated to increase NPV to AU$ 9.1 million plus increase egg production to 34.1% of the unfished level. A range of TACC and size limit combinations achieved higher NPVs and egg production levels, however with a trade-off between the two. Importantly the industry and

Giant Crab Size Limits
FRDC Final Report 2006/022 Page 3
management now have the information and the tool to make decisions on the economic and biological goals for the fishery.
KEYWORDS: giant crab, Pseudocarcinus gigas, size limits, population model, sperm limitation.
1. Acknowledgements
This project was completed with the help of numerous people. Dr David Mills initiated the research and planned project activities. Michel Bermudes completed much of the data assimilation. Many fishers assisted in providing information/specimens including Bill Tober, John Hammond, John Hammond Jr., Theo Hairon, Michael White and Torsten Schwock. Kylie Cahill provided assistance in biological sampling and analyses.
2. Background
The Tasmanian giant crab fishery is a low volume, high-value fishery of importance to several Tasmanian and Victorian based fishers with multiple fishery endorsements (lobster and often scallops as well as giant crab). The fishery is centred on the shelf-break on Tasmania’s east and west coasts, in depths of 180 to 400m. Living in deep water, giant crabs grow slowly and are long-lived, and historical evidence suggests that such species are vulnerable to overfishing.
The history of this fishery shows a massive increase in effort and catch in the mid 1990’s when stable markets in Asia were first established, however catch rates decreased rapidly until the introduction of quota management in 1999.
Fishery regulation currently includes effort restrictions (limited entry, limited trap numbers), a TACC, closed seasons and ‘keyhole’ (upper and lower) size limits. Many of the current rules were implemented with little data while the fishery was expanding and there was concern that current size limits are sub-optimal, and more appropriate size limits may assist with stock rebuilding and optimising yield.
One of the management objectives for the giant crab fishery has been to protect the fertility of the population. For a species with a marked difference in the size of males (large) and females (small), market preferences for a particular size of crab can dramatically change the effect of the fishery on reproductive success of the population. For example, fished populations of similar crabs elsewhere have suffered ‘sperm limitation’ due to the removal of large males – that is, too many sexually mature males were removed to maintain previous fertilisation rates (eg. Sato et al., 2007). Such problems can be countered with appropriate size limits and TACCs in the fishery.

Giant Crab Size Limits
FRDC Final Report 2006/022 Page 4
Current size limits for giant crab were established early in the history of the fishery based on biological data collected prior to the increase in fishing effort, and untested assumptions about fishing and market practices. Although the upper size limit was introduced to protect against sperm limitation, as the fishery developed a market preference for smaller crabs became evident. As a result the sex ratio of the catch is currently skewed towards females, and a management emphasis on protecting egg production may be of greater importance than concerns about sperm limitation.
Egg- and yield-per-recruit models for giant crabs were initially developed through FRDC 93/220 (Fisheries Biology of the Giant Crab ; Levings, Mitchell, McGarvey et al.). These models formed the basis for the stock assessment model developed as part of FRDC 2001/042 ‘Development of the tools for long term management of the giant crab resource: data collection methodology, stock assessment and harvest strategy evaluation’. That project (2001/042) also included the development and introduction of efficient methods of obtaining valuable size data from the fishery. Since then, additional detailed size structure information was collected and formed a powerful dataset for testing the effects of altered size limits on the current population.
The project documented in this report sought to assess the reproductive status of the fishery, and integrated this information with output from the updated model to examine economic effects of various size limit options.
2.1 Project development and planned outcomes
The main outcome of this project was the ability to advise stakeholders on the effect of alternative size limits on egg production in the giant crab population, and to inform fishers and managers of the likely economic consequences of such changes. Crab fishery managers from the Tasmanian Department of Primary Industry and Environment were involved in the processes leading to the development of this application, and ultimately applied results through revised management of the fishery
The quantitative benefit of this project should be seen in the future through enhanced rebuilding of the giant crab stock, greater economic yield, and the associated increase in the capitalisation of licences and quota units.
2.2 Performance indicators
Two performance indicators were defined at the start of the project and both have been met. These were originally described as:
1) The most important indicator of success of this project is that a robust examination of current and proposed size limits for the fishery are received by managers and fishers in an understandable format. If the reasons behind any proposed changes to management are not clearly articulated, uptake of the results by the Fishery Advisory Committee is unlikely.
2) The second indicator is that the results of this study be incorporated into the management plan, and size limits altered if recommended by the study.

Giant Crab Size Limits
FRDC Final Report 2006/022 Page 5
2.3 Building on previous research
Considerable resources have been directed to giant crab research prior to this project, primarily through the Universities of Deakin and Tasmania. Much of that previous research was used in the research described here, especially in defining parameters in the population model. Examples included weight/length relationships, length/fecundity relationship, reproductive patterns and information on growth. Some of the main projects used were:
Gardner C, ‘The Larval and Reproductive Biology of the Giant Crab Pseudocarcinus gigas’ (1999) – PhD thesis. Developed techniques and conducted early measurements of reproductive status of the Tasmanian giant crab population.
Levings A, Mitchell B, McGarvey R, Mathews J, Lautrenson L, Austin C, Heeron T, Murphy N, Miller A, Rowsell M, Jones P. Fisheries biology of the giant crab Pseudocarcinus gigas. FRDC 93/220 and97/132. Collected information on the behaviour, development and distribution of the crab fishing fleet. Information on diet of crabs was obtained from trawl captured animals. A tag-recapture study provided critical growth information that has been incorporated into assessment models. Developed an egg- and yield-per-recruit model that incorporates monthly time steps, and thus can include seasonal variation in beach prices. This will provide useful guidance on revenue per recruit, and will be used here for assessing gains from altering lower size limits.
Gardner C, Haddon M, Hobday D, McGarvey R. FRDC 2001/042. Developing the tools for long-term management of the giant crab resource: Data collection methodology, stock assessment and harvest strategy evaluation. Resulted in the development of a stock assessment model for giant crab, incorporating catch and effort data such that extimates of fishing mortality are generated. Outputs from this project have improved data collection from the fishery to the point where realistic assessments of the impacts of various size limits can now be made.
Gardner C. Rock Lobster Enhancement and Aquaculture Subprogram: The feasibility of translocating rock lobsters in Tasmania for increasing yield. FRDC 2005/217. As the economic analysis undertaken as part of FRDC 2005/217 was completed last year, and included essentially the same vessel fleet as are involved in the crab fishery, data on operational costs of fishing will be directly applicable to economic analyses proposed here.
Giant Crab Size Limits
FRDC Final Report 2006/022 Page 6
3. Need
Inappropriate fishery regulations can harm fisheries through loss of yield or excess depletion of the stock. Size limits are an important component of most crustacean fisheries and are used with giant crab in conjunction with a TACC to regulate harvest rates. While the initial setting of size limits in the giant crab fishery was based on the precautionary principle and the best available data, they were set without any data on growth or economic analysis. The initial size limits were an attempt to regulate harvesting while the fishery was commencing and were in need of review.
Any changes to fishery controls, particularly in a fishery where catch rates appear to be stabilising, must be approached with caution. Given that the emphasis of size limits has, appropriately, been on preserving the fertility of crab stocks, it would be inappropriate to adjust size limits without first re-evaluating the reproductive status of the population. This was particularly important as we know that the way the fishery was currently structured has resulted in an unbalanced harvesting of males and females. Biological data gathered during this process will significantly improve the predictive capability of the assessment model with respect to egg production.
This project addressed three of the 12 research and development priorities for wild fisheries outlined in the Tasmanian Fisheries and Aquaculture Research Strategic Plan (2005-2008). It addressed the priority ‘Management options/assessment’ by seeking to optimise management measures for the giant crab fishery, the priority of ‘Resource assessment & monitoring’ by providing information on the current reproductive status of the giant crab population, and the priority area ‘impacts of fishing’ by comparing current reproductive parameters with that of the population prior to the rapid expansion of this fishery.
4. Objectives
3. Describe the reproductive status of the fished giant crab population and compare it to that of the virgin population.
4. Assess the implications of changes in current size limits, and document options that best balance the aims of optimising value while rebuilding stocks.
Giant Crab Size Limits
FRDC Final Report 2006/022 Page 7
5. Has harvesting of giant crabs influenced the reproductive success of female giant crabs?
5.1 Abstract
Early fisheries research on giant crab led to size limits that were intended to protect reproductive potential and thus maintain future recruitment. Those analyses were focused on female reproduction which was evaluated from the external egg masses carried by females. The reproductive biology of males was less easy to research and the management measures introduced at the start of the fishery were implemented with acknowledgement of the need for later evaluation of any sperm limitation in exploited populations of giant crab. This concern arose mainly because large claw morphotype crabs were expected to become scare through fishing and it was unclear whether smaller male crabs were functionally mature. Research presented here deals with this need and involves comparison of samples collected from virtually unfished stocks in 1994/95 with samples taken from depleted stocks in 2008/09. No evidence of sperm limitation was detected with fertilised egg masses remaining constant as a function of length after the 14 years of fishing. Likewise the weight of spermathecae or sperm storage receptacles in females was also equivalent between samples. Aspects of the biology of giant crab that appear to mitigate the risk of sperm limitation include inter-moult periods of greater than 1 year which raises the operational sex ratio in any one moulting season. In addition the fishery involves the removal of both female and male crabs, which contrasts to the male-only crab fisheries where sperm limitation has been documented. Management focus on egg production as a measure of population reproductive capacity thus appears appropriate for this fishery.
5.2 Introduction
Crab fisheries typically involve disproportionate harvest of males, either through complete prohibition of the harvest of females, or through partial displacement of effort onto males. Rules that promote higher harvest rates for males include longer closed seasons for females or prohibition on the landing of ovigerous females. Placing greatest emphasis on the protection of the reproductive potential of females seems reasonable due to the polygynandrous mating system of crabs, however, some authors have argued that management needs to take greater account of male abundance due to the risk of sperm limitation (Sainte-Marie et al., 2008).
“Sperm limitation” refers to the loss of reproductive output from the population through inadequate fertilisation of eggs and it has been detected in a small number of exploited crab species including Paralithodes brevipes (Sato et al., 2007) and Chionoecetes opilio (Sainte-Marie et al., 1995). Research presented in this paper sought to examine whether sperm limitation had occurred in a fished population of giant crab Pseudocarcinus gigas.
Data from this fishery has some unusual traits with the initial survey conducted on an almost unfished stock, merely two years after the fishery commenced in 1992. P. gigas
Giant Crab Size Limits
FRDC Final Report 2006/022 Page 8
store sperm for several years (Gardner and Williams, 2002), which implies that eggs sampled from many of the crabs collected for this study actually resulted from mating events that occurred prior to any harvesting. Between the initial sample and later data presented here, the abundance of crabs was dramatically reduced with exploitable biomass in 2007/08 estimated at only 18% of unfished levels (Ziegler et al., 2009). The fishery also had an unusual management history. This was because there was explicit consideration of the risk of sperm limitation in designing management of the fishery, in contrast to almost all other crustacean fisheries. Management attempted to reduce the risk of sperm limitation through a maximum size limit of 216 mm carapace length (CL) for males, which was introduced in 1999. This limit was intended to protect male crabs that were morphologically mature, based on development of the molariform chela relative to CL (Gardner and Williams, 2002).
The fishery for giant crab P. gigas in Tasmania commenced in 1992 with catches rising from 0.9 t in 1991 to a peak of almost 300 t by 1994/95. Catches and catch rates then declined leading to ITQ management being introduced in 1999 with a TACC of 100 t. This TACC later proved to be too high to prevent continued decline in catch rates. Although females are also harvested, there is potential for higher exploitation of males as they tend to be larger than females, yet one minimum size limit of 150 mm CL is applied to both sexes. Females are also protected from harvest while brooding eggs, which is for around four months of the nine-month fishing season. In addition to the minimum size limit applied to both sexes, a maximum size limit of 215 mm CL was introduced in 1999 with the aim of protecting a portion of larger males.
5.3 Methods
All crabs were collected by commercial fishers fishing for giant crabs in 200-350 m depth, along the rim of the continental shelf around Tasmania.
Ovigerous female crabs were collected in traps by commercial fishers during the period 10 August to 15 September 1995 from eastern Tasmania (n=30), western Tasmania (n=121) and again 13 years later from 5 August to 28 September 2008 (n= 22). Numbers collected in the 2008 sample were lower than the 1995 sample due to lower fishing effort during this period under ITQ management, plus, as Howard (1982) noted with Cancer pagurus, P. gigas females feed less when ovigerous and are less likely to enter pots. This behaviour appears to have affected sampling despite considerable effort. All commercial fishers record the number of ovigerous crabs captured and released. This data shows that a total of only 25 ovigerous crabs were captured by the entire Tasmanian fleet in August and September 2008, with 22 of these retained for this project.
Crab size was determined by measurement of carapace length while the weight of egg masses was determined by trimming the eggs away from the endopodite processes of the pleopod, then blotting egg samples and weighing.

Giant Crab Size Limits
FRDC Final Report 2006/022 Page 9
To examine changes in the weight of spermathecae in relation to the size of the female, females were collected from eastern Tasmania, with females that were ovigerous or had not mated were excluded. Ovigerous females were excluded as the spermathecae of these animals tend to be enlarged with the contents partially broken down. Specimens were collected between (i) June 1994 and August 1995 (n=90; ten individuals per month except during seasonal closures in the fishery: September to December); (ii) May 2000 to May 2001 (n = 88); and (iii) November 2007 to September 2008 (n= 22). These females were killed by chilling and dissected to remove the paired spermathecae which were blotted and weighed separately; the mean weight of the two spermathecae was used for analyses.
Data analyses were conducted with program R, version 2.6.2. Crab size, egg mass weight and spermathecae weight were ln transformed prior to analysis by OLS. This transformation reduced heteroskedasticity of errors, plus facilitated analysis of the volumetric nature of the crab size : egg mass relationship.
5.4 Results
The fish down of the giant crab stock since catches increase in 1995 has been documented previously through a range of fisheries performance indicators (Ziegler et al., 2009) and was apparent in data collected through this survey by the paucity of samples of ovigerous females available, especially for larger animals.
Brood size was measured by weight of the egg mass. The model of ln egg mass weight to ln carapace length was curvilinear which implies that larger crabs had a smaller reproductive output for their size than smaller crabs (Figure 1). That is, larger crabs appear to become reproductively senescent. Poorer fitting points were inevitably on the side of lower egg mass weight than would be predicted by the model and generally for larger crabs. That is, very large crabs occasionally have very small broods, while smaller crabs tended to have broods of a more consistent size.
The egg mass- crab size relationship of crabs sampled in 2008 could not be distinguished from crabs sampled from virgin stock in 1994.
Spermathecae weights increased with female size, indicating multiple matings through the lifetimes of crabs as widely occurs in xanthid type crabs, however, this relationship was far from tight with a wide scatter of points (Figure 1). The effect of crab size on spermathecae weight was nonetheless significant with slopes significantly greater than zero (P<0.01). OLS linear model fits to data collected in 1994/95 and 2007/08 could not be separated (P>0.05) thus providing no evidence of change in mating success or sperm transfer since commencement of the fishery. Curiously, sample data collected in 2000/01 had significantly higher spermathecae weights relative to body size (P<0.01).
Information of the sex ratio of retained catch of crabs is shown in Table 1. Catch is highly skewed towards retention of females with an average of seven females retained for every three males retained for the period 2000 to 2009.
Negligible catch falls in the oversize category of >216 mm CL (~ 1 per 1000 retained crabs), which was a management measure designed to protect large molariform chelae
Giant Crab Size Limits
FRDC Final Report 2006/022 Page 10
morphotype crabs. This implies very few males are surviving fishing through the slot limit and recruiting to this oversize category
Figure 1. Crab egg mass weight (upper) and spermathecae weight (lower) in relation to crab size (carapace length) for samples collected from the unfished stock in 1994 and again in 2007/08.

Giant Crab Size Limits
FRDC Final Report 2006/022 Page 11
Table 1. Sex-ratio of crab catch. Fishers are required to record the sex of all crabs retained, and in recent years also report on any male crabs that are greater than the maximum size limit of 215 mm CL and thus discarded.
Year % catch that was female % catch that was oversize males (>215 mm CL)
1999 78.63% N/A
2000 77.52% N/A
2001 68.18% N/A
2002 67.64% N/A
2003 68.78% N/A
2004 67.35% N/A
2005 68.63% N/A
2006 68.41% N/A
2007 66.76% 0.08%
2008 67.43% 0.17%
2009 73.97% 0.11%
5.5 Discussion
The issue of sperm limitation has become an increasing focus for crab fisheries research and was identified as a risk for the giant crab fishery early in the development of management arrangements for the fishery (McGarvey et al. 2000). Much of the research on this issue worldwide has focused on fisheries with male-only harvest where the operational sex ratio becomes increasingly skewed towards females. After over a decade of fishing in the giant crab fishery we now know that harvesting will involve disproportionate removal of females despite seasonal restrictions for females and rules preventing harvest of ovigerous or “berried” crabs. This greater harvest of females suggests risk of sperm limitation impacting on reproductive output will be less than the effect of depletion of females through fishing.
Sperm limitation has been detected in crab populations elsewhere through smaller clutch sizes and smaller spermathecae weights (Sato and Goshima, 2006). Both these measures appear unaffected by fishing that has occurred in the Tasmanian giant crab fishery with stability through time as a function of length.
Anson et al. (2003) observed sperm limitation and subsequent smaller clutch sizes of blue crab Callinectes sapidus in the Florida fishery even in the absence of high depletion of males. In this fishery the females retained sperm for multiple years so that sperm reserves became depleted for later broods. Smaller males typically transfer smaller volumes of sperm (Sato and Goshima, 2007), especially where completion for
Giant Crab Size Limits
FRDC Final Report 2006/022 Page 12
females is reduced through harvest of males (Sato et al. 2007). This process could be expected to affect fertility in giant crab also where multiparous females fertilise eggs for multiple broods over multiple years with stored sperm (Gardner and Williams, 2002). Sampling conducted in this project provided no evidence of sperm limitation in multiparous females which may be due in part to removal of older females. That is, sperm limitation in later broods is less of a management issue than the paucity of larger females in populations after a decade of fishing.
In conclusion, the removal of large chelae morphotype males does not appear to have affected reproductive success of individual female crabs following depletion of stock through fishing around Tasmania. Management of reproductive output thus appears to be well informed through measurement of female reproductive output. This implies management performance measures based on egg production are appropriate.
A

Giant Crab Size Limits
FRDC Final Report 2006/022 Page 13
6. Re-evaluation of size limits and total allowable catch to optimise biological and economic objectives in Tasmania’s giant crab fishery
6.1 Introduction
Inappropriate fishery regulations can harm the biological sustainability of the fished stocks and result in suboptimal economic return. The biomass that maximises the sustainable yield (BMSY), a traditional measure for sustainability, tends to be lower than the biomass that produces the highest economic profit or maximum economic yield (BMEY) and thus in theory profit maximisation should also imply sustainability of fish stocks (Grafton et al. 2007). In practice however, management measures rarely attempt to explicitly optimise both biological and economic perspectives.
In the case of the giant crab fishery, size limits were initially set when the fishery commenced at a time when there was little information available. Despite the limited information the limits chosen, 150 mm CL for both sexes, were remarkably effective at maintaining egg production (Ziegler et al., 2009). The more ambitious target of maximising economic yield was never considered in the early days of the fishery which implies scope for refining the balance between TACC, size limits and other management rules.
Total allowable catches, size limits and spawning closures have been traditionally used as management measures for many crustacean species to limit catch and protect egg production (Hankin et al. 1997, Hall and Chubb 2001, Holland et al. 2005, Ziegler et al. 2009). Size limits have primarily been used in the crab fishery to provide protection of egg production while the TACC was intended to manage catch rates, which is of economic importance.
In the past, most management measures provided a limit to fishery harvests so that reproductive potential was maintained so the fishery could be considered “sustainable”, often through the use of limit and target levels for the spawning biomass (Clark 1991, Clark 1993, Mace 1994). This approach does not consider the economic outcomes of management rules and fails to target the maximum benefit from the resource. In the case of the fishery for giant crab (Pseudocarcinus gigas) in Tasmania, Australia, maintaining stocks and egg production at sustainable levels has been the long-standing management goal. Living in deep water, giant crabs are highly vulnerable to overfishing since they grow slowly and are long-lived (Gardner et al. 2007). Although no specific target or limit reference points have been defined for the fishery, management focus mainly on egg production which was estimated at 29% of virgin levels in 2007 (Ziegler et al. 2009).

Giant Crab Size Limits
FRDC Final Report 2006/022 Page 14
The Tasmanian giant crab fishery is a low volume, high-value fishery of considerable importance to a number of fishers based in Tasmania and Victoria with multiple fishery endorsements. The fishery is centred on the continental shelf break and on Tasmania’s West and East coast in south-eastern Australia in depths of 180 to 400m (Figure 2). A targeted fishery for giant crab started in 1994 and rapidly expanded to 290t over a few years when stable markets in Asia were first established. However, catch rates decreased rapidly as a consequence until the introduction of quota management in 1999. The current fishery regulation includes effort restrictions through limited entry and trap numbers, a total allowable catch (TAC), keyhole size limits, closed seasons for spawning females and the protection of all berried females.
Catch rates continued to decline in the crab fishery under quota management from 2000 to 2003 and the TACC failed to be caught. This led to a reduction of the TACC in 2004 from 103.5t to 61.2t in response. Subsequently catch rates appear to have stabilised to some degree. While stocks now appear stable, albeit depleted, the current size limits and TACC were not analysed or set in the context of optimising yield or community benefit.
Research presented here sought to concurrently re-evaluate catch levels, size limits and closed seasons to assess and optimise the biological sustainability and economic profitability of the fishery. For this purpose, an existing size-based stock assessment model for giant crab has been modified to include economic information in future projections of realistic management scenarios.
6.2 Methods
A size-structured population model for the Tasmanian giant crab was used to estimate economic measures such as catch revenue, fishing effort, costs and profit from projected catch and catch rates.
6.2.1 Biological and harvest submodel
A size-based stock assessment model with an annual time-step was used for the Tasmanian giant crab (Ziegler et al. 2009). Full details of the model and the underlying description of giant crab growth are given in the following Chapter.
The model considered length classes from 80-250 mm carapace length (CL) for males and females. The basic length-class width was 5 mm, although some calculations such as for growth were conducted by 10 mm length-classes. The model operated with an annual time step that was in line with the quota year from 1st March to the end of the following February. Within each year, the chronology of events followed the sequence of applying half the natural mortality, allowing for individuals to grow, applying fishing mortality, adding new recruitment and finally applying the second half of natural mortality.
The model was conditioned on commercial catch data and fitted to standardised catch rates and size frequency data from many quota years since 1993/94 using maximum likelihood methods. The model estimated sex-specific selectivity parameters, the average recruitment level, and recruitment residuals defining the predicted deviation from the average recruitment that occurred each year. No pre-defined stock-recruitment
Giant Crab Size Limits
FRDC Final Report 2006/022 Page 15
relationship such as the Beverton-Holt relationship was incorporated into the model, since the settlement process for giant crab is unknown and several annual cohorts can contribute to a recruitment event. Instead, average recruitment and recruitment residuals were fitted and constrained by a penalty term contributing to the overall log-likelihood. Recruitment variability of giant crab was unknown but allowed to be relatively high in the model (σ = 0.75). Prior to the start of the fishery in 1989/90, the crab populations were assumed to be at equilibrium with average recruitment levels.
142 143 144 145 146 147 148 149
-44
-43
-42
-41
-40
-39
50
50
100100
200
200
500
500
Tasmania
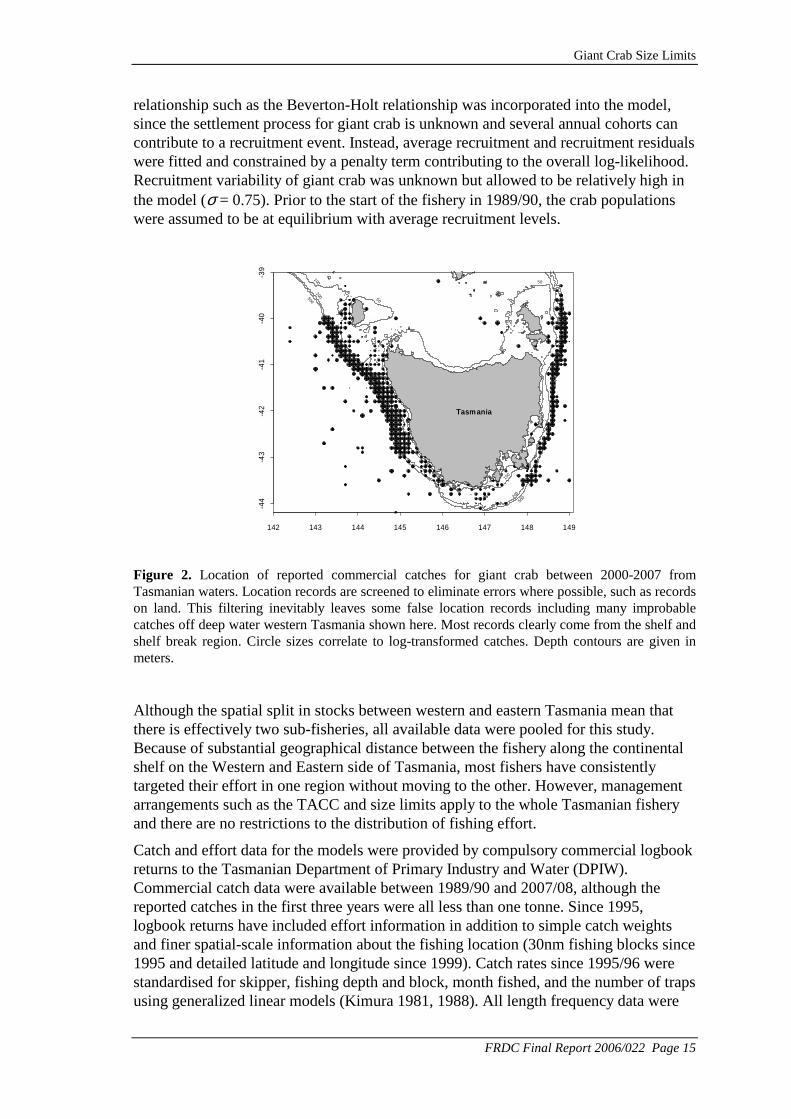
Figure 2. Location of reported commercial catches for giant crab between 2000-2007 from Tasmanian waters. Location records are screened to eliminate errors where possible, such as records on land. This filtering inevitably leaves some false location records including many improbable catches off deep water western Tasmania shown here. Most records clearly come from the shelf and shelf break region. Circle sizes correlate to log-transformed catches. Depth contours are given in meters.
Although the spatial split in stocks between western and eastern Tasmania mean that there is effectively two sub-fisheries, all available data were pooled for this study. Because of substantial geographical distance between the fishery along the continental shelf on the Western and Eastern side of Tasmania, most fishers have consistently targeted their effort in one region without moving to the other. However, management arrangements such as the TACC and size limits apply to the whole Tasmanian fishery and there are no restrictions to the distribution of fishing effort.
Catch and effort data for the models were provided by compulsory commercial logbook returns to the Tasmanian Department of Primary Industry and Water (DPIW). Commercial catch data were available between 1989/90 and 2007/08, although the reported catches in the first three years were all less than one tonne. Since 1995, logbook returns have included effort information in addition to simple catch weights and finer spatial-scale information about the fishing location (30nm fishing blocks since 1995 and detailed latitude and longitude since 1999). Catch rates since 1995/96 were standardised for skipper, fishing depth and block, month fished, and the number of traps using generalized linear models (Kimura 1981, 1988). All length frequency data were

Giant Crab Size Limits
FRDC Final Report 2006/022 Page 16
collected by fishers on board of their vessels, since fishery-independent sampling was not a viable option due to the small numbers of giant crabs caught on a single fishing trip.
Biological model parameters of the length-weight relationship, growth, natural mortality, female maturity and fecundity were estimated externally from commercial and biological data, or alternatively based on ‘guestimates’. All biological parameters were assumed to be known without errors.
Due to extremely long intermoult periods characterizing the growth of giant crabs, the model differed in the description of growth from most other length-structured population models by an explicit years-since-last-moult matrix in addition to the commonly used growth transition matrix. Tag-recapture data indicated that only 50% of small males and females up to 160 mm would have moulted after 2.7 years (Gardner et al. 2007). Data for larger crabs were not available, but instead were extrapolated from the existing data such that 50% females of 200 mm CL would have moulted after 5.5 years and 50% males of the same length after 6.0 years.
Giant Crab Size Limits
FRDC Final Report 2006/022 Page 17
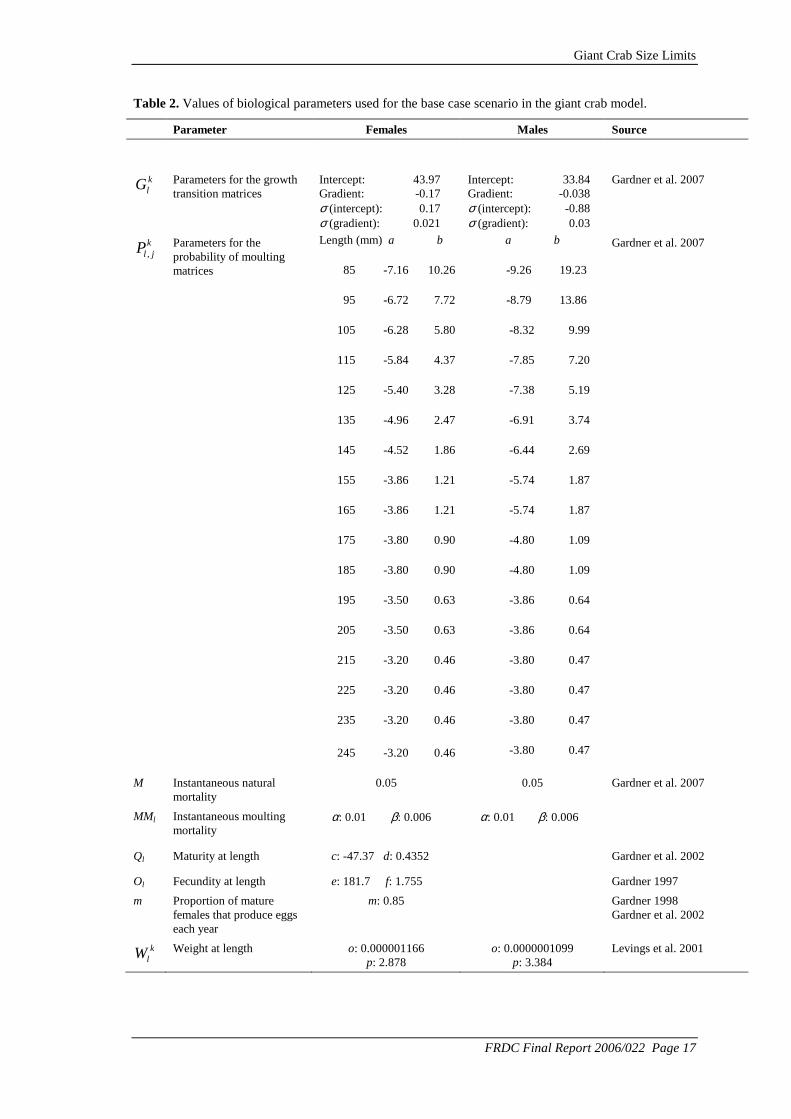
Table 2. Values of biological parameters used for the base case scenario in the giant crab model.
Parameter Females Males Source
klG Parameters for the growth
transition matrices Intercept: 43.97 Gradient: -0.17 σ (intercept): 0.17 σ (gradient): 0.021
Intercept: 33.84 Gradient: -0.038 σ (intercept): -0.88 σ (gradient): 0.03
Gardner et al. 2007
,k
l jP Parameters for the probability of moulting matrices
Length (mm) a b
85 -7.16 10.26
95 -6.72 7.72
105 -6.28 5.80
115 -5.84 4.37
125 -5.40 3.28
135 -4.96 2.47
145 -4.52 1.86
155 -3.86 1.21
165 -3.86 1.21
175 -3.80 0.90
185 -3.80 0.90
195 -3.50 0.63
205 -3.50 0.63
215 -3.20 0.46
225 -3.20 0.46
235 -3.20 0.46
245 -3.20 0.46
a b
-9.26 19.23
-8.79 13.86
-8.32 9.99
-7.85 7.20
-7.38 5.19
-6.91 3.74
-6.44 2.69
-5.74 1.87
-5.74 1.87
-4.80 1.09
-4.80 1.09
-3.86 0.64
-3.86 0.64
-3.80 0.47
-3.80 0.47
-3.80 0.47
-3.80 0.47
Gardner et al. 2007
M Instantaneous natural mortality
0.05 0.05 Gardner et al. 2007
MMl Instantaneous moulting mortality
α: 0.01 β: 0.006
α: 0.01 β: 0.006
Ql Maturity at length c: -47.37 d: 0.4352 Gardner et al. 2002
Ol Fecundity at length e: 181.7 f: 1.755 Gardner 1997
m Proportion of mature females that produce eggs each year
m: 0.85 Gardner 1998 Gardner et al. 2002
klW Weight at length o: 0.000001166
p: 2.878 o: 0.0000001099
p: 3.384 Levings et al. 2001

Giant Crab Size Limits
FRDC Final Report 2006/022 Page 18
Natural mortality was represented in two ways. Firstly, a low level of instantaneous natural mortality rate was assumed to be constant across all length classes each year (Table 2). However, natural mortality is unlikely to be constant during the life of a crab, since individuals are particularly vulnerable to predators when their shell is soft during the moulting period (Ryer et al. 1997). In addition, there is also a risk that fouling organisms establish themselves on the carapace during the long intermoult periods and prevent the suture lines from opening during the moult. This risk increases with crab length as the intermoult periods extend. Therefore, moulting mortality (MMl) was implemented at every moult (representing the risk of predation) and increased with crab length (representing the increasing risk of fouling) as:
l lMM Lα β= + (1)
where α and β are the parameter of the linear relationship, and Ll is the length class. The linear instantaneous moulting mortality rate was converted to a non-linear descending curve for moulting-associated survivorship by length class, and when combined with the average probability of moulting each year, survivorship increased with length class. The optimal values for moulting mortality were assumed to be independent of sex and determined by iteratively matching predicted and observed length distributions in the equilibrium state in the absence of fishing mortality using the earliest observed length-frequency distribution in 1993/94 (Ziegler et al. 2009).
Fecundity at size was estimated from female specimens collected during the spawning season and was assumed to be unaffected by carapace condition, although egg production can substantially decline for successive broods produced between moults (Gardner 1997). On average, 85% of mature females were assumed to be reproductively active each year (Gardner 1998, Gardner et al. 2002).
6.2.2 Economic submodel
Fishing revenue and costs were estimated in the economic submodel to characterize economic profit with alternative harvest strategies. Marginal revenue was assumed to equal price which was considered independent of landing volume, i.e. the fishery was considered a commodity producer within a large marketplace where consumers readily substitute giant crab with other crustaceans that are produced in a much larger volume than giant crab. Total annual revenue Revt was a function of the size splits of the catch and calculated as
*3
k kt t t
k=1
Rev = C price∑ (2)
where ktC is the catch in kg in year t and for size grades k (<3kg, 3-5kg and >5kg), and
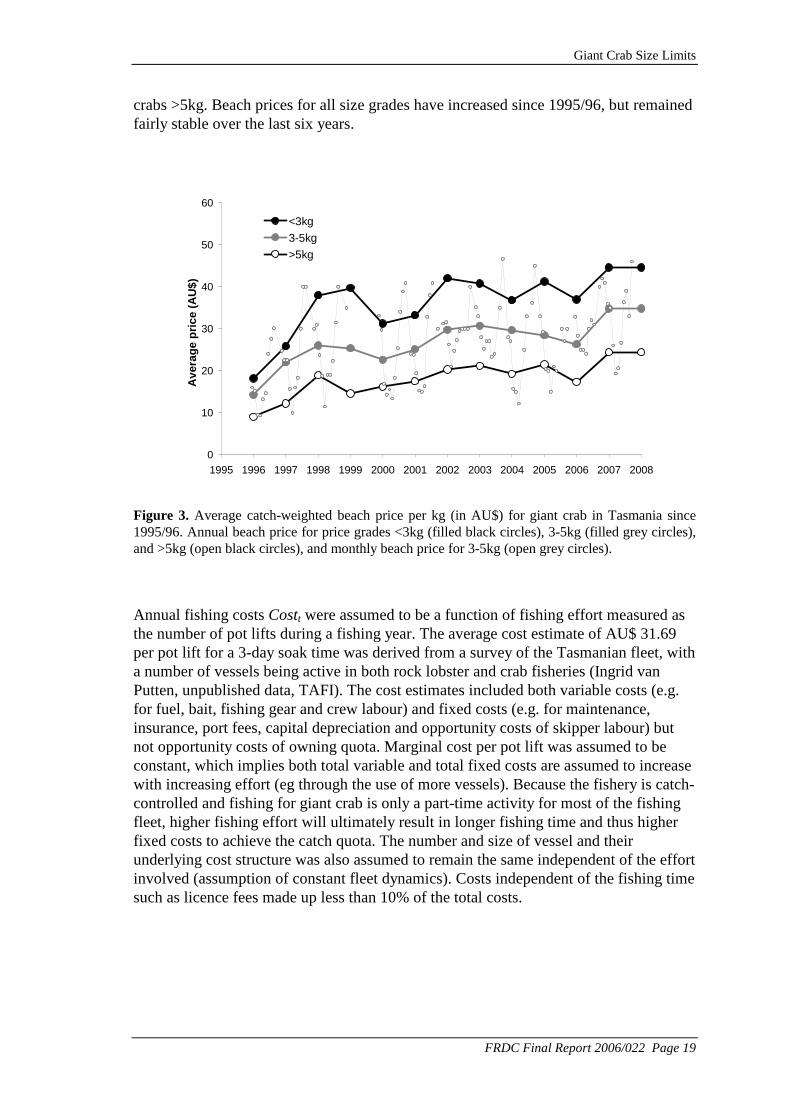
ktprice is beach price per kg by year and size grade. Monthly beach prices from a
Tasmanian processor strongly fluctuated within a year (Figure 3, monthly prices only shown for crabs 3-5kg). Because the simulations were based on an annual time-step, monthly prices were catch-weighted to estimate annual beach prices. Average annual beach prices decreased with increasing size grade. Prices per kg for crabs <3kg have consistently been around $10 higher than for crabs 3-5kg and about 20$ higher than for
Giant Crab Size Limits
FRDC Final Report 2006/022 Page 19
crabs >5kg. Beach prices for all size grades have increased since 1995/96, but remained fairly stable over the last six years.
0
10
20
30
40
50
60
1995 1996 1997 1998 1999 2000 2001 2002 2003 2004 2005 2006 2007 2008
Ave
rag
e p
rice
(A
U$)
<3kg
3-5kg
>5kg
Figure 3. Average catch-weighted beach price per kg (in AU$) for giant crab in Tasmania since 1995/96. Annual beach price for price grades <3kg (filled black circles), 3-5kg (filled grey circles), and >5kg (open black circles), and monthly beach price for 3-5kg (open grey circles).
Annual fishing costs Costt were assumed to be a function of fishing effort measured as the number of pot lifts during a fishing year. The average cost estimate of AU$ 31.69 per pot lift for a 3-day soak time was derived from a survey of the Tasmanian fleet, with a number of vessels being active in both rock lobster and crab fisheries (Ingrid van Putten, unpublished data, TAFI). The cost estimates included both variable costs (e.g. for fuel, bait, fishing gear and crew labour) and fixed costs (e.g. for maintenance, insurance, port fees, capital depreciation and opportunity costs of skipper labour) but not opportunity costs of owning quota. Marginal cost per pot lift was assumed to be constant, which implies both total variable and total fixed costs are assumed to increase with increasing effort (eg through the use of more vessels). Because the fishery is catch-controlled and fishing for giant crab is only a part-time activity for most of the fishing fleet, higher fishing effort will ultimately result in longer fishing time and thus higher fixed costs to achieve the catch quota. The number and size of vessel and their underlying cost structure was also assumed to remain the same independent of the effort involved (assumption of constant fleet dynamics). Costs independent of the fishing time such as licence fees made up less than 10% of the total costs.

Giant Crab Size Limits
FRDC Final Report 2006/022 Page 20
Figure 4. Catch per trap (kg) versus soak time and loess function (red line).
(a) Pot lifts
0
10000
20000
30000
40000
50000
60000
70000
0 20 40 60 80 100 120 140 160 180 200 220
Predicted effort
Po
t lif
ts
95/96
07/08
(b) Pot days
0
20000
40000
60000
80000
100000
0 20 40 60 80 100 120 140 160 180 200 220
Predicted effort
Po
t d
ays
95/96
07/08
Figure 5. Relationship between relative effort predicted by the assessment model and observed number of (a) pot lifts and (b) pot days in Tasmania (black filled circles) between 1995/96-2007/08. The line was fitted to the Tasmanian data and included an arbitrary power function for predicted effort < 60 with a lower value of 2000 pot lifts. Shown are also number of pot lifts in the West (open circles) and East (filled circles).
Effort predicted by the model was not a direct estimate of number of pot lifts but rather needed to be converted because catch rates were measured as catch per pot days, i.e. a combination of pot lifts and soak time. Catch rates increased with soak time up to 5 days, remained relatively constant over longer soak times (5-20 days) and decrease thereafter (Figure 3). It was therefore not surprising that the model-predicted effort was a better predictor for pot days (R2 = 0.67) than for the number of pot lifts alone (R2 = 0.40; Figure 4). Nevertheless, the latter relationship was used in the model due to the difficulties of quantifying cost on the basis of pot days. The number of pot lifts has generally declined since 1995/96 and the relationship was a reasonable predictor for pot lift numbers in recent years (on the other hand, soak times have increased over time). For predicted effort <60 where Tasmanian data was lacking, an arbitrary power function

Giant Crab Size Limits
FRDC Final Report 2006/022 Page 21
with a lower value of 2000 pot lifts was added, assuming that a minimum level of pot lifts was required to catch crabs. This power function tracked between the data from the West and East which indicated that fishers in the West usually use more pot lifts and shorter soak time than fishers in the East.
Annual profit Pt was calculated as:
Pt = Revt – Costt (3)
The net present value NPV is an indicator of the value of future stream of economic yield from the fishery. All future profits are discounted back to their present value and summed over the projection period Y:
1 (1 )
Yt
tt
PNPV
r=
=+∑ (4)
where t is the year of the profit, Y the total number of years, and r the discount rate. In this analysis we applied a discount rate more relevant to the private sector rather than the social discount rate (which places greater value on future cash flows than the private discount rate). Hence, a nominal discount rate of 7% was applied which is similar to the average yield of long-term bonds in Australian was used as a base case for this study. To account for different levels of perceived risk of the fishery, alternative discount rates of 4% and 10% were also investigated in a sensitivity analysis.
6.2.3 Harvest strategy evaluation
Using the fitted recruitment residuals to define the expected recruitment variation in the future, the stock assessment model was projected forward to determine the productivity, profitability and risk of different management arrangements. For each scenario, confidence intervals were estimated through 1000 simulations. In the projections, the TACC was always taken exactly over the course of 10 years. Costs and beach prices were assumed to remain constant. Although alternative management arrangements could initiate changes in effort allocation and trading of quotas between fishers and across the regions, constant fishery dynamics and thus cost factors were assumed for the projections. Beach prices have remained relatively stable since 2002, but they are to a large degree a function of exchange rates and export markets in Asia, where the majority of crabs is exported. Considering the small catch of giant crab and its small share in crustacean markets, prices are also influenced by catches of other crustaceans, particularly lobsters.
Giant Crab Size Limits
FRDC Final Report 2006/022 Page 22
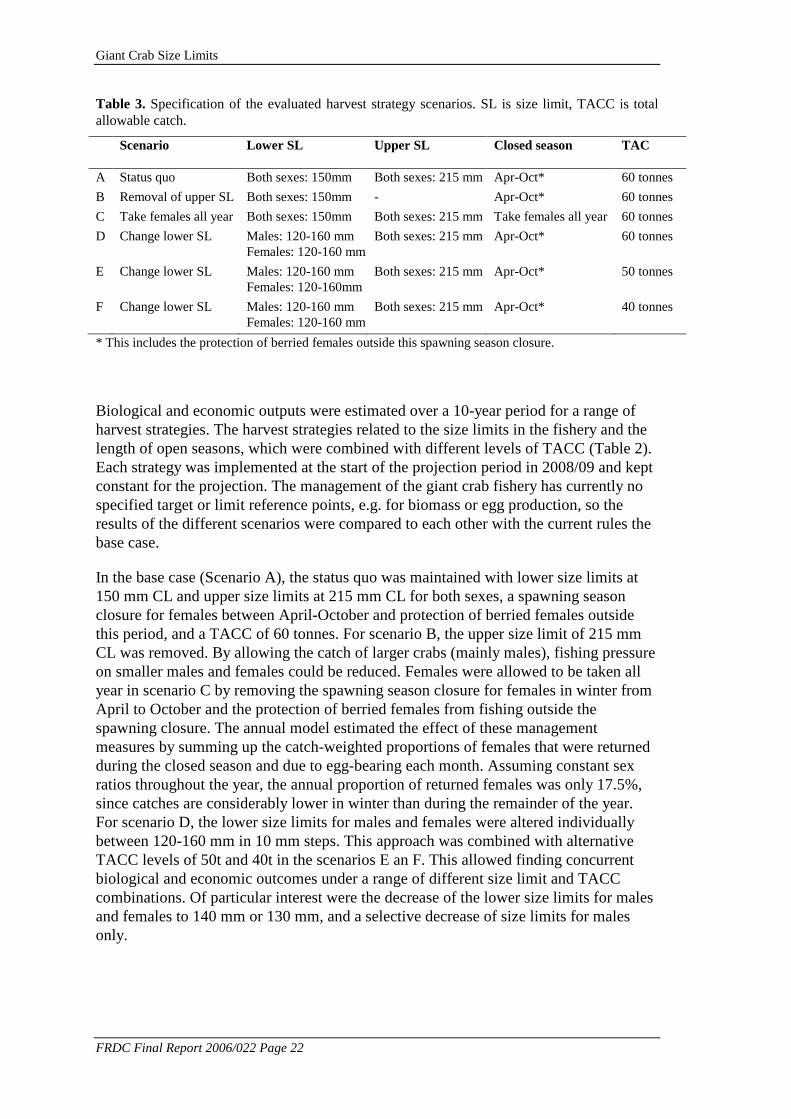
Table 3. Specification of the evaluated harvest strategy scenarios. SL is size limit, TACC is total allowable catch.
Scenario Lower SL Upper SL Closed season TAC
A Status quo Both sexes: 150mm Both sexes: 215 mm Apr-Oct* 60 tonnes
B Removal of upper SL Both sexes: 150mm - Apr-Oct* 60 tonnes
C Take females all year Both sexes: 150mm Both sexes: 215 mm Take females all year 60 tonnes
D Change lower SL Males: 120-160 mm Females: 120-160 mm
Both sexes: 215 mm Apr-Oct* 60 tonnes
E Change lower SL Males: 120-160 mm Females: 120-160mm
Both sexes: 215 mm Apr-Oct* 50 tonnes
F Change lower SL Males: 120-160 mm Females: 120-160 mm
Both sexes: 215 mm Apr-Oct* 40 tonnes
* This includes the protection of berried females outside this spawning season closure.
Biological and economic outputs were estimated over a 10-year period for a range of harvest strategies. The harvest strategies related to the size limits in the fishery and the length of open seasons, which were combined with different levels of TACC (Table 2). Each strategy was implemented at the start of the projection period in 2008/09 and kept constant for the projection. The management of the giant crab fishery has currently no specified target or limit reference points, e.g. for biomass or egg production, so the results of the different scenarios were compared to each other with the current rules the base case.
In the base case (Scenario A), the status quo was maintained with lower size limits at 150 mm CL and upper size limits at 215 mm CL for both sexes, a spawning season closure for females between April-October and protection of berried females outside this period, and a TACC of 60 tonnes. For scenario B, the upper size limit of 215 mm CL was removed. By allowing the catch of larger crabs (mainly males), fishing pressure on smaller males and females could be reduced. Females were allowed to be taken all year in scenario C by removing the spawning season closure for females in winter from April to October and the protection of berried females from fishing outside the spawning closure. The annual model estimated the effect of these management measures by summing up the catch-weighted proportions of females that were returned during the closed season and due to egg-bearing each month. Assuming constant sex ratios throughout the year, the annual proportion of returned females was only 17.5%, since catches are considerably lower in winter than during the remainder of the year. For scenario D, the lower size limits for males and females were altered individually between 120-160 mm in 10 mm steps. This approach was combined with alternative TACC levels of 50t and 40t in the scenarios E an F. This allowed finding concurrent biological and economic outcomes under a range of different size limit and TACC combinations. Of particular interest were the decrease of the lower size limits for males and females to 140 mm or 130 mm, and a selective decrease of size limits for males only.

Giant Crab Size Limits
FRDC Final Report 2006/022 Page 23
6.3 Results
6.3.1 Management scenarios under the current TAC
Since 1999, annual revenue from the giant crab fishery has fluctuated between AU$ 2-3 million (Figure 5). Revenue was low due to small catches in the partial fishing years 1998 and 1999, and decreased strongly in 2004 due to a reduction of the TACC from around 105 tonnes to 62 tonnes. The fluctuations were consistent among the three size splits and therefore a function of catch and beach price rather than the catch composition. Small crab <3 kg contributed most to total revenue, while the proportion of large crabs >5 kg was small. In the projections of the status quo with a TACC of 60 tonnes (scenario A), the contribution of these large crabs further decreased in favour of small crabs. Nevertheless, the overall revenue remained stable.
This projection of stable revenue with narrow confidence intervals was contrasted by highly variable catch rates that were likely to fall in scenario A (Figure 7). They were predicted to remain constant only under the most favourable recruitment conditions. As a consequence, fishing effort and related costs were likely to increase, thus substantially eroding the already minor annual profit gained from the giant crab fishery to less than a median of AU$ 1 million. In contrast, egg production was predicted to remain largely unchanged.
Giant Crab Size Limits
FRDC Final Report 2006/022 Page 24
1990 1995 2000 2005 2010 2015
0.0
0.5
1.0
1.5
Rev
enue
<3k
g (
Mio
$)
1990 1995 2000 2005 2010 2015
0.0
1.0
2.0
3.0
Tota
l Rev
enu
e (M
io $
)
1990 1995 2000 2005 2010 2015
0.0
0.2
0.4
0.6
0.8
1.0
1.2
Rev
enu
e 3-
5kg
(Mio
$)
1990 1995 2000 2005 2010 2015
0.0
0.1
0.2
0.3
0.4
0.5
0.6
Rev
enue
>5k
g (
mio
$)
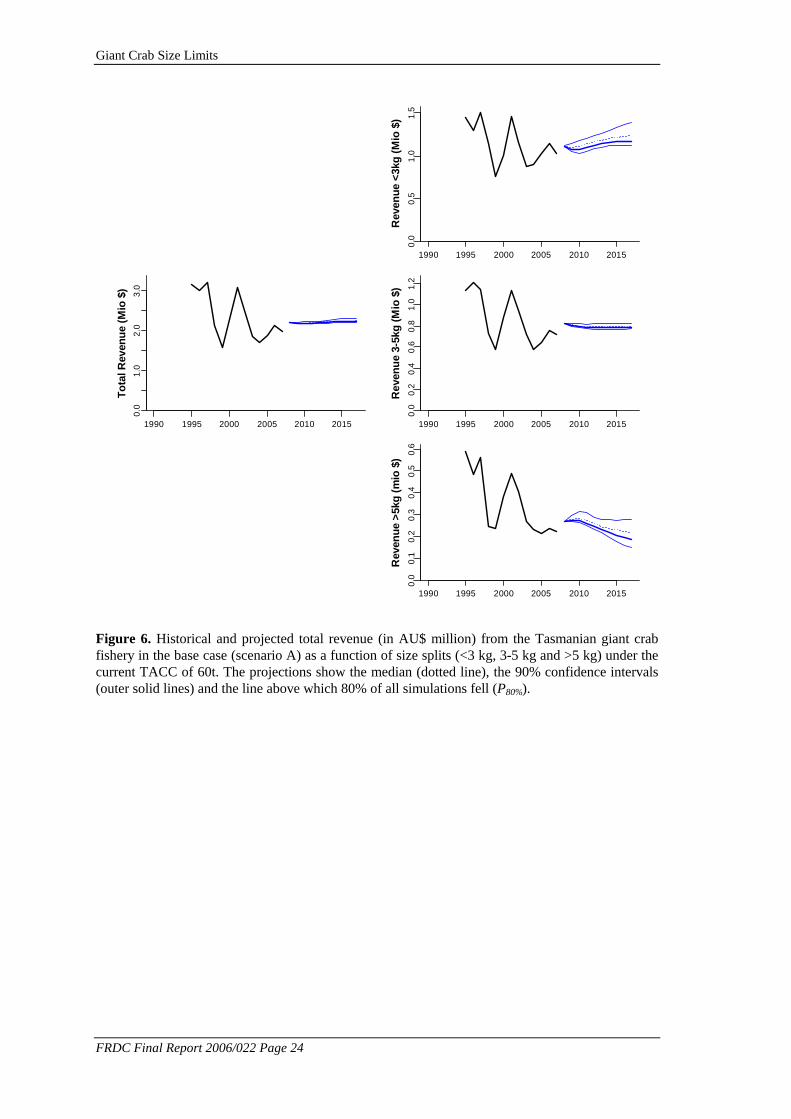
Figure 6. Historical and projected total revenue (in AU$ million) from the Tasmanian giant crab fishery in the base case (scenario A) as a function of size splits (<3 kg, 3-5 kg and >5 kg) under the current TACC of 60t. The projections show the median (dotted line), the 90% confidence intervals (outer solid lines) and the line above which 80% of all simulations fell (P80%).

Giant Crab Size Limits
FRDC Final Report 2006/022 Page 25
1990 1995 2000 2005 2010 2015
05
01
50
25
0
Cat
ch (
t)
1990 1995 2000 2005 2010 2015
0.0
0.2
0.4
0.6
0.8
1.0
Cat
ch R
ates
1990 1995 2000 2005 2010 2015
05
01
00
20
0
Rel
ativ
e E
ffo
rt
1990 1995 2000 2005 2010 2015
0.0
0.5
1.0
1.5
2.0
2.5
Co
st (
Mio
$)
1990 1995 2000 2005 2010 2015
0.0
1.0
2.0
3.0
Rev
enu
e (M
io $
)
1990 1995 2000 2005 2010 2015
0.0
0.5
1.0
1.5
2.0
Pro
fit
(Mio
$)
1990 1995 2000 2005 2010 2015
04
00
80
01
20
0
Exp
l Bio
mas
s (t
)
1990 1995 2000 2005 2010 20150e
+0
02
e+
05
4e
+0
5
Eg
g P
rod
uct
ion
Figure 7. Historical and projected catch, catch rates, relative effort, costs (assuming of $32/pot lift), revenue and profit (in million AU$), exploitable biomass (in tonnes), and egg production for the base case (scenario A) under the current TACC of 60t. The projections show the median (dotted line), the 90% confidence intervals (outer solid lines) and the line above which 80% of all simulations fell (P80%).
Giant Crab Size Limits
FRDC Final Report 2006/022 Page 26
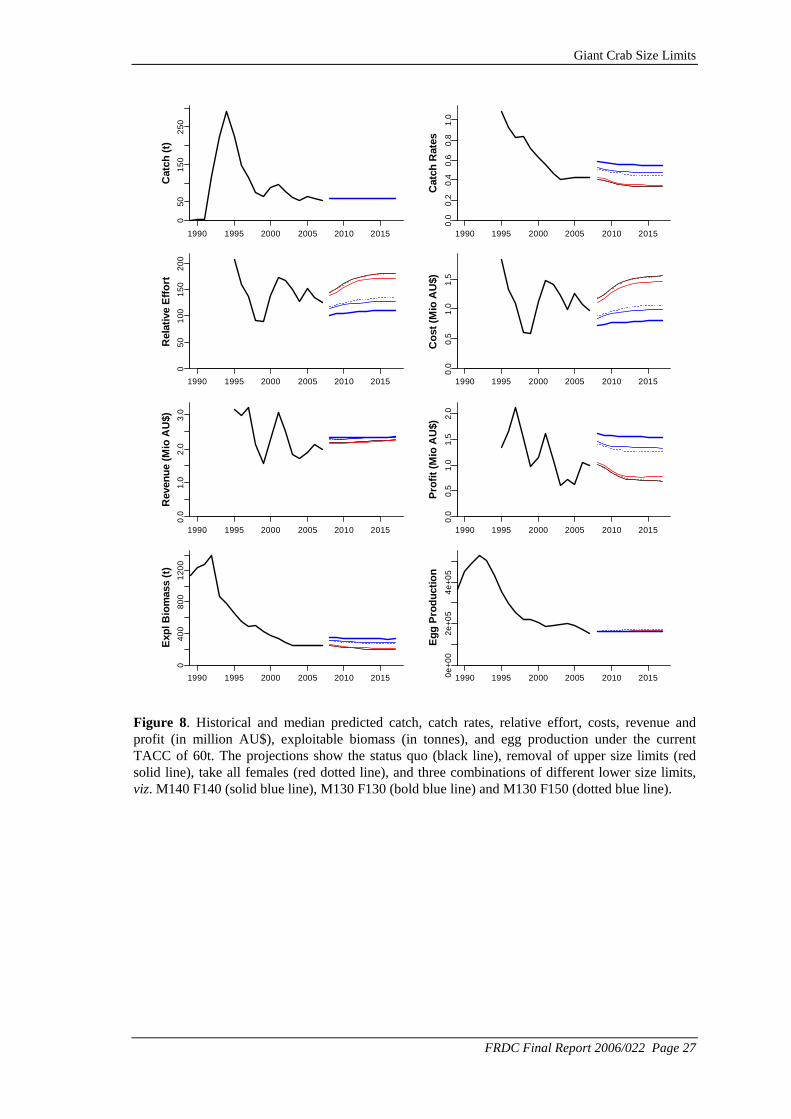
The various management scenarios had relatively little effect on revenue and egg production, but some showed strong effects on exploitable biomass, catch rates and related measures of effort and fishing costs. Compared to the current upper size limits at 215 mm, the removal of these upper size limits in scenario B had minimal effect on all results (Figure 8). Due to the significantly lower beach prices for larger crabs, only a very small proportion of the catch is currently made up of crabs over 5kg. Fishers record the number of large crabs discarded but this is only a trivial number each year (Table 1). Removing the upper size limit is therefore an ineffective measure to increase the NPV of the fishery or the mature biomass of females.
Similarly, the take of females all year had little effect on projections, since only a low proportion of the TACC is currently caught in winter months (Ziegler et al. 2009). However, some fishers could shift fishing effort into winter months if all females including berried females were allowed to be retained, and changes in fleet dynamics are possible. Such fleet dynamics changes, together with a substantial increase in catch rates through the retention of males and females instead of only males, are not represented in the model and thus the impact of this scenario is underestimated. The economic outcome of a shift to more winter catch is unclear, since increases in revenue due to higher beach price may be offset by higher fishing cost as catch rates are still lower during winter than summer. While the model predicted no impact on egg production, increased winter fishing could even have the potential of increasing egg production. Sex ratios in the catch in winter are biased towards males, while sex ratios in summer tend to be biased towards females, so relatively fewer females would be captured throughout the year. This ignores any possible direct negative impact of fishing on egg bearing and release.
Giant Crab Size Limits
FRDC Final Report 2006/022 Page 27
1990 1995 2000 2005 2010 2015
050
150
250
Cat
ch (
t)
1990 1995 2000 2005 2010 2015
0.0
0.2
0.4
0.6
0.8
1.0
Cat
ch R
ates
1990 1995 2000 2005 2010 2015
05
01
001
5020
0
Rel
ativ
e E
ffo
rt
1990 1995 2000 2005 2010 2015
0.0
0.5
1.0
1.5
Co
st (
Mio
AU
$)
1990 1995 2000 2005 2010 2015
0.0
1.0
2.0
3.0
Rev
enu
e (M
io A
U$)
1990 1995 2000 2005 2010 2015
0.0
0.5
1.0
1.5
2.0
Pro
fit
(Mio
AU
$)
1990 1995 2000 2005 2010 2015
040
080
01
200
Exp
l Bio
mas
s (t
)
1990 1995 2000 2005 2010 20150e
+00
2e+0
54
e+0
5
Eg
g P
rod
uct
ion
Figure 8. Historical and median predicted catch, catch rates, relative effort, costs, revenue and profit (in million AU$), exploitable biomass (in tonnes), and egg production under the current TACC of 60t. The projections show the status quo (black line), removal of upper size limits (red solid line), take all females (red dotted line), and three combinations of different lower size limits, viz. M140 F140 (solid blue line), M130 F130 (bold blue line) and M130 F150 (dotted blue line).

Giant Crab Size Limits
FRDC Final Report 2006/022 Page 28
Status quo No upper SL Take All F M140 F140 M130 F130 M130 F150
0.0
0.2
0.4
0.6
0.8
1.0
Cat
ch R
ates
2017
Status quo No upper SL Take All F M140 F140 M130 F130 M130 F150
05
01
00
15
02
00
25
03
00
Rel
ativ
e E
ffo
rt
2017
Status quo No upper SL Take All F M140 F140 M130 F130 M130 F150
0.0
0.5
1.0
1.5
2.0
2.5
3.0
Co
st (
Mio
AU
$)
2017
Status quo No upper SL Take All F M140 F140 M130 F130 M130 F150
0.0
0.5
1.0
1.5
2.0
2.5
3.0
Rev
enue
(M
io A
U$)
2017
Status quo No upper SL Take All F M140 F140 M130 F130 M130 F150
-10
12
3
Pro
fit (
Mio
AU
$)
2017
Status quo No upper SL Take All F M140 F140 M130 F130 M130 F1500
51
01
5
Pre
sent
Val
ue
(Mio
AU
$)
Status quo No upper SL Take All F M140 F140 M130 F130 M130 F150
010
02
003
0040
050
0
Exp
l Bio
mas
s (t
)
2017
Status quo No upper SL Take All F M140 F140 M130 F130 M130 F150
020
040
06
0080
012
00
Tota
l Bio
mas
s (t
)
2017
Status quo No upper SL Take All F M140 F140 M130 F130 M130 F150
050
000
1500
00
250
000
Egg
Pro
duc
tion
2017
Figure 9. Boxplots for predicted catch rates, relative effort, costs, revenue and profit (in million AU$) in 2017, net present value (assuming d = 0.03), exploitable biomass and total biomass (in tonnes), and egg production under the current TACC of 60t for the status quo (M150 F150), removal of upper size limits, take all females, and three combinations of different lower size limits, viz. M140 F140, M130 F130 and M130 F150.

Giant Crab Size Limits
FRDC Final Report 2006/022 Page 29
6.3.2 Size limits changes under the current TAC
Similar to scenarios B and C, altering the lower size limits for either males or females in scenario D had little effect on gross revenue under the current TACC (Figure 8 and 9). In three selected levels for size limit changes in Figure 8, viz. male and female size limits at 140 mm and 130 mm (M140 F140 and M130 F130), and for reduced size limits for males only to 130 mm (M130 F150), the revenue in 2017 was only marginally higher for the selected scenarios.
However, varying the lower size limits substantially altered the levels of exploitable biomass available to the fishery which was estimated at only 18% of virgin levels in 2007. Generally, lower levels of exploitable biomass exacerbated the high dependence of the fishery on recruitment success and therefore increased variability in fishing effort, costs and profit. This effect can be seen across the selected scenarios in Figure 9, where the scenarios with reduced size limits have higher levels of exploitable biomass but lower levels and variability in costs and profit compared to the three scenarios with the current size limits.
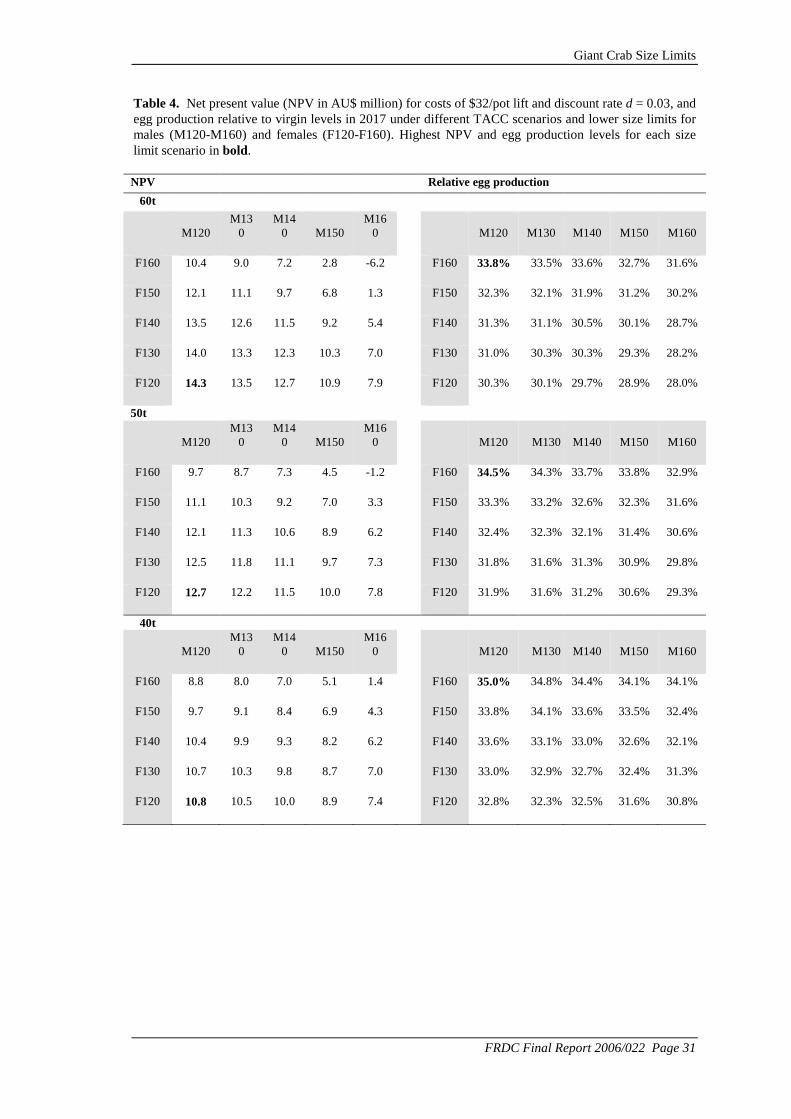
Due to the relatively stable revenue, the NPV was almost a direct function of fishing costs and the underlying exploitable biomass. The highest NPV of AU$ 14.3 million over the 10-year projection period was achieved when the lower size limits of both sexes were reduced to 120 mm CL (Figure 10, Table 4). At the other end of the spectrum, the fishery would be highly unprofitable (AU$ -6.2 million) if size limits of males and females were raised to 160 mm CL. For the current size limits, NPV was estimated to be about AU$ 6.8 million.
While the NPV varied strongly with sex-specific size limits, relative egg production after the 10-year projections was remarkably similar across a range of size limits for males or females. Relative egg production in 2017 was predicted to be 31.2% of virgin levels for the current size limits, 30.5% for 140 mm CL size limits and 30.3% for 130 mm CL size limits for both sexes. Egg production peaked at 33.8% when females received better protection from fishing than males with higher minimum size limits for females (160 mm CL) than males (120 mm CL) and proportionally more male crabs were being removed to catch the TAC. In the most unfavourable scenario with 120 mm CL size limits for females and 160 mm CL size limits for males, egg production was still 28.0% of virgin levels. However, given the enormous variability in egg production that was independent of size limits (Figure 9), changes in observed egg production are likely due to random recruitment variability in addition to potential changes based on altered size limits.

Giant Crab Size Limits
FRDC Final Report 2006/022 Page 30
Figure 10. Contour graphs with median for net present value (NPV in million AU$, left) and egg production relative to virgin levels (right) assuming $32/trap lift and discount rate d = 0.03 at different levels of size limits for female and male giant crab under different TACC levels.
-5
0
5
10
15
120 130 140 150 160120
130
140
150
160
Male size limits (mm)
Fem
ale
size
lim
its (
mm
)
NPV (Mio AU$)TACC 60t
0.26
0.28
0.30
0.32
0.34
0.36
120 130 140 150 160120
130
140
150
160
Male size limits (mm)
Relative Egg Production in 2017
-5
0
5
10
15
120 130 140 150 160120
130
140
150
160
Male size limits (mm)
Fem
ale
size
lim
its
(mm
)
NPV (Mio AU$)TACC 50t
0.26
0.28
0.30
0.32
0.34
0.36
120 130 140 150 160120
130
140
150
160
Male size limits (mm)
Relative Egg Production in 2017
-5
0
5
10
15
120 130 140 150 160120
130
140
150
160
Male size limits (mm)
Fem
ale
size
lim
its (
mm
)
NPV (Mio AU$)TACC 40t
0.26
0.28
0.30
0.32
0.34
0.36
120 130 140 150 160120
130
140
150
160
Male size limits (mm)
Relative Egg Production in 2017
Giant Crab Size Limits
FRDC Final Report 2006/022 Page 31
Table 4. Net present value (NPV in AU$ million) for costs of $32/pot lift and discount rate d = 0.03, and egg production relative to virgin levels in 2017 under different TACC scenarios and lower size limits for males (M120-M160) and females (F120-F160). Highest NPV and egg production levels for each size limit scenario in bold.
NPV Relative egg production
60t
M120 M13
0 M14
0 M150 M16
0 M120 M130 M140 M150 M160
F160 10.4 9.0 7.2 2.8 -6.2 F160 33.8% 33.5% 33.6% 32.7% 31.6%
F150 12.1 11.1 9.7 6.8 1.3 F150 32.3% 32.1% 31.9% 31.2% 30.2%
F140 13.5 12.6 11.5 9.2 5.4 F140 31.3% 31.1% 30.5% 30.1% 28.7%
F130 14.0 13.3 12.3 10.3 7.0 F130 31.0% 30.3% 30.3% 29.3% 28.2%
F120 14.3 13.5 12.7 10.9 7.9 F120 30.3% 30.1% 29.7% 28.9% 28.0%
50t
M120 M13
0 M14
0 M150 M16
0 M120 M130 M140 M150 M160
F160 9.7 8.7 7.3 4.5 -1.2 F160 34.5% 34.3% 33.7% 33.8% 32.9%
F150 11.1 10.3 9.2 7.0 3.3 F150 33.3% 33.2% 32.6% 32.3% 31.6%
F140 12.1 11.3 10.6 8.9 6.2 F140 32.4% 32.3% 32.1% 31.4% 30.6%
F130 12.5 11.8 11.1 9.7 7.3 F130 31.8% 31.6% 31.3% 30.9% 29.8%
F120 12.7 12.2 11.5 10.0 7.8 F120 31.9% 31.6% 31.2% 30.6% 29.3%
40t
M120 M13
0 M14
0 M150 M16
0 M120 M130 M140 M150 M160
F160 8.8 8.0 7.0 5.1 1.4 F160 35.0% 34.8% 34.4% 34.1% 34.1%
F150 9.7 9.1 8.4 6.9 4.3 F150 33.8% 34.1% 33.6% 33.5% 32.4%
F140 10.4 9.9 9.3 8.2 6.2 F140 33.6% 33.1% 33.0% 32.6% 32.1%
F130 10.7 10.3 9.8 8.7 7.0 F130 33.0% 32.9% 32.7% 32.4% 31.3%
F120 10.8 10.5 10.0 8.9 7.4 F120 32.8% 32.3% 32.5% 31.6% 30.8%
Giant Crab Size Limits
FRDC Final Report 2006/022 Page 32
6.3.3 Different size limit combinations and TACC changes
For most size limit combinations, the NPV was highest under the current TACC of 60t, since higher annual revenue of around AU$ 350,000 per 10t of catch outweighed higher fishing costs (Figure 10, Table 4). However, the highest TACC also produced the strongest contrast in NPVs between the different size limit combinations because the fishery became increasingly reliant on recruits. When size limits were increased to 160 mm CL for both sexes thus strongly limiting exploitable biomass, the NPV under the current TACC turned negative and lower TACC levels were more profitable.
With the current size limits of 150 mm CL, the three TACC levels resulted in similar NPVs (AU$ 6.8-7.0 million) with lower revenue levels compensating for lower cost levels. Therefore, the TACC could be decreased by 20t without diminishing the NPV achieved with the current TAC. With lowered size limits, maintaining the current TACC level compared to lowering the TACC to 40t resulted in NPV gains of AU$ 1.6 million for 130 mm CL size limits of males only (M130 F150) and AU$ 3 million for 130 mm CL size limits of both sexes (M130 F130).
Maintaining the current TACC appeared to have two major disadvantages. Firstly, long-term declining trends in catch rates, real price and profit indicated that the current TACC was too high for optimal exploitation of the stock (Figure 8). Even where reduced size limits positively influenced the economic outputs in the short-term, the gains in exploitable biomass and catch rates were gradually eroded over time. With effort and costs increasing as a consequence, profits were likely to fall over the projection period. This effect was consistent across all size limit scenarios, albeit to a different degree. Thus, the current TACC was not considered to be sustainable for the fishery in the long-term, while both exploitable biomass and catch rates were likely to stabilise and even increase with lower TACCs of 50t and 40t. These results also indicate that the differences in NPVs between the three TACC levels would decline with increasing length of the projections.
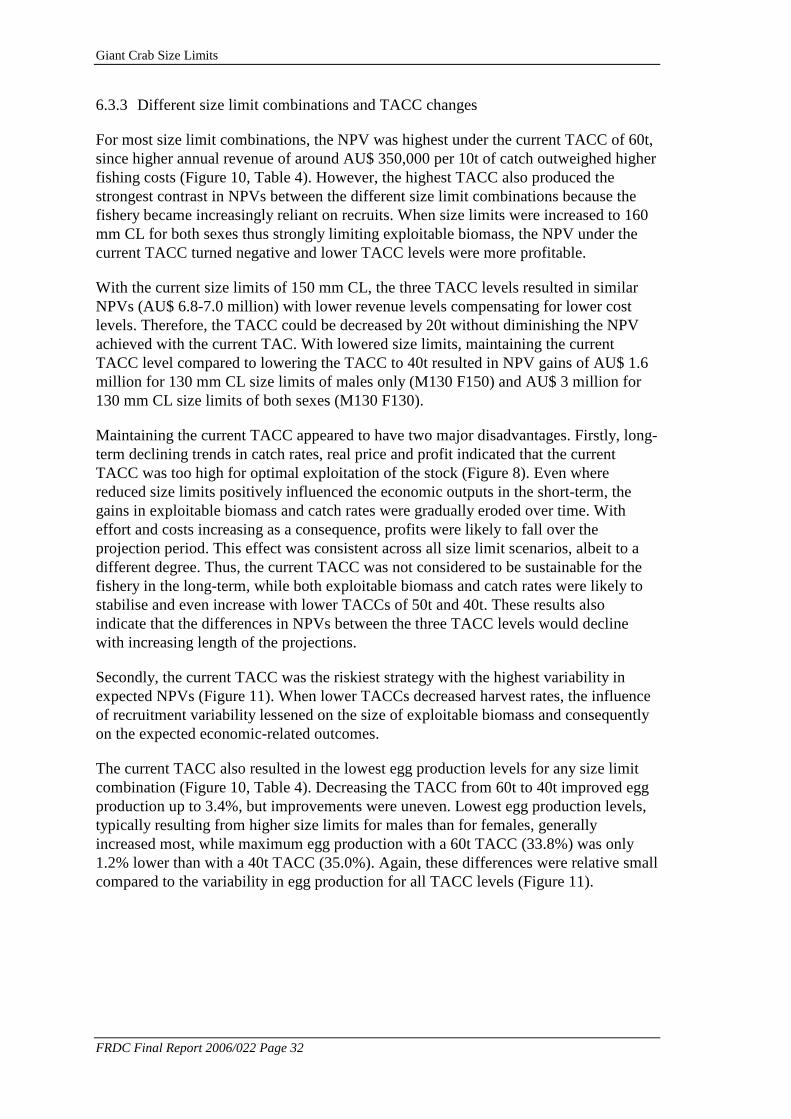
Secondly, the current TACC was the riskiest strategy with the highest variability in expected NPVs (Figure 11). When lower TACCs decreased harvest rates, the influence of recruitment variability lessened on the size of exploitable biomass and consequently on the expected economic-related outcomes.
The current TACC also resulted in the lowest egg production levels for any size limit combination (Figure 10, Table 4). Decreasing the TACC from 60t to 40t improved egg production up to 3.4%, but improvements were uneven. Lowest egg production levels, typically resulting from higher size limits for males than for females, generally increased most, while maximum egg production with a 60t TACC (33.8%) was only 1.2% lower than with a 40t TACC (35.0%). Again, these differences were relative small compared to the variability in egg production for all TACC levels (Figure 11).

Giant Crab Size Limits
FRDC Final Report 2006/022 Page 33
Status quo No upper SL Take All F M140 F140 M130 F130 M130 F150
05
101
5
Pre
sent
Val
ue (M
io A
U$) TAC 60t
Status quo No upper SL Take All F M140 F140 M130 F130 M130 F150
0.0
0.1
0.2
0.3
0.4
0.5
Rel
ativ
e E
gg
Pro
du
ctio
n
2017
Figure 11a. Net present value (in million$) assuming $32/trap lift and discount rate d = 0.03, and relative egg production in 2017 compared to virgin levels under different TACC levels.
Giant Crab Size Limits
FRDC Final Report 2006/022 Page 34
Status quo No upper SL Take All F M140 F140 M130 F130 M130 F150
05
10
15
Pre
sen
t V
alu
e (M
io A
U$) TAC 50t
Status quo No upper SL Take All F M140 F140 M130 F130 M130 F150
0.0
0.1
0.2
0.3
0.4
0.5
Rel
ativ
e E
gg
Pro
du
ctio
n
2017
Status quo No upper SL Take All F M140 F140 M130 F130 M130 F150
05
10
15
Pre
sen
t V
alu
e (M
io A
U$) TAC 40t
Status quo No upper SL Take All F M140 F140 M130 F130 M130 F150
0.0
0.1
0.2
0.3
0.4
0.5
Rel
ativ
e E
gg
Pro
du
ctio
n
2017
Figure 11 (cont.). Net present value (in million$) assuming $32/trap lift and discount rate d = 0.03,
and relative egg production in 2017 compared to virgin levels under different TACC levels.

Giant Crab Size Limits
FRDC Final Report 2006/022 Page 35
6.3.4 Sensitivity of outcomes to different cost levels
Sensitivities of NPV estimates to cost levels were examined in additional scenarios (Figure 12). Increasing or decreasing cost levels by AU$ 5/pot lift affected scenarios with higher size limits more strongly, at about AU$ ±1.9 million with the current size limits compared to AU$ ±1.0 million with 130 mm CL size limits for both males and females (M130 F130). While the difference in NPVs between the three TACC levels declined for most size limit combinations, it did not alter their relative performance, e.g. the NPVs were still highest under the current 60t TACC for all size limit combinations other than the current size limits.
Status quo No upper SL Take All F M140 F140 M130 F130 M130 F150
-50
51
01
52
0
NP
V (
Mio
AU
$)
$27/pot lift
Status quo No upper SL Take All F M140 F140 M130 F130 M130 F150
-50
51
01
52
0
NP
V (
Mio
AU
$)
$32/pot lift
Status quo No upper SL Take All F M140 F140 M130 F130 M130 F150
-50
51
01
52
0
NP
V (M
io A
U$)
$37/pot lift
Figure 12. Boxplots for net present value under the current TACC of 60t with different costs per pot lift for the status quo (M150 F150), removal of upper size limits, take all females, and three combinations of different lower size limits, viz. M140 F140, M130 F130 and M130 F150.

Giant Crab Size Limits
FRDC Final Report 2006/022 Page 36
6.4 Discussion
Management scenarios for alternative catch levels and size limit scenarios offered a clear perspective of trade-off between maximising economic and biological outputs from the giant crab fishery in Tasmania. Both NPV and egg production could be increased through selectively lowering the size limits for males. While the NPV was highest with such size limits under the current TACC of 60t, egg production would further benefit from lower TACC levels. Maintaining the current size limits, the NPV was similar for a range of TACC levels due to neutralised changes in revenue and fishing costs.
6.4.1 Revenue
Given a TACC level, the alternative management scenarios for lower and upper size limits and the take of females had little effect on gross revenue. The perceived benefit of catching smaller crabs at a higher $/kg beach price, commonly stated by fishers as their main motivation to decrease the size limits, was negligible compared to the effect of changing size limits on fishing costs. The focus of fishing industries on revenue rather than cost is a consistent feature of fisheries economics.
6.4.2 Fishing costs
Lower TACCs led to increased profit and NPV in some instances due to a balance between reduced revenue and fishing costs. Because exploitable biomass was at relatively low levels at the start of the projection period (i.e. currently), both TACC levels and size limits substantially altered the available exploitable biomass. These variations were reflected in the effort needed to catch the TACC and fishing costs became an important factor in determining the NPV.
6.4.3 Best strategy
Although the current TACC achieved the highest NPV for many of the tested scenarios, it was a risky and ultimately unsustainable strategy because of likely further decreases in exploitable biomass and catch rates. Over the projected period of 10 years, these decreases resulted in substantially raised fishing costs and it appeared likely that the economic performance would further deteriorate in the long term. In contrast, exploitable biomass and catch rates stabilised or slightly increased under a reduced catch of 50t or 40t. The current TACC produced also the highest variability in economic estimates and the lowest egg production levels of the scenarios examined.
Improving the NPV and egg production concurrently could be achieved in several ways. Firstly, with the current TACC size limits for males could be selectively lowered to provide females with better protection from fishing than males. For example, reducing the male size limit to 130 mm CL but retaining the female size limit at 150 mm CL would result in a median increase in NPV from AU$ 6.8 million to AU$ 11.1 million and in egg production from 31.2% to 32.1% (Table 4).
Giant Crab Size Limits
FRDC Final Report 2006/022 Page 37
Secondly, this size limit change could be combined with a lower TAC. At a TACC of 50t and 40t, NPV was still AU$ 10.3 million and AU$ 9.1 million, but egg production increased further to 33.2% and 34.1%, respectively. A range of TACC and size limit combinations achieved higher NPVs and egg production levels, however with a trade-off between the two. In the end, it will be a management decision on the preferred balance between economic and biological goals for the fishery. Consideration about higher economic stability and certainty for the fishery under lower TACC levels will also influence the preferred option.
6.4.4 Lowering size limits for males
Assuming no sperm limitation, keeping female size limits at 150mm and reducing male size limits e.g. to 130mm could both increase NPV and egg production.
The effects of a selective lowering of size limits for males will be weaker on the east coast catch due to female-dominated catches (~65% of catch are females). In the west the proportion of females has continuously decreased since 2003 and they contributed about 40% of the total catch in 2007.
The model predicted only small differences compared to the status quo when removing the upper size limits or allowing the harvest of all females including berried animals (the model underestimates the effects of the latter).
Median egg production was not predicted to drop below 28% of virgin levels even under the most unfavourable management choices, i.e. a TACC of 60t combined with much higher size limits for males than for females (M160 F120). This is due to low size at onset of maturity (relative the legal minimum length) and multiple year intermoult periods even at smaller sizes.
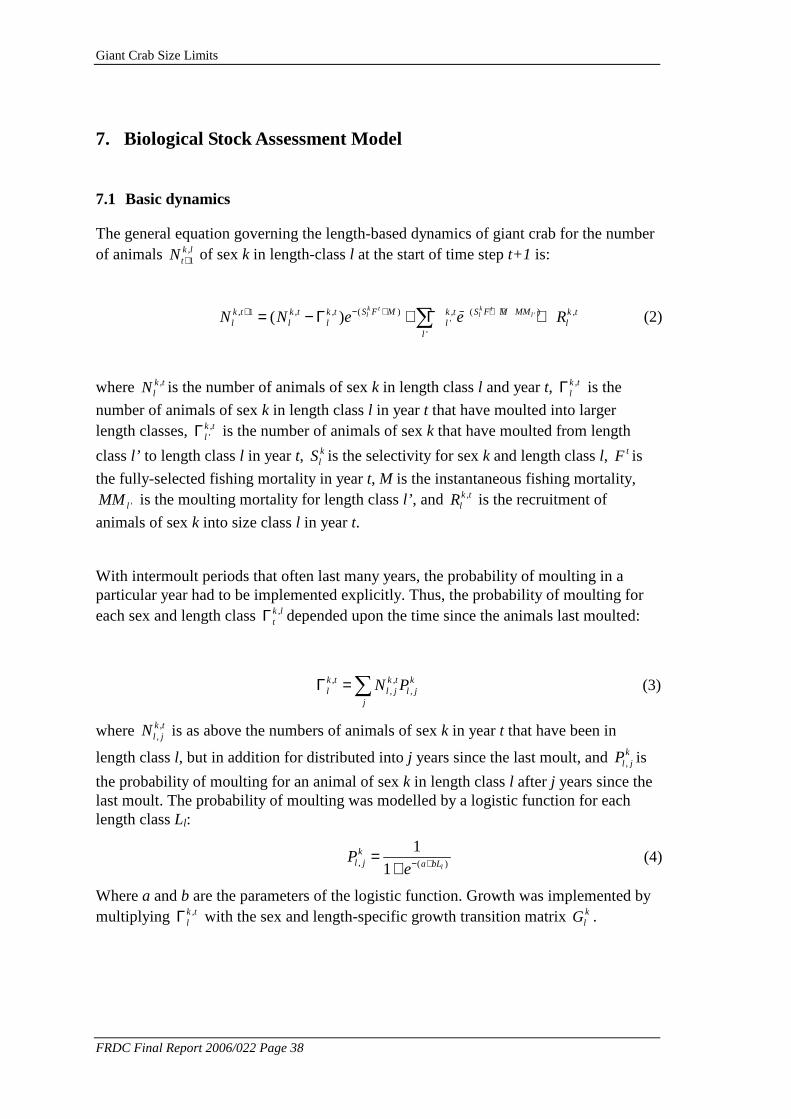
Giant Crab Size Limits
FRDC Final Report 2006/022 Page 38
7. Biological Stock Assessment Model
7.1 Basic dynamics
The general equation governing the length-based dynamics of giant crab for the number of animals ,
1k ltN + of sex k in length-class l at the start of time step t+1 is:
'( ) ( ), 1 , , , ,'
'
( )k t k tl l lS F M S F M MMk t k t k t k t k t
l l l l ll
N N e e R− + − + ++ = − Γ + Γ +∑ (2)
where ,k tlN is the number of animals of sex k in length class l and year t, ,k t
lΓ is the
number of animals of sex k in length class l in year t that have moulted into larger length classes, ,
'k tlΓ is the number of animals of sex k that have moulted from length
class l’ to length class l in year t, klS is the selectivity for sex k and length class l, tF is
the fully-selected fishing mortality in year t, M is the instantaneous fishing mortality,
'lMM is the moulting mortality for length class l’ , and ,k tlR is the recruitment of
animals of sex k into size class l in year t.
With intermoult periods that often last many years, the probability of moulting in a particular year had to be implemented explicitly. Thus, the probability of moulting for each sex and length class ,k l
tΓ depended upon the time since the animals last moulted:
, ,, ,
k t k t kl l j l j
j
N PΓ =∑ (3)
where ,,k tl jN is as above the numbers of animals of sex k in year t that have been in
length class l, but in addition for distributed into j years since the last moult, and ,k
l jP is
the probability of moulting for an animal of sex k in length class l after j years since the last moult. The probability of moulting was modelled by a logistic function for each length class Ll:
, ( )
1
1 l
kl j a bLP
e− +=+
(4)
Where a and b are the parameters of the logistic function. Growth was implemented by multiplying ,k t
lΓ with the sex and length-specific growth transition matrix klG .
Giant Crab Size Limits
FRDC Final Report 2006/022 Page 39
7.2 Recruitment
Instead of a pre-defined stock-recruitment relationship such as the Beverton-Holt relationship, recruitment for each year of the fishery was estimated as geometric mean
recruitment level Rmultiplied by a log-normal recruitment residuals εt. With a moult increment of around 30 mm at the smallest length class of 80 mm, recruitment is assumed to occur into the first six 5-mm length classes with a sex ratio of 1:1, so that:
, /12.0 if 1 l 6tk tlR Reε= ≤ ≤ (5)
where ,k tlR is the recruitment into length class l for sex k in year t. Recruitment
variability was restricted through a penalty function that is added to the total log-likelihood:
( )2
122
yearst
t
R
Penaltyε
σ==∑
(6)
where σR is the coefficient of variation for the recruitment residuals.
7.3 Egg production
While the model does not explicitly predict a relationship between egg production and the numbers of animals recruiting to the fishery, it estimates egg production as a measure for the reproductive potential of the giant crab population:
,t fem tl l l
l
SB mQ O N=∑ (7)
where m is the proportion of females that produce eggs each year (Table 2), Ql is the maturity at length that is described by a logistic function relating the proportion of females mature to their size-class Ll:
( )
1
1 ll c dLQe− +=
+ (8)
with c and d parameters of the relationship (Table 2), and fecundity Ol is a power relationship that is assumed between fecundity and the length class Ll of female crabs (Gardner 1997):
fl lO eL= (9)
where c and d are the parameters of the power relationship (Table 2). Extrusion of eggs occurs in May and extends through to November. The fishery is closed for females during the main spawning season (currently June 1 to November 14) and berried females must be also returned at all other times.

Giant Crab Size Limits
FRDC Final Report 2006/022 Page 40
7.4 Selectivity
Selectivity is described by a logistic function with specific parameters for sex k. A logistic function is fitted with two parameters L50k and L95k representing the carapace lengths at which 50% and 95% are selected:
( ) 50Ln 19
95 50
10 ,
k
k k
kl l L
L L
kl
S MinSL l MaxSL
eS l MinS oL l MaxSL
π −− −
= < <
+= < >
(10)
where L95k = L50k x Scale95k. The scaling parameter Scale95k is constrained to values between 1.01 – 1.5 to ensure that the L95k is greater than the L50k. All non-legalsized animals (below the minimum size limits MinSL and above the maximum size limits MaxSL) are assumed to be returned without discard mortality and their selectivity therefore equals zero. The selectivity for females was modified by a constant π to account for females that were returned during the closed season and due to egg-bearing assuming constant sex ratios throughout the year. For males π was set to 1.0.
7.5 Catches
The total commercial catch ˆ tC in year t was assumed to be taken in the middle of the season, after half the natural mortality and growth of those animals that were to moult had occurred. The catch was calculated from the harvest rate tH and exploitable biomass t
EB :
max
,
1
ˆL
t t t t k t k kE l l l
k l
C H B H N W S=
= = ∑∑ (11)
where klW is the weight of an animal of sex k and length class l:
kk k p
l lW o L= (12)
and ck and dk are the sex-specific weight-at-length relationship parameters (Table 2).
7.6 Likelihood functions for model fitting
The model was fitted by combining the negative of the logarithm of the likelihood functions from catch rates (-LLCE) and length-frequency data (-LLLF) that were weighed with the inverse proportion to their respective variation (WtCE and WtLF) i.e. less weight to the more variable, and the penalty term from the recruitment residuals:
-LL = -LLCE * WtCE + -LLLF * WtLF + Penalty (13)

Giant Crab Size Limits
FRDC Final Report 2006/022 Page 41
The contribution of the catch rate data to the negative of the logarithm of the likelihood function was based on the assumption that catch rates were log-normally distributed:
( ) ( )( ) ( )2 1ˆ22 tCE
t
nILL LnLn Lnπ σ− = − −+ + ∑ (14)
where n is the total number of years for which catch rates were available, It is the observed catch rate in year t, and σ̂ is:
( ) ( )( )2
ˆ
tt E
t
ILn Ln qB
nσ
−=∑
(15)
where q is the catchability coefficient, and tEB is the exploitable biomass in year t after
half of natural mortality and growth have occurred. The summation term of Ln(It) is a constant and can be omitted in the negative log-likelihood.
A closed form of analytic estimation was used to estimate catchability by comparing the observed catch rates with the exploitable biomass that gave rise to the catch rates (Haddon 2001). The catchability coefficient q̂ was assumed to be constant and each
annual ̂ tq to be an estimate of the overall q̂ . The maximum likelihood estimate of q̂
was determined by:
( )/
ˆ expE
t tt
Ln I Bq
n
=
∑ (16)
The length-frequency data was fitted using a negative of the multinomial log-likelihood (Quinn and Deriso 1999, Haddon 2001):
( ) ( )( ), , ,, ,ˆk t k t k tk t k tLF l ll l
t l
LL N p Ln p Lnp p− = − −∑ ∑ (17)

Giant Crab Size Limits
FRDC Final Report 2006/022 Page 42
where ,k tN is the total sample size for sex k and year t, ,k tlp is the observed proportion
in each length class l, and ,ˆ k tlp is the predicted proportion in each length class l. The
second term that is constant and depends only on the observed proportions causes the log-likelihood for the observation to approach zero from below as the model fit improves. As ‘effective’ sample size the square root rather than the real the sample size was used, because samples which are usually taken in clusters can have a reduced within-cluster variance relative to samples where fish are taken individually.
7.7 Equilibrium state
For many years before the giant crab fishery developed, rock lobster fishers caught predominantly large males as minor bycatch. Few crabs were landed and the stock was essentially unfished until the target fishery developed in 1993. It was therefore assumed that the stock was in equilibrium with mean recruitment levels at the time the fishery began. Equilibrium conditions in the absence of fishing could not be determined analytically due to the length-specific years-since-moult matrix, but were attained iteratively after 200 passes.

Giant Crab Size Limits
FRDC Final Report 2006/022 Page 43
8. Benefits and adoption
This project led to management changes of the Tasmanian giant crab estimated to increase net present value of future profits from the fishery (discount rate 7%) by $1 million, increase egg production marginally (by around 3%), reduce inter-annual variability in business earnings, and reduce any ecosystem effects of fishing by increasing residual biomass.
These changes occurred through revision of the fishery rules in relation to size limits and TACC to implement project recommendations.
Future changes resulting from the project are expected through:
a) ongoing application of the bioeconomic modelling capacity developed through this project
b) specific review of the current maximum size limit through results of this project, scheduled for discussion by the Ministerial Crustacean Fishery Advisory Committee meeting, November 2009.
Giant Crab Size Limits
FRDC Final Report 2006/022 Page 44
9. Further development
The bio-economic model developed through this project for the Tasmanian giant crab fishery will continue to provide value for fisheries management, however its value could be enhanced. Two consistent themes emerged throughout the results presented here:
a) this fishery was slow to respond to management changes due to the slow growth rate of giant crabs. Stability also occurred in economic analyses as price in this fishery has been remarkably stable through time. We conclude that research resources for this small fishery would be best utilised by conducting less frequent but more detailed assessments, rather than annual less detailed assessments.
b) As with all assessment models, more data would have been helpful and should be targeted for future application of the model. Data types that should be targeted through future sampling are ongoing cost and price data collection and improved length frequency sampling, especially off eastern Tasmania.

Giant Crab Size Limits
FRDC Final Report 2006/022 Page 45
10. References
Clark, W.G. (1991) Groundfish exploitation rates based on life history parameters. Canadian Journal of Fisheries and Aquatic Sciences 48: 734-750.
Clark, W.G. (1993). The effect of recruitment variability on the choice of a target level of spawning biomass per recruit. Proceedings of the International Symposium on Management Strategies for Exploited Fish Populations, Alaska Sea Grant College Program Report No. 93-02.
Gardner, C. (1997) Effect of size on reproductive output of giant crabs Pseudocarcinus gigas (Lamarck): Oziidae. Marine and Freshwater Research 48: 581-587.
Gardner, C., M. Haddon, D. Hobday, and R. McGarvey (2007). Development of the tools for long term management of the giant crab resource: data collection methodology, stock assessment and harvest strategy evaluation. Hobart, Tasmanian Aquaculture and Fisheries Institute, University of Tasmania, FRDC Final Report No. 2001/042: 151pp.
Gardner, C. and Williams, H. (2002). Maturation of male giant crab Pseudocarcinus gigas and the potential for sperm limitation in the Tasmanian fishery. Marine and Freshwater Research, 53: 661-667.
Grafton, R.Q., T. Kompas, and R.W. Hilborn (2007) Economics of overexploitation revisited. Science 318: 1601.
Haddon, M. (2001). Modelling and quantitative methods in fisheries, Chapman & Hall/CRC, Boca Raton, Florida.
Hall, N., and C. Chubb (2001) The status of the western rock lobster, Panulirus cygnus, fishery and the effectiveness of management controls in increasing the egg production of the stock. Marine and Freshwater Research 52: 1657-1667.
Hankin, D.G., T.H. Butler, P.W. Wild, and Q.-L. Xue (1997) Does intense male harvest limit egg production of protected female stocks of dungeness crabs? Canadian Journal of Fisheries and Aquatic Sciences 54: 655-669.
Hines, A.H., Jivoff,P.R., Bushmann, P.J., Van Montfrans, J., Reed, S.A., Wolcott, D.L. and Wolcott, T.G., (2003). Evidence for sperm limitation in the blue crab, Callinectes sapidus. Bulletin of Marine Science, 72: 287-310.
Holland, D.S., N. Bentley, and P. Lallemand (2005) A bioeconomic analysis of management strategies for rebuilding and maintenance of the NSS rock lobster (Jasus edwardsii) stock in southern New Zealand. Canadian Journal of Fisheries and Aquatic Sciences 62: 1553-1569.
Howard, A. E. (1982). The distribution and behavior of ovigerous edible crabs (Cancer pagurus), and consequent sampling bias. Journal du Conseil. Conseil International pour l’Exploration de la Mer 40: 259–61.
Kimura, D.K. (1981) Standardized measures of relative abundance based on modelling log(c.p.u.e.), and their application to pacific ocean perch (Sebastes alutus). Journal du Conseil International pour l'Exploration de la Mer 39: 211-218.
Kimura, D.K. (1988) Analyzing relative abundance indices with log-linear models. North American Journal of Fisheries Management 8: 175-180.
McGarvey, R., Mathews, J.M. and Levings, A.W. (2000). An individual based dynamic and stochastic model of Australian giant crab (Pseudocarcinus gigas). ICES, Paleegade 2-4.
Giant Crab Size Limits
FRDC Final Report 2006/022 Page 46
Mace, P.M. (1994) Relationships between common biological reference points used as thresholds and targets of fisheries management strategies. Canadian Journal of Fisheries and Aquatic Sciences 51: 110-122.
Quinn II, T.J., and R.B. Deriso (1999). Quantitative Fish Dynamics, Oxford University Press, Oxford.
Ryer, C.H., J. van Montfrans, and K.E. Moody (1997) Cannibalism, refugia and the molting blue crab. Marine Ecology Progress Series 147: 77-85.
Sainte-Marie, B., Raymond, S., and Brêthes, J.C. (1995). Growth and maturation of the benthic stages of male snow crab, Chionoecetes opilio (Brachyura: Majidae). Canadian Journal of Fisheries and Aquatic Sciences 52, 903-24.
Sainte-Marie, B., Gosselin, T., Sevigny, J., Urbani, N. (2008) The snow crab mating system: opportunity for natural and unnatural selection in a changing environment. Bull. Mar. Sci. 83: 131-161.
Sato, T., and Goshima, S. (2006). Impacts of male-only fishing and sperm limitation in manipulated populations of an unfished crab, Hapalogaster dentata. Marine Ecology Progress Series. 313: 193-204.
Sato, T., and Goshima, S. (2007). Female choice in response to risk of sperm limitation by the stone crab , Haplogaster dentata. Animal Behaviour. 73: 331-338.
Sato, T., Ashidate, M., Jinbo, T., Goshima, S. (2007). Does male-only fishing influence reproductive success of the female spiny king crab, Paralithodes brevipes? Can. J. Fish. Aquat. Sci. 64: 735-742.
Ziegler, P., Haddon, M and Gardner, C. (2009). Tasmanian giant crab fishery - 2007/08. Tasmanian Aquaculture and Fisheries Institute Fishery Assessment Report. 64 pp.
11. Appendix 1: Intellectual property
No commercially valuable intellectual property arose from the research. No compelling reason was identified to restrict distribution of results so these have been made publicly available with no protection or confidentiality.
12. Appendix 2: Staff
Project staff were:
Dr Caleb Gardner, Tasmanian Aquaculture and Fisheries Institute, University of Tasmania (Marine Research laboratories).
Dr Philippe Ziegler, Tasmanian Aquaculture and Fisheries Institute, University of Tasmania (Marine Research laboratories).
Dr Sarah Jennings, School of Economics and Finance, University of Tasmania.