Embed Size (px)
Citation preview


Department of Health Science & Technology
Frederik Bajers Vej 7D2
9220 Aalborg SØ
Telephone (+45) 9940 9940
Fax (+45) 9815 4008
http://www.hst.aau.dk
Title:Detection of emphysema inpatients with COPD.
Theme:Master’s thesis.
Project period:4th semester Master, 2013February 4th, 2013 -June 4th, 2013
Project group:Group 13gr1074
Author:Isabel Pino Peña
Project supervisor:Lasse Riis Østergaard
No. printed Copies: 3
No. of Pages: 44
No. of Appendix Pages: 4
Total no. of pages: 48
Synopsis:
Chronic Obstructive Pulmonary Disease (COPD) is
characterized by airflow limitations which involves
chronic bronchitis and emphysema. Quantification
of the emphysema severity is done by physicians or
radiologist and typically consists of visual scoring of
chest tomographic (CT) images which is subject to
inter-observer variability. The purpose of this project
was to study an objective automatic method using
texture analysis for the detection and quantification of
emphysema in patients with COPD.
The proposed method segmented the lungs using
region growing and texture features were extracted
after applying co-occurrence matrix algorithm to the
segmented images. These texture features were used
to train and test the support vector machine (SVM)
classifier to distinguish between normal lung tissue
and emphysematous lung tissue. This classifier was
trained and evaluated using the leave-one-out algo-
rithm with a data set of 9 non healthy patients and 2
healthy patients.
In order to validate the results of the proposed
method, a comparison between them and the visual
scoring of two radiologist and one physician were
computed. The statistical method used for measuring
the level of agreement was the quadratic weighted
kappa which gave as results a fair agreement between
experts and the proposed method.
The proposed method described here can quan-
tify emphysema severity avoiding the problem of the
inter-observer variability. Therefore, this method
can be taken into consideration as an approach to
automatic quantify emphysema lesions in patients
with COPD.
The contents of this report are freely accessible, however publication (with source references) is only allowed upon
agreement with the author.


Preface
This report was written for the 4th semester M.Sc. project during the period of February4th to June 4th 2013 at Aalborg University in the field of Biomedical Engineering and Infor-matics, under the supervision of Lasse Riis Østergaard. The project presents an automatictexture-based method for quantifying emphysema severity using HRCT images in patientswith COPD.
With special thanks to Ulla Møller Weinreich from the Department of Pulmonary Medicineat Aalborg Hospital and Lars Pilegaard Thomsen from the Department of Health Science andTechnology at Aalborg University for their contribution with the HRCT data and their supporton this project.
All citations in this report refer to the bibliography section at the end of the report. Referencesare organized following the Harvard method, [Author’s last name, year of publishing].
This report was written by:
Isabel Pino Peña
5


Contents
Contents 7
1 Introduction 9
2 Background 112.1 Lung Anatomy . . . . . . . . . . . . . . . . . . . . . . . . . . . . . . . . . . . . . . 112.2 Chronic Obstructive Pulmonary Disease . . . . . . . . . . . . . . . . . . . . . . . 122.3 Emphysema . . . . . . . . . . . . . . . . . . . . . . . . . . . . . . . . . . . . . . . 142.4 Computed Tomography for Quantifying Emphysema . . . . . . . . . . . . . . . 152.5 Previous work in Emphysema Quantification . . . . . . . . . . . . . . . . . . . . 16
3 Problem Statement 19
4 Methods 214.1 Data Set . . . . . . . . . . . . . . . . . . . . . . . . . . . . . . . . . . . . . . . . . . 214.2 Method overview . . . . . . . . . . . . . . . . . . . . . . . . . . . . . . . . . . . . 234.3 Lung Segmentation . . . . . . . . . . . . . . . . . . . . . . . . . . . . . . . . . . . 234.4 Texture Analysis . . . . . . . . . . . . . . . . . . . . . . . . . . . . . . . . . . . . . 244.5 Training and Classification . . . . . . . . . . . . . . . . . . . . . . . . . . . . . . . 254.6 Performance Evaluation . . . . . . . . . . . . . . . . . . . . . . . . . . . . . . . . 264.7 Data Processing . . . . . . . . . . . . . . . . . . . . . . . . . . . . . . . . . . . . . 27
5 Results 295.1 Segmentation Results . . . . . . . . . . . . . . . . . . . . . . . . . . . . . . . . . . 295.2 Classifier Results . . . . . . . . . . . . . . . . . . . . . . . . . . . . . . . . . . . . . 315.3 Performance Evaluation Results . . . . . . . . . . . . . . . . . . . . . . . . . . . . 32
6 Discussion 35
7 Conclusion 37
8 Perspectives 39
Bibliography 41
A Image Analysis 45A.1 Region-based Segmentation . . . . . . . . . . . . . . . . . . . . . . . . . . . . . . 45A.2 Texture analysis . . . . . . . . . . . . . . . . . . . . . . . . . . . . . . . . . . . . . 46
7


CHAPTER
1Introduction
Chronic Obstructive Pulmonary Disease (COPD) is one of the fastest-growing health prob-lems in Europe and USA. It has a prevalence of 65 million people in severe stages of the dis-ease and it was the fifth leading cause of death worldwide in 2005 although its incidence isincreasing and it is expected to be the third leading cause of death worldwide in 2030 [GlobalInitiative Chronic Obstructive Lung Disease, 2013a], [World Health Organization, 2011]. COPDis characterized by slowly progressive and non-reversible airflow obstructions in the airways.The disease is commonly detected in adults above 40 years old who have been long-termsmokers, but it can also occur from the long exposure to pollution or chemical fumes [Na-tional Heart and Blood Institute, 2012b].
COPD usually comprises chronic bronchitis and emphysema. Emphysema refers to a de-struction of the alveolar walls with loss of elasticity in the alveoli tissue [Widmaier et al., 2011].Emphysema is visible on Computed Tomography (CT) images as low attenuation areas. Nev-ertheless, High Resolution Compute Tomography (HRCT) is preferred due to its ability todetect emphysema lesions smaller than 5mm [Shaker et al., 2007]. Nowadays, the quantifi-cation of the emphysema extent using HRCT is done by visual scoring which is dependenton the skills of the observer. Some long-term studies have shown that different radiologistsand physicians tend to disagree in the quantification of the emphysema when they evalu-ate CT from the same patients which highlights the problem of the inter-observer variability.Besides, visual assessment is very time consuming and expensive in for example, long-termstudies [Ginsburg et al., 2012].
Automatic quantification of emphysema provides objectivity and reliability. Therefore, manyautomatic methods have been proposed for quantifying emphysema. The most commonmethod used during many years is based on the Hounsfield Unit (HU) value. It aims to detectlow attenuation areas (LAA) using a fixed threshold where the values below the threshold areidentified as emphysema. This method provides a solution of the inter-observer variability,however, it is limited because researchers can not agree on the best threshold value due to itsdependence of the scanner models [Ginsburg et al., 2012].
The quantification of emphysema using texture-based models are more precise due to thesemethods take into consideration the spatial relationship between gray-level intensity values.Texture analysis has been used for quantify emphysema in different studies which evaluatetexture features obtained from local binary patterns, co-occurrence matrix or run-length de-scriptor, among others [Sørensen et al., 2010], [Nagao et al., 2003], [Yao et al., 2011].
9
This project will work with a texture-based model in order to detect and quantify emphysemausing HRCT in patients with COPD. This model is chosen because it is believed that quantifi-cation of emphysema using texture features correlate better with the assessment from theexperts than only using LAA [Gietema et al., 2011]. The purpose of the project is to study areliable automatic method for quantifying emphysema severity in order to avoid the inter-observer variability.
10

CHAPTER
2Background
This chapter will go through the background knowledge for the project. It will start with de-scribing the anatomy of the lung and the Chronic Obstructive Pulmonary Disease. It willcontinue by focus on emphysema and the quantification of emphysema using computed to-mography.
2.1 Lung Anatomy
The lungs are one of the main parts of the respiratory system together with the airways, bloodvessels and the muscles which enable the breathing, as seen in Figure 2.1 [National Heart andBlood Institute, 2012a]. The lungs are located in the thorax which is composed of the verte-bral column, ribs, sternum and intercostal muscles and it is separated from the abdomen bythe diaphragm. The right lung is divided in 3 lobes and the left lung in 2 lobes. Both lungsare surrounded by a thin tissue layer called pleura. The pleura consists of an external pleuralmembrane lining the inner surface of the thoracic wall and the membrane lining the outersurface of the lung, both membranes are separate by the intrapleural fluid [Widmaier et al.,2011].
Figure 2.1: A) shows a general overview of the respiratory system. B) shows an enlarged ofthe respiratory zone. C) shows a magnified view of gas exchange between the capillaries andalveoli. [National Heart and Blood Institute, 2012a].
11

The inhaled air passed through the upper airways and the conducting zone until it arrivesto the respiratory zone where the gases are exchanged with the blood. The conducting zoneincludes the trachea, bronchi and bronchioles and its function is to defend against infec-tions, dust, etc using protective mechanisms such as cilia, mucus and macrophages. Therespiratory zone contains alveoli which are tiny air sacs separated by alveolar walls. The alve-olar walls contain capillaries and a very small interstitial space. In the alveoli the oxygen isabsorbed into the blood and the carbon dioxide passed from the blood to the alveoli to beexhaled [Widmaier et al., 2011], [WebMD, 2009].
2.2 Chronic Obstructive Pulmonary Disease
Chronic Obstructive Pulmonary Disease (COPD) is characterized by persistent airflow limita-tion which is often progressive and related with an enhanced chronic inflammatory responsein the airways and the lung to noxious particles or gases [Global Initiative Chronic Obstruc-tive Lung Disease, 2013a]. 65 million people are diagnosed with a moderate to severe COPDworldwide and from 4-10% of adults suffer from it in Europe. COPD constituted the fifthcause of death with the 5% of all deaths worldwide during 2005 which corresponds to 3 mil-lion people. Mortality increased more than 60% over the last 20 years and it is estimated thatin the next 10 years deaths caused by COPD will go up more than 30%. An estimation showsthat in 2030 COPD will be the third cause of death worldwide [World Health Organization,2011].
2.2.1 Diagnosis
The main diagnosis test of COPD is a breathing test called spirometry [National Heart andBlood Institute, 2012b]. This test measures:
• Force vital capacity (FVC): it is the maximum volume of air powerfully exhaled after fullinspiration.
• Force expiratory volume in one second (F EV1): it is the volume of air exhaled duringthe first second of the FVC performs.
• The F EV1/FV C ratio.
Airflow obstruction is considered when F EV1FV C < 0.7 and F EV1 < 80% of the predicted value.
Spirometry is also used for classifying the severity of the COPD, it is seen in Table 2.1:
Classification of severity of airflow limitation in COPDSeverity F EV1/FV C F EV1 predictedMild < 0.7 ≥ 80%Moderate < 0.7 50 - 79%Severe < 0.7 30 - 49%Very severe < 0.7 < 30%
Table 2.1: Classification of COPD severity using spirometry [Bousquet and Khaltaev, 2007].
12

Other test, such as CT scans are performed for diagnosing COPD since they are used to detectemphysema which is one of the most common manifestation seen in COPD.
2.2.2 Symptoms and Risk Factors
The main risk factor for COPD is tobacco smoke and most of the patients diagnosed withCOPD had been long-term smokers. However, COPD can be produced by long exposition tourban air pollution, dusts and chemicals fumes from workplaces or passive smokers. Mostof the people who suffer COPD are above 40 years old. There are a genetic factor called al-pha -1 antitrypsin deficiency (AAT) that can cause COPD in people under 40 years old [Na-tional Heart and Blood Institute, 2012b], [Currrie et al., 2007]. AAT is a protein made in theliver and secreted into the circulatory system to help protect the lungs. It is a major inhibitorof proteases secreted by neutrophils during inflammation [Mayo Clinic, 2012].
COPD may not cause symptoms until significant lung damage has occurred. Common symp-toms of patients with COPD are dyspnea, chronic cough usually with sputum, fatigue whendoing mild activity, exacerbation and weigh loss [WebMD, 2009]. In order to assess thesesymptoms two questionnaires are done, one is the COPD Assessment Test (CAT) and theother is the Modified British Medical Research Council (mMRC).
According to the spirometric classification, exacerbation history and symptoms, patients areclassified as shown in Figure 2.2.
Figure 2.2: Graphic of the combined assesment of COPD. [Global Initiative Chronic Obstruc-tive Lung Disease, 2013b].
13

2.2.3 Treatment
Although COPD is a treatable disease, there is not a cure for it. Thus, the treatments focus onalleviate the symptoms and monitor the disease in order to not get worse. Patients with COPDhave to stop smoking in order to stop increasing the lung damage. Treatments depend ofthe severity of the disease in each patient but usually the treatments consist of bronchodila-tors, steroids, anti-inflammatory medications and in more severe cases also oxygen therapy.During exacerbation periods antibiotics are required. Non-pharmacological management isrecommended such as pulmonary rehabilitation and exercise training [National Heart andBlood Institute, 2012b], [Currrie et al., 2007].
2.3 Emphysema
The chronic airflow obstruction that patients with COPD suffer is caused by a combination ofsmall airways disease, chronic bronchitis, and parenchymal destruction, emphysema [GlobalInitiative Chronic Obstructive Lung Disease, 2013a]. Emphysema is defined as a lung condi-tion characterized by the destruction of the alveolar walls leading to a loss of elastic tissueand an increase in compliance, as seen in Figure 2.3 [Widmaier et al., 2011]. When the airspaces are greater than 1cm they are called bullae.
Figure 2.3: Emphysematous lung showing the alveoli destruction and a view of a healthyalveoli tissue. [a.d.a.m. medical encyclopedia, 2011].
There are three different types of emphysema [Shaker et al., 2007]:
• Centrilobular emphysema (CLE): the destruction is limited to the central part of thesecondary lobule.
14

• Paraseptal emphysema (PSE): it presents distension and destruction of the whole lob-ule and it affects mostly to the secondary lobule adjacent to the inter-lobar septa andpleura.
• Panlobular emphysema (PLE): this type is associate with AAT deficiency.
Centrilobular and paraseptal usually are differently distributed although both can co-existsin severe stages. Centrilobular is typically located in the apex of the upper lobe but spreadsdown as the disease become worse. On the other hand, paraseptal and panlobular emphy-sema are more predominant in the lower lobes. The centrilobular is the most common em-physema in smokers and during the mild stage. Usually it does not cause pulmonary dys-function [West, 1998].
Alveolar wall destruction in emphysematous lungs is the result of an imbalance between pro-tease and antiprotease in the lung. This imbalance is produced because tobacco smoke acti-vates the alveolar macrophage increasing the number and recruits neutrophils into the lung.The activation of the alveolar macrophages release elastase and stimulate the release of elas-tase from neutrophils which leads to destruction of the alveolar wall. The oxidants in cigarettesmoke and free radicals released by neutrophils inactivate the AAT which is the main elastaseinhibitor, it is seen in Figure 2.4 [West, 1998] [Barnes et al., 2009].
Figure 2.4: Description of pathogenesis of emphysema [Adnan, 2011].
2.4 Computed Tomography for Quantifying Emphysema
One of the most common imaging tests used for diagnosing emphysema in patients withCOPD is Computed Tomography (CT) scan. CT usually is used for diagnosing and quantifi-cation of emphysema. Although emphysema can be visible in conventional CT scan of 5 - 8mm thickness, High Resolution Compute Tomography (HRCT) is the imaging method usedbecause it is easier to detect smaller lesions in HRCT with slice thickness of 1 - 2 mm (Fig-ure 2.5) [Litmanovich et al., 2008]. HRCT shows small areas of lung destruction as dark re-gions without visible wall and easily detected when surrounded by normal lung parenchyma
15

[Stem and Frank, 1994]. Using HRCT mild emphysema such as centrilobular lesions < 5mmcan be detected [Shaker et al., 2007].
Figure 2.5: Patients diagnosed with emphysema showed in A) HRCT of 1,5mm slices and inB) CT of 5mm slices.
Nowadays, emphysema extend is assessed by visual score but this is subject to intra-andinter-observer variability. Usually classification of emphysema is done in categories, suchas, absence of emphysema, 0-25%, 25-50%, 50-75% and >75%. Visual rating can be done inthe whole lung or in upper, mid and lower parts [Mascalchi et al., 2012]. Many studies haveshown good correlations between visual scores of CT and pathological samples but due tothe intra-and inter-observer variability these evaluations can not be used for long-term stud-ies. For that reason, objective quantitative analysis using HRCT is preferred as assessment ofemphysema [Mets et al., 2012].
2.5 Previous work in Emphysema Quantification
Many studies of emphysema quantification using CT scans have been carried out in order tofind an automatic method which can replace the subjective visual scoring. Emphysema in CTscans appears as an area with low attenuation coefficients. Emphysema has almost the samevalue as air [Sluimer et al., 2006]. For this reason, the most used technique to quantify em-physema severity is to use Hounsfield Unit (HU) values given in the CT. Emphysema severityis quantified as the low attenuation area (LAA) in the lung with a HU lower than a certainthreshold. After applying the HU threshold the lung is classified in normal lung if the voxelsare above of the threshold or in emphysematous lung if the voxels are below the threshold[Reilly, 2006]. Gevenois et al. [1995] found that with a threshold value of −950HU there wasno difference between the radiological and pathological area of emphysema, although thereis not a common agreement between all the studies in which one is the best threshold value.This method is subjective to noise, reconstruction filter and scanner models [Ginsburg et al.,2012].
16

However, other studies go further and try to describe other patterns of emphysema such assize or spatial distribution of emphysema lesions. Sørensen et al. [2010] formulated a textureclassification-based system with the purpose of improving quantitative measures of emphy-sema by taking in consideration that pixels can be related to the neighbors. It used localbinary patterns as texture features and a k-nearest neighbor as a classifier. The results werecorrelated with a pulmonary function test (PFT) showing a correlation value of 0,79 [Sørensenet al., 2010]. Chabat et al. [2003] describes a texture classification using a 13-dimensional vec-tor that contains statistical moments of the pixel intensity, acquisition-length parameters andco-occurrence matrix descriptors. A bayesian classifier was used to test the performance ofthe automatic method. The results display that the use of the previous named descriptorscan identify different diseases reliably [Chabat et al., 2003].
Nagao et al. [2003] proposed a 3D region growing algorithm for detection of emphysematouslesions. The features are extracted using the region growing method in low-intensity areas.This approach classify the emphysema according with the distribution, concentration andplacement using euclidean distance transformation. The results present that emphysemausually are not present close to the bronchi and blood vessels, lesions concentration can beused for assess the severity of the disease, emphysema lesions tend to appear more in the in-termediate distance from the hilium and reduction of peripheral bronchiole are very relatedwith severe stages. In this study was concluded that region growing method provides moreaccurate emphysema quantification than threshold method. [Nagao et al., 2003].
Ginsburg et al. [2012] developed a approach for quantifying centrilobular emphysema as wellas centrilobular nodularity. This approach is based on classifying different textures in localregion of interest (ROIs) using CT scans. Firstly, a feature extraction is carried out and thenthese features are classified using multiple logistic regression classifier. Finally a statisticalanalysis is computed and the results show that the texture-based approach used in this ar-ticle can discriminate between normal tissue, centrilobular emphysema and centrilobularnodularity [Ginsburg et al., 2012].
There are other approaches based on the morphology of the emphysema as it can been seenin Blechschmidt et al. [2001]. This study aims to be able to quantify emphysematous de-struction using a new index which use the size of the bullae. The inter-observer agreementbetween the result of the automatic approach and the score of the experts shows a coefficientof 0,66 (p<0,01) using Spearman correlation [Blechschmidt et al., 2001].
On the other hand, it can be possible to extrapolate and use methods developed in other stud-ies which the focus is not emphysema but pulmonary abnormalities. For example, Yao et al.[2011] developed a computer-aid diagnosis (CAD) of pulmonary infections such as chronic fi-brosis, pneumonia or parainfluenza using texture analysis for feature extraction and supportvector machine as classifier. In order to obtain the texture features, co-occurrence matrixand run-length algorithm are computed. Support Vector Machine is the classifier used totrain and test the CAD. A t-test was conducted for evaluating the statistical independence ofthe difference between two tissue patterns. The results of this study conclude that textureanalysis can be used to distinguish from healthy and unhealthy tissue although clear distinc-tion between some diseases such us pneumonia and parainfluenza can be difficult due tosometimes they can coexist [Yao et al., 2011].
17


CHAPTER
3Problem Statement
COPD is a overall problem and represents, with 3 million people, the fifth cause of death. Ithas a prevalence of 65 million people worldwide but it is estimated to increase in the comingyears because of the continued exposure to the risk factors of COPD, mainly tobacco smoke[World Health Organization, 2011].
Most of the patients with COPD suffer from emphysematous lungs and it severity is quanti-fied using CT scans. Emphysema is characterized by enlarged alveolis and destructive changesin their walls [Global Initiative Chronic Obstructive Lung Disease, 2013a]. Usually HRCTscans are preferred to asses the emphysema due to its ability to show lesions smaller than5mm [Shaker et al., 2007]. The previous chapter has presented that quantification of the em-physema is assessed by visual score of the HRCT scans. The emphysema is usually classifiedin five categories of increasing severity, such as, absence, 0-25%, 26-50%, 51-75% and 76-100%. Visual scoring involves a problem due to the intra-and inter-observer variability and itdepends of the experience and ability of the physician. It has been seen in different studiesthat the results tend to not agree in the severity of the emphysema when different observershave to score the same patients and are blinded to the assessments of each other. [Mascalchiet al., 2012].
Different approaches for automatic scoring have been developed in order to avoid the intra-and inter-observer variability of visual assessment. The most used one through the yearshave been the so called density mask which applies a threshold to categorize the lung in em-physema or healthy tissue [Gevenois et al., 1995]. However, this method depends on the valueof the threshold in which there is not a full agreement among researchers [Friedman, 2008].Other studies are based in a texture or morphology based concepts which turn out in moreprecise results for quantifying emphysema.
Therefore, the aim of this project is to study an automatic method based on texture analysiswith the purpose of having an objective and reliable procedure to quantify emphysematouslungs in patients with COPD using HRCT scans.
19

CHAPTER
4Methods
This chapter describes the data collection and it gives an overview of the method used. Then,the different steps method are explained. It starts with the lungs segmentation process, followby the texture analysis applied in order to extract the texture features and it ends with a statis-tical analysis to compare the results of the proposed method and the expert visual evaluation.
4.1 Data Set
The data set used during this project consists of HRCT scans from 24 patients. Data were pro-vided by the Department of Pulmonary Medicine at Aalborg University Hospital in Denmark.The 24 patients were referred to the local pulmonary outpatient clinic for routine assessmentwhere clinical measurements such as F EV1% or ∇PO2 were carried out. HRCT scans wereperformed 48 hours after the rest of the measurements. HRCT scans were acquired in supineposition using 1,25mm slice thickness, no contrast and the patient was asked to hold thebreath during the scan [Thomsen et al., 2013].
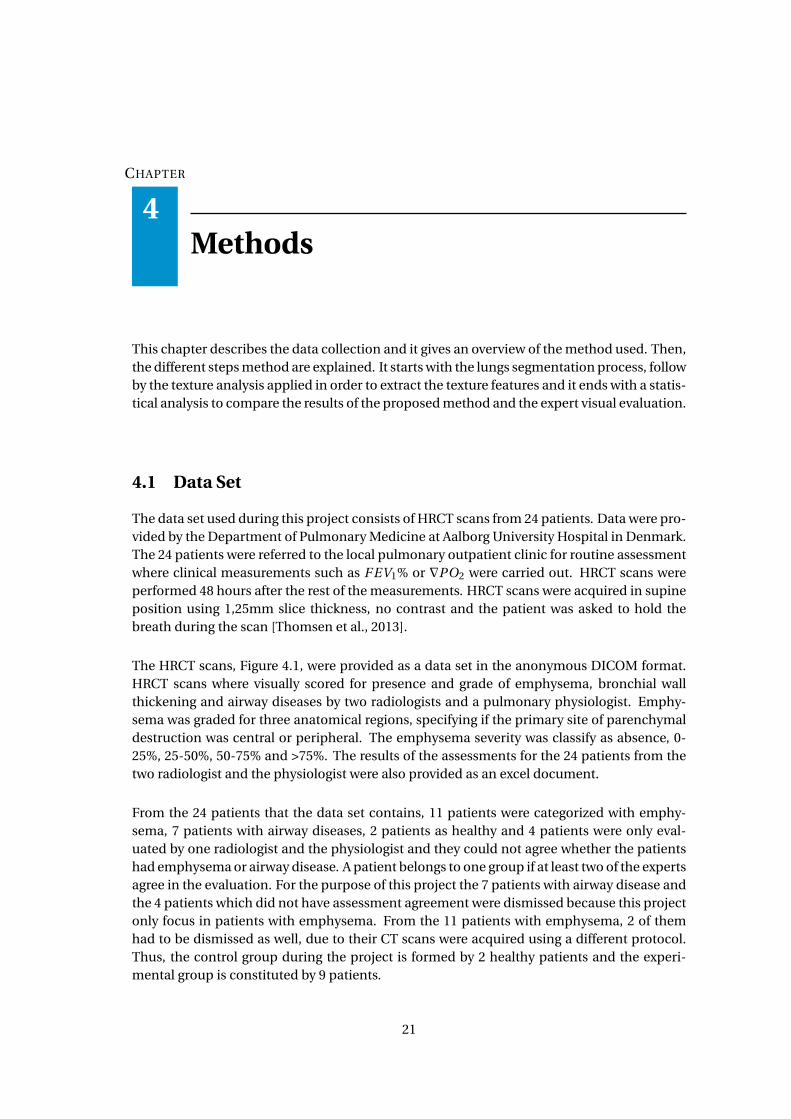
The HRCT scans, Figure 4.1, were provided as a data set in the anonymous DICOM format.HRCT scans where visually scored for presence and grade of emphysema, bronchial wallthickening and airway diseases by two radiologists and a pulmonary physiologist. Emphy-sema was graded for three anatomical regions, specifying if the primary site of parenchymaldestruction was central or peripheral. The emphysema severity was classify as absence, 0-25%, 25-50%, 50-75% and >75%. The results of the assessments for the 24 patients from thetwo radiologist and the physiologist were also provided as an excel document.
From the 24 patients that the data set contains, 11 patients were categorized with emphy-sema, 7 patients with airway diseases, 2 patients as healthy and 4 patients were only eval-uated by one radiologist and the physiologist and they could not agree whether the patientshad emphysema or airway disease. A patient belongs to one group if at least two of the expertsagree in the evaluation. For the purpose of this project the 7 patients with airway disease andthe 4 patients which did not have assessment agreement were dismissed because this projectonly focus in patients with emphysema. From the 11 patients with emphysema, 2 of themhad to be dismissed as well, due to their CT scans were acquired using a different protocol.Thus, the control group during the project is formed by 2 healthy patients and the experi-mental group is constituted by 9 patients.
21
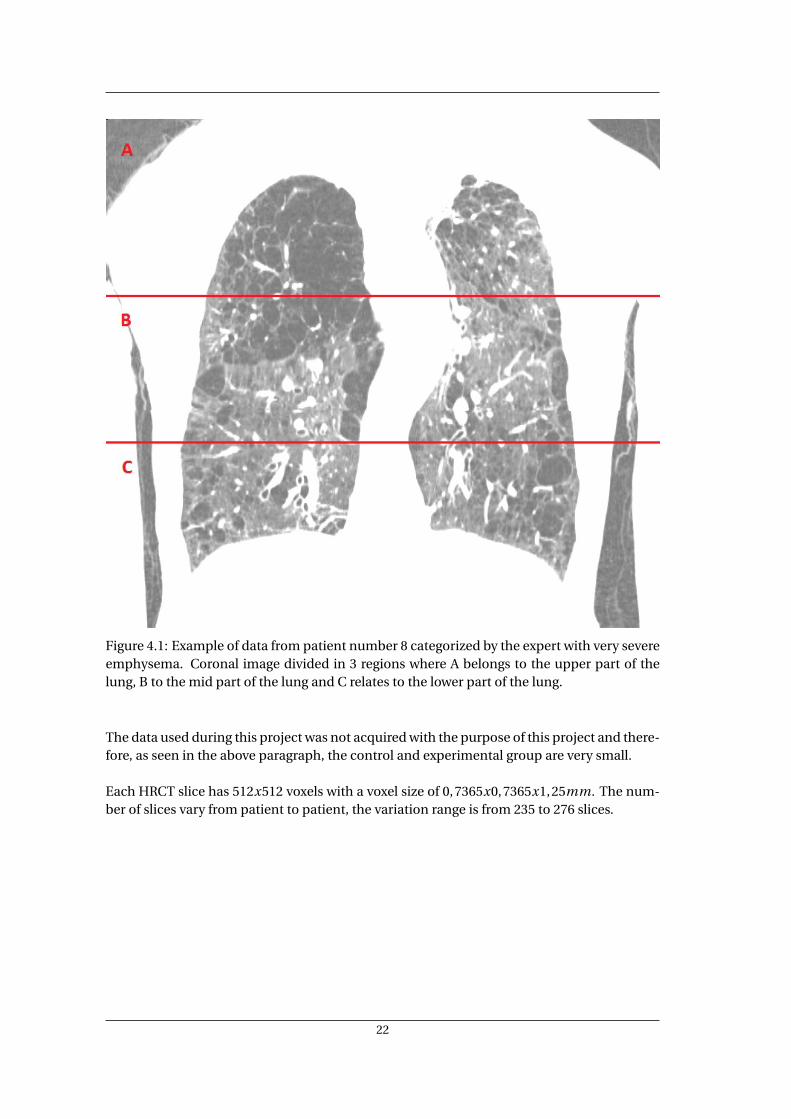
Figure 4.1: Example of data from patient number 8 categorized by the expert with very severeemphysema. Coronal image divided in 3 regions where A belongs to the upper part of thelung, B to the mid part of the lung and C relates to the lower part of the lung.
The data used during this project was not acquired with the purpose of this project and there-fore, as seen in the above paragraph, the control and experimental group are very small.
Each HRCT slice has 512x512 voxels with a voxel size of 0,7365x0,7365x1,25mm. The num-ber of slices vary from patient to patient, the variation range is from 235 to 276 slices.
22

4.2 Method overview
Given a HRCT data set, the proposed automatic method first segment the right and left lungin three different sections, secondly it makes an analysis of the texture patterns and then aclassifier is trained to distinguish between emphysema and no emphysema tissue. A statis-tical analysis is finally computed to assess the level of agreement between the results of theproposed method and the opinion of the experts. Figure 4.2 shows a diagram of the proposedmethod.
Figure 4.2: Diagram of the image analysis for the proposed method.
In the following sections there will be a description of each module of the diagram, as well as,the procedure used for implementing the theory.
4.3 Lung Segmentation
Lung segmentation is considered as an essential step in any method that analyzes the lungs.There are different ways to segment the lungs depend on the purpose of the study. Some seg-mentation methods may consider to segment the bronchi and the vessels prior to segmentthe lungs as in the studies of Chabat et al. [2003] and Yao et al. [2011]. In this first study, firstlythe vessels are removed by segmenting them using a morphological segmentation. Then thelungs are segmented using the same technique and finally the ROIS used for extract the tex-tural information are selected manually [Chabat et al., 2003]. In the study by Yao et al. [2011]the region growing is used firstly to segment the trachea and using the position of it to placethe seeds for carrying out an automatic segmentation of the right and left lung. A histogramthresholding is used in order to refine the lung segmentation [Yao et al., 2011].
In HRCT, lungs are seen as areas with low attenuation values due to the fact that they are filledwith air which has a HU value of -1000. These low HU values give a high contrast betweenthe lungs and the surrounding tissue. The segmentation method used during this project isregion growing which uses the variations in intensity values for segmentation of the images.An explanation of the basis of region growing is found in Appendix A.1.
In this project, the segmentation using region growing segments the right and the left lungin three sections in each data set. The three sections belong to the upper, middle and lowerpart of the lungs. The seeds in each section are placed empirically. Then, by means of a 3Dregion-growing algorithm, the seeds spread to the whole lung section. The segmentation is
23

performed in one section at a time first in the right lung and afterward in the left lung. Asdescribed in Appendix A.1, it is recommended to choose more than one stop criteria. Duringthis project the absolute gray level difference between the voxels and the seed have to be 18.This value is chosen empirically and it works as a threshold level meaning that the seed willnot spread if the voxel value is over the threshold. The second criterion is that the pixel has tobe 8-connected to at least one pixel in the same region. The region growing uses 8 connectedneighbors in the growing process until the neighbors do not belong to the specified intensityrange.
As last step, a morphological operation is used to refine the segmentation. First, a disk-shapestructure is created and it is used in the closing process. Closing is the chosen morphologicaloperation due to its ability to fill the holes in the segmented image and to preserve the sharpedges and the original size.
The result of the segmentation is 6 sections with three in each lung. Each segmented sectionis represented as value 1 and the background is represented with 0 values. In order to checkthe performance of the segmentation, a superposition of the segmentation and the originalimage is carried out.
4.4 Texture Analysis
Once the different sections in the lungs are segmented, a texture analysis is performed to ex-tract the texture features. Texture features are used to differentiate between emphysematousand healthy lung tissue. There are diverse methods used to characterize emphysema anddifferent lung diseases using texture analysis such as run-length matrix or histograms as inGinsburg et al. [2012] and Sørensen et al. [2010]. The run-length matrix is a method whichruns of pixels with the same gray-level intensity through a given direction. Computing run-length matrix different textural features can be extracted, these features are related to the size,orientation and attenuation value of the elements in the image [Ginsburg et al., 2012]. Usinghistogram from the images many parameters can be extracted such as mean gray-level value,variance, skewness or kurtosis [Sørensen et al., 2010].
The texture features in this project are derived from the co-occurrence matrix. Co-occurrencematrix is described in Appendix A.2 and it has been used in different studies to distinguish be-tween healthy and not healthy lungs [Yao et al., 2011], [Chabat et al., 2003].
In this project the co-occurrence matrix algorithm is used in 3D which aims to capture thespatial dependence of gray-level intensities through multiple slices. As in the normal 2D co-occurrence matrix, the 3D co-occurrence algorithm counts the pair of voxels pairs that havethe same intensity value. The difference between the 2D and 3D co-occurrence matrix ap-pears in the displacement vector which is defined for the 3D one as d = (d x,d y,d z). Thedisplacement vector represents the distance and direction where the voxel pair is defined.For volumetric data there are 13 different directions, it can seen in Table 4.1.
24
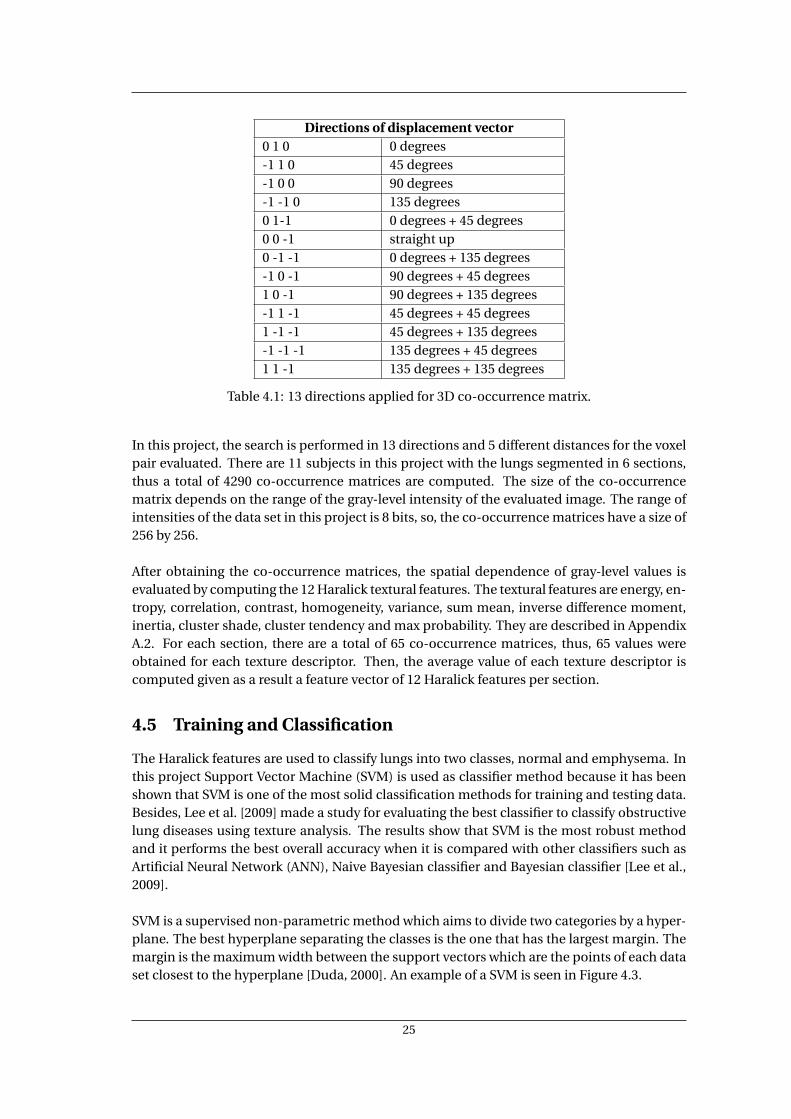
Directions of displacement vector0 1 0 0 degrees-1 1 0 45 degrees-1 0 0 90 degrees-1 -1 0 135 degrees0 1-1 0 degrees + 45 degrees0 0 -1 straight up0 -1 -1 0 degrees + 135 degrees-1 0 -1 90 degrees + 45 degrees1 0 -1 90 degrees + 135 degrees-1 1 -1 45 degrees + 45 degrees1 -1 -1 45 degrees + 135 degrees-1 -1 -1 135 degrees + 45 degrees1 1 -1 135 degrees + 135 degrees
Table 4.1: 13 directions applied for 3D co-occurrence matrix.
In this project, the search is performed in 13 directions and 5 different distances for the voxelpair evaluated. There are 11 subjects in this project with the lungs segmented in 6 sections,thus a total of 4290 co-occurrence matrices are computed. The size of the co-occurrencematrix depends on the range of the gray-level intensity of the evaluated image. The range ofintensities of the data set in this project is 8 bits, so, the co-occurrence matrices have a size of256 by 256.
After obtaining the co-occurrence matrices, the spatial dependence of gray-level values isevaluated by computing the 12 Haralick textural features. The textural features are energy, en-tropy, correlation, contrast, homogeneity, variance, sum mean, inverse difference moment,inertia, cluster shade, cluster tendency and max probability. They are described in AppendixA.2. For each section, there are a total of 65 co-occurrence matrices, thus, 65 values wereobtained for each texture descriptor. Then, the average value of each texture descriptor iscomputed given as a result a feature vector of 12 Haralick features per section.
4.5 Training and Classification
The Haralick features are used to classify lungs into two classes, normal and emphysema. Inthis project Support Vector Machine (SVM) is used as classifier method because it has beenshown that SVM is one of the most solid classification methods for training and testing data.Besides, Lee et al. [2009] made a study for evaluating the best classifier to classify obstructivelung diseases using texture analysis. The results show that SVM is the most robust methodand it performs the best overall accuracy when it is compared with other classifiers such asArtificial Neural Network (ANN), Naive Bayesian classifier and Bayesian classifier [Lee et al.,2009].
SVM is a supervised non-parametric method which aims to divide two categories by a hyper-plane. The best hyperplane separating the classes is the one that has the largest margin. Themargin is the maximum width between the support vectors which are the points of each dataset closest to the hyperplane [Duda, 2000]. An example of a SVM is seen in Figure 4.3.
25

Figure 4.3: Division of two classes using the SVM. Adaptation of [OpenCV, 2011].
As SVM is a supervised method, it needs to be trained before it can be used to classify newdata. The kernel function used during this project when training the SVM is the linear kernelwhich to separate the data uses a hyperplane. During the training process, the SVM classifierlearns texture patterns of a normal lung and an emphysematous lung. For training and test-ing the data the leave-one-out method was used. Therefore, the classifier is trained with allthe sections belonging to all the patients except one, then the sections of the patient excludedin the training is used to test the classifier. The SVM returns a 0 if the texture feature belongsto a healthy lung and 1 if the texture feature belongs to a lung with emphysema. This processis repeated for each data set [Duda, 2000].
4.6 Performance Evaluation
Statistical analysis is widely use for validating results in medical studies. The choice of a spe-cific statistic method relies on the data used and the comparison that have to be made. Inthis project, the purpose of applying a statistic method is to compare the agreement betweenthe results obtained automatically and the results given by the experts. The type of data inboth cases are referring to the emphysema severity grade. These data are called ordinal datawhich is a type of non-parametric qualitative data. It categorizes each observation in a cate-gory that has a natural order between categories [Bland, 2000].
There are different statistic methods for measuring the level of agreement between observers(inter-rater agreement). Usually all these methods are based on the rating of the observersagree in a particular case if the observers classify the subject in the same category. The greatmajority of categorical scales are quite subjective and therefore, perfect agreement is uncom-mon [Agresti, 1996].
One of the methods that measure the inter-rater agreement using ordinal data is the weightedkappa analysis. Weighted kappa is based on the Cohen’s kappa algorithm for nominal data.The weighted kappa is used for ordinal data where the disagreement between closer cate-
26

gories are less serious than between separate ones. Therefore, the quadratic weighted kappaassigns to each category a different weight [Cohen, 1968]. In this project there are 5 categorieslabeled with numbers from 1 to 5 where 1 means absence of emphysema, 2 means 0-25%emphysema, 3 means 25-50% emphysema, 4 means 50-75% emphysema and 5 means >75%emphysema. The weight used for each category is 1, 0.937, 0.750, 0.437 and 0 respectively.The comparison is performed using the average of all the lung sections for each patient.
The statistical analysis gives as result the values of the weighted kappa, the standard errorand the confident interval. The weighted kappa value express the level of agreement betweenthe observers. The standard error is the value of testing the hypothesis that the underlyingvalue of weighted kappa is equal to a pre-specified value other than zero. Finally, the confi-dent interval shows the 95% confident interval of the weighted kappa value. The value of theweighted kappa can be interpreted as seen in Table 4.2.
Value of Weighted KappaValue Strength of agreement< 0.20 Poor0.21 to 0.40 Fair0.41 to 0.60 Moderate0.61 to 0.80 Good0.81 to 1 Very good
Table 4.2: Interpretation of the value of the quadratic weighted kappa [Bland, 2000].
4.7 Data Processing
In this section there will be an explanation of the process of applying the theory from the pre-vious sections. The program used to process the data is MATLAB R2012b and the statisticsare computed using MedCalc. MedCalc is a software which computes medical statistics. Theversion MedCalc 12.5.0.0 in the free trial edition is used in this project.
Before to apply the automatic segmentation of the lungs the data sets need to be crop. Eachdata set is cropped according to the number of slices which contains the lungs. The rest ofslices without lung information are removed with the cropping. Then each slice of the datasets are resize to 128x128 pixels using bilinear interpolation. This step is needed because theheavy computational process of slices of 512x512 pixels.
The segmentation of the lungs is carried out in 3D and it starts dividing the cropped data setin 3 equal sections. Then, automatic region growing is computed for each section in eachlung. A total of 6 segments are the results of the segmentation for each data set. The MATLABcode used for the region growing is an adaptation of the code that can be found in mathworks[Kellnerd, 2011].
After the segmentation and before to apply the texture analysis, the segmented images aresuperimposed with the original data and the background is set up to NaN. NaN means not anumber and it is a value or a symbol that it is not taken into account when the window sizeof the co-occurrence matrix are in the edges of the lungs and therefore including these val-
27

ues. The co-occurrence matrix is computed for each of the 6 segments in 13 directions and5 distances and 12 textural features are extracted for each distance and direction. A total of156 features per distance were extracted in each segment, therefore, the mean value of eachfeature were computed having as result a vector of 12 features per segment. The MATLABcode for calculating the 3D co-occurrence matrix is an adapted version of the one that can befound in mathworks [Uppuluri, 2008].
Once, the texture information is obtained the classifier has to be trained. The SVM is theclassifier used in this project. First, it is trained with all the data set except one and then theclassifier is tested with the data set not used during the training process. The MATLAB codeused for build the classifier are two MATLAB functions called svmtrain and svmclassify.
Finally, the results obtained from the classifier are labeled according with same the cate-gorical scale used by the experts. A quadratic weighted kappa analysis is carried out usingMedCalc in order to compare the level of agreement between the experts and the automaticmethod. The analysis was performed in pairs of one expert and the automatic classification,so three quadratic weighted kappa are computed.
28

CHAPTER
5Results
In this chapter the results of the proposed method are presented. First, the results from theautomatic segmentation as well as a comparison between these results and the original im-ages. The results given by the classifier for distinguish between emphysema and healthy lung.Finally, the results from the statistical analysis are presented which show the agreement be-tween the presented method and the assessment of the two radiologist and the physician .
5.1 Segmentation Results
For all the patients a segmentation of the lung was computed. The lungs were individuallysegmented using region growing which first, it was applied in the right lung and after in theleft lung. Three seeds were set in each lung, thus, the segmentation was done in 3 differentparts belongs to upper, middle and lower part according with the division used by the two ra-diologist and the physician. The results of the segmentation represents the lungs with 0 value(white color) and the background with value 1 (black color). Figure 5.1 shows the result ofsegmentation of both lungs in the coronal plane of the 3 sections belongs to patient number7.
An overlap between the segmentation results and the original images is performed in orderto validate the segmentation. In Figure 5.2 it can be seen an example of the superposition be-tween the original image and the automatic segmentation carried out by the region growingalgorithm in each section. It can be observed that the overlap is matching almost perfectlythe boundaries of the lungs in the original image.
29

Figure 5.1: Lung segmentation of patient 7. Segmentation carried out individually for theright and left lung in 3 different sections, upper, middle and lower.
Figure 5.2: Overlap between the automatic segmentation using region growing in patientnumber 7 and the original image.
30

5.2 Classifier Results
After segment the lungs a texture analysis is computed in all the sections and 12 textural fea-tures are extracted from each section of the lung. These textural features are used to classifythe lung in emphysema or healthy. The leave-one-out method was used and therefore, theclassifier was trained with all patients except one which was used for test the classifier. Theresults given by the classifier are presented in Table 5.1 as a percentage of the probability thateach region has emphysematous tissue.
Percentage of emphysematous tissue per sectionData Set % Section 1 % Section 2 % Section 31 78.69 63.84 80.584 59.61 77.56 60.577 86.60 96.42 78.248 84.72 98.61 95.8910 50.84 71.18 69.1612 81.75 73.07 62.0618 70.76 80.76 18.7220 94.16 96.72 90.9821 54.99 54.16 70.29
Table 5.1: Classifier results per section for all the data sets.
Since the assessment of the two radiologist and the physician are given as emphysema extentof a lung, the results of the classifier can not be compared straightforward. The percentage ineach section given by the classifier is then labeled according with the categorical scale usedby the experts in order to be able to compare both results. The categorical scale used labelsabsence of emphysema as 1, 0-25% of emphysema is labeled as 2, 25-50% of emphysema islabeled as 3, 50-75% of emphysema is labeled as 4 and >75% of emphysema is labeled as 5.The labeled results given by the classifier are seen in Table 5.2.
Quantification of emphysema per section and the whole lungData Set % Section 1 % Section 2 % Section 3 Average Lung1 5 4 5 4.64 4 5 4 4.37 5 5 5 58 5 5 5 510 3 4 4 3.612 5 4 4 4.318 4 5 2 3.620 5 5 5 521 4 4 4 4
Table 5.2: Quantification of emphysema using categorical scale for each section and the av-erage quantification for the whole lung.
31

Quantification of emphysema severity scored by the twotwo radiologist and the physicianscan be seen in Table 5.3.
Quantification of emphysema per section and the whole lung assessed by the expertsData Set Expert % Section 1 % Section 2 % Section 3 Average Lung
Radiologist 1 3.5 5 5 4.51 Radiologist 2 5 5 5 5
Physician 4.5 2 1.5 2.6Radiologist 1 5 5 5 5
4 Radiologist 2 5 4 5 4.6Physician 3.5 2.5 3.5 3.1Radiologist 1 3 3 3.5 3.1
7 Radiologist 2 4 3 3 3.3Physician 3.5 3 2.5 3Radiologist 1 3.5 5 5 4.5
8 Radiologist 2 5 4 5 4.6Physician 5 5 4.5 4.8Radiologist 1 3.5 3 2 2.8
10 Radiologist 2 4.5 2.5 1 2.6Physician 2.5 2.5 2 2.3Radiologist 1 3 3 3 3
12 Radiologist 2 2 2 1 2Physician 3 2 2 2.3Radiologist 1 4 2.5 2.5 3
18 Radiologist 2 1 1.5 0 1.7Physician 1.5 1.5 1.5 1.5Radiologist 1 3.5 2 2.5 2.6
20 Radiologist 2 4.5 3 2 3.1Physician 3.5 3.5 2.5 3.1Radiologist 1 2 2 2 2
21 Radiologist 2 3 2 1 2Physician 2.5 2.5 2 2.3
Table 5.3: Quantification of emphysema scored visually by two radiologist and one physician.
5.3 Performance Evaluation Results
The statistical analysis is computed in pairs of the proposed method in this project and eachof one experts. The results of the statistical analysis are showed in the follow tables wherethe quadratic weighted kappa results is displayed as well as the standard error and the 95%of confident interval (CI). The weighted kappa value express the inter-rater agreement. Thestandard error is the value of testing the hypothesis that the underlying weighted kappa valueis equal to a some value other than zero. Finally, the confident interval shows the 95% confi-dent interval of the weighted kappa.
32

The results of the comparison between the visual scoring from the Radiologist 1 and the au-tomatic method are seen in Table 5.4.
Inter-rater agreement between Radiologist 1 and automatic methodWeighted Kappa 0.182Standard Error 0.19195% CI -0.192 to 0.556
Table 5.4: Quadratic weighted kappa result between Radiologist 1 and automatic method.
The inter-rater agreement between Radiologist 2 and automatic method can be seen in Ta-ble 5.5.
Inter-rater agreement between Radiologist 2 and automatic methodWeighted Kappa 0.219Standard Error 0.15995% CI -0,0929 to 0,531
Table 5.5: Quadratic weighted kappa result between Radiologist 2 and automatic method.
The results of the agreement between the Physician and the automatic method is display inTable 5.6.
Inter-rater agreement between the Physician and automatic methodWeighted Kappa 0.297Standard Error 0.12995% CI 0,0432 to 0,551
Table 5.6: Quadratic weighted kappa result between the Physician and automatic method.
33


CHAPTER
6Discussion
The segmentation method used in this project for segmenting the lungs is region growing.Region growing is a method that aims to divide the image in regions according to the gray-level connectivity between pixels. It is a semi-automatic segmentation method but it needsa prior user interaction to suitably place the seeds and to choose the intensity difference be-tween pixels in which the growing process spread out. The results are superimposed with theoriginal images to evaluate the segmentation performance of the region growing method.There is a good matching between the original image and the segmented image. However,the fact that the airways are not segmented apart and therefore included in the lungs seg-mentation may have an influence in the final results.
Texture features are independent of scanner type and it can be used to quantify emphysemabetter than only LAA [Ginsburg et al., 2012]. The proposed texture-based system uses co-occurrence matrix as feature extractor. In this project 12 Haralick features were computedfrom the co-occurrence matrix and used as textural descriptors which describe the spatialdependence of the gray-scale distributions. However, co-occurrence matrix and the Haralickfeatures extracted from it does not take into account shape aspect of the gray-level. It couldbe solved by adding another descriptors such as features derived from the histograms or run-length parameters but on the other hand, histograms had been shown that are not able todetect mild emphysema [Lee et al., 2009].
The co-occurrence matrix is used for volumetric data, thus, 13 directions are used in thisproject. This presents an advantage respect to other studies which usually co-occurrence ma-trix is used in 4 directions, thus, 2D. The co-occurrence matrix is computed in the whole sec-tions where the lungs are divided during the segmentation. Although, it may be consideredanother approach that could be to select different ROIs instead of characterized the wholelung, it could lead to better results in the classification process.
A big problem during this project is coming from the data set due to it was not acquiredwith the purpose of this project, hence a very small control group and experimental groupare available. Besides, the experts scoring were not provided in a very useful way in order tocompare with the results of the proposed method. The proposed method express the prob-ability in percentage of suffering emphysema that a lung has while the experts assessmentshows the emphysema extent of a lung. In order to be able to compare more straightforwardboth results could be if the experts score the patients slice by slice, in that case a percentageof the maximum theoretical score can be computed [Revel et al., 2008].
35

The classification process performed in this project is carried out using SVM. In this project,the assessment of the patients made by the two radiologists and the physician are taken asa gold standard for comparison purposes, despite of the limitations and the inter-observervariability. The comparison between the results of the classifier and the scoring of the ex-perts does not show the best results for the automatic method. The classifier tend to overestimate the severity of the emphysema. The misclassification in the quantification may beunderstood in the context of the small data set available.
A statistical analysis is computed in this project for evaluate the agreement between the pro-posed method and the two radiologists and the physician. The statistical method chosen isthe quadratic weighted kappa analysis which give as a result a fair agreement between theexperts and the method developed in this project. The experts assessment is being used tovalidate the method but the fact that visual scoring is depend on the inter-observer variabil-ity and the categorical scale used for quantify the emphysema is quite subjective, a perfectagreement when computing the statistical analysis is very rare. It has to be noticed that strongagreement requires strong association, but strong association can exist without strong agree-ment [Agresti, 1996], thus, if the automatic method rates the patients one level higher thanthe experts, the strength of agreement is poor even though the association is very strong.
In short, the proposed method can be considered as a method for quantifying emphysema,however, further investigation should be done in order to study if emphysema lesions needto be characterized by other descriptors than only co-occurrence matrix and if the fact to notsegment the airways and vessels has a direct effect on the distinction of emphysematous tis-sue. Besides, a bigger data set acquired and scored by the experts with the purpose of thestudy is needed in order to validate the results accurately.
36

CHAPTER
7Conclusion
The purpose of this project was to study the feasibility of a reliable and objective automaticmethod for quantifying emphysema in patients with COPD using HRCT scans. The proposedmethod is based on segmentation, texture analysis and classification of the texture featuresto assess the emphysema severity. The segmentation process was based on region growing,the texture features were extracted from the computed co-occurrence matrices and a SVMclassified the features by distinguishing between emphysema and healthy tissue.
The proposed method during this project has a good prospect of being a reliable methodto quantify emphysema. However, the data used for the project was not acquired with thepurpose of the project and therefore the results were not in full agreement with the resultsof the experts. The low rate agreement when the statistical analysis was computed could beexplained with the small quantity of data in the experimental and control group as well as thedifficulty of not being able to directly compare percentages of emphysema.
Nevertheless, the method explained in this project can differentiate emphysematous andhealthy tissue and quantify these textural features to increase the objectivity when assessingemphysema severity in patients with COPD. It can be used as a method to avoid the inter-observer variability of visual scoring by experts.
37


CHAPTER
8Perspectives
Despite of the results showed in this project, there are a few other areas and considerationsthat should be further investigated. Firstly, a data set acquired with the purpose of the projectis needed. A bigger experimental group as well as a bigger control group are required. Itshould be assure that the control group is created by only healthy subjects.
A true gold standard is needed to be able to compare the results of the automatic methodwith the assessment of the experts. The assessment of the experts needs to be done having inmind the purpose of the project and therefore, having a scores that can be compared directlywith the results given by the proposed method.
It is suggested to segment the airways and vessels prior to segmentation of the lungs in orderto investigate if it has a direct effect on the distinction of emphysematous tissue. Different de-scriptors, others than only co-occurrence matrix, should be used to characterize emphysemaand to study the influence that different type of descriptors may have for defining accuratelyemphysema lesions according with its size, distribution or severity.
The presented method can be extrapolated to other areas since quantitative image analy-sis may yield new relevant information that can be used to improve the diagnosis of differentpathologies. Thus, the segmentation and the texture-based methods presented in this projectcan be used for example, for quantifying lung damage after radiation pneumonitis or detect-ing tumors in other organs, an example could be the liver. This proposed method can also beused with other types of data, for example magnetic resonance images.
39


Bibliography
a.d.a.m. medical encyclopedia, . [2011], ‘Emphysema’.URL: http://www.ncbi.nlm.nih.gov/pubmedhealth/PMH0001153/figure/A000091.B17055
Adnan, M. M. [2011], ‘Pathogenesis of emphysema’.URL: http://medicinembbs.blogspot.dk/2011/02/pathogenesis-of-emphysema.html
Agresti, A. [1996], An Introduction to Categorical Data Analysis, A Wiley-Interscience publica-tion.
Albregtsen, F. [2008], Statistical texture measures computed from gray level coocurrence ma-trices, Technical report, Oslo University.
Barnes, P. J., Rennard, S. I., Drazen, J. M. and Thomson, N. C. [2009], Asthma and COPD,Elsevier.
Bland, M. [2000], An introduction to medical statistics, Oxford University Press.
Blechschmidt, R. A., Werthschützky, R. and Lörcher, U. [2001], ‘Automated ct image evalu-ation of the lung: A morphology-based concept’, IEEE Transactions on Medical Imaging20, 434 – 442.
Bousquet, J. and Khaltaev, N. [2007], Global surveillance, prevention and control of chronicrespiratory diseases: a comprehensive approach, World Health Organization.
Castellano, G., Bonilha, L., Li, L. M. and Cendes, F. [2004], ‘Texture analysis of medical images’,Clinical Radiology 59, 1061 – 1064.
Chabat, F., Yang, G. and Hansell, D. M. [2003], ‘Obstructive lung diseases: Texture classifica-tion for differentiation at ct’, Radiology 228, 871 – 877.
Cohen, J. [1968], ‘Weighted kappa: nominal scale agreement with provision for scaled dis-agreement or patial credit’, Psychological Bulletin 70, 213 – 220.
Currrie, G. P., Barnes, P., Britton, J., Christie, G., Deverus, G., Douglas, J., Freeman, D., Lee,D. K. G., Legge, J. S., Lipworth, B. J., MacNee, W., Plant, P., Price, D., Srivastava, P. andWedzicha, J. A. [2007], ABC of chronic obstructive pulmonary disease, Blackwell Publishing.
Duda, R. O. [2000], Pattern Classification.
Friedman, P. J. [2008], ‘Imaging studies in emphysema’, Proceedings of the American ThoracicSociety 5, 494 – 500.
41

Gevenois, P. A., Maertelaer, V., Vuyst, P., Zanen, J. and Yernault, J. C. [1995], ‘Comparison ofcomputed density and macroscopic morphometry in pulmonary emphysema.’, AmericanJournal of Respiratory and Critical Care Medicine 152, 653 – 657.
Gietema, H. A., Müller, N., Nasute Fauerbach, P., Sharma, S., Edwards, L., Camp, P. and Cox-son, H. [2011], ‘Quantifying the extent of emphysema: Factores associated with radiolo-gists’ estimations and quantitative indices of emphysema severity using the eclipse co-hort.’, Academic Radiology 18, 661–671.
Ginsburg, S. B., Lynch, D. A., Bowler, R. P. and Schroeder, J. D. [2012], ‘Automated texture-based quantification of centrilobular nodularity and centrilobular emphysema in chest ctimages’, Academic Radiology 10, 1241 – 1251.
Global Initiative Chronic Obstructive Lung Disease, . [2013a], Global strategy for the diagnosis,managment, and prevention of Chronic Obstructive Pulmonary Disease.
Global Initiative Chronic Obstructive Lung Disease, . [2013b], Management Reference forChronic Obstructive Pulmonary Disease (COPD).
Gonzalez, R. C. [2001], Digital Imag Processing, Tom Robbins.
Haralick, R. M., Shanmugam, K. and Dinstein, I. [1973], ‘Textural features for image classifi-cation’, IEEE Transactions on Systems Man and Cybernetics 6, 610 – 621.
Kellnerd, D. [2011], ‘Region growing (2d/3d grayscale)’.URL: http://www.mathworks.com/matlabcentral/fileexchange/authors/140941
Kothari, R. [1999], ‘Image segmentation’, Wiley Encyclopedia of Electrical and Electronics En-gineering.URL: http://onlinelibrary.wiley.com/doi/10.1002/047134608X.W5509/abstract
Lee, Y., Seo, J., Lee, J., Kim, S., Kim, N. and Kang, S. [2009], ‘Performance testing of sev-eral classifiers for differentiating obstructive lung diseases based on texture analysis athigh-resolution computerized tomography (hrct)’, Computer methods and programs inbiomedicine 93, 206 – 215.
Lemaitre, G. and Rodojevic, M. [2010], Texture segmentation: Co-occurrence matrix and law’stexture mask methods, Technical report.
Litmanovich, D., Boiselle, P. M. and Bankier, A. A. [2008], ‘Ct of pulmonary emphysema -current status, challenges, and future directions.’, European Society of Radiology .
Mascalchi, M., Diciotti, S., Sverzellati, N., Camiciottoli, G., Ciccotosto, C., Falschi, F. and Zom-patori, M. [2012], ‘Low agreement of visual rating for detailed quantification of pulmonaryemphysema in whole-lung ct’, Acta Radiologica 53, 53 – 60.
Mayo Clinic, . [2012], ‘Copd’.URL: http://www.mayoclinic.com/health/copd/DS00916
Mets, O. M., Jong, P. A., Ginneken, B., Gietema, H. A. and Lammers, J. W. J. [2012], ‘Quantitativecomputed tomography in copd: Possibilites and limitations’, Lung 190, 133 – 145.
Nagao, J., Aiguchi, T., Mori, K., Suenaga, Y., Toriwaki, J., Mori, M. and Natori, H. [2003], ‘A cadsystem for quantifying copd based on 3-d ct images’, MICCAI 2878, 730 – 737.
42

National Heart, L. and Blood Institute, . [2012a], ‘How the lungs work’.URL: http://www.nhlbi.nih.gov/health/health-topics/topics/hlw/
National Heart, L. and Blood Institute, . [2012b], ‘What is copd?’.URL: http://www.nhlbi.nih.gov/health/health-topics/topics/copd/
OpenCV [2011], ‘Introduction to suppport vector machine’.URL: http://docs.opencv.org/doc/tutorials/ml/introductiont os vm/i ntr oducti ont os vm.html
Reilly, J. [2006], ‘Using computed tomography sanning to advance understanding of chronicobstructive pulmonary disease’, Proceedings of the American Thoracic Society 5, 450 – 455.
Revel, M., Faivre, J., Remy-Jardin, M., Deken, V., Duhamel, A., Marquette, C., Tacelli, N., Bakai,A. and Remy, J. [2008], ‘Automated lobar quantification of emphysema in patients withsevere copd’, Europa Radiology 18, 2723 – 2730.
Shaker, S. B., Dirksen, A., Bach, K. S. and Mortensen, J. [2007], ‘Imaging in chronic obstructivepulmonary disease’, Jounal of Chronic Obstructive Pulmonary Disease 4, 143 – 161.
Sluimer, I., Schilham, A., Prokop, M. and Van Ginneken, B. [2006], ‘Computer analysis of com-puted tomography scans of the lung: A survey’, IEEE Transactions on Medical Imaging 25.
Sørensen, L., Shaker, S. B. and Bruijne, M. [2010], ‘Quantitative analysis of pulmonary em-physema using local binary patterns’, IEE Transactions on medical imaging 29, 559 – 569.
Stem, E. J. and Frank, M. S. [1994], ‘Ct of the lung in patients with pulmonary emphysema: Di-agnosis, quantification, and correlation with pathologic and physiologic findings.’, Ameri-can Roentgen Ray Society 162, 791 – 798.
Thomsen, L. P., Weinreich, U. M., Karbing, D. S., Helbo Jensen, V. G., Vuus, M., Frøkjær, J. B.and Rees, S. [2013], ‘Can computed tomography classifications of chronic obstructive pul-monary disease be identfied using bayesian networks and clinical data?’, Computer Meth-ods and Programs in Biomedicine pp. 361 – 368.
Uppuluri, A. [2008], ‘Glcm f eatur es4.m : V ector i zed ver si ono f g lcm f eatur es1.m′.URL:http://www.mathworks.se/matlabcentral/fileexchange/authors/31581
WebMD, . [2009], ‘Lung disease and respiratory health center’.URL: http://www.webmd.com/lung
West, J. B. [1998], Pulmonary Pathophysiology, Williams and Wilkins.
Widmaier, E., Hershel, R. and Strang, K. T. [2011], Human physiology, McGraw - Hill.
World Health Organization, . [2011], ‘Chronic respiratory diseases’.URL: http://www.who.int/respiratory/copd/burden/en/index.html
Yao, J., Dwyer, A., Summers, R. M. and Moluura, D. J. [2011], ‘Computer-aided diagnosis ofpulmonary infections using texture analysis and support vector machine classification’, Aca-demic Radiology 18, 306 – 314.
43


APPENDIX
AImage Analysis
A.1 Region-based Segmentation
Region-based segmentation aims to divide or group regions regarding common image prop-erties such as intensity values, textures or patterns. In region-based segmentation the regionsare considered homogeneous which is used as a criterion. This criterion is used to add pixelsto the region in the region growing algorithm or to divide regions which not fulfill the crite-ria in the region splitting algorithm. Sometimes a combination of both algorithms can beenused [Kothari, 1999].
Region growing generates a region in which pixels fit the homogeneity criterion. This ap-proach starts by setting a seed from where neighbor pixels are added to the region consec-utively if they have similar properties to the seed points and therefore fulfill the criterion.The algorithm stops when there are no more pixels that fit the criteria. In order to formu-late the stopping rule well, it is needed to take into account that criteria such as gray level,texture or color need to be together with additional criteria such as maximum gray level be-tween neighbor pixels, shape or size of the region to be grown [Gonzalez, 2001]. To generatea region growing algorithm is needed to determinate the initial seed point and to decide thecriteria.
Usually the seed position is set either manually or automatically by, for example, the maxi-mum level of pixel gray level value. It is also common to use more than one seed if differentpartitions are required [Kothari, 1999].
The result of applying region growing algorithm is a binary image, usually, with a pixel valueof 0 for the background and the segmented object with a pixel value of 1 [Gonzalez, 2001].
45
A.2 Texture analysis
Texture analysis has been commonly used to detect lesions and distinguish between healthyand non healthy tissue. Texture analysis applies mathematical algorithms to the data fromX-ray, CT scans or MR images. Texture features are the result of the mathematical methodswhich characterize the different objects in the image. Texture analysis can be divided in fourgroups according to the approach taken for evaluating the pixels in the image [Castellanoet al., 2004]. These four groups are:
• Structural methods: These methods are based on the primitives for defining the ob-jects in the images and they provided a good description of the image.
• Model-based methods: Model-based uses complex mathematical algorithms such usfractal or stochastic. The most used approach is the auto-regressive model.
• Statistical approaches: Using these approaches the images are defined by the rela-tion between grey-level values of the pixels. Statistical approaches are the most usedmethod of the four groups and the most common approaches are histogram, absolutegradient, run-length matrix and co-occurrence matrix.
• Transform methods: Transform methods apply Fourier, Gabor or Wavelet transform inorder to analyze the properties of the images. The wavelet transform is the widely usedamong the others.
Statistical approaches are the most widely used in medical images, and during this project co-occurrence matrix and a set of features derived from it has been used to characterize emphy-sema lesions and therefore, to be able to distinguish between emphysematous and healthytissue.
46

A.2.1 Co-occurrence Matrix
The co-occurrence matrix extracts statistical information from the image analyzing the grey-level distribution of pairs of pixels. Co-occurrance matrix depends on several parameterslisted below [Lemaitre and Rodojevic, 2010]:
• Window size of the connected neighbor pixels where the matrix will be computed.
• The number of gray-levels. It is used to narrow the matrix size.
• Direction and distance in which the matrix is computed.
The co-occurrence matrix is computed in the direction selected for each pixel withing thewindow size. Then, the number of times that pixels pairs appears specified by the distance iscounted, thus, each entry of the matrix correspond to one of the grey-level distribution. Anexample of co-occurrence matrix computation is seen in Figure A.1.
Figure A.1: Example of co-occurrence matrix computation of a 3bits image (I) with 1 distanceand 0 degrees.
For a single image there can be many co-occurrence matrices, one for each pair of distancesand directions defined. Generally in a 2D image 20 co-occurrence matrices are computed,taking distances of 1 to 5 pixels and directions in 0, 45, 90 and 135 degrees [Castellano et al.,2004], [Chabat et al., 2003].
A.2.2 Haralick Features
After calculating the co-occurrence matrices, different parameters are computed in order todescribe the texture of the image. Haralick et al. [1973] developed a set of texture featureswhich use the computed co-occurrence matrix in order to describe the image statistically. 12of these features are described in Table A.1 where p represents the co-occurrence matrix.
47

Haralick FeaturesFeature Type of Measure Formula
Energy Uniformity∑
i∑
j{
p(i , j )}2
Entropy Randomness∑
i∑
j p(i , j ) log2(p(i , j ))Correlation Dependence 1
σxσy
∑i∑
j (i , j )p(i , j )−µxµy
Contrast Intensity 1(N−1)2
∑i∑
j (i , j )2p(i , j )
Homogeneity Spatial closeness∑
i∑
j1
1+(i− j )2 p(i , j )
Variance How data vary from the av-erage value
∑i∑
j (i ,µ)2p(i , j )
Sum mean Average∑2N
i=2 i px+y (i ).
Inverse Difference Moment Homogeinity∑
i∑
jp(i , j )|i+ j |2 i j .
Inertia Intensity∑
i∑
j i + j 2p(i , j ).Cluster Shade Skewness
∑i∑
j i + j −µx −µy3p(i , j ).
Cluster Tendency Skewness∑
i∑
j i + j −µx −µy4p(i , j ).
Max Probability Probability maxp(i , j ).
Table A.1: Haralick features description [Haralick et al., 1973], [Albregtsen, 2008].
48