Embed Size (px)
Citation preview

Free Market
1-Demand2- Supply
3- Free Market

1-Demand What is meant by the QUANTITY
DEMANDED of ``American Copper`` in 2006( ie product X)
Qd refers to the quantity that consumers wish to purchase & have the ability to pay for, during a certain time period.
Qd refers to an effective demand( will +purchasing power)
What determines the Qd of ``X``( a certain product)? Qdx= f(Px // Ps. , Pc.,Tastes, Income..) ……………. Demand Law(-) ……………………………… those are other factors that shift the demand curve rightwards if other factors change suitably & leftwards if they change unsuitably

Demand Law:
States that usually there is an inverse relation between the quantity demanded of the product & its own price, other factors being constant.
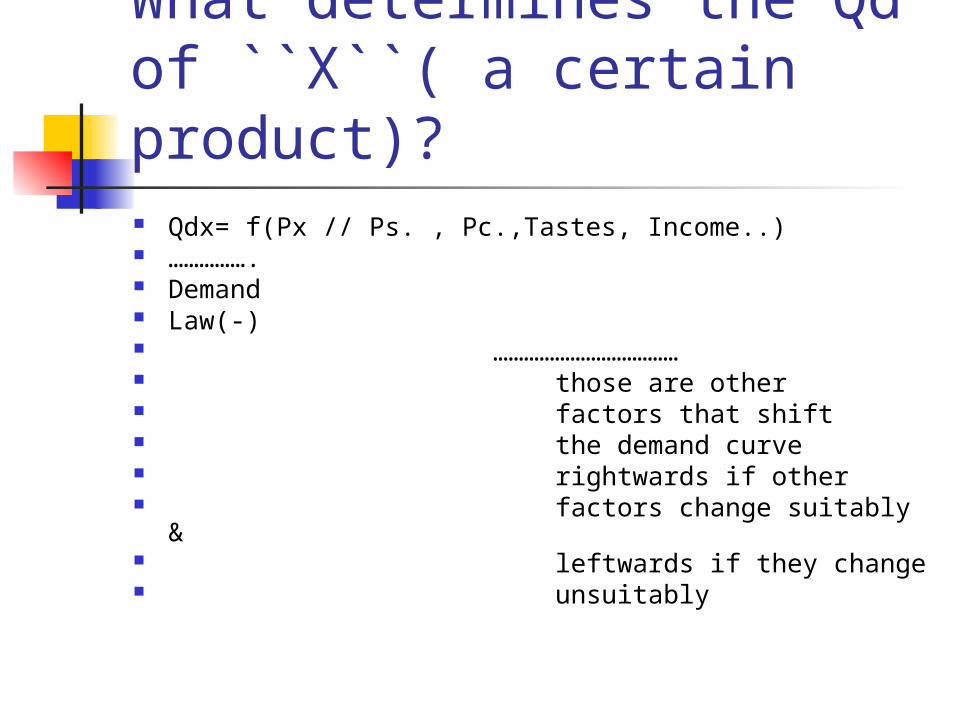
HOW WOULD THE DEMAND CURVE SHIFT IF OTHER FACTORS CHANGE?
Diagrams showing shifts: Diagram showing
a rightward shift as other factors changed suitably
Diagram showing a leftward shift as other factors changed unsuitably
2- Supply
What is meant by the QUANTITY SUPPLIED of ``American copper `` in 2006( Qs of the product ``X``)?
Qs refers to the quantity that the firms wish to produce for sale during a certain time period.

What determines the Qs of a certain product? ( X) Qsx=f(Px// Pinputs,Tech.,Taxes,……..) ……+……… ---------------------------- SUPPLY LAW other factors that SHIFT the
S curve either rightwards or leftwards

Supply law states that usually there is a positive relation between the quantity supplied of a product & its own price, other factors being constant.
When will the Supply curve shift?

Diagrams showing S curve shifts Suitable changes
in other factors( rightward shift)
Unsuitable changes in other factors( leftward shift)

3- Mechanism of a free competitive market
The following shows how a free market operates when the government does not directly intervene to set prices:
Px Qd Qs Excess 20 10 12.6 excess supply 1.10 11 11 EQUILIBRIUM 1.00 11.8 9.4 excess demand

The previous data show that the market price is 1.10 & the quantity is 11.
The market is thus temporarily stabilized.

Diagram showing how a free market operates

Separate cases .
Show the impact of each of the following cases on American Copper Market:1-A decrease in the price of American aluminium.
A decrease in price of aluminium as a substitute to copper, will cause a fall in the demand for copper, thus a leftward shift in the demand curve as seen:
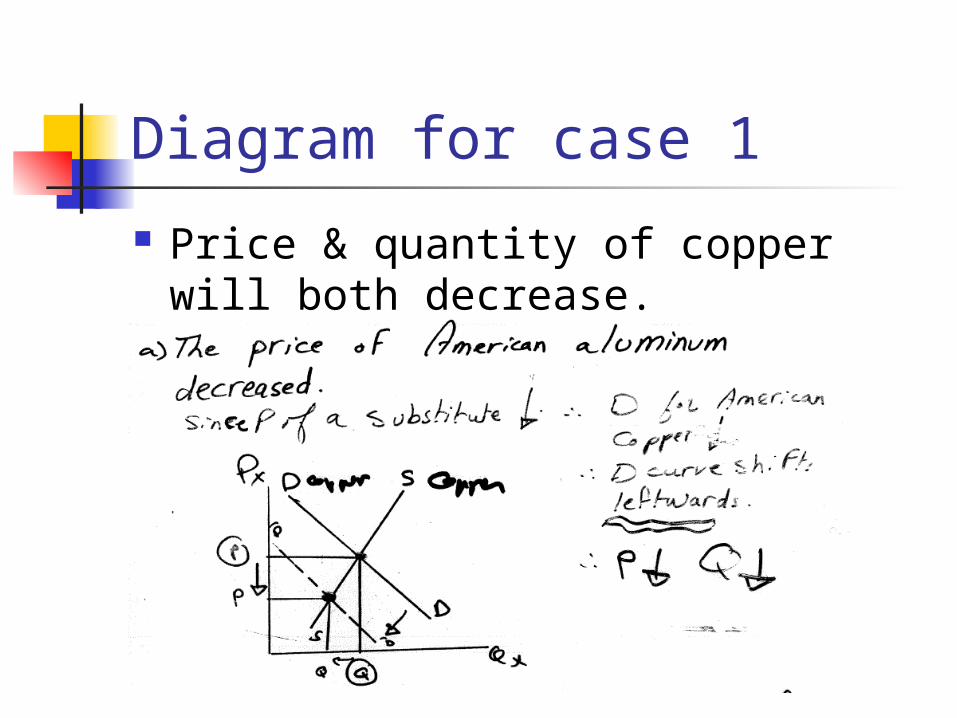
Diagram for case 1
Price & quantity of copper will both decrease.
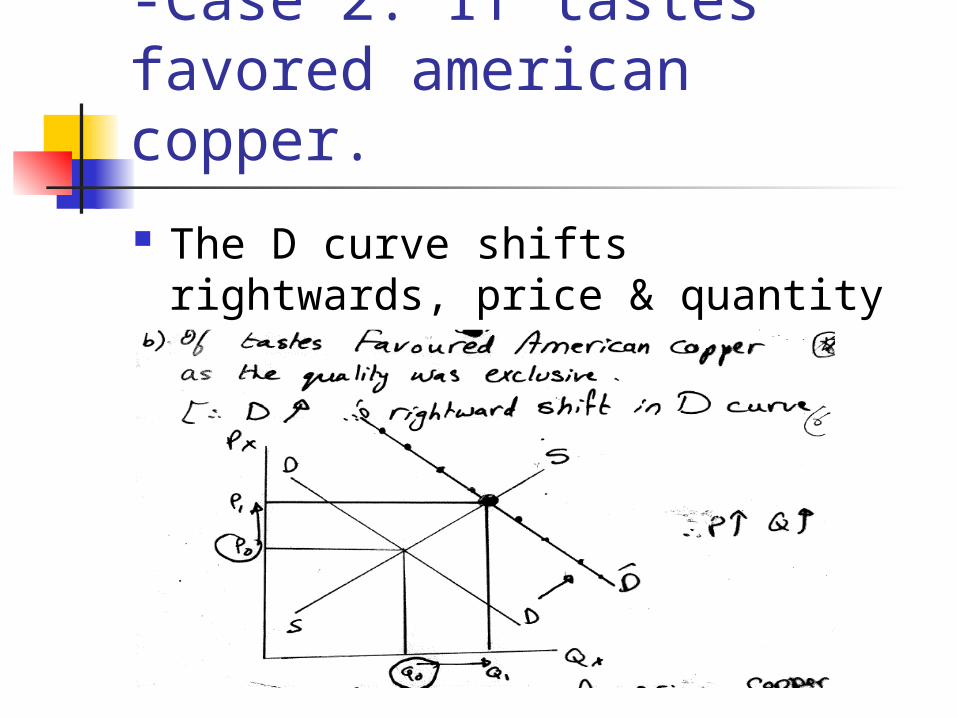
-Case 2. If tastes favored american copper.
The D curve shifts rightwards, price & quantity rise.

Case 3.Costs of extracting copper fell.
The rightward shift of the S curve will decrease the price & increase the quantity ,as seen on the graph:

Case 4. Government imposed high taxes on copper producers
The leftward S curve shift will increase the price & decrease the quantity, as seen on the graph:

Case 5
If government decreased the taxes imposed on American copper producers & subsidized their inputs & that was accompanied by an increase in the demand for American copper, how would the price & quantity be affected?
The following diagrams show the 3 possible alternatives.

Alternative 1 Demand forces
are stronger than supply forces ( extent of shifting the demand curve is greater than that regarding the supply curve,thus P & Q increase
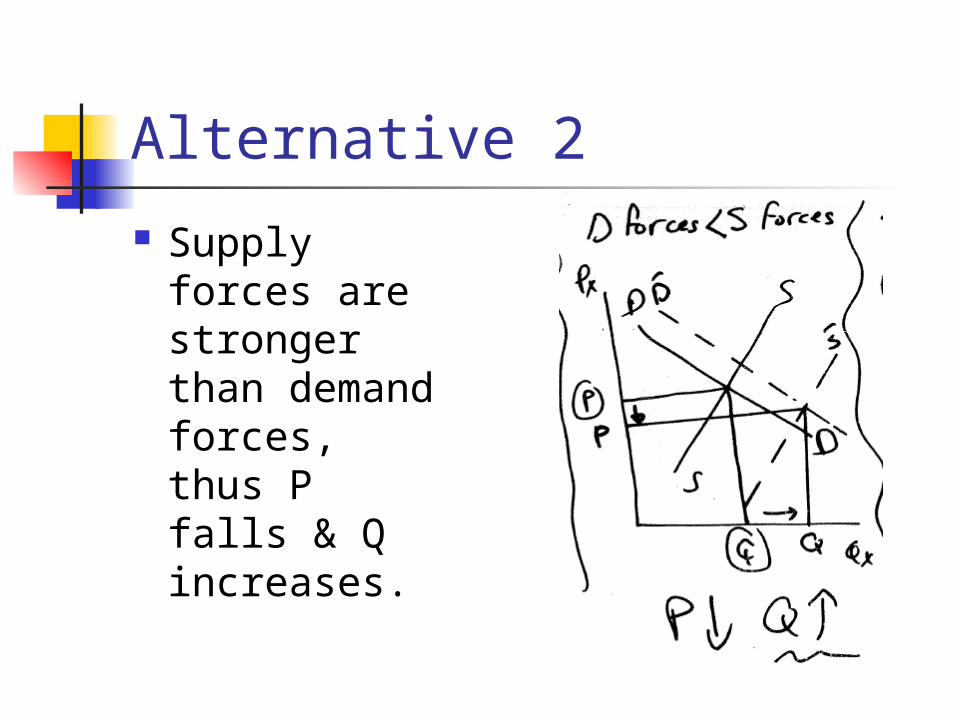
Alternative 2
Supply forces are stronger than demand forces, thus P falls & Q increases.

Alternative 3
Demand & supply forces are equal, thus the price remains constant & Q rises.