Embed Size (px)
Citation preview
Freestanding ED Feasibility
Assessment
Prepared for:
Contra Costa Health Services
December 2012
by:
The Abaris Group
Martinez, CA
Contra Cost Health Services Page 2
FED Assessment
Table of Contents
Introduction ............................................................................................................................................ 3
Summary of Findings ............................................................................................................................... 3
State Licensing and Regulation ................................................................................................................ 3
Federal Issues .......................................................................................................................................... 5
Case Studies ............................................................................................................................................ 5
EMS Issues .............................................................................................................................................. 8
OSHPD Data Analysis ............................................................................................................................. 11
Analysis of Doctors Medical Center, San Pablo....................................................................................... 26
Attachment 1 – Department of Public Health Email ............................................................................... 33
Attachment 2 – Case Study Summaries .................................................................................................. 35
Attachment 3 – Case Study Interview Script/Questions ......................................................................... 38
Attachment 4 – EMS Protocols .............................................................................................................. 39
Attachment 5 – Literature Search .......................................................................................................... 43
Contra Cost Health Services Page 3
FED Assessment
Introduction
The Abaris Group was asked by Contra Costa Health Services to assess the feasibility of establishing a
freestanding emergency department (FED) in the western area of the county due to the possible closure
of Doctors Medical Center, San Pablo (DSP). The methodology included meetings with the county staff
for input, identifying the regulatory environment surrounding FEDs in California, surveying a sample of
FEDs around the country, analyzing data, and conducting a literature search.
Summary of Findings
The Abaris Group offers the following observations based on the research conducted.
� FEDs remain a viable and growing product in the US for providing emergent and urgent services that
are distant from a hospital based ED.
� While there remain some barriers across the country, most FEDs do accept EMS traffic from the
field.
� The review of the data suggests that a large percent of ED patients at DSP lend themselves to
utilizing an FED.
� While it is possible that a patient requiring hospital admission would arrive at a FED, these numbers
appear to be a small percent of the total FED volume (less than 9 percent). The practice of FEDs
throughout the country is to move these patients to a hospital through 911 or a contract interfacility
transport provider.
� There are challenges to establishing an FED in California from a statutory and regulatory standpoint,
but the possibility exists with the further exploration of “program flexibility” and the waiver of
regulations.
State Licensing and Regulation
Licensing and regulation of hospitals is conducted by the California Department of Public Health (DPH).
Contact was made with Erica Eisenlauer, a Legislative Coordinator with the Office of Legislative &
Governmental Affairs ([email protected]). Her office 1 sent a detailed email (see Attachment
1) pertaining to FEDs and statutory and regulatory parameters that exist in California.
While the California Code of Regulations (CCR) states that an emergency center must be housed in a
hospital, the DPH does allow for some “program flexibility” based on special circumstances. This enables
licensed health facilities to apply for and receive permission for new models of providing care. DPH also
states in their correspondence that exceptions can be made to requirements defined in California
regulation. However, if the proposed model does not meet California and Federal “law,” a program
exception cannot be granted.
1Cassie Dunham, Policy Section Chief, [email protected], Chelsea Driscoll, Non-Long Term Care Policy Manager,
[email protected], Monica Wagoner, Deputy Director, [email protected].
Contra Cost Health Services Page 4
FED Assessment
There are nine key requirements that are defined in California statute and regulation that pertain to the
FED question.
1. Be staffed and equipped at all times to provide prompt care for any patient presenting urgent
medical problems.
2. Have ready access to all necessary (hospital) services.
3. Be able to provide intensive care service with adequate monitoring and therapeutic equipment.
4. Have laboratory service with the capability of performing blood gas analysis and electrolyte
determinations.
5. Have radiological service capable of providing necessary support for emergency services.
6. Have surgical services immediately available for life-threatening situations.
7. Have postanesthesia recovery service.
8. Have readily available the services of a blood bank with blood storage facilities in or adjacent to the
emergency service.
9. Be overseen by a physician trained in emergency medical services 24 hours a day.
It is The Abaris Group’s opinion that some of these requirements would be difficult to achieve, but not
insurmountable, except number 6, which is: Have surgical services immediately available for life-
threatening situations, which appears to be daunting if taken at face value. Items 4-8 are listed in 22 CCR
§ 70413 (http://weblinks.westlaw.com). Given the caveat provided in the email that exemptions can be
made on the basis of California regulation, The Abaris Group believes there may be an alternative to this
requirement (i.e., transfer agreement) in item 6. However, it is important to note that the State of
California tends to be conservative in its actions on these matters.
The Abaris Group also identified a past California State Assembly Bill, AB1862, which was introduced by
Assemblyman Dan Logue (District 3) in February 2012. The bill sought to amend Section 1250.9 of the
California Health and Safety Code by expanding the number of miles to greater than 15 that general
acute care hospitals could have physical plants maintained and operated under their license. It was
stated by Assemblyman Logue’s staff that the bill was requested by the California Hospital Association,
specifically to address the impending closure of Martin Luther King Hospital in Los Angeles County.2
The previous correspondence from DPH to The Abaris Group stated that a similar section of the state
statute covering this topic of hospital license (1250.8) is not applicable to the FED issue because EDs are
not separately licensed health facilities, their services are provided under the hospital’s license.
Of interest, the legislative aide who worked on this bill for Assemblyman Logue (Adrian Morales)
explained that there were two main opponents to the bill: emergency department physicians and the
California Medical Association. They had three concerns: 1. that the wrong patients would be
transported to the FED, 2. misunderstanding by the public on how to use the FED, and 3. erosion of
market share by neighboring hospitals. The bill was scheduled for its second hearing, when the hearing
was canceled at the request of author in April 2012.
With respect to establishing an urgent care center (UCC) instead of an FED, the state does not regulate
UCCs.
2 The Abaris Group could not adjudicate this bills introduction date to the actual closure of Martin Luther King Hospital in 2008.
Contra Cost Health Services Page 5
FED Assessment
Federal Issues
Since 2006, The Centers for Medicare & Medicaid (CMS) have recognized some emergency departments
that are not contiguous to the hospital as “Type B” emergency departments and thus pays separately for
these services. Simply being an urgent care center does not necessarily meet the specific criteria
outlined by the Centers for CMS for Type B emergency departments.
To qualify as a Type B emergency department, the facility must meet at least one of the following
criteria:
� Licensing: The clinic is licensed by the state in which it is located under applicable state law as an
emergency room or emergency department.
� Self-Designation: The clinic is held out to the public by name, posted signs, advertising, or other
means as a place that provides care for emergency medical conditions on an urgent basis
without requiring a previously scheduled appointment.
� Patient Visits: During the calendar year immediately preceding the calendar year in which a
determination under this section is being made based on a representative sample of patient
visits that occurred, at least one-third of all outpatient visits to the urgent care center are for the
treatment of emergency medical conditions on an urgent basis without requiring a previously
scheduled appointment.
After applying the specific criteria for a Type B emergency department, very few urgent care centers are
appropriately classified as Type B emergency departments.
Some confusion may arise from application of the third criteria. There are three parts to this criteria,
however, and in order to qualify as a Type B emergency department your urgent care center must meet
the definition in all three parts (not just one or two parts). Are over 1/3 of the visits to your urgent care
center:
1. on an urgent basis
2. without appointment
3. and for treating emergency medical conditions?
The criteria for qualifying as a Type B emergency department are essentially identical to the criteria that
determine whether or not a facility is covered under EMTALA. Thus, if an urgent care center does not
qualify as a type B emergency department, then that urgent care center will not be required to follow
the EMTALA guidelines.
Case Studies
Five FEDs were initially identified for one-on-one telephone interviews. Three interviews have been
completed and the remaining two never returned The Abaris Group’s phone call after repeated
attempts. Three other FEDs were identified and called. Again, those three have not returned The Abaris
Group’s phone calls.
Contra Cost Health Services Page 6
FED Assessment
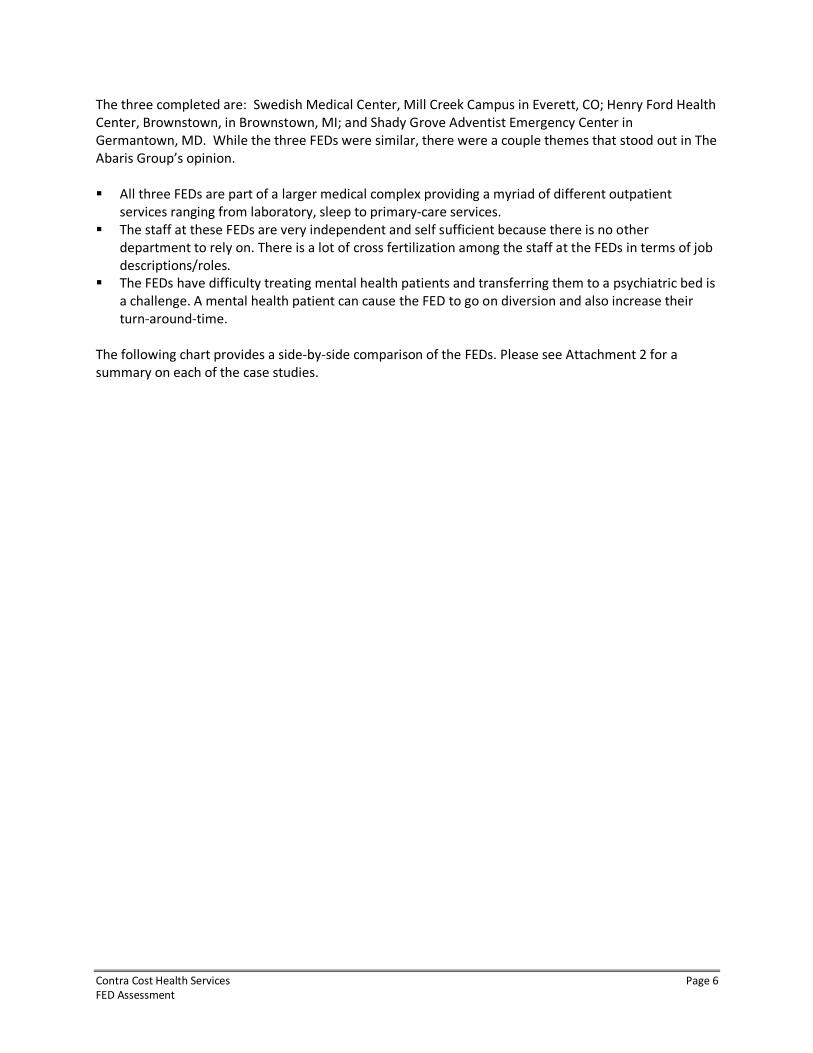
The three completed are: Swedish Medical Center, Mill Creek Campus in Everett, CO; Henry Ford Health
Center, Brownstown, in Brownstown, MI; and Shady Grove Adventist Emergency Center in
Germantown, MD. While the three FEDs were similar, there were a couple themes that stood out in The
Abaris Group’s opinion.
� All three FEDs are part of a larger medical complex providing a myriad of different outpatient
services ranging from laboratory, sleep to primary-care services.
� The staff at these FEDs are very independent and self sufficient because there is no other
department to rely on. There is a lot of cross fertilization among the staff at the FEDs in terms of job
descriptions/roles.
� The FEDs have difficulty treating mental health patients and transferring them to a psychiatric bed is
a challenge. A mental health patient can cause the FED to go on diversion and also increase their
turn-around-time.
The following chart provides a side-by-side comparison of the FEDs. Please see Attachment 2 for a
summary on each of the case studies.
Contra Cost Health Services Page 7
FED Assessment
FED Survey, September 2012
Variable
Swedish Medical Center/
Mill Creek Campus
Everett, WA
Henry Ford Health Center/
Brownstown
Brownstown, MI
Shady Grove Adventist
Emergency Center
Germantown, MD
Contact Melody Schlaman, RN, BSN
Operations Manager
425/357-3932
Amy Kaufman-Eddy
Administrator of Business Unit Strategy
734/287-9088
Mike Oxenford, RN
Nurse Manager
301/444.8050
Opened 2011 2006 2006
Hours 24/7 24/7 24/7
Exam Rooms 18 20 21 + 2 Triage
Census for 2011 22,000 28,000 37,500 (never thought we'd get above 30,000,
hitting 39,000 in 2012)
Estimated UCC Visits 50% 30% 30%
Payer Mix Underserved Mixed Mixed
STEMI/Stroke Affiliation We us our parent hospital there are no
interventions available at our FED.
Our parent hospital has STEMI/Stroke, we stablize
and transfer. If there's extreme weather we have a
protocol to administer TPA.
Our parent hospital has STEMI/Stroke, we stablize
and transfer. However, we do have thrombolitics.
Average Throughput 87 minutes 160 minutes 100-200 minutes, avg 150-160
Admission Rate 4-9% 8% 6.5% - 8.5%
Patient Admitting Delays Very little except with psychiatric patients. Only time there are delays is when the hospitals
are on diversion.
We have preferrential status w/ our hospital even
over the on site ED .
EMS It's been tough. Only BLS can be brought to FED.
ALS w/ failed airway is allowed for stabilization,
but EMS must stay and transport ASAP. We are
working on this.
We occassionally get priority 1 patients, but EMS
follows the protocol. We contract for CCT.
Had a problem w/ local EMS, now contract for CCT.
Shared EMS Protocol Yes Yes Yes
Diversion Rarely, but we need to. Just implemented a new
policy to divert when necessary.
We only divert because of a combative psychiatric
patient, active labor or MI on scene. It's against the
law to divert.
20 hours/month.
Uses diversion because there is no other
department to call on for help.
Key Advice Only hire people who've worked in an ED. Consider the impact of ACA. Critical is getting ancillary staff, ie, security,
maintenance, etc.
Contra Cost Health Services Page 8
FED Assessment
EMS Issues
What EMS resources can be used or reorganized to address the gap?
The resources that can have a substantial impact on addressing the gap of a loss of a full-fledged
hospital-based ED includes an FED, urgent care facility or a community clinic with the capacity to accept
and handle walk-in patients.
Does FED meet the basic ED ability to accept 911 ambulance traffic and what level would best serve the
community?
The Abaris Group’s research demonstrated that many of the FEDs in the country do accept ambulance
traffic but generally with differential field EMS triage policies to limit the number of higher acuity
patients arriving at the FED and thus being transported to the closest hospital-based ED.
Discuss what potential destination changes are likely to occur for 911 traffic and non-emergency
ambulance.
The Abaris Group would recommend that field EMS destination protocols be modified to allow for direct
911 patient transport within the region of the FED to that FED using common field protocols in use
throughout the country. Generally, FEDs would not be an acceptable choice for EMS patients who are
transported through an interfacility transport agency (IFT) where it is contemplated that that patient
would be admitted to a hospital.
What role if any should a FED play in accepting non-emergency ambulance traffic?
Consistent with the answer above, a very limited if not no role would be in place unless they are used to
transporting patients out of the FED to an acute-care hospital.
Evaluate volume of total ambulance traffic IFT (BLS and Critical Care IFT, Non-Emergency Ambulance and
9-1-1 Ambulance).
Incoming ambulance traffic to the FED would be estimated by The Abaris Group to be approximately 50-
60 percent of the current 9-1-1 traffic being sent to DSP today. Very little ILS and no CCT traffic would be
permitted to be transported to the FED with rare exceptions. The Abaris Group does not have access to
current ILS or CCT incoming traffic to the ED at DSP.
What about field triage with a treatment on site?
There is the potential for field triage of some EMS patients and their deferral away from transport
through treatment on site (i.e., MedStar Program, Dallas, TX and others) or through transport to an
alternative site (i.e., non-ambulance transport to physician’s office, etc.) The range and scope of these
potential options is outside of the scope of this project.
Contra Cost Health Services Page 9
FED Assessment
What transport options are available from a FED to a hospital?
The transport options are IFT, CCT or on rare occasions, air transport, if a helistop is available at the FED
site. A contract between the FED and an IFT/CCT provider would be recommended by The Abaris Group.
Prospective volume of intrafacility transport to what inpatient facilities would be expected to manage?
The Abaris Group would estimate that approximately 80 percent of the current non-admitted DSP
patients would utilize the FED, or 24,082. Of those, approximately 5-8 percent would likely move on to
being transferred from the FED to an acute-care hospital. And of those patients, it would be expected
that 95 percent (or 1,144 to 1,830) would be admitted to a med/surg unit and less than 5 percent (57 to
92) would be admitted to a critical care unit. In general, higher-acuity patients would not arrive or
otherwise be transported to the FED.
What strategies would be needed to facilitate timely IFT since EMS Agency has little control over this
area under current ambulance ordinance and statute?
Assurance of an IFT and CCT contractor with strict response performance standards by the FED should
be required for such transport and this approach is now becoming the standard of practice in the
hospital and ambulance environment.
Identify the EMS system risk and benefit for the patient safety perspective and strategies to manage high
risk patient care groups e.g. cardiac arrest, trauma, heart attack, stroke, sepsis and pediatrics.
These patients should never be directly transported to the FED. However and on occasion such patients
may arrive at an FED and due to the level of training and expertise of the staff and available equipment,
these patient could be safely stabilized within the ability of an FED and secondarily transported to an
acute-care hospital.
Evaluate ambulance ordinance to determine any barriers or factors that may impact these issues.
The Abaris Group reviewed Ordinance No. 83-23 (Ambulance Services) and did not identify any barriers
or factors that would preclude the County from having an ambulance provider transport patients from
the FED to a hospital.
What is the EMS agency role in assuring appropriate safe patient triage and flow (both 911 and IFT)
between the FED and other hospitals.
The County should assure the basic ED standards are being met at the FED or an urgent care center
“look-alike” as is consistent with other EMS agencies and their credentialing of EDs (i.e., Santa Clara,
Orange and San Diego Counties). Assurance must be in place for immediate transfer of patients out of
the FED is required. Finally, field protocols should be established to allow for medically-driven standards
to drive which patients may be transported to the FED.
Contra Cost Health Services Page 10
FED Assessment
Evaluate how areas with FEDs address attracting critically ill patients both from EMS and from a walk-in
standpoint that should go to facilities with inpatient care immediately accessible.
The Abaris Group did not find and is not aware of any FEDs in the country that attract “walk-in critically
ill patients.” Contrary, these definitely differentiate from these patients when they market and this
appears to be successful and was not listed as a problem for any of the FEDs interviewed or previously
surveyed.
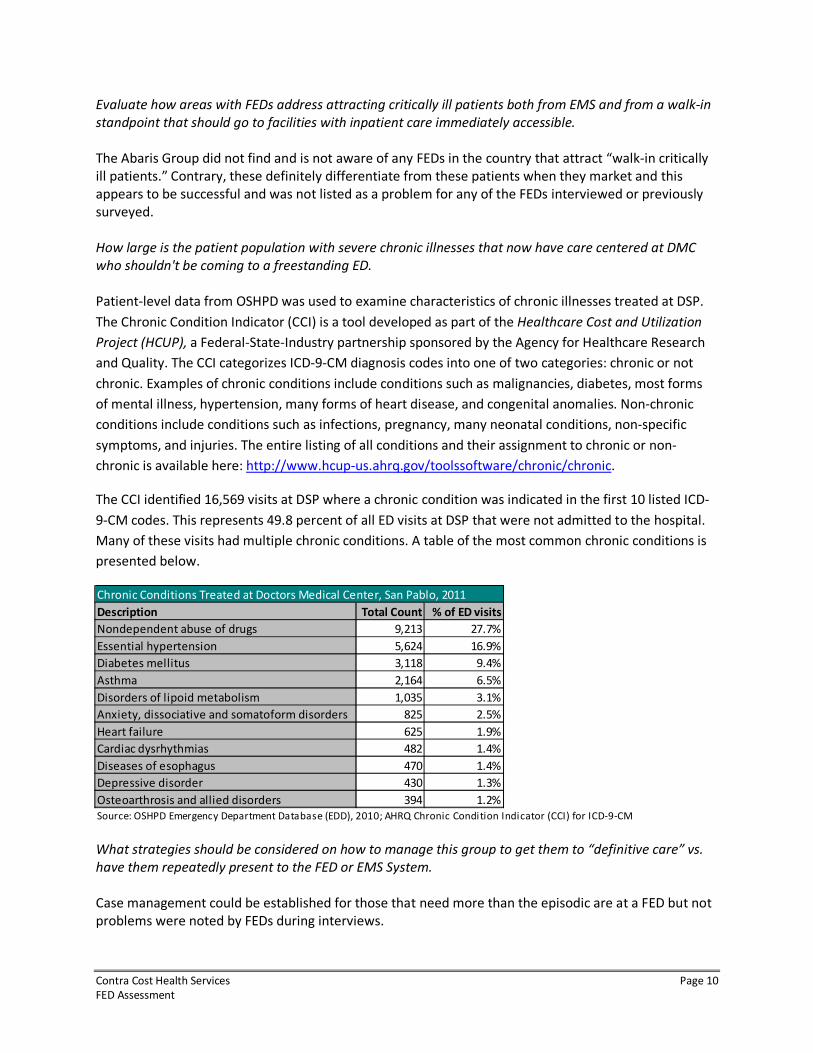
How large is the patient population with severe chronic illnesses that now have care centered at DMC
who shouldn't be coming to a freestanding ED.
Patient-level data from OSHPD was used to examine characteristics of chronic illnesses treated at DSP.
The Chronic Condition Indicator (CCI) is a tool developed as part of the Healthcare Cost and Utilization
Project (HCUP), a Federal-State-Industry partnership sponsored by the Agency for Healthcare Research
and Quality. The CCI categorizes ICD-9-CM diagnosis codes into one of two categories: chronic or not
chronic. Examples of chronic conditions include conditions such as malignancies, diabetes, most forms
of mental illness, hypertension, many forms of heart disease, and congenital anomalies. Non-chronic
conditions include conditions such as infections, pregnancy, many neonatal conditions, non-specific
symptoms, and injuries. The entire listing of all conditions and their assignment to chronic or non-
chronic is available here: http://www.hcup-us.ahrq.gov/toolssoftware/chronic/chronic.
The CCI identified 16,569 visits at DSP where a chronic condition was indicated in the first 10 listed ICD-
9-CM codes. This represents 49.8 percent of all ED visits at DSP that were not admitted to the hospital.
Many of these visits had multiple chronic conditions. A table of the most common chronic conditions is
presented below.
What strategies should be considered on how to manage this group to get them to “definitive care” vs.
have them repeatedly present to the FED or EMS System.
Case management could be established for those that need more than the episodic are at a FED but not
problems were noted by FEDs during interviews.
Description Total Count % of ED visits
Nondependent abuse of drugs 9,213 27.7%
Essential hypertension 5,624 16.9%
Diabetes mellitus 3,118 9.4%
Asthma 2,164 6.5%
Disorders of lipoid metabolism 1,035 3.1%
Anxiety, dissociative and somatoform disorders 825 2.5%
Heart failure 625 1.9%
Cardiac dysrhythmias 482 1.4%
Diseases of esophagus 470 1.4%
Depressive disorder 430 1.3%
Osteoarthrosis and allied disorders 394 1.2%
Source: OSHPD Emergency Department Database (EDD), 2010; AHRQ Chronic Condition Indicator (CCI) for ICD-9-CM
Chronic Conditions Treated at Doctors Medical Center, San Pablo, 2011
Contra Cost Health Services Page 11
FED Assessment
How would patients be triaged/managed when inpatient critical care or hospital bed availability in the
EMS System is at low levels?
The methodology for admitting FED patients would be the same as any inpatient admission. The
difference is that nearly all FED transfers to another acute care hospital are sent to the ED to be further
evaluated and then positioned for admission like any other ED admission.
OSHPD Data Analysis
The sources for the following data analysis are from the Office of Statewide Health Planning Department
(OSHPD) and from the Contra Costa EMS Agency (AMR transport data). Different OSHPD data sets were
analyzed depending on the question.
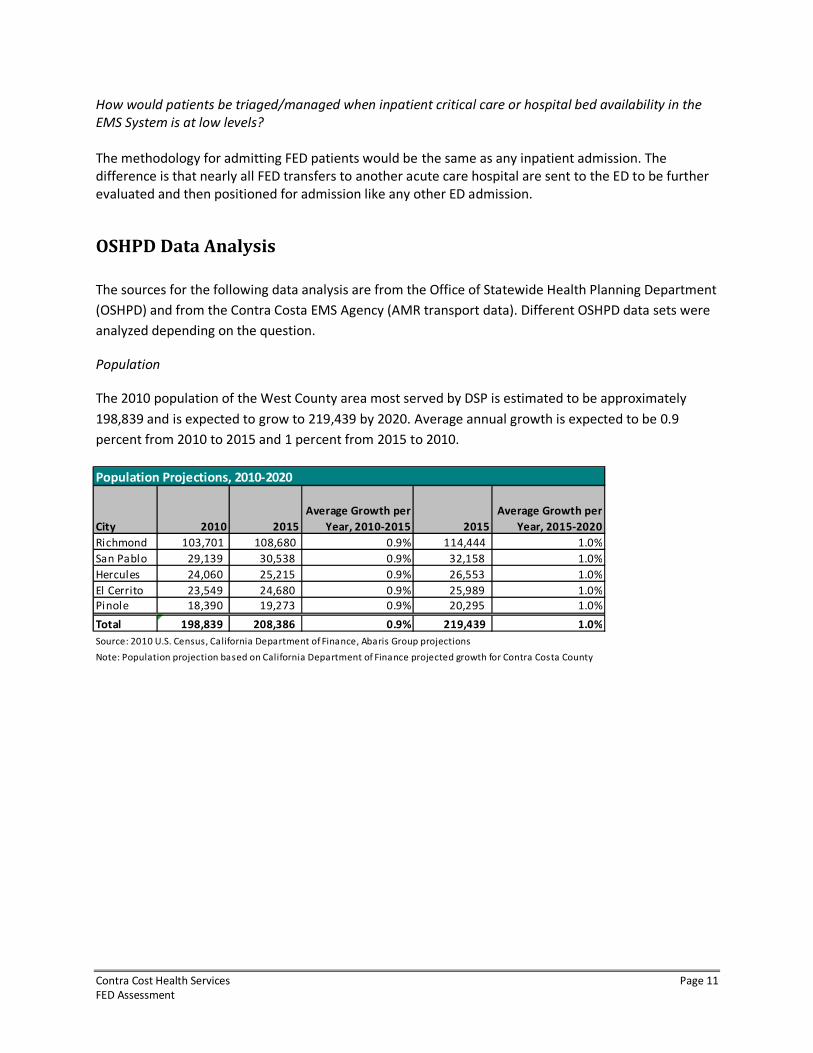
Population
The 2010 population of the West County area most served by DSP is estimated to be approximately
198,839 and is expected to grow to 219,439 by 2020. Average annual growth is expected to be 0.9
percent from 2010 to 2015 and 1 percent from 2015 to 2010.
Population Projections, 2010-2020
City 2010 2015
Average Growth per
Year, 2010-2015 2015
Average Growth per
Year, 2015-2020
Richmond 103,701 108,680 0.9% 114,444 1.0%
San Pablo 29,139 30,538 0.9% 32,158 1.0%
Hercules 24,060 25,215 0.9% 26,553 1.0%
El Cerrito 23,549 24,680 0.9% 25,989 1.0%
Pinole 18,390 19,273 0.9% 20,295 1.0%
Total 198,839 208,386 0.9% 219,439 1.0%
Source: 2010 U.S. Census, California Department of Finance, Abaris Group projections
Note: Population projection based on California Department of Finance projected growth for Contra Costa County
Contra Cost Health Services Page 12
FED Assessment
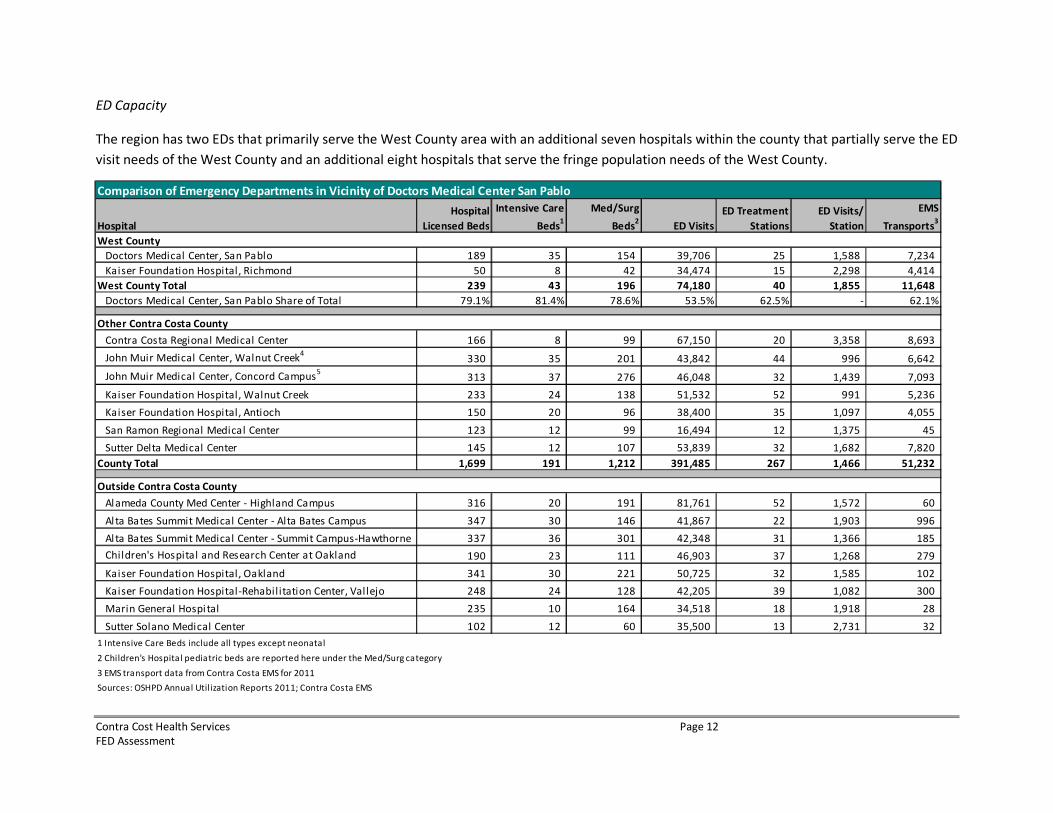
ED Capacity
The region has two EDs that primarily serve the West County area with an additional seven hospitals within the county that partially serve the ED
visit needs of the West County and an additional eight hospitals that serve the fringe population needs of the West County.
Comparison of Emergency Departments in Vicinity of Doctors Medical Center San Pablo
Hospital
Hospital
Licensed Beds
Intensive Care
Beds1
Med/Surg
Beds2
ED Visits
ED Treatment
Stations
ED Visits/
Station
Contra Costa
EMS
Transports3
Doctors Medical Center, San Pablo 189 35 154 39,706 25 1,588 7,234
Kaiser Foundation Hospital, Richmond 50 8 42 34,474 15 2,298 4,414
West County Total 239 43 196 74,180 40 1,855 11,648
Doctors Medical Center, San Pablo Share of Total 79.1% 81.4% 78.6% 53.5% 62.5% - 62.1%
Contra Costa Regional Medical Center 166 8 99 67,150 20 3,358 8,693
John Muir Medical Center, Walnut Creek4
330 35 201 43,842 44 996 6,642
John Muir Medical Center, Concord Campus5
313 37 276 46,048 32 1,439 7,093
Kaiser Foundation Hospital, Walnut Creek 233 24 138 51,532 52 991 5,236
Kaiser Foundation Hospital, Antioch 150 20 96 38,400 35 1,097 4,055
San Ramon Regional Medical Center 123 12 99 16,494 12 1,375 45
Sutter Delta Medical Center 145 12 107 53,839 32 1,682 7,820
County Total 1,699 191 1,212 391,485 267 1,466 51,232
Alameda County Med Center - Highland Campus 316 20 191 81,761 52 1,572 60
Al ta Bates Summit Medical Center - Alta Bates Campus 347 30 146 41,867 22 1,903 996
Al ta Bates Summit Medical Center - Summit Campus-Hawthorne 337 36 301 42,348 31 1,366 185
Children's Hospital and Research Center at Oakland 190 23 111 46,903 37 1,268 279
Kaiser Foundation Hospital, Oakland 341 30 221 50,725 32 1,585 102
Kaiser Foundation Hospital-Rehabilitation Center, Vallejo 248 24 128 42,205 39 1,082 300
Marin General Hospi tal 235 10 164 34,518 18 1,918 28
Sutter Solano Medical Center 102 12 60 35,500 13 2,731 32
1 Intensive Care Beds include all types except neonatal
2 Children's Hospital pediatric beds are reported here under the Med/Surg category
3 EMS transport data from Contra Costa EMS for 2011
Sources: OSHPD Annual Utilization Reports 2011; Contra Costa EMS
West County
Other Contra Costa County
Outside Contra Costa County
Contra Cost Health Services Page 13
FED Assessment
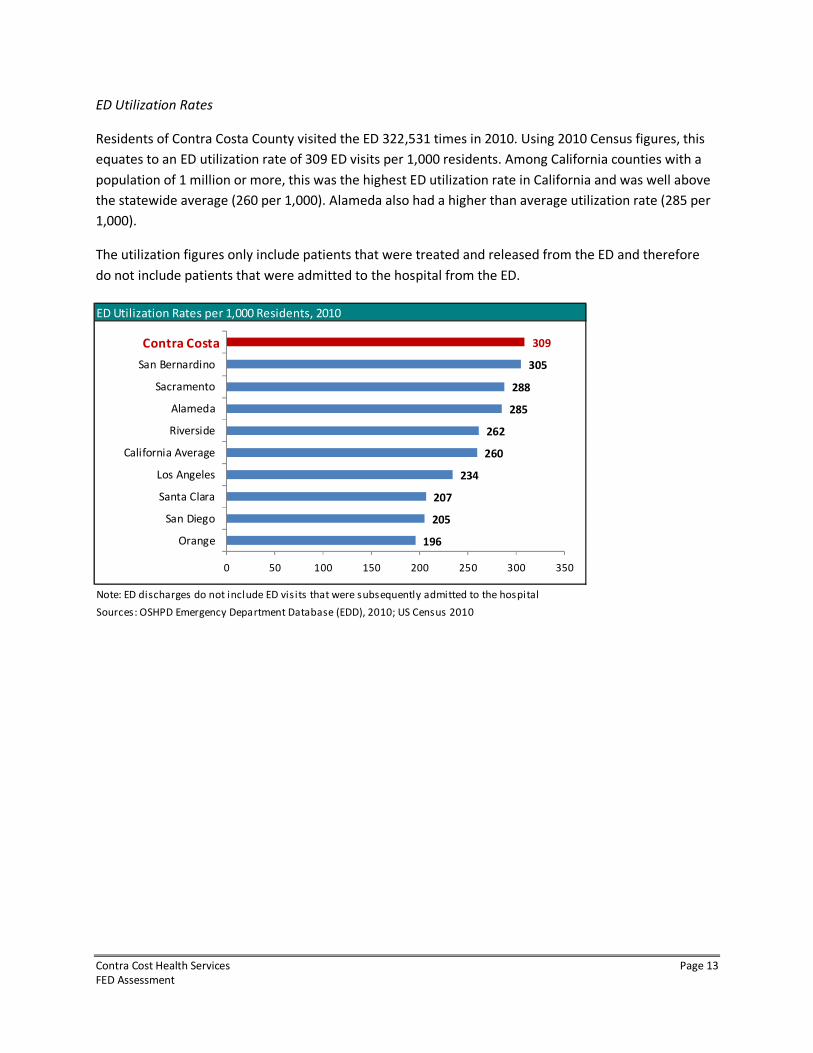
ED Utilization Rates
Residents of Contra Costa County visited the ED 322,531 times in 2010. Using 2010 Census figures, this
equates to an ED utilization rate of 309 ED visits per 1,000 residents. Among California counties with a
population of 1 million or more, this was the highest ED utilization rate in California and was well above
the statewide average (260 per 1,000). Alameda also had a higher than average utilization rate (285 per
1,000).
The utilization figures only include patients that were treated and released from the ED and therefore
do not include patients that were admitted to the hospital from the ED.
ED Utilization Rates per 1,000 Residents, 2010
Note: ED discharges do not include ED visits that were subsequently admitted to the hospital
Sources: OSHPD Emergency Department Database (EDD), 2010; US Census 2010
196
205
207
234
260
262
285
288
305
309
0 50 100 150 200 250 300 350
Orange
San Diego
Santa Clara
Los Angeles
California Average
Riverside
Alameda
Sacramento
San Bernardino
Contra Costa
Contra Cost Health Services Page 14
FED Assessment
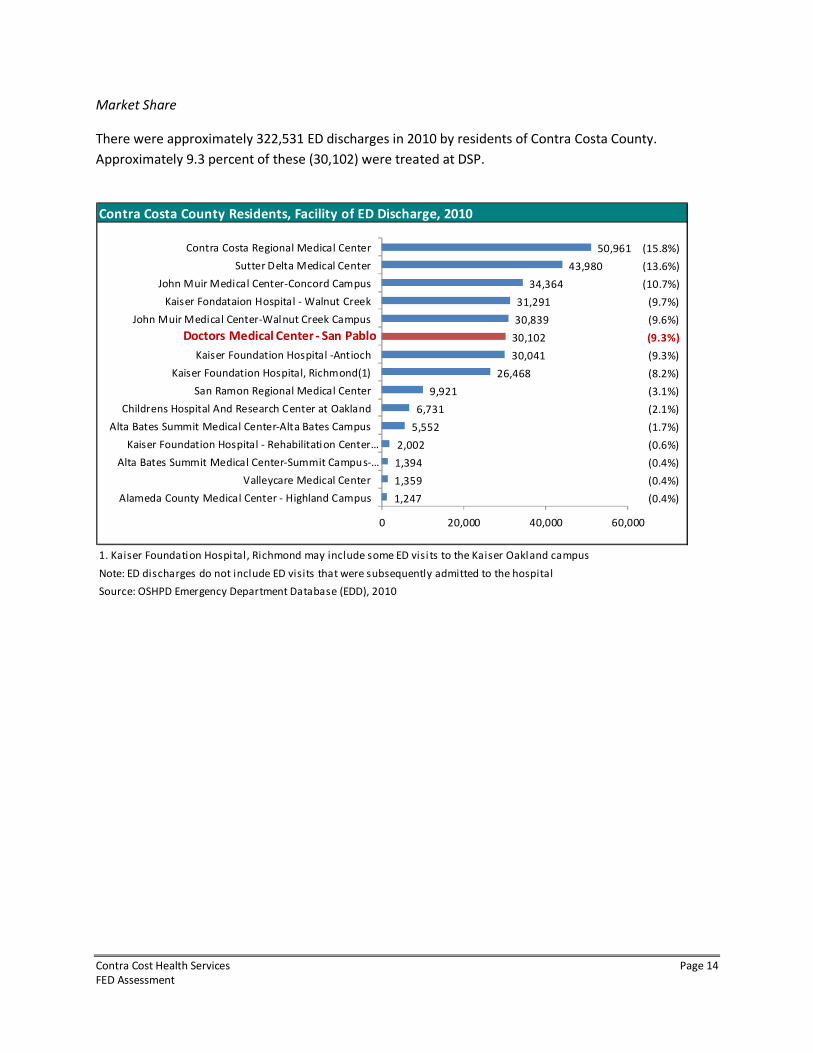
Market Share
There were approximately 322,531 ED discharges in 2010 by residents of Contra Costa County.
Approximately 9.3 percent of these (30,102) were treated at DSP.
Contra Costa County Residents, Facility of ED Discharge, 2010
1. Kaiser Foundation Hospital, Richmond may include some ED visi ts to the Kaiser Oakland campus
Note: ED discharges do not include ED visits that were subsequently admitted to the hospital
Source: OSHPD Emergency Department Database (EDD), 2010
50,961
43,980
34,364
31,291
30,839
30,102
30,041
26,468
9,921
6,731
5,552
2,002
1,394
1,359
1,247
(15.8%)
(13.6%)
(10.7%)
(9.7%)
(9.6%)
(9.3%)
(9.3%)
(8.2%)
(3.1%)
(2.1%)
(1.7%)
(0.6%)
(0.4%)
(0.4%)
(0.4%)
0 20,000 40,000 60,000
Contra Costa Regional Medical Center
Sutter Delta Medical Center
John Muir Medical Center-Concord Campus
Kaiser Fondataion Hospital - Walnut Creek
John Muir Medical Center-Walnut Creek Campus
Kaiser Foundation Hospital -Antioch
Kaiser Foundation Hospital, Richmond(1)
San Ramon Regional Medical Center
Childrens Hospital And Research Center at Oakland
Alta Bates Summit Medical Center-Alta Bates Campus
Kaiser Foundation Hospital - Rehabilitation Center…
Alta Bates Summit Medical Center-Summit Campus-…
Valleycare Medical Center
Alameda County Medical Center - Highland Campus
Doctors Medical Center - San Pablo
Contra Cost Health Services Page 15
FED Assessment
Doctors Medical Center - San Pablo ED Discharges
City of Residence, 2010
Top Cities Frequency Percent
Richmond 13,083 39.3%
San Pablo 9,789 29.4%
El Sobrante 2,276 6.8%
Pinole 1,537 4.6%
Hercules 1,134 3.4%
Rodeo 910 2.7%
El Cerrito 787 2.4%
West County Total 29,516 88.8%
Oakland 514 1.5%
Vallejo 314 0.9%
San Quentin 157 0.5%
Antioch 139 0.4%
Pittsburg 107 0.3%
Crockett 99 0.3%
Albany 78 0.2%
Other Cities 2,330 7.0%
Total 33,254 100%
Source: OSHPD Emergency Department Database (EDD),
2010
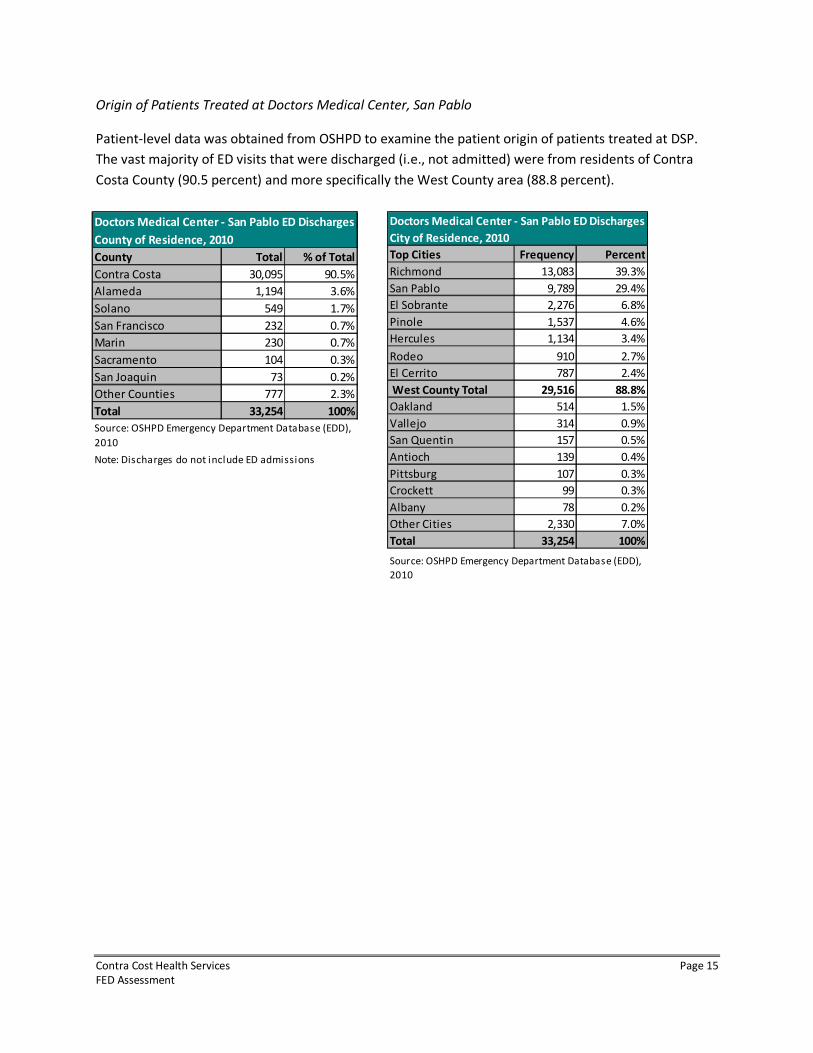
Origin of Patients Treated at Doctors Medical Center, San Pablo
Patient-level data was obtained from OSHPD to examine the patient origin of patients treated at DSP.
The vast majority of ED visits that were discharged (i.e., not admitted) were from residents of Contra
Costa County (90.5 percent) and more specifically the West County area (88.8 percent).
Doctors Medical Center - San Pablo ED Discharges
County of Residence, 2010
County Total % of Total
Contra Costa 30,095 90.5%
Alameda 1,194 3.6%
Solano 549 1.7%
San Francisco 232 0.7%
Marin 230 0.7%
Sacramento 104 0.3%
San Joaquin 73 0.2%
Other Counties 777 2.3%
Total 33,254 100%
Note: Discharges do not include ED admissions
Source: OSHPD Emergency Department Database (EDD),
2010
Contra Cost Health Services Page 16
FED Assessment
0
10,000
20,000
30,000
40,000
50,000
60,000
2012 2014 2016 2018 2020
ED
Vis
its
ED Visits (Increase
Based on Population
Growth)
ED Visits (Increase
Based on Historical
ED Visit Growth)
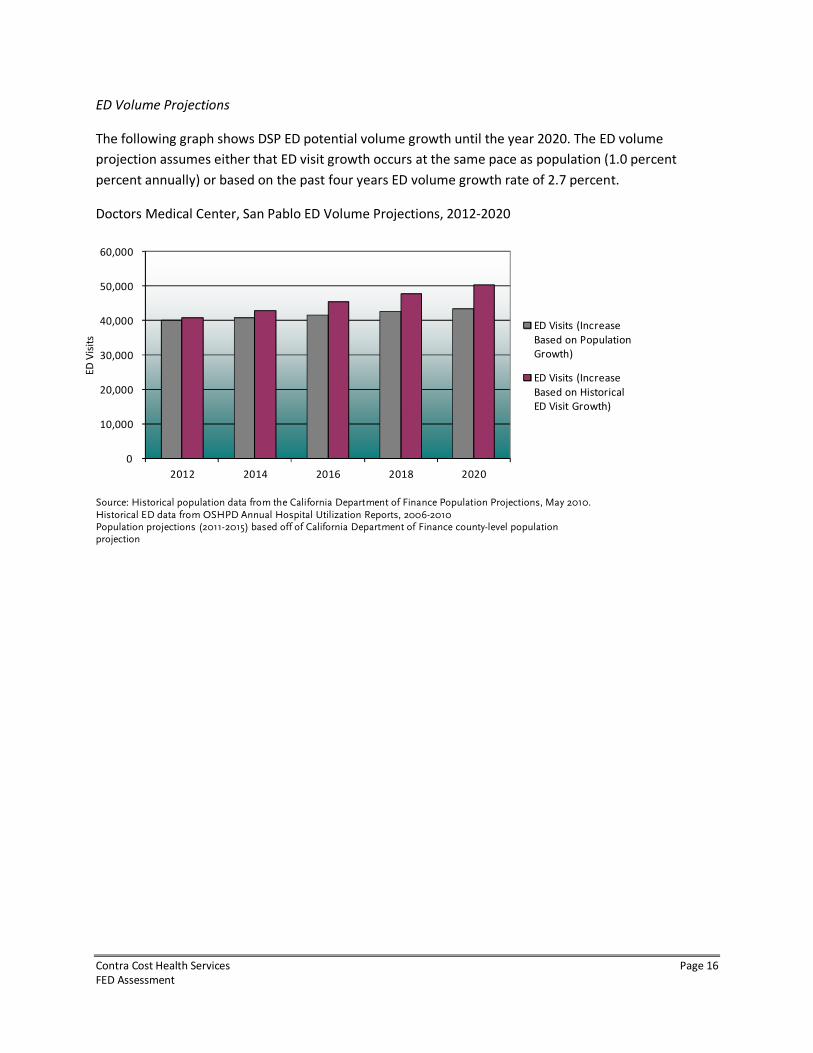
ED Volume Projections
The following graph shows DSP ED potential volume growth until the year 2020. The ED volume
projection assumes either that ED visit growth occurs at the same pace as population (1.0 percent
percent annually) or based on the past four years ED volume growth rate of 2.7 percent.
Doctors Medical Center, San Pablo ED Volume Projections, 2012-2020
Source: Historical population data from the California Department of Finance Population Projections, May 2010. Historical ED data from OSHPD Annual Hospital Utilization Reports, 2006-2010 Population projections (2011-2015) based off of California Department of Finance county-level population projection
Contra Cost Health Services Page 17
FED Assessment
1%10% 8%
22%
17%17%
32%
36%35%
22%
23%23%
23%13% 17%
0%
10%
20%
30%
40%
50%
60%
70%
80%
90%
100%
DSP Contra Costa California
Source: OSHPD Annual Utilization Report, 2011
Critical
Severe
Moderate
Low/moderate
Minor
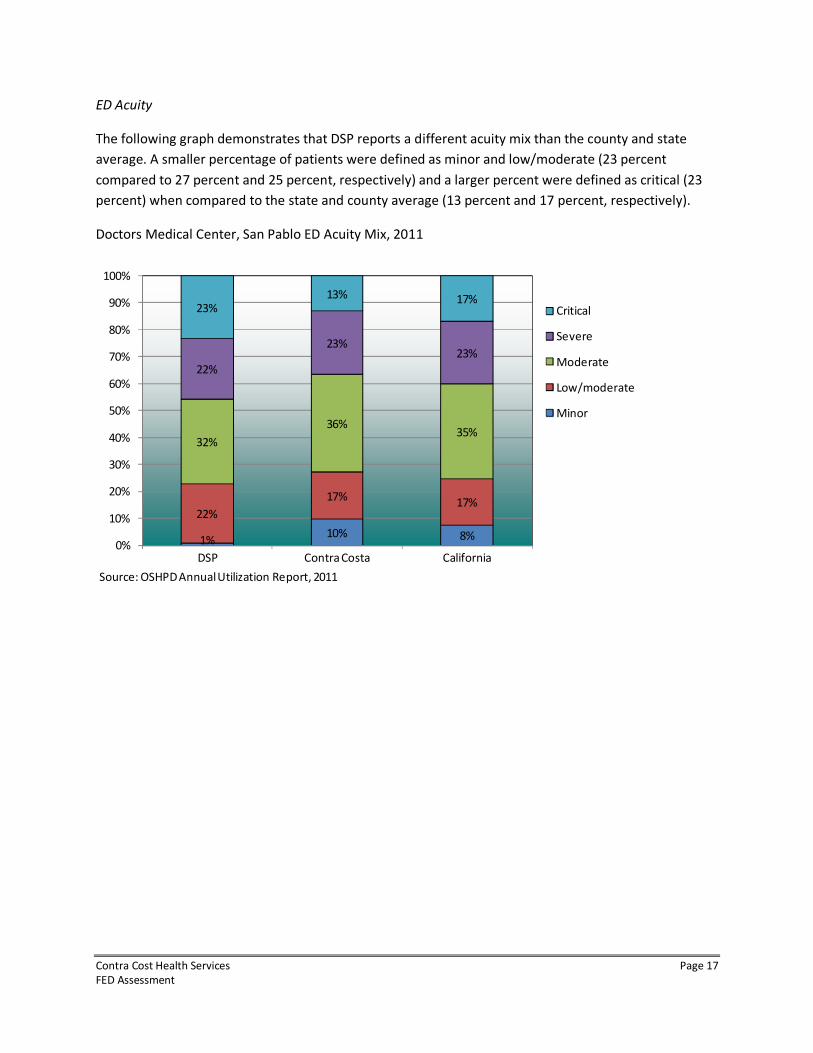
ED Acuity
The following graph demonstrates that DSP reports a different acuity mix than the county and state
average. A smaller percentage of patients were defined as minor and low/moderate (23 percent
compared to 27 percent and 25 percent, respectively) and a larger percent were defined as critical (23
percent) when compared to the state and county average (13 percent and 17 percent, respectively).
Doctors Medical Center, San Pablo ED Acuity Mix, 2011
Contra Cost Health Services Page 18
FED Assessment
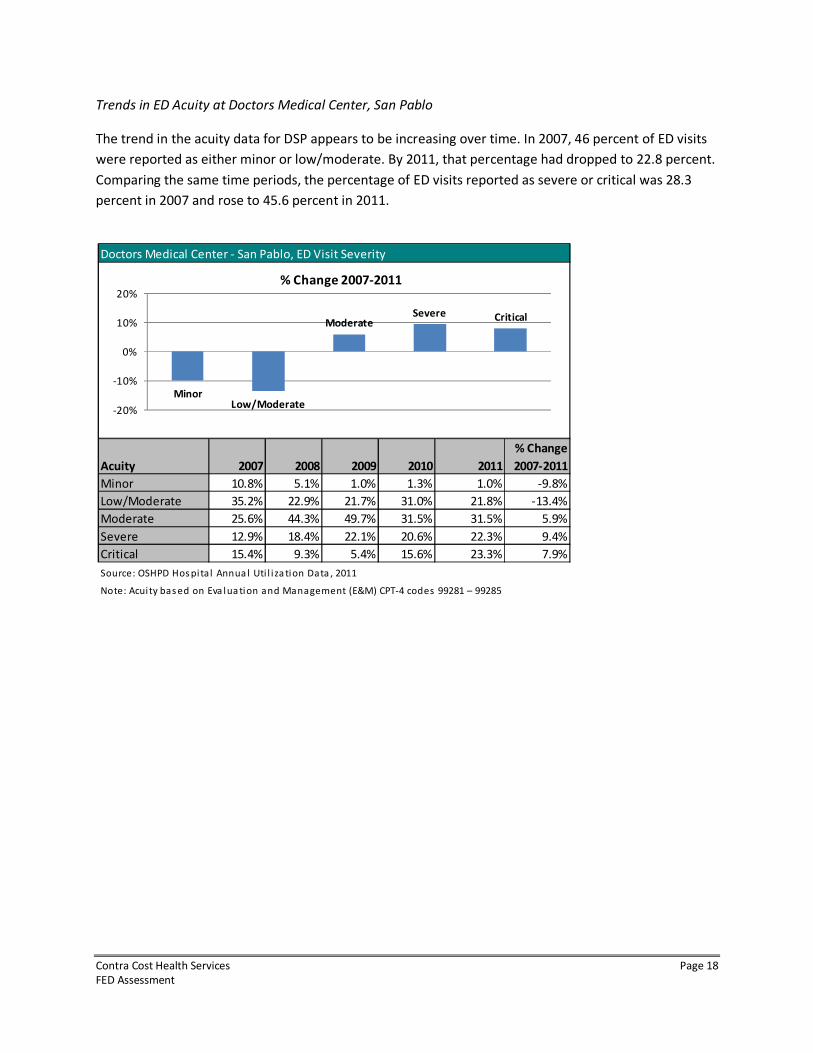
Trends in ED Acuity at Doctors Medical Center, San Pablo
The trend in the acuity data for DSP appears to be increasing over time. In 2007, 46 percent of ED visits
were reported as either minor or low/moderate. By 2011, that percentage had dropped to 22.8 percent.
Comparing the same time periods, the percentage of ED visits reported as severe or critical was 28.3
percent in 2007 and rose to 45.6 percent in 2011.
Doctors Medical Center - San Pablo, ED Visit Severity
Acuity 2007 2008 2009 2010 2011
% Change
2007-2011
Minor 10.8% 5.1% 1.0% 1.3% 1.0% -9.8%
Low/Moderate 35.2% 22.9% 21.7% 31.0% 21.8% -13.4%
Moderate 25.6% 44.3% 49.7% 31.5% 31.5% 5.9%
Severe 12.9% 18.4% 22.1% 20.6% 22.3% 9.4%
Critical 15.4% 9.3% 5.4% 15.6% 23.3% 7.9%
Source: OSHPD Hos pital Annua l Uti l i za tion Data , 2011
Note: Acuity bas ed on Eva lua tion and Management (E&M) CPT-4 codes 99281 – 99285
MinorLow/Moderate
ModerateSevere Critical
-20%
-10%
0%
10%
20%
% Change 2007-2011
Contra Cost Health Services Page 19
FED Assessment
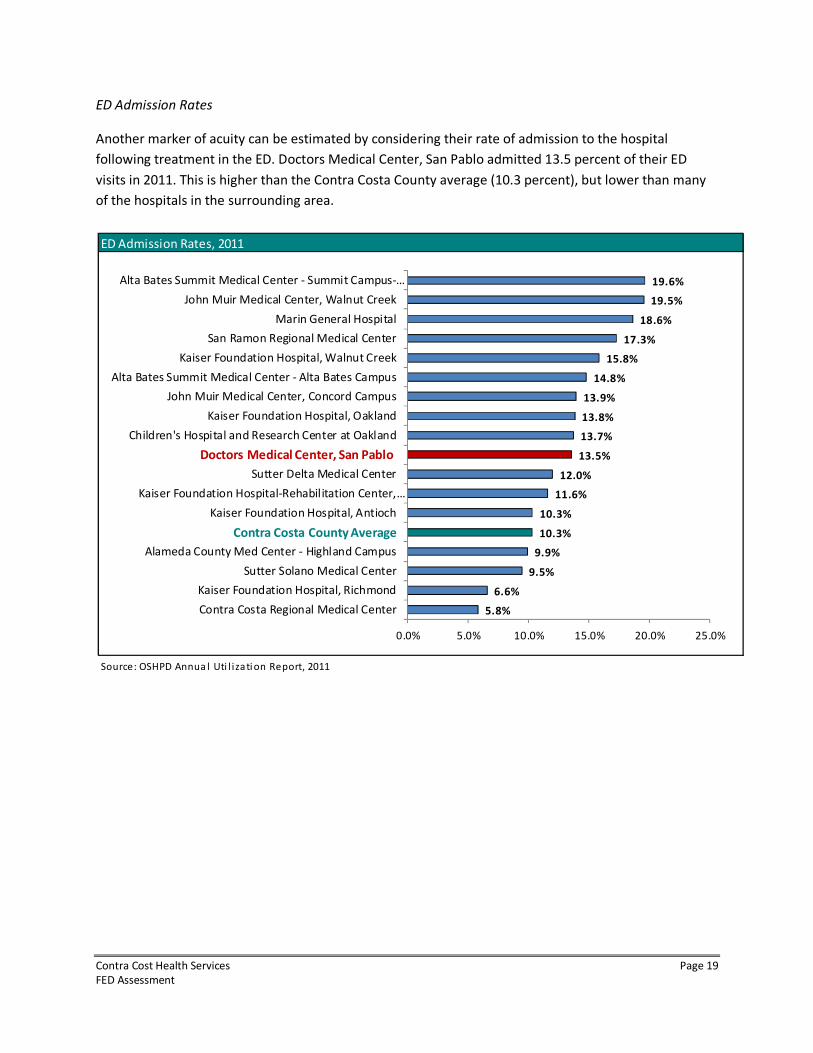
ED Admission Rates
Another marker of acuity can be estimated by considering their rate of admission to the hospital
following treatment in the ED. Doctors Medical Center, San Pablo admitted 13.5 percent of their ED
visits in 2011. This is higher than the Contra Costa County average (10.3 percent), but lower than many
of the hospitals in the surrounding area.
ED Admission Rates, 2011
Source: OSHPD Annua l Uti l izati on Report, 2011
5.8%
6.6%
9.5%
9.9%
10.3%
10.3%
11.6%
12.0%
13.5%
13.7%
13.8%
13.9%
14.8%
15.8%
17.3%
18.6%
19.5%
19.6%
0.0% 5.0% 10.0% 15.0% 20.0% 25.0%
Contra Costa Regional Medical Center
Kaiser Foundation Hospital, Richmond
Sutter Solano Medical Center
Alameda County Med Center - Highland Campus
Kaiser Foundation Hospital, Antioch
Kaiser Foundation Hospital-Rehabilitation Center,…
Sutter Delta Medical Center
Children's Hospital and Research Center at Oakland
Kaiser Foundation Hospital, Oakland
John Muir Medical Center, Concord Campus
Alta Bates Summit Medical Center - Alta Bates Campus
Kaiser Foundation Hospital, Walnut Creek
San Ramon Regional Medical Center
Marin General Hospital
John Muir Medical Center, Walnut Creek
Alta Bates Summit Medical Center - Summit Campus-…
Doctors Medical Center, San Pablo
Contra Costa County Average
Contra Cost Health Services Page 20
FED Assessment
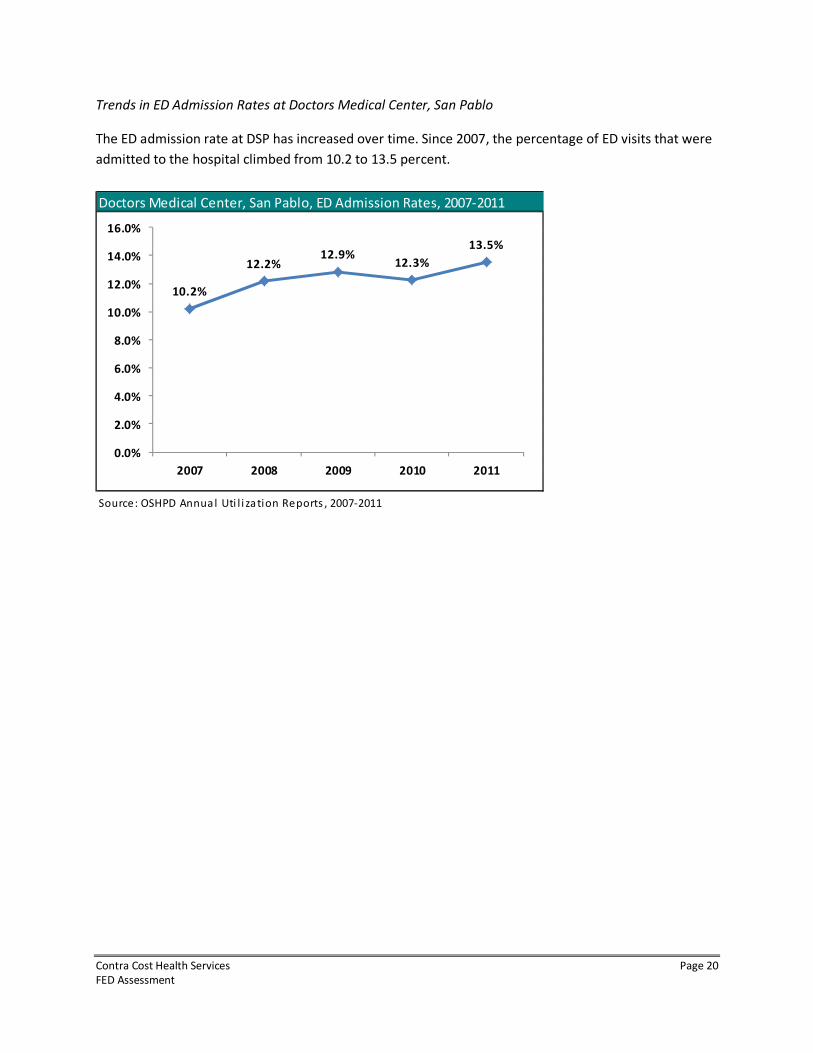
Trends in ED Admission Rates at Doctors Medical Center, San Pablo
The ED admission rate at DSP has increased over time. Since 2007, the percentage of ED visits that were
admitted to the hospital climbed from 10.2 to 13.5 percent.
Doctors Medical Center, San Pablo, ED Admission Rates, 2007-2011
Source: OSHPD Annual Uti l i zation Reports , 2007-2011
10.2%
12.2%12.9%
12.3%
13.5%
0.0%
2.0%
4.0%
6.0%
8.0%
10.0%
12.0%
14.0%
16.0%
2007 2008 2009 2010 2011
Contra Cost Health Services Page 21
FED Assessment
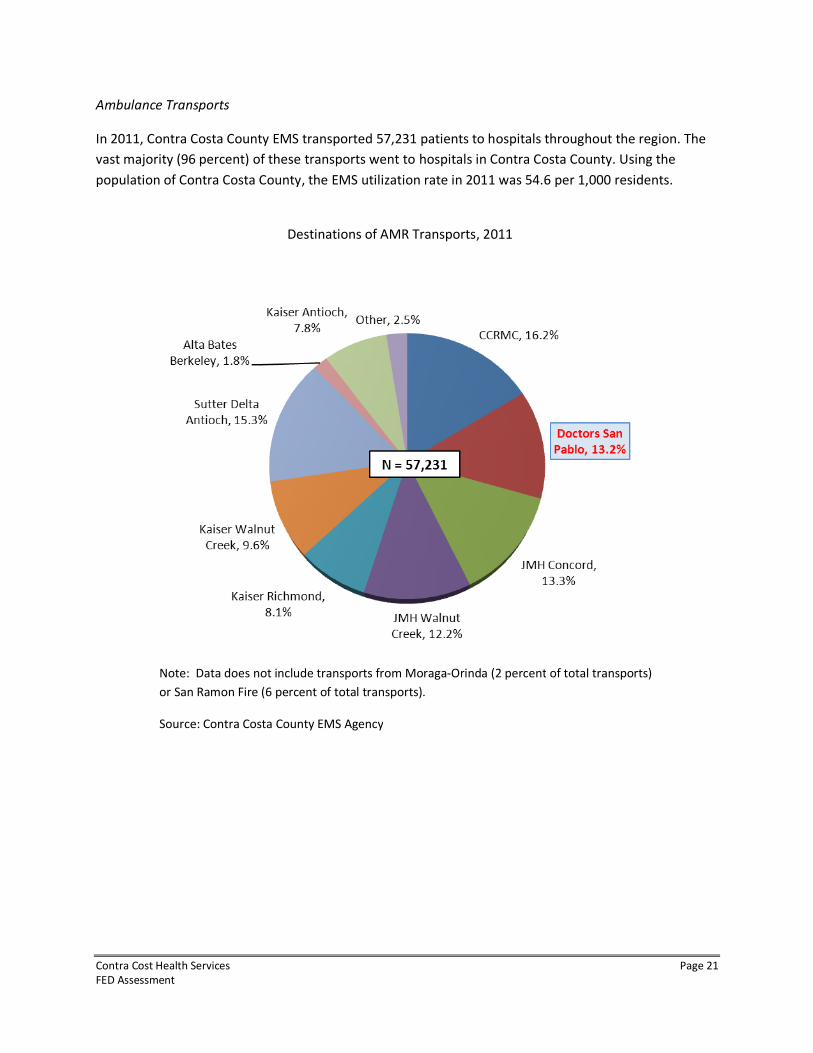
Ambulance Transports
In 2011, Contra Costa County EMS transported 57,231 patients to hospitals throughout the region. The
vast majority (96 percent) of these transports went to hospitals in Contra Costa County. Using the
population of Contra Costa County, the EMS utilization rate in 2011 was 54.6 per 1,000 residents.
Destinations of AMR Transports, 2011
Note: Data does not include transports from Moraga-Orinda (2 percent of total transports)
or San Ramon Fire (6 percent of total transports).
Source: Contra Costa County EMS Agency
Contra Cost Health Services Page 22
FED Assessment
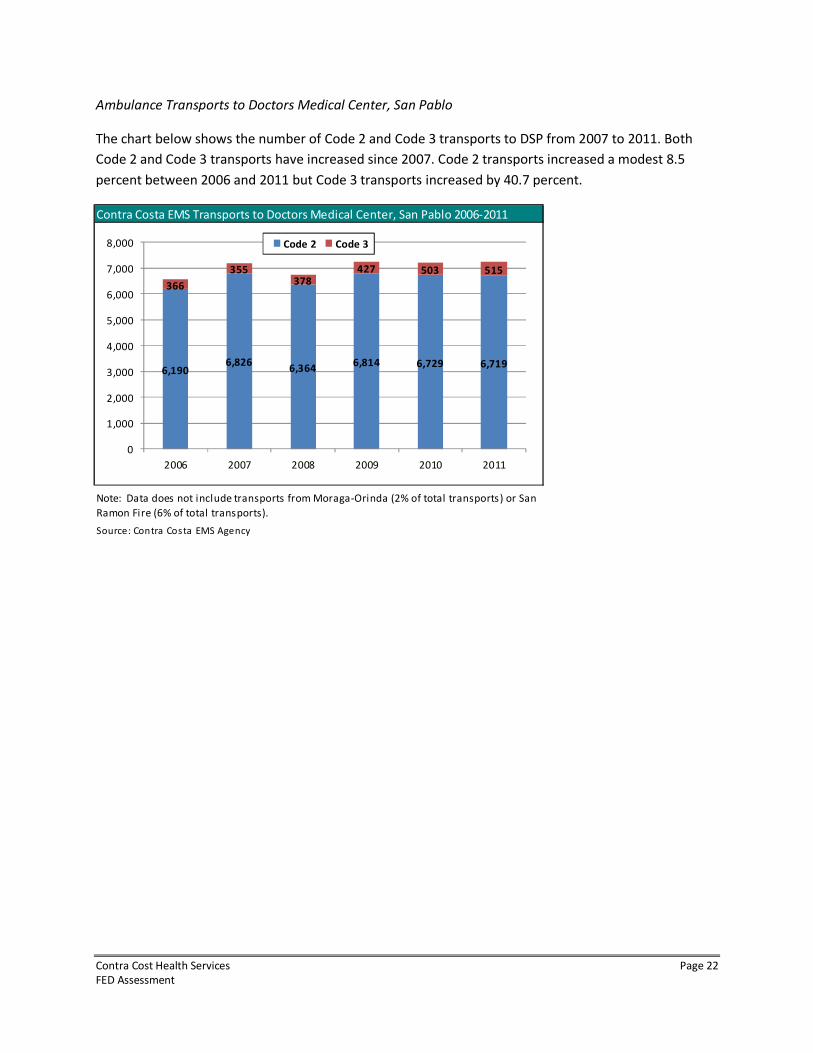
Ambulance Transports to Doctors Medical Center, San Pablo
The chart below shows the number of Code 2 and Code 3 transports to DSP from 2007 to 2011. Both
Code 2 and Code 3 transports have increased since 2007. Code 2 transports increased a modest 8.5
percent between 2006 and 2011 but Code 3 transports increased by 40.7 percent.
Contra Costa EMS Transports to Doctors Medical Center, San Pablo 2006-2011
Source: Contra Costa EMS Agency
Note: Data does not include transports from Moraga-Orinda (2% of total transports) or San
Ramon Fire (6% of total transports).
366
355378
427 503 515
6,1906,826
6,3646,814 6,729 6,719
0
1,000
2,000
3,000
4,000
5,000
6,000
7,000
8,000
2006 2007 2008 2009 2010 2011
Code 2 Code 3
Contra Cost Health Services Page 23
FED Assessment
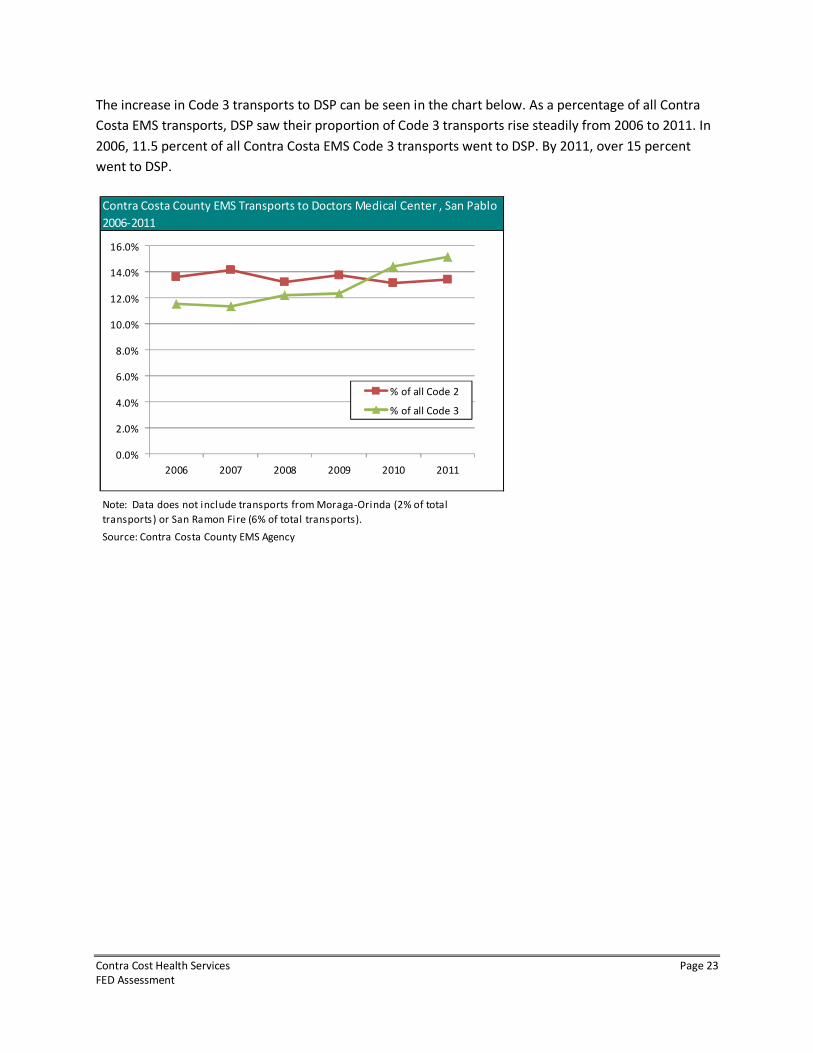
The increase in Code 3 transports to DSP can be seen in the chart below. As a percentage of all Contra
Costa EMS transports, DSP saw their proportion of Code 3 transports rise steadily from 2006 to 2011. In
2006, 11.5 percent of all Contra Costa EMS Code 3 transports went to DSP. By 2011, over 15 percent
went to DSP.
Source: Contra Costa County EMS Agency
Contra Costa County EMS Transports to Doctors Medical Center , San Pablo
2006-2011
Note: Data does not include transports from Moraga-Orinda (2% of total
transports) or San Ramon Fire (6% of total transports).
0.0%
2.0%
4.0%
6.0%
8.0%
10.0%
12.0%
14.0%
16.0%
2006 2007 2008 2009 2010 2011
% of all Code 2
% of all Code 3
Contra Cost Health Services Page 24
FED Assessment
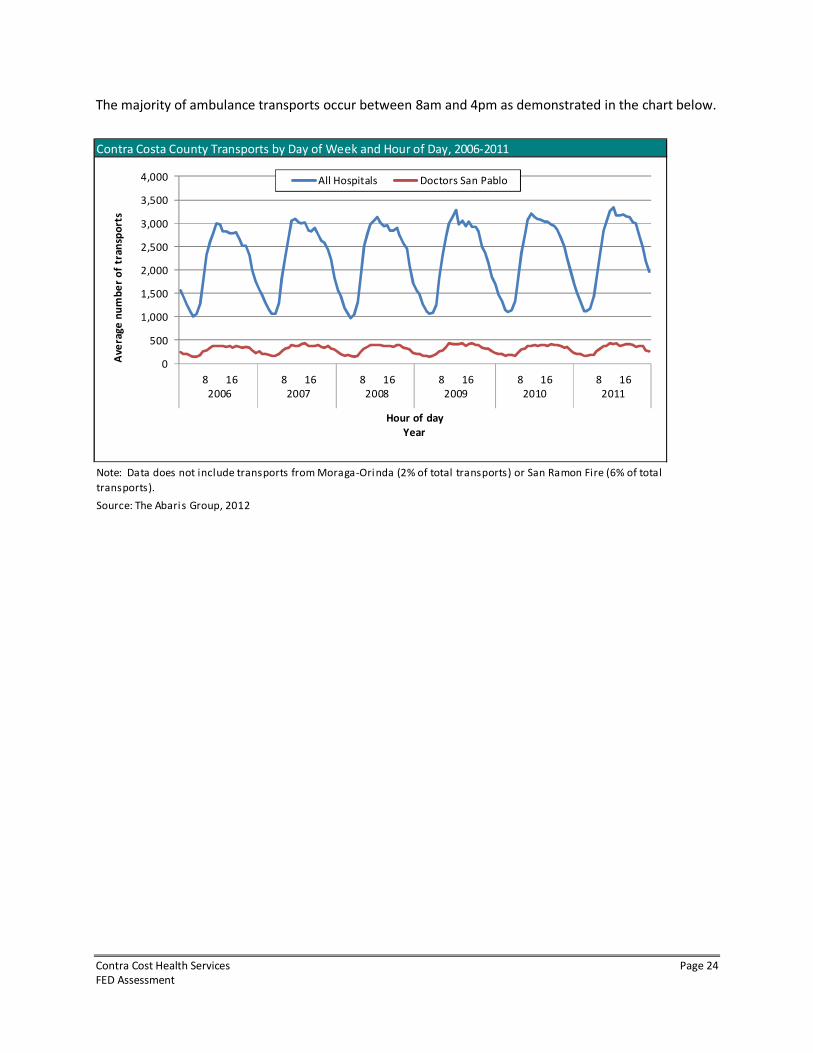
The majority of ambulance transports occur between 8am and 4pm as demonstrated in the chart below.
Source: The Abaris Group, 2012
Contra Costa County Transports by Day of Week and Hour of Day, 2006-2011
Note: Data does not include transports from Moraga-Orinda (2% of total transports) or San Ramon Fire (6% of total
transports).
0
500
1,000
1,500
2,000
2,500
3,000
3,500
4,000
8
2006
16 8
2007
16 8
2008
16 8
2009
16 8
2010
16 8
2011
16
Ave
rag
e n
um
be
r o
f tr
an
spo
rts
Hour of day
Year
All Hospitals Doctors San Pablo
Contra Cost Health Services Page 25
FED Assessment
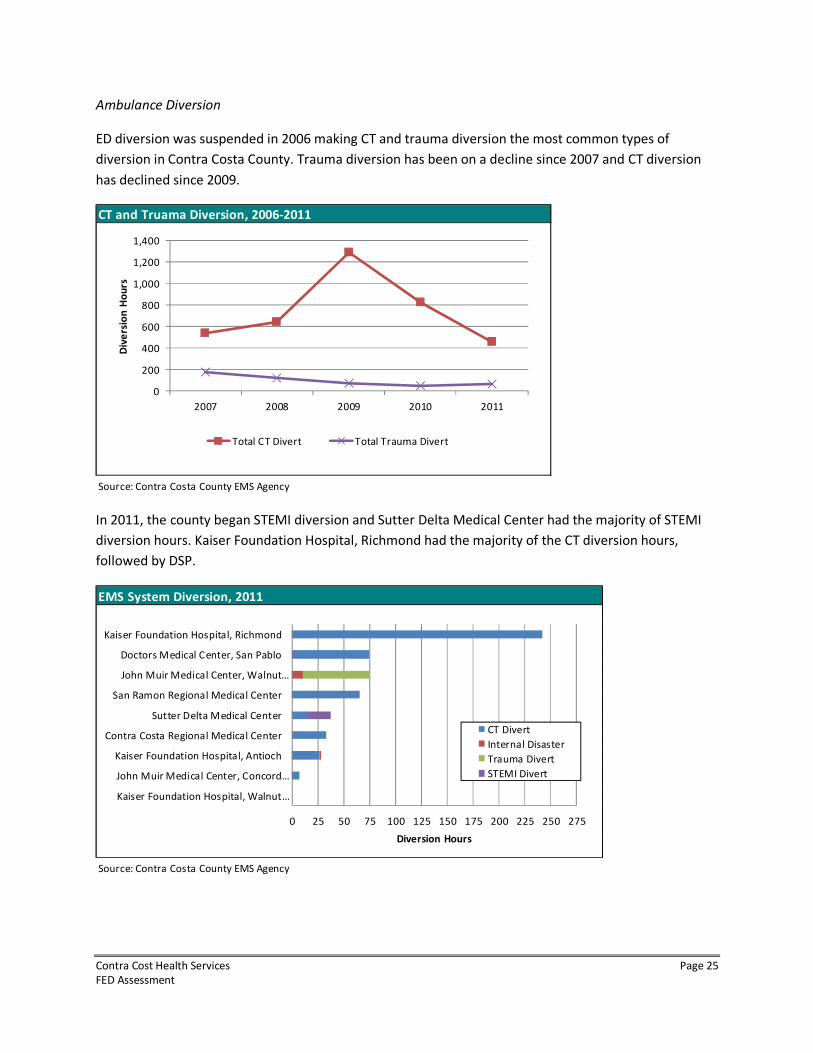
Ambulance Diversion
ED diversion was suspended in 2006 making CT and trauma diversion the most common types of
diversion in Contra Costa County. Trauma diversion has been on a decline since 2007 and CT diversion
has declined since 2009.
In 2011, the county began STEMI diversion and Sutter Delta Medical Center had the majority of STEMI
diversion hours. Kaiser Foundation Hospital, Richmond had the majority of the CT diversion hours,
followed by DSP.
CT and Truama Diversion, 2006-2011
Source: Contra Costa County EMS Agency
0
200
400
600
800
1,000
1,200
1,400
2007 2008 2009 2010 2011
Div
ers
ion
Ho
urs
Total CT Divert Total Trauma Divert
EMS System Diversion, 2011
Source: Contra Costa County EMS Agency
0 25 50 75 100 125 150 175 200 225 250 275
Kaiser Foundation Hospital, Walnut…
John Muir Medical Center, Concord…
Kaiser Foundation Hospital, Antioch
Contra Costa Regional Medical Center
Sutter Delta Medical Center
San Ramon Regional Medical Center
John Muir Medical Center, Walnut…
Doctors Medical Center, San Pablo
Kaiser Foundation Hospital, Richmond
Diversion Hours
CT Divert
Internal Disaster
Trauma Divert
STEMI Divert
Contra Cost Health Services Page 26
FED Assessment
Analysis of Doctors Medical Center, San Pablo
The 2011 dataset for Doctors Medical Center, San Pablo (DMC) was obtained from Contra Costa County
Health Services and contains 40,664 emergency department records, which is slightly higher than the
number DMC reported to OSHPD (39,706). The dataset from DMC contains additional variables not
available through the OSHPD data such as time of arrival and mode of arrival (e.g. walk-in, ambulance).
From this additional data, a more detailed analysis can be performed than what is available through
OSHPD.
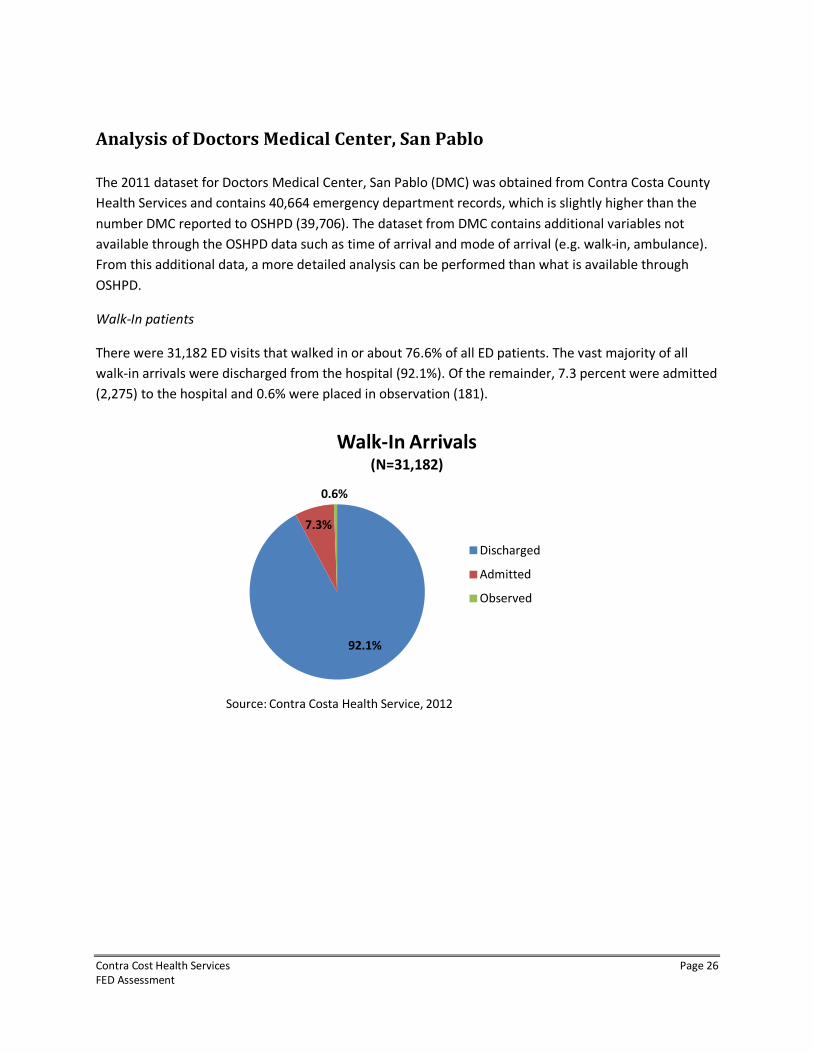
Walk-In patients
There were 31,182 ED visits that walked in or about 76.6% of all ED patients. The vast majority of all
walk-in arrivals were discharged from the hospital (92.1%). Of the remainder, 7.3 percent were admitted
(2,275) to the hospital and 0.6% were placed in observation (181).
92.1%
7.3%
0.6%
Walk-In Arrivals(N=31,182)
Discharged
Admitted
Observed
Source: Contra Costa Health Service, 2012
Contra Cost Health Services Page 27
FED Assessment
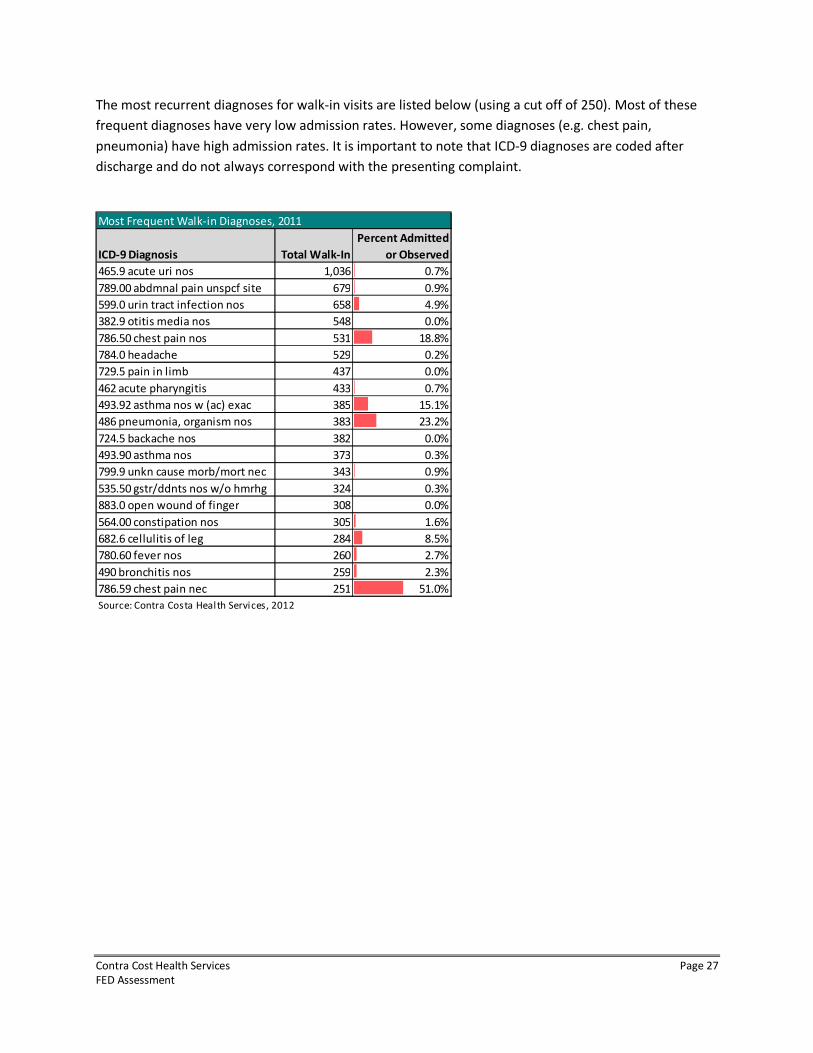
The most recurrent diagnoses for walk-in visits are listed below (using a cut off of 250). Most of these
frequent diagnoses have very low admission rates. However, some diagnoses (e.g. chest pain,
pneumonia) have high admission rates. It is important to note that ICD-9 diagnoses are coded after
discharge and do not always correspond with the presenting complaint.
ICD-9 Diagnosis Total Walk-In
Percent Admitted
or Observed
465.9 acute uri nos 1,036 0.7%
789.00 abdmnal pain unspcf site 679 0.9%
599.0 urin tract infection nos 658 4.9%
382.9 otitis media nos 548 0.0%
786.50 chest pain nos 531 18.8%
784.0 headache 529 0.2%
729.5 pain in limb 437 0.0%
462 acute pharyngitis 433 0.7%
493.92 asthma nos w (ac) exac 385 15.1%
486 pneumonia, organism nos 383 23.2%
724.5 backache nos 382 0.0%
493.90 asthma nos 373 0.3%
799.9 unkn cause morb/mort nec 343 0.9%
535.50 gstr/ddnts nos w/o hmrhg 324 0.3%
883.0 open wound of finger 308 0.0%
564.00 constipation nos 305 1.6%
682.6 cellulitis of leg 284 8.5%
780.60 fever nos 260 2.7%
490 bronchitis nos 259 2.3%
786.59 chest pain nec 251 51.0%
Source: Contra Costa Health Services, 2012
Most Frequent Walk-in Diagnoses, 2011
Contra Cost Health Services Page 28
FED Assessment
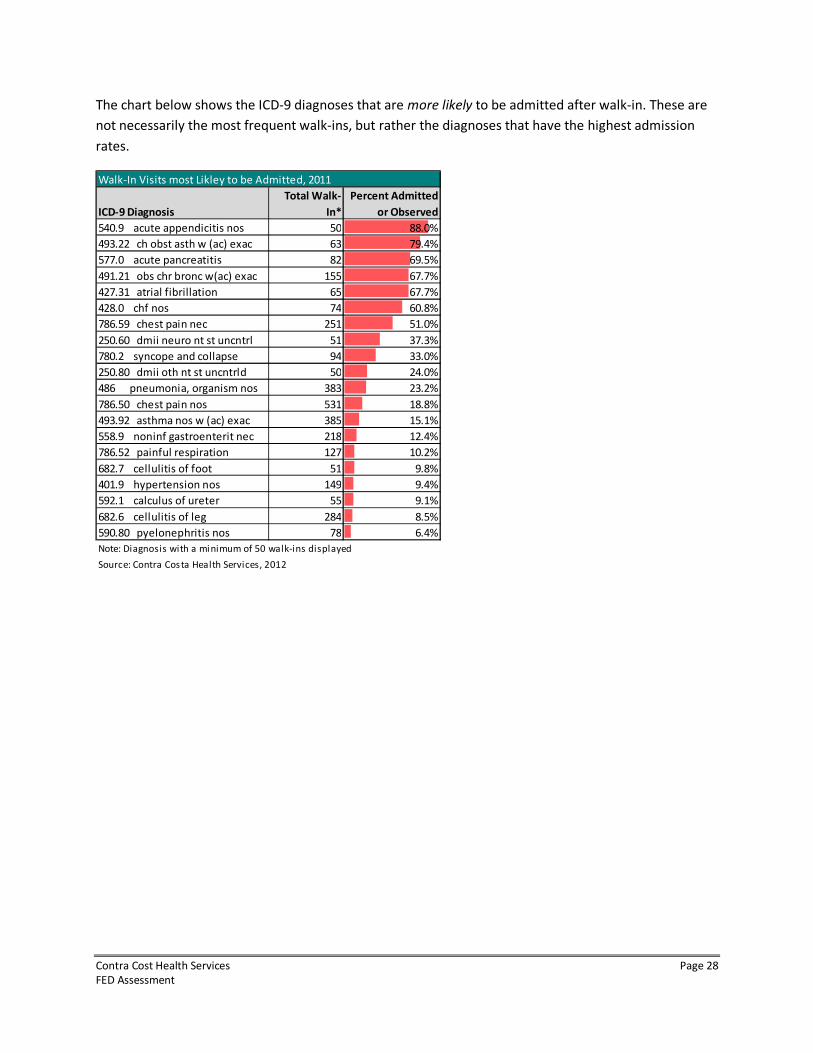
The chart below shows the ICD-9 diagnoses that are more likely to be admitted after walk-in. These are
not necessarily the most frequent walk-ins, but rather the diagnoses that have the highest admission
rates.
Walk-In Visits most Likley to be Admitted, 2011
ICD-9 Diagnosis
Total Walk-
In*
Percent Admitted
or Observed
540.9 acute appendicitis nos 50 88.0%
493.22 ch obst asth w (ac) exac 63 79.4%
577.0 acute pancreatitis 82 69.5%
491.21 obs chr bronc w(ac) exac 155 67.7%
427.31 atrial fibrillation 65 67.7%
428.0 chf nos 74 60.8%
786.59 chest pain nec 251 51.0%
250.60 dmii neuro nt st uncntrl 51 37.3%
780.2 syncope and collapse 94 33.0%
250.80 dmii oth nt st uncntrld 50 24.0%
486 pneumonia, organism nos 383 23.2%
786.50 chest pain nos 531 18.8%
493.92 asthma nos w (ac) exac 385 15.1%
558.9 noninf gastroenterit nec 218 12.4%
786.52 painful respiration 127 10.2%
682.7 cellulitis of foot 51 9.8%
401.9 hypertension nos 149 9.4%
592.1 calculus of ureter 55 9.1%
682.6 cellulitis of leg 284 8.5%
590.80 pyelonephritis nos 78 6.4%
Note: Diagnosis with a minimum of 50 walk-ins displayed
Source: Contra Costa Health Services, 2012
Contra Cost Health Services Page 29
FED Assessment
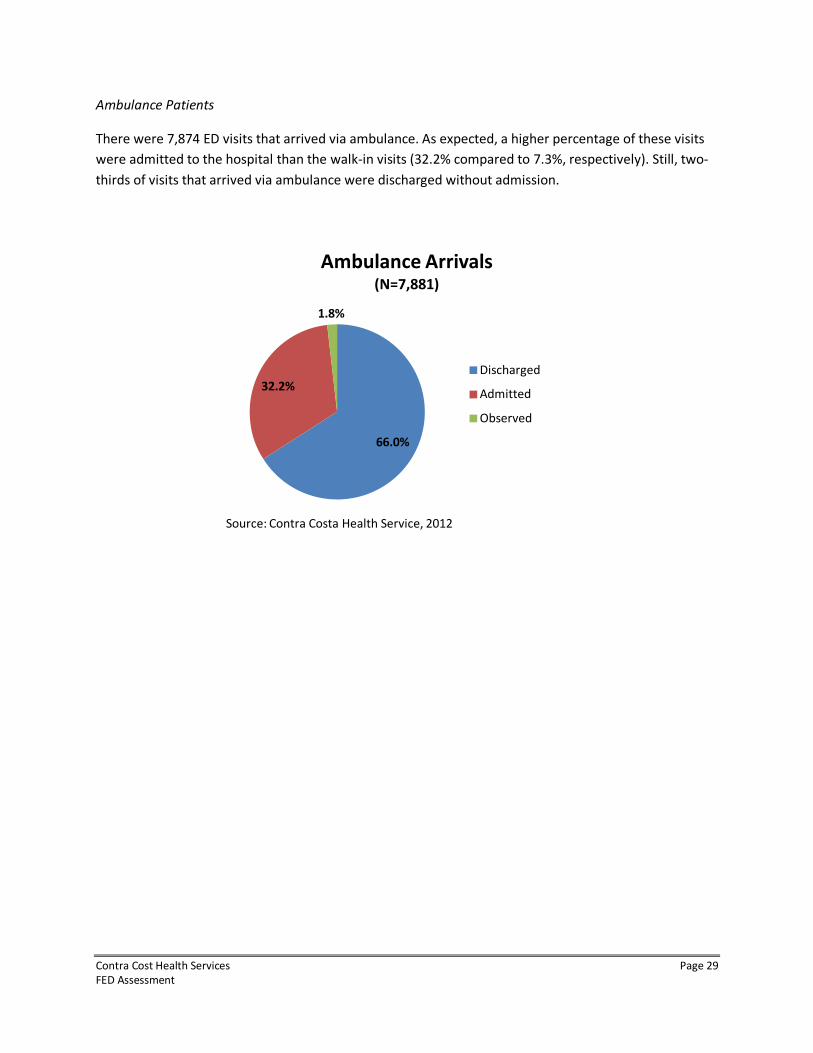
Ambulance Patients
There were 7,874 ED visits that arrived via ambulance. As expected, a higher percentage of these visits
were admitted to the hospital than the walk-in visits (32.2% compared to 7.3%, respectively). Still, two-
thirds of visits that arrived via ambulance were discharged without admission.
66.0%
32.2%
1.8%
Ambulance Arrivals(N=7,881)
Discharged
Admitted
Observed
Source: Contra Costa Health Service, 2012
Contra Cost Health Services Page 30
FED Assessment
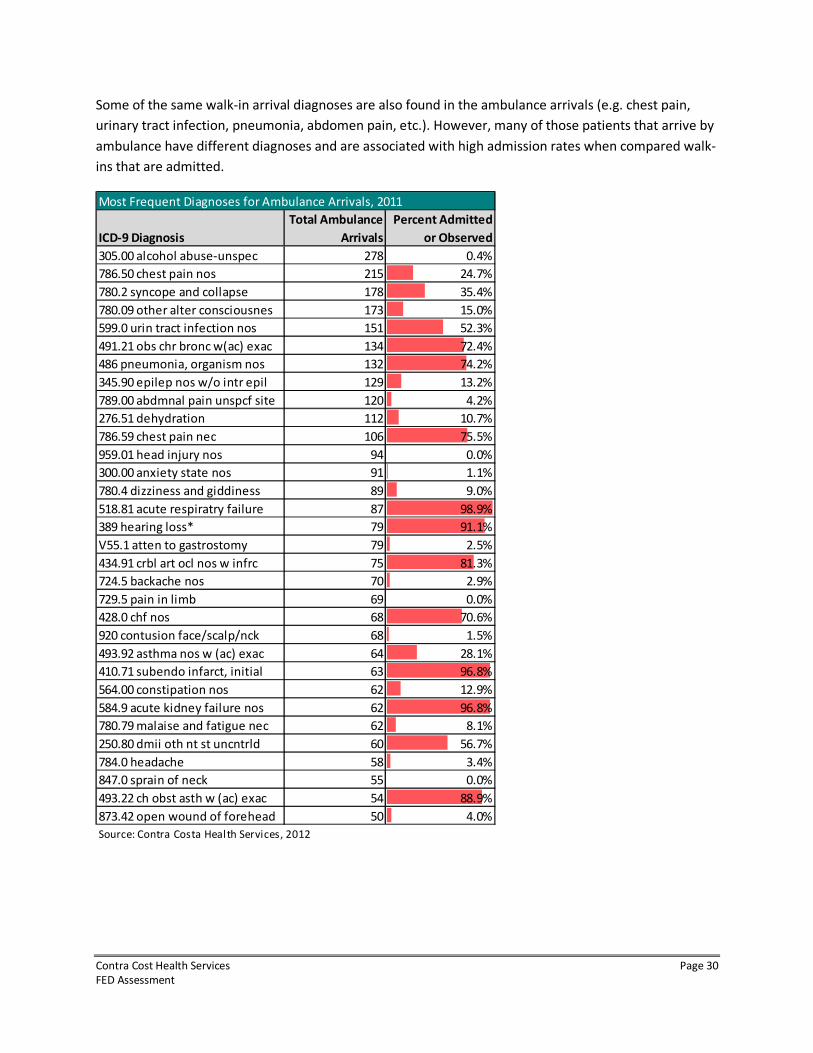
Some of the same walk-in arrival diagnoses are also found in the ambulance arrivals (e.g. chest pain,
urinary tract infection, pneumonia, abdomen pain, etc.). However, many of those patients that arrive by
ambulance have different diagnoses and are associated with high admission rates when compared walk-
ins that are admitted.
ICD-9 Diagnosis
Total Ambulance
Arrivals
Percent Admitted
or Observed
305.00 alcohol abuse-unspec 278 0.4%
786.50 chest pain nos 215 24.7%
780.2 syncope and collapse 178 35.4%
780.09 other alter consciousnes 173 15.0%
599.0 urin tract infection nos 151 52.3%
491.21 obs chr bronc w(ac) exac 134 72.4%
486 pneumonia, organism nos 132 74.2%
345.90 epilep nos w/o intr epil 129 13.2%
789.00 abdmnal pain unspcf site 120 4.2%
276.51 dehydration 112 10.7%
786.59 chest pain nec 106 75.5%
959.01 head injury nos 94 0.0%
300.00 anxiety state nos 91 1.1%
780.4 dizziness and giddiness 89 9.0%
518.81 acute respiratry failure 87 98.9%
389 hearing loss* 79 91.1%
V55.1 atten to gastrostomy 79 2.5%
434.91 crbl art ocl nos w infrc 75 81.3%
724.5 backache nos 70 2.9%
729.5 pain in limb 69 0.0%
428.0 chf nos 68 70.6%
920 contusion face/scalp/nck 68 1.5%
493.92 asthma nos w (ac) exac 64 28.1%
410.71 subendo infarct, initial 63 96.8%
564.00 constipation nos 62 12.9%
584.9 acute kidney failure nos 62 96.8%
780.79 malaise and fatigue nec 62 8.1%
250.80 dmii oth nt st uncntrld 60 56.7%
784.0 headache 58 3.4%
847.0 sprain of neck 55 0.0%
493.22 ch obst asth w (ac) exac 54 88.9%
873.42 open wound of forehead 50 4.0%
Source: Contra Costa Health Services, 2012
Most Frequent Diagnoses for Ambulance Arrivals, 2011
Contra Cost Health Services Page 31
FED Assessment
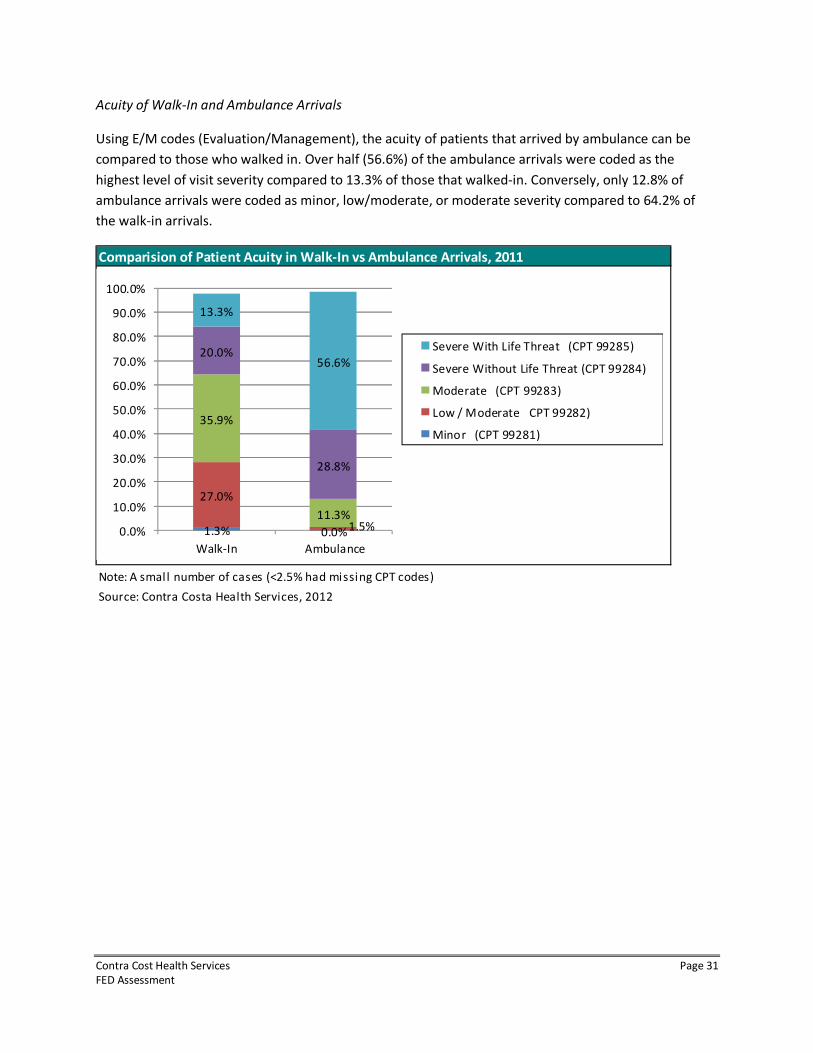
Acuity of Walk-In and Ambulance Arrivals
Using E/M codes (Evaluation/Management), the acuity of patients that arrived by ambulance can be
compared to those who walked in. Over half (56.6%) of the ambulance arrivals were coded as the
highest level of visit severity compared to 13.3% of those that walked-in. Conversely, only 12.8% of
ambulance arrivals were coded as minor, low/moderate, or moderate severity compared to 64.2% of
the walk-in arrivals.
Comparision of Patient Acuity in Walk-In vs Ambulance Arrivals, 2011
Note: A small number of cases (<2.5% had missing CPT codes)
Source: Contra Costa Health Services, 2012
1.3% 0.0%
27.0%
1.5%
35.9%
11.3%
20.0%
28.8%
13.3%
56.6%
0.0%
10.0%
20.0%
30.0%
40.0%
50.0%
60.0%
70.0%
80.0%
90.0%
100.0%
Walk-In Ambulance
Severe With Life Threat (CPT 99285)
Severe Without Life Threat (CPT 99284)
Moderate (CPT 99283)
Low / Moderate CPT 99282)
Minor (CPT 99281)
Contra Cost Health Services Page 32
FED Assessment
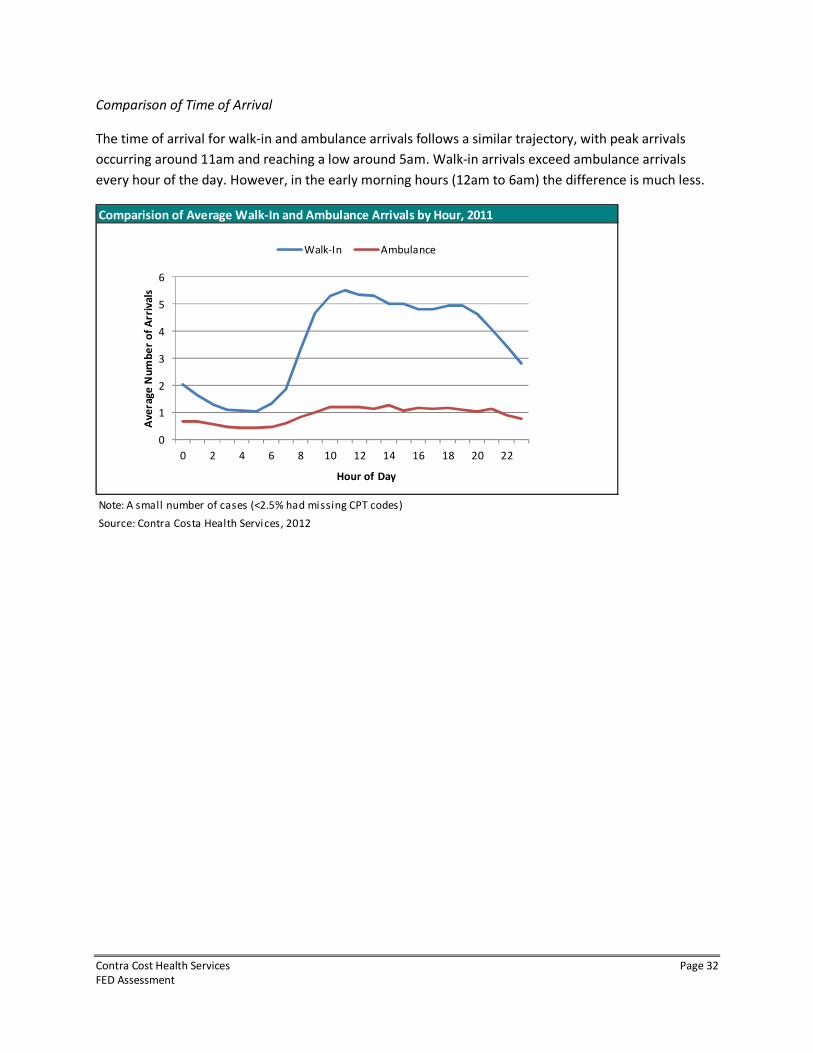
Comparison of Time of Arrival
The time of arrival for walk-in and ambulance arrivals follows a similar trajectory, with peak arrivals
occurring around 11am and reaching a low around 5am. Walk-in arrivals exceed ambulance arrivals
every hour of the day. However, in the early morning hours (12am to 6am) the difference is much less.
Comparision of Average Walk-In and Ambulance Arrivals by Hour, 2011
Note: A small number of cases (<2.5% had missing CPT codes)
Source: Contra Costa Health Services, 2012
0
1
2
3
4
5
6
0 2 4 6 8 10 12 14 16 18 20 22
Av
era
ge
Nu
mb
er
of
Arr
iva
ls
Hour of Day
Walk-In Ambulance

Contra Cost Health Services Page 33
FED Assessment
Attachment 1 – Department of Public Health Email
from: Eisenlauer, Erica (CDPH-EXE-LGA) [email protected]
cc:
"Wagoner, Monica (CDPH-LGA)" <[email protected]>,
"Dunham, Cassie (CDPH-CHCQ-L&C-HQ)" <[email protected]>,
"Driscoll, Chelsea (CDPH-LNC-HQ)" <[email protected]>
date: Thu, Sep 20, 2012 at 2:18 PM
subject: Emergency Department Law
Dear Ms. Boyle:
For greater insight of the definition of “emergency” provided in Health and Safety Code (HSC) Section
1798.175, please contact the Emergency Medical Services Authority as they are the state entity that
provides oversight for this portion of the Health and Safety Code.
Regarding your client’s interest in forming a Freestanding Emergency Department (FED) - HSC Section
1255 specifies that only a licensed hospital can apply for a special permit to house an “emergency
center.” Title 22 of the California Code of Regulations (CCR) defines the three levels of emergency care
services for which a hospital may obtain a permit and specify that they are located in the hospital. CCR
Sections 70413 and 70453 define the general requirements for Basic and Comprehensive Emergency
Medical Service permits, stating that “The emergency medical service shall be so located in the hospital
as to have ready access to all necessary services.” CCR 70649 defines the requirements for Standby
Emergency Medical Service, Physician on Call and specifies that the “provision of emergency medical
care” must be in “a specifically designated area of the hospital.”
HSC Section 1250.8 defines the distance that health facilities operating under a consolidated license may
be located apart from one another. This section is not applicable for your purposes because emergency
departments are not separately licensed health facilities, they are services provided under a hospital’s
license.
“Program flexibility” allows licensed health facilities to apply for and receive permission from the
California Department of Public Health for new models of providing care, if they are able to supply
sufficient evidence that patient safety and quality of care will not be compromised by the proposed
alternative, and provided implementation only requires an exception to requirements defined in
California regulation. “Program flexibility” cannot be granted when it requires exemption to California
law or federal regulation or law (unless expressly allowed in the statute). Nothing in California law,
federal regulations or law explicitly requires an emergency department (ED) to be located on the main
hospital campus. However, Title 42 of the Code of Federal Regulations, Section 482.55 does require that
an ED must meet the emergency needs of patients in accordance with acceptable standards of practice
and the services must be integrated with other departments of the hospital.
Further, before a request that an ED be located somewhere other than “in the hospital” could be
approved, all of the other requirements of the ED that ensure patient safety and quality of care would
Contra Cost Health Services Page 34
FED Assessment
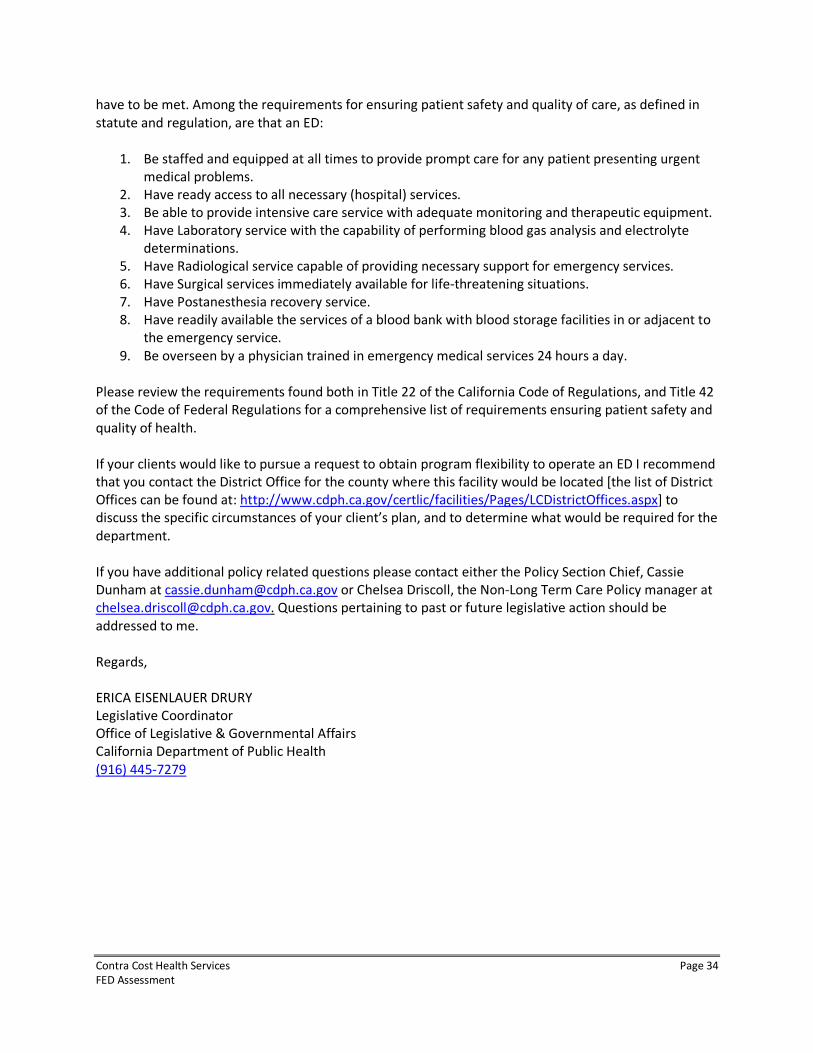
have to be met. Among the requirements for ensuring patient safety and quality of care, as defined in
statute and regulation, are that an ED:
1. Be staffed and equipped at all times to provide prompt care for any patient presenting urgent
medical problems.
2. Have ready access to all necessary (hospital) services.
3. Be able to provide intensive care service with adequate monitoring and therapeutic equipment.
4. Have Laboratory service with the capability of performing blood gas analysis and electrolyte
determinations.
5. Have Radiological service capable of providing necessary support for emergency services.
6. Have Surgical services immediately available for life-threatening situations.
7. Have Postanesthesia recovery service.
8. Have readily available the services of a blood bank with blood storage facilities in or adjacent to
the emergency service.
9. Be overseen by a physician trained in emergency medical services 24 hours a day.
Please review the requirements found both in Title 22 of the California Code of Regulations, and Title 42
of the Code of Federal Regulations for a comprehensive list of requirements ensuring patient safety and
quality of health.
If your clients would like to pursue a request to obtain program flexibility to operate an ED I recommend
that you contact the District Office for the county where this facility would be located [the list of District
Offices can be found at: http://www.cdph.ca.gov/certlic/facilities/Pages/LCDistrictOffices.aspx] to
discuss the specific circumstances of your client’s plan, and to determine what would be required for the
department.
If you have additional policy related questions please contact either the Policy Section Chief, Cassie
Dunham at [email protected] or Chelsea Driscoll, the Non-Long Term Care Policy manager at
[email protected]. Questions pertaining to past or future legislative action should be
addressed to me.
Regards,
ERICA EISENLAUER DRURY
Legislative Coordinator
Office of Legislative & Governmental Affairs
California Department of Public Health
(916) 445-7279
Contra Cost Health Services Page 35
FED Assessment
Attachment 2 – Case Study Summaries
Swedish Medical Center, Mill Creek Campus
Treatment stations = 18
2011 volume = 22,000
Hours = 24/7
Everett, WA
Swedish currently has two FEDs in their system. One of these has an urgent care center (UCC) in the
same building as the FED (Redmond, WA). A third FED has been converted into a hospital (Issaquah,
WA). It may have plans to make the Redmond campus a hospital, but it would be due to a hospital
closure. There are no plans to make Mill Creek a hospital. Swedish’s goal is to expand services without
building new hospitals. It also wants to provide emergent care in areas of need and the Mill Creek
campus is located in an underserved area with a poor payer mix. If a patient wants to be admitted to a
non-Swedish hospital the patient’s preference is honored. The FED is not viewed as a feed for Swedish’s
hospitals.
The average patient turnaround time is 1 hour and 27 minutes. Patients are brought back to a treatment
room immediately.
The Mill Creek FED does not provide any STEMI or stroke interventional therapies on site. If a patient
needs catheterization they are transported by a 9-1-1 ambulance provider to nearest hospital catheter
facility. The FED is staffed with physicians (Board certified), registered nurses, physician assistants, nurse
practitioners, technicians and a secretary. It is very similar to managing a hospital ED. The FED to
hospital admission rate is 4-9 percent.
Currently, EMS is allowed to bring BLS patients to the FED and ALS with failed airways (only for
stabilization, EMS must stay with the patient and transport once stabilized). EMS did push back on
transporting to the FED and continues to push back, but they are working to improve these conceptual
concerns.
When transport is needed, Mill Creek uses critical care transport (CCT). The only time 9-1-1 is called is
for a STEMI patient, otherwise, they use CCT. On occasion a trauma patient will arrive and they are
stabilized and transferred. Transferring a patient to a hospital bed is usually easy with few delays.
However, finding a bed for a mental health patient can be difficult due to lack of beds.
With respect to ambulance diversion, the culture at the FED is to not divert. However, if it is necessary,
the FED goes on diversion but gets becomes available to ambulance traffic as soon as possible. The FED
cannot accept combative patients because there is no back up to call to help. EMS believes they are
“cherry picking” because of this.
Mill Creek’s FED manager believes it is critical that the FED be staffed with persons who worked in an ED
previously. There is no option to call for back up in an FED from another department, thus the staff
needs to be self sufficient.
Contra Cost Health Services Page 36
FED Assessment
Henry Ford Health Center, Brownstown
Treatment stations = 20
2011 volume = 28,000
Hours = 24/7
Brownstown, MI
The Brownstown FED was built because Henry Ford Health Center wanted to increase their market
share. It is one department in a very large outpatient center. It was described as a “maxi outpatient
center.” The FED has its own operating room, but trauma patients are not treated there. The FED serves
as a feeder to the parent hospital. Michigan is a certificate of need (CON) state and the FED met the
CON criteria. Henry Ford has three other FEDs several of which they have operated for in excess of 20
years.
Patients are brought directly to the treatment bed, thus there is virtually no waiting in the waiting room.
Their turnaround time is on average two hours and they receive most of their patients from walk-in,
they get one to three EMS transports daily.
A major hurdle was getting recognized in the community and by EMS. EMS did not want to bring
patients and they had to work to educate EMS and the community on what an FED is. Marketing is a key
tool in overcoming the hurdle. However, the public still sees the FED as a UCC. There were no legislative
or political barriers outside of applying for the CON.
Approximately 30 percent of all patients could be treated at a UCC. One issue they have is with follow up
care for patients with no health insurance or if the patient is underinsured. They have established
partnerships with Federally Qualified Health Centers (FQHCs) to address this. The FED bills as a Type B
emergency department for Medicare patients.
When a STEMI or stroke patient presents they stabilize and transfer to their parent hospital or another
hospital. However, in inclement weather the FED does administer TPA and then transfers. They have a
door to transfer time of 30 minutes and door to EKG (electrocardiogram) is 10 minutes.
The Brownstown FED would like add more treatment stations than the original 20 that were built. They
are close to outgrowing their current space. They also employ a lean staffing model with only one ED
physician on per shift. The management is very similar to a traditional ED, but there is less staff turnover
because of the high employee engagement with the operation of the FED. The FED follows the same
policies and procedures that their parent hospital ED follows.
The FED contracts with a CCT provider and also has access to an air ambulance provider. EMS brings
priority one patients and they could treat a level II trauma. Brownstown never calls 9-1-1. Approximately
8 percent of their patients get transferred to a hospital. They are currently in the process of
implementing a 23-hour observation unit. (When a patient spends the night [this happens a few times a
month] they order food from the hospital and also have frozen meals in a freezer.) The only time they
have a delay in getting a patient transferred is when the hospitals are full. This is a very rare event
because they have so many hospitals in the area. However, mental health patients are the most difficult
to find a bed for. The only reason the FED diverts is because of a combative psychiatric patient, active
labor, and acute MI (myocardial infarction) on scene.
Contra Cost Health Services Page 37
FED Assessment
Shady Grove Adventist Emergency Center
Treatment stations = 21
2011 volume = 37,500
Hours = 24/7
Germantown, MD
Shady Grove Adventist has only one FED located in Germantown. The FED was established to meet
market demand in August 2006. It is in a dense population area with no emergent care (45-miles
between the two nearest hospitals) and it is an economically diverse population that ranges from upper
middle class to the poor. The biggest hurdle for the FED was the legislative piece. They operate under a
CMS exemption (there is one other FED in Maryland). In 2006, legislation was passed that effectively
enabled Shady Grove Adventist Hospital to establish the FED in Germantown. Process and protocols
regulate freestanding medical facilities and are administratively linked to the hospital.
In 2010 a law was passed that directs the state to set reimbursement rates for FEDs in Maryland to help
cover staffing and equipment costs. This law brings FEDs under the authority of the Health Services Cost
Review Commission, making them available for Medicare and Medicaid fee-for-services reimbursement.
The law requires FEDs to be “rate-regulated” by the state, which sets how Medicare and other insurers
reimburse for a specific treatment for hospital-based services. In addition, the legislation places a freeze
on any new FEDs until 2015, when a Certificate of Need (CON) process will be used for consideration of
new facilities of this kind.
The average turn-around-time ranges from 1 hour 40 minutes to 2 hours and 40 minutes. This mostly
fluctuates due to changes in staffing and volume. The FED does divert due to volume issues – when they
are inundated with walk-ins or EMS. In August 2012 they diverted for 20 hours.
The parent hospital has a both a STEMI and stroke program. The FED will begin the protocol needed and
then transfer. Thrombolytics are available at the FED.
With respect to transporting patients from the FED, the original plan used the county EMS provider.
However, EMS did not want to take patients to the FED because they would have to make a second trip
back to transport the patient to hospital. Over time, EMS slowed the number of patients transported to
the FED (2-3 per day). In August 2012, the FED contracted with a private CCT to transport its patients to
the hospital. As a result, the EMS traffic to the FED has increased to about 4-6 patients a day, and is
expected to continue growing. The only time the FED calls 9-1-1 is if it is a critical emergency and their
contracted provider cannot get there in time.
Less than 10 percent of the FED’s patients get transferred to the hospital. They also have preferential
treatment for inpatient beds above the ED onsite at the hospital. This is enables the patient to be
evaluated by the admitting physician more quickly. Also, the FED also has no dietary available, thus
boarding or observation is not an option.
One issue that was pointed out as critical to setting up an FED is to make sure the ancillary staff,
security, registration, tech support, maintenance, etc. are all in place. An FED is a unit of the hospital
that is off campus with no one to call on for support.
Contra Cost Health Services Page 38
FED Assessment
Attachment 3 – Case Study Interview Script/Questions
Hello, my name is ______________ and I am working with a governmental entity in California who is
interested in building an FED. I am conducting a brief survey of FEDs across the country and hoped that
you might be able to answer a few questions for me. To thank you for your time, I would like to give you
a copy of my findings once I’m finished. Is now a good time?
1. Can you give me a brief overview of your FED? Treatment rooms, census, proportion that could be
seen at UCC, TAT.
2. What were the top three reasons why you established an FED?
3. What were the major hurdles? What solutions did you use to overcome these hurdles?
4. If you could do it over again, would you make any changes?
5. What are your hours of operation?
6. Do you bill Medicare as Type B or Type A?
7. Do you have an agreement with a STEMI or stroke program? If not, what level of intervention is
appropriate for such entities?
8. How is your FED staffed? Is there high turnover? Is managing the FED like managing a traditional ED?
9. What are the arrangements you have with EMS? Were they cooperative? Did you get pushback?
10. Would you be willing to share your EMS protocols and processes?
11. How many patients get admitted to a hospital? Do you use critical care transport? Are there delays
in getting patients admitted to a hospital? What are the delays?
12. What affect, if any, does diversion have on your FED?
13. Is there anything I haven’t covered today you think I should know?
Contra Cost Health Services Page 39
FED Assessment
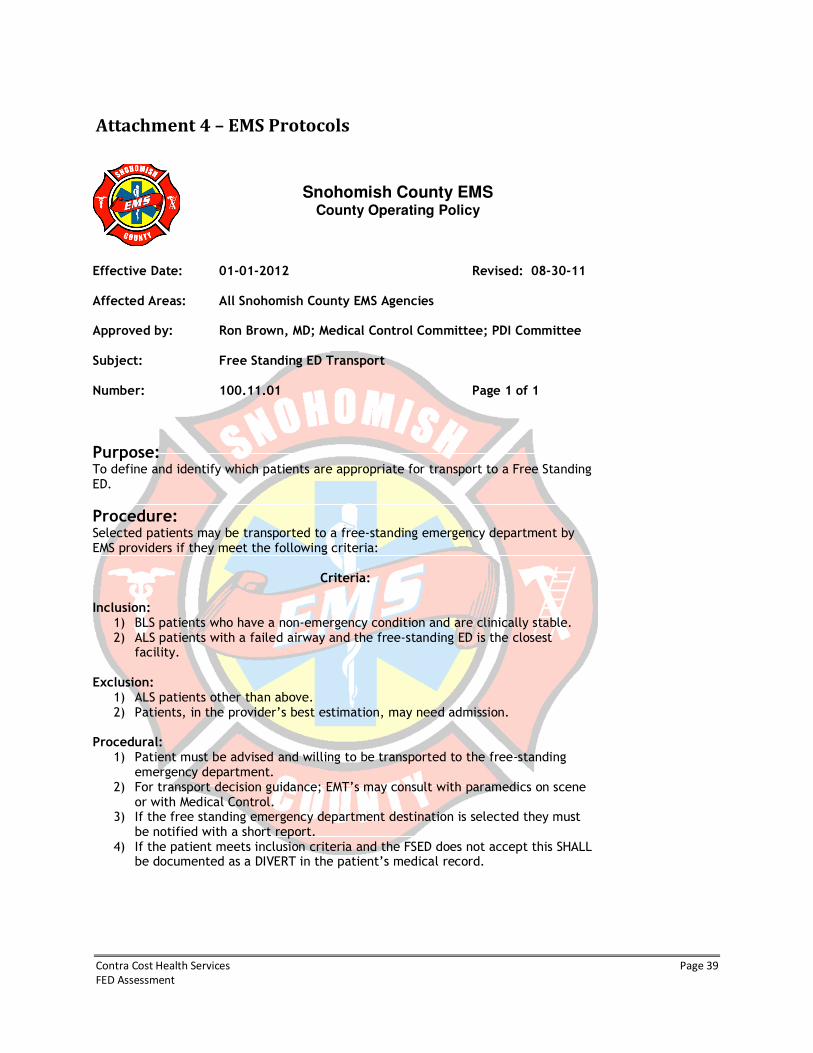
Snohomish County EMS
County Operating Policy
Effective Date: 01-01-2012 Revised: 08-30-11 Affected Areas: All Snohomish County EMS Agencies Approved by: Ron Brown, MD; Medical Control Committee; PDI Committee Subject: Free Standing ED Transport Number: 100.11.01 Page 1 of 1
Purpose: To define and identify which patients are appropriate for transport to a Free Standing ED.
Procedure: Selected patients may be transported to a free-standing emergency department by EMS providers if they meet the following criteria:
Criteria: Inclusion:
1) BLS patients who have a non-emergency condition and are clinically stable. 2) ALS patients with a failed airway and the free-standing ED is the closest
facility.
Exclusion: 1) ALS patients other than above. 2) Patients, in the provider’s best estimation, may need admission.
Procedural:
1) Patient must be advised and willing to be transported to the free-standing emergency department.
2) For transport decision guidance; EMT’s may consult with paramedics on scene or with Medical Control.
3) If the free standing emergency department destination is selected they must be notified with a short report.
4) If the patient meets inclusion criteria and the FSED does not accept this SHALL be documented as a DIVERT in the patient’s medical record.
Attachment 4 – EMS Protocols
Contra Cost Health Services Page 40
FED Assessment
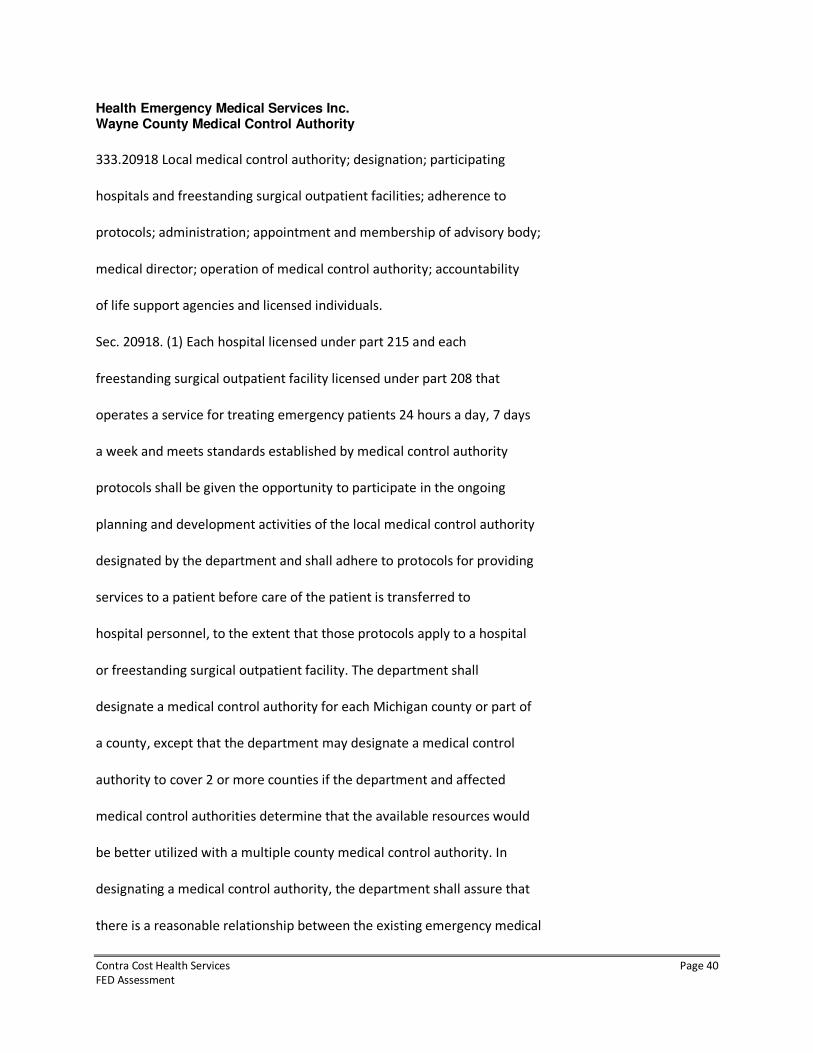
Health Emergency Medical Services Inc. Wayne County Medical Control Authority
333.20918 Local medical control authority; designation; participating
hospitals and freestanding surgical outpatient facilities; adherence to
protocols; administration; appointment and membership of advisory body;
medical director; operation of medical control authority; accountability
of life support agencies and licensed individuals.
Sec. 20918. (1) Each hospital licensed under part 215 and each
freestanding surgical outpatient facility licensed under part 208 that
operates a service for treating emergency patients 24 hours a day, 7 days
a week and meets standards established by medical control authority
protocols shall be given the opportunity to participate in the ongoing
planning and development activities of the local medical control authority
designated by the department and shall adhere to protocols for providing
services to a patient before care of the patient is transferred to
hospital personnel, to the extent that those protocols apply to a hospital
or freestanding surgical outpatient facility. The department shall
designate a medical control authority for each Michigan county or part of
a county, except that the department may designate a medical control
authority to cover 2 or more counties if the department and affected
medical control authorities determine that the available resources would
be better utilized with a multiple county medical control authority. In
designating a medical control authority, the department shall assure that
there is a reasonable relationship between the existing emergency medical
Contra Cost Health Services Page 41
FED Assessment
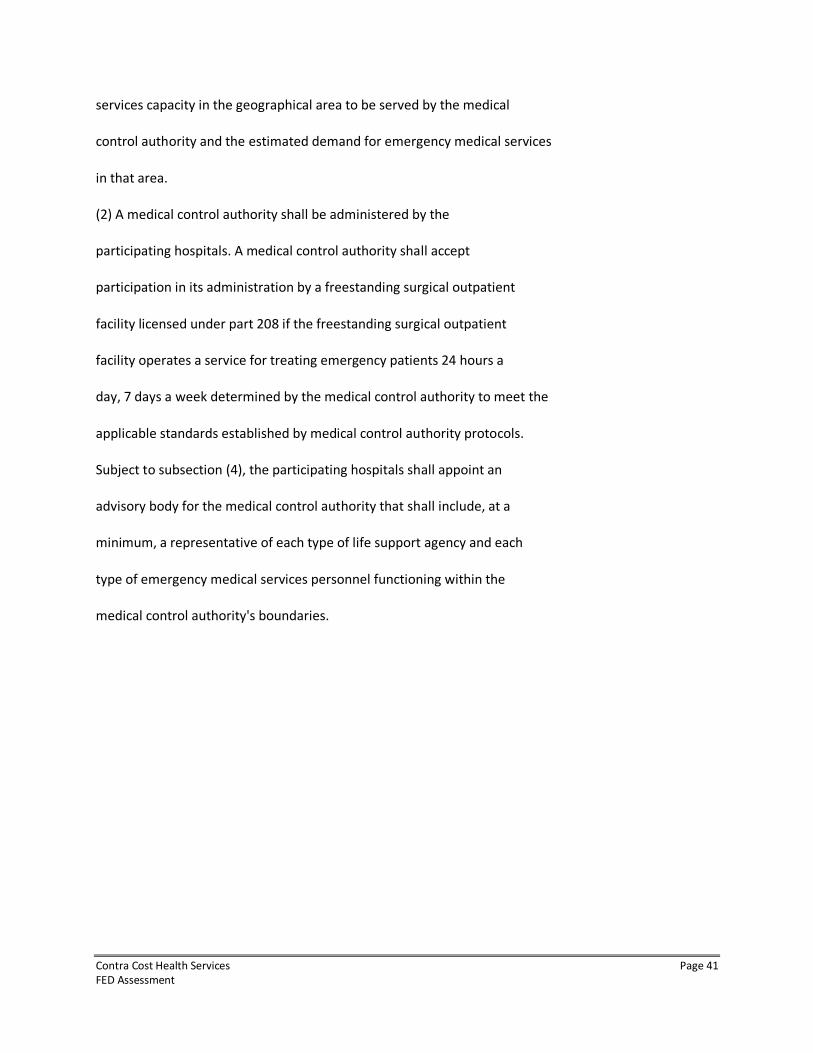
services capacity in the geographical area to be served by the medical
control authority and the estimated demand for emergency medical services
in that area.
(2) A medical control authority shall be administered by the
participating hospitals. A medical control authority shall accept
participation in its administration by a freestanding surgical outpatient
facility licensed under part 208 if the freestanding surgical outpatient
facility operates a service for treating emergency patients 24 hours a
day, 7 days a week determined by the medical control authority to meet the
applicable standards established by medical control authority protocols.
Subject to subsection (4), the participating hospitals shall appoint an
advisory body for the medical control authority that shall include, at a
minimum, a representative of each type of life support agency and each
type of emergency medical services personnel functioning within the
medical control authority's boundaries.
Contra Cost Health Services Page 42
FED Assessment
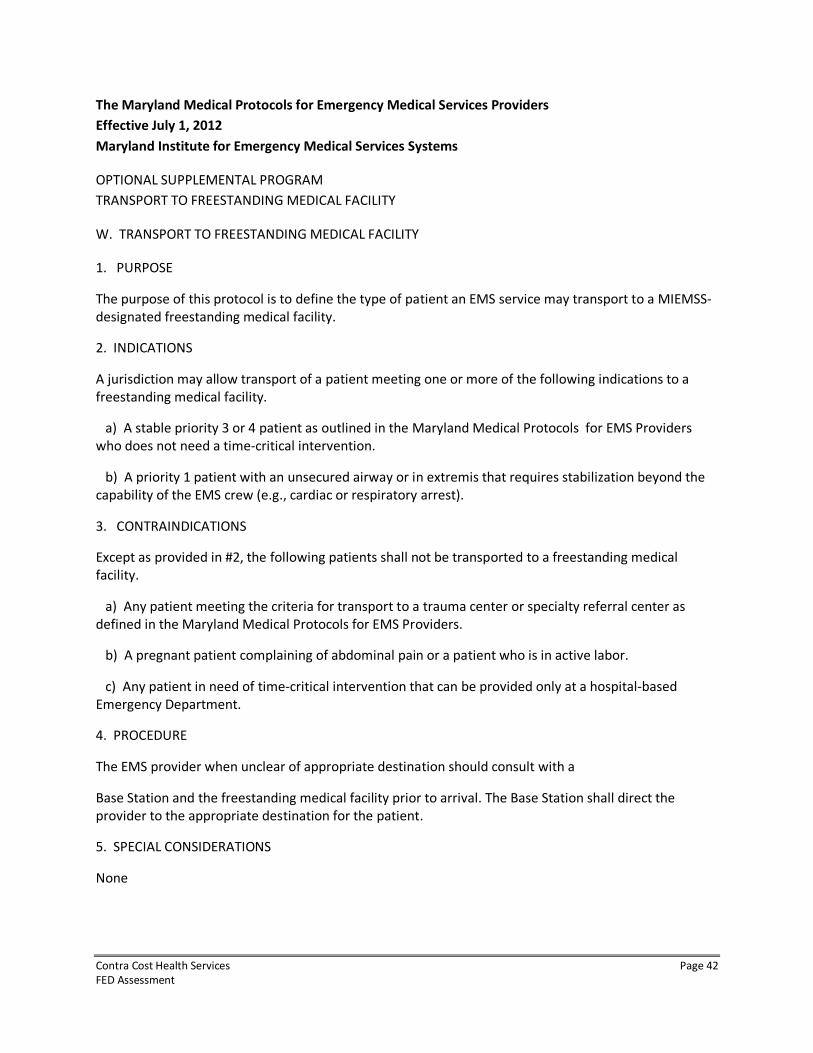
The Maryland Medical Protocols for Emergency Medical Services Providers
Effective July 1, 2012
Maryland Institute for Emergency Medical Services Systems
OPTIONAL SUPPLEMENTAL PROGRAM
TRANSPORT TO FREESTANDING MEDICAL FACILITY
W. TRANSPORT TO FREESTANDING MEDICAL FACILITY
1. PURPOSE
The purpose of this protocol is to define the type of patient an EMS service may transport to a MIEMSS-
designated freestanding medical facility.
2. INDICATIONS
A jurisdiction may allow transport of a patient meeting one or more of the following indications to a
freestanding medical facility.
a) A stable priority 3 or 4 patient as outlined in the Maryland Medical Protocols for EMS Providers
who does not need a time-critical intervention.
b) A priority 1 patient with an unsecured airway or in extremis that requires stabilization beyond the
capability of the EMS crew (e.g., cardiac or respiratory arrest).
3. CONTRAINDICATIONS
Except as provided in #2, the following patients shall not be transported to a freestanding medical
facility.
a) Any patient meeting the criteria for transport to a trauma center or specialty referral center as
defined in the Maryland Medical Protocols for EMS Providers.
b) A pregnant patient complaining of abdominal pain or a patient who is in active labor.
c) Any patient in need of time-critical intervention that can be provided only at a hospital-based
Emergency Department.
4. PROCEDURE
The EMS provider when unclear of appropriate destination should consult with a
Base Station and the freestanding medical facility prior to arrival. The Base Station shall direct the
provider to the appropriate destination for the patient.
5. SPECIAL CONSIDERATIONS
None
Contra Cost Health Services Page 43
FED Assessment
Attachment 5 – Literature Search
There are several common issues when considering the impact that a freestanding emergency
department (FEDs) could have on a community. The growth in the number of FEDs over the past decade
has peaked interest in the impact these facilities could have on relieving emergency department
crowding.3,4
From the literature, three main themes emerge: patient access, inter-facility transport, and
utilization.
Patient Access
Hospital-based EDs are serving a growing number of people and FEDs represent one option to improve
access for patients – especially in areas with high levels of ED crowding. FEDs represent an alternative to
patients that face long waits in a hospital-based ED. FEDs distinguish themselves from traditional
hospital-based EDs in a number of ways that are thought to improve patient satisfaction. FEDs are often
described as having modern architecture, comfortable and inviting rooms with lots of sunlight, and a
“concierge” approach to customer service (CITE).5,6,7
Wait times are also cited as a distinguishing feature
of FEDs. The 2009 data from the American Hospital Association shows that wait time (door-to-doctor)
and total length of stay (door-to-discharge) at an FED is about half that of a traditional hospital-based
ED.7 According to the same survey, 70 percent of FEDs are open 24-hours per day, increasing their
accessibility to patients.8
Despite these cited advantages, there are no published peer-reviewed studies that have compared
patient outcomes at FEDs to outcomes at hospital-based EDs. While the intent of an FED is to treat
injuries and illness of low or moderately acuity, some experts have expressed concern that patients
requiring a higher level of care will have worse outcomes if their care is delayed.9 Because of this, the
issue of transport between FEDs and hospitals is another theme that emerges in the FED literature.
3 Ferenc J. Are freestanding emergency departments a cure for crowding? Hospitals & Health Networks. July 2011. Available
at:http://www.hhnmag.com/hhnmag/jsp/articledisplay.jsp?dcrpath=HFMMAGAZINE/Article/data/07JUL2011/0711HFM_Upfro
nt_freestanding&domain=HFMMAGAZINE. Accessed October 25, 2012.
4 Berger E. Freestanding Emergency Departments: Burgeoning Trend May Relieve Crowding but May Drain Away Paying
Patients. Annals of Emergency Medicine. 2011;57(1):A22–A24.
5 SoRelle R. Freestanding ED Promises Full Service in Deluxe Environment. Emergency Medicine News. December 2012.
Available at: http://journals.lww.com/em-
news/Fulltext/2007/12000/Freestanding_ED_Promises_Full_Service_in_Deluxe.2.aspx. Accessed October 25, 2012.
6 Fulks C, McFarlin S, Stolley JM. Start a freestanding emergency center. Nurs Manage. 2000;31(8):41–42.
7 Frazier M. Freestanding Emergency Departments: Drive-through healthcare or top-of-the-line treatment? Health Care Design.
Dec 8,2011. Available at: http://www.healthcaredesignmagazine.com/article/freestanding-emergency-departments. Accessed
August 31, 2012.
8 California Healthcare Foundation. Freestanding Emergency Departments: Do They Have a Role in California? Available at:
http://www.chcf.org/~/media/MEDIA%20LIBRARY%20Files/PDF/F/PDF%20FreestandingEmergencyDepartmentsIB.pdf.
Accessed October 25, 2012.
Contra Cost Health Services Page 44
FED Assessment
Inter-facility Transport
A common criticism of FEDs is that care is delayed for patients who need to be transferred in order to
receive survey or be admitted to a hospital. Delay in care has been linked to many negative outcomes
for certain injuries and illnesses. For this reason, EMS in some communities will not transport patients
by ambulance to an FED. Current estimates are that FEDs transfer five percent of their patients for
hospital admission – significantly lower than the average hospital-based ED admission rate of 12.8
percent.10
Therefore, if the local EMS system becomes congested, patients requiring admission from
FEDs can face long waits for ambulance transfer, decreasing customer satisfaction and potentially
worsening patient outcomes.11
Utilization
According to the American Hospital Association, there were 241 FEDs in 2009, 65 percent more than
there were in 2004. FEDs were originally conceived to serve rural populations that did not have a nearby
hospital-based ED. However, recent trends show that the majority of new FEDs are being built in fast-
growing and wealthier suburban areas and are located within ten miles of a hospital-based ED. 12
This
trend has led to questions as to the impact of the FED has on the overall demand for emergency services
in a community. 13
One retrospective analysis looked at the impact that two FEDs had on a local hospital-
based ED located 9 and 12 miles from the two FEDs. The data showed that the opening two FEDs
decreased the volume and admission rates for the hospital-based ED, but increased the overall ED
volume for the health care system.14
9 Andrews M. A wait at the ER measured in minutes, not hours. A new type of freestanding emergency room promises good
medicine plus customer service. US News & World Report. 2008;145(7):79–80.
10
California Assembly Bill 1862 (Amended). An act to add and repeal Sections 1250.9 and 1797.134 of the Health and Safety
Code, relating to health facilities. Introduced by Assembly Member Logue. Amended in Assembly April 17, 2012. Available at:
http://leginfo.ca.gov/pub/11-12/bill/asm/ab_1851-1900/ab_1862_bill_20120417_amended_asm_v98.html. Accessed October
25, 2012.
11
Gillespie GL, Yap TL, Singleton M, Elam M. A summative evaluation of an EMS partnership aimed at reducing ED length of
stay. J Emerg Nurs. 2009;35(1):5–10.
12 Andrews M. Emergency Care, But Not At A Hospital. Kaiser Health News. May 31, 2011. Available at:
http://www.kaiserhealthnews.org/Features/Insuring-Your-Health/Michelle-Andrews-on-Hospital-ER-Alternatives.aspx.
Accessed October 25, 2012.
13 Ostrom C. ER building boom is wrong prescription, critics say. The Seattle Times. Available at:
http://seattletimes.com/html/localnews/2016867292_hospitalbuild27m.html. Accessed October 25, 2012.
14 Simon EL, Griffin PL, Jouriles NJ. The Impact of Two Freestanding Emergency Departments on a Tertiary Care Center. The
Journal of emergency medicine. 2012. Available at: http://www.ncbi.nlm.nih.gov/pubmed/22560268. Accessed October 25,
2012.