Embed Size (px)
Citation preview
REPORT NO. FRA/TTC— 80/04 PB
FREIGHT CAR FATIGUE ANALYSIS TEST ON FAST
Facility for Accelerated Service Te/ting~ M M T \
T R A N S P O R T A T I O N T E S T C E N T E R PUEB L O , C O L O R A D O 81001
J U L Y 1 9 8 0
FINAL REPORT
This document is available to the public through The National Technical Information Service,
Springfield, Virginia 22161
P R E P A R E D F O RTHE FAST PROGRAM
AN INTERNATIONAL GOVERNMENT - INDUSTRY RESEARCH PROGRAMU.S. DEPARTMENT OF TRANSPORTATION ASSOCIATION OF AMERICAN RAILROADSFEDERAL RAILROAD ADMINISTRATION 1920 L Street, N.W.
Washington, D C. 20590 Washington, D C. 20036RAILWAY PROGRESS INSTITUTE
801 North Fairfax Street Alexandria. Virginia 22314
- Rail Vehicles & unponents
NOTICE
This document reflects events relating to testing at the Facility for Accelerated Service Testing (FAST) at the Transportation Test Center, which may have resulted from conditions, procedures, or the test environment peculiar to that facility. This document is disseminated for the FAST Program under the sponsorship of the U. S. Department of Transportation, the Association of American Railroads, and the Railway Progress Institute in the interest of information exchange. The sponsors assume no liability for its contents or use thereof •
NOTICE
The FAST Program does not endorse products or manufacturers. Trade or manufacturers' names appear herein solely because they are considered essential to the object of this report.
Technical Report Documentation Page
1. Report No.
FRA/TTC-*80/042. Government Accession No. 3. Recipient's Catalog No.
4. Title and Subtitle
FREIGHT CAR FATIGUE ANALYSIS TEST ON FAST
5. Report DateJULY 1980
6. Performing Organization Code
7. Author(s)G.J. Moyar* and J.E. Burns**
8. Performing Organization Report No.
9. Performing Organization Name and AddressAssociation of American Railroads Technical Center 3140 South Federal Street
___Chicago, Illinois 60616
10. Work Unit No. (TRAIS)
11. Contract or Grant No.
12. Sponsoring Agency Name and AddressU.S. Department of Transportation Federal Railroad Administration Office of Research and Development 2100 Second Street, SW. , Washington, D.C.
13. Type of Report and Period Covered
Final Report August-September 1978
14. Sponsoring Agency Code20590
15. Supplementary Notes♦Engineering Consultant to AAR
♦♦Senior Mechanical Engineer, Chessie System
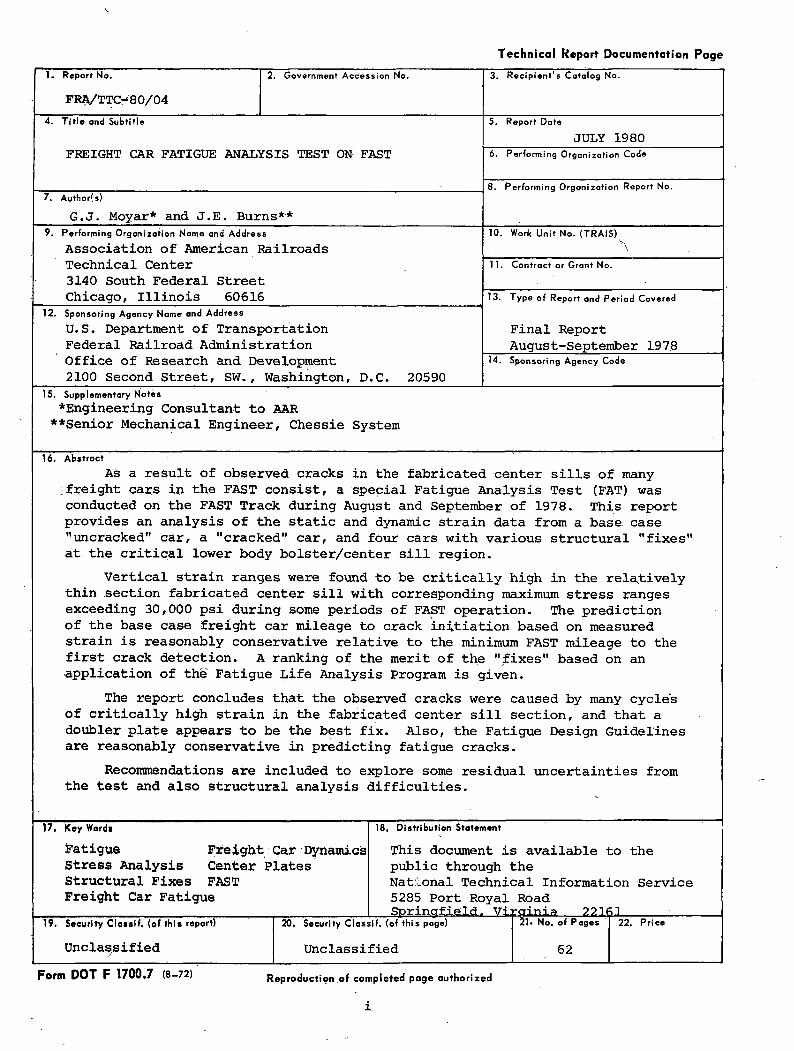
16. AbstractAs a result of observed cracks in the fabricated center sills of many
;freight cars in the FAST consist, a special Fatigue Analysis Test (FAT) was conducted on the FAST Track during August and September of 1978. This report provides an analysis of the static and dynamic strain data from a base case "uncracked" car, a "cracked" car, and four cars with various structural "fixes" at the critical lower body bolster/center sill region.
Vertical strain ranges were found to be critically high in the relatively thin section fabricated center sill with corresponding maximum stress ranges exceeding 30,000 psi during some periods of FAST operation. The prediction of the base case freight car mileage to crack initiation based on measured strain is reasonably conservative relative to the minimum FAST mileage to the first crack detection. A ranking of the merit of the "fixes" based on an application of the Fatigue Life Analysis Program is given.
The report concludes that the observed cracks were caused by many cycle's of critically high strain in the fabricated center sill section, and that a doubler plate appears to be the best fix. Also, the Fatigue Design Guidelines are reasonably conservative in predicting fatigue cracks.
Recommendations are included to explore some residual uncertainties from the test and also structural analysis difficulties.
17, Key Word*Fatigue Fre ight Car DynamicsStress Analysis Center PlatesStructural Fixes FAST Freight Car Fatigue
18. Distribution Statement
This document is available to the public through theNational Technical Information Service 5285 Port Royal RoadSpringfield. Vi]rainia___22161_____ :______
19. Security Classif. (of this report) 20. Security Classif. (of this page) 21. No. of Pages 22. Price
Unclassified Unclassified 62Form DOT F 1700.7 (8-72) Reproduction .of completed page authorized
1.
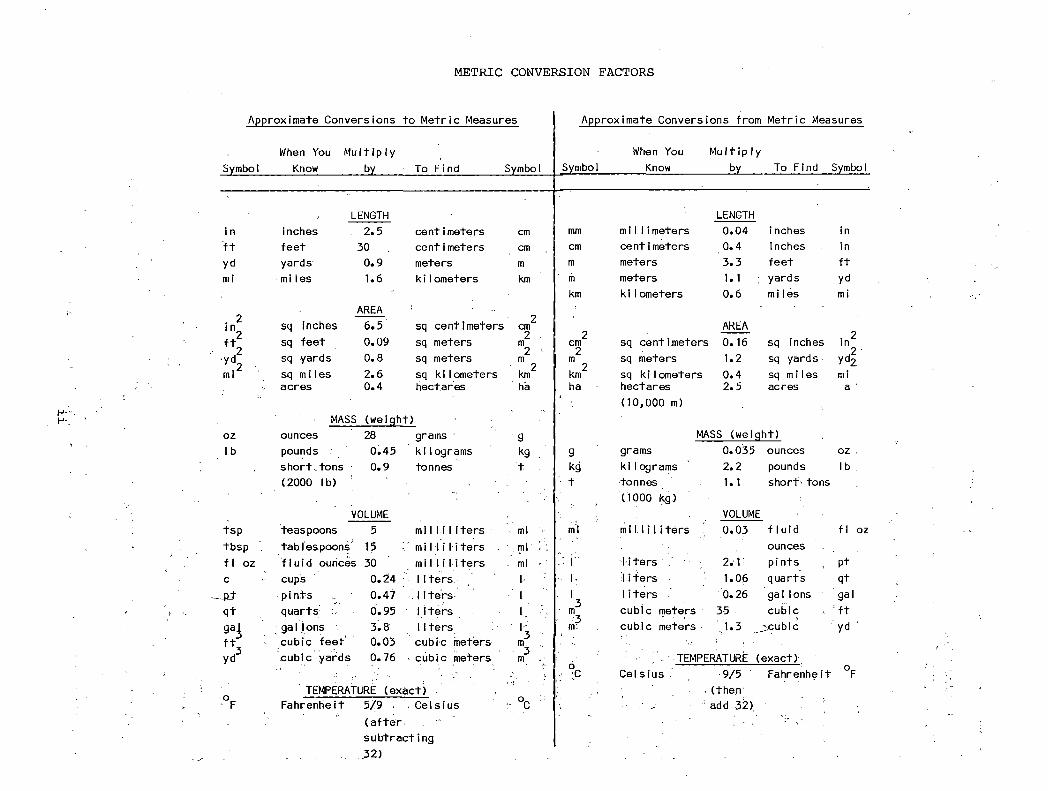
METRIC CONVERSION FACTORS
Approximate Conversions to Metric Measures Approximate Conversions from Metric Measures
When You Multiply When You Mu It iplySymbol Know by___ To Find Symbol Symbol Know ___bv___ To Find Symbol
LENGTH LENGTHi n inches 2.5 centimeters cm mm m i 1 1 i meters 0.04 i nches inft feet 30 centimeters cm cm centimeters 0.4 inches inyd yards 0.9 meters m m meters 3.3 feet ftmi miles 1.6 ki1ometers km m meters 1. 1 yards yd
' km ki 1 ometers 0.6 miles miAREA 1
%
sq inches sq feet
6.50.09
sq centimeters sq meters
2cm2m 2cm sq centimeters
AREA 0.16 sq inches . 2 in
•yd2 . sq yards 0.8 sq meters 2 » m?
2m o sq meters 1.2 sq yards; y4mi sq miles 2.6 sq kilometers km km sq ki 1 ometers 0.4 sq m i 1 es mi
acres 0.4 hectares ha ha hectares (10,000 m)
2.5 acres a L
■ MASS (weight)oz ounces 28 grams g MASS (weight)lb pounds 0.45 kilograms g grams 0.035 ounces oz :
short .. tons 0.9 tonnes t kg ki I ograms 2.2 pounds lb(2000 lb) t tonnes 1.1 short tons
(1000 kg)VOLUME VOLUME
tsp teaspoons 5 mi 1 IT 1 iters ml ml m i11i1i ters 0.03 fluid f 1 oztbsp tablespoons 15 mi 11iliters . ml *: ouncesf 1 oz fluid ounces 30 mil 1 i 1 i ters ml r 1 i ters 2.1 pints P+c cups 0.24 1 i ters. i- i 1 i ters 1.06 qua rts q+-P.t p i n.ts 0.47 1 i ters- ■ i . i 1 i ters ; 0. 26 gal Ions galqt quarts 0.95 1 i ters i. ■ - m
3m.cubic meters 35 cubic :ft
gallons 3.8 liters '3 cubic meters. .1.3 icubic ydcubic feet cubic yards
0.03 0.76 ■
cubic meters cubic meters
m3m '- TEMPERATURE (exact)'6; c Celsius . 9/5 Fahrenheit °F
•o' F' TEMPERATURE (exact) (then
Fahrenheit 5/9 Celsius °c add 32) ' '(aftersubtract ing.32)
PREFACE
In a cooperative program of this extent so many individuals and organizations have made valuable contributions that making proper acknowledgement is a sizable task. The authors undertake this task with some trepidation, lest we unwittingly overlook persons deserving credit. To offset this inevitable failing, we take full responsibility for the .misinterpretations and errors that no doubt will be found in this summary of the program.
In the first instance, we wish to thank Mr. R. Prozowski, a student at the Illinois Institute of Technology, who, as a part-time employee of Association of American Railroads (AAR), handled all the computer data reduction tasks and made the many Fatigue Life Analysis Program computer runs and related computer programming efforts essential to this analysis.
Among the AAR staff at Chicago we especially acknowledge: Dr. A. Zarembski, Manager of the Track Structures Research Division, who played a key role in the initiation of FAT as well as participation in its evaluation; the experience and advice of Mr. J. Punwani, Senior Staff Mechanical Engineer, which was especially valuable; Mr. B. Johnstone, who recently joined the AAR as Manager of Applied Technology and participated effectively as a principal investigator with the authors in the July 1979 repeat tests at the Transportation Test Center (TTC); Mr. W. Sneed, Staff Electrical Engineer, who participated in these same repeat tests and whose skill made possible the successful instrumentation results on short notice.
Among the AAR staff at the TTC we cite especially Mr. S. Guins, Consultant to AAR and previously Manager of FAST Experiments, and Mr. J.R. Lundgren, FAST Technical Manager at the TTC, for their untiring efforts to coordinate support activity.
Advice, direction, and valuable data were obtained from Mr. T.G. Spatig, Assistant Chief Mechanical Officer-Engineering of the Chessie System. Early interest and recommendations from Mr. W. Carman, Manager of Equipment Research Engineering of the Southern Railway System, were also helpful. A number of individuals from the railroad supply industry played a key role, particularly in sharing information on the complex stress analysis issues in this program.
We especially thank Mr. S. Halcomb and Dr. D. Sutliff of ACF Industries, formerly Track Train Dynamics (TTD) II Task Manager for Car Structure and Director, TTD II, respectively, for their continuing and detailed support of the program, and Mr. Sheng Wu, who conducted the stress analysis at ACF and made the results available to AAR.
Mr. J. Hilts, Senior Mechanical Engineer, and Mr. E. Bailey, Manager of Engineering for Dresser Industries, have likewise shared the results of their stress analysis with us, making additional computer runs in response to questions raised by the Fatigue Analysis Test.
iii
At the TTC, a number of individuals from Dynalectron Corporation participated directly in various phases of the test. These include Mr. E.H. Chang, Rail Systems Analyst, who spent many hours assisting the authors in data interpretation; Mr. T. Everly, who supervised much of the mechanical support work; and Mr. G. Mathews, who provided for instrumentation support. Also, Mr. J. Ellzey, Federal Railroad Administration, FAST Operations office, provided much of the planning and coordination of TTC activities.
Mr. D. Naik, Structural Engineer, and Mr. S. Lee, Manager-ProductEngineering for Pullman Standard, also shared information with us regardingstress analysis.
iv
TABLE OF CONTENTS
Metric Conversion Factors .............................. . . . . . . . . . iiP r e f a c e ................... iiiTable of C o n t e n t s ....................................... vList of F i g u r e s ............................................................. . vList of Tables............................ viiAcronyms and Abbreviations.......................... viiiExecutive Summary ............................................................. ix
1.0 INTRODUCTION . ...... ............................................... 1
1.1 Purpose...................... 11.2 Background......... .. . . ............ .. ........................ 11.3 Summary of FAT Program.................... 2
2.0 SUMMARY OF TESTS AND ANALYSIS................ 16
2.1 Static Test Results. . ............................................. 162.2 Car-Rocking Test R e s u l t s .......................................... 182.3 Dynamic Test R e s u l t s .............................. 26
3.0 STRESS ANALYSIS.............. . .................................... 36
3.1 Principal S t r e s s e s ........... 363.2 Critical Stress.................. 383.3 Static Stress........................................................ 383.4 Finite Element Analyses................................... . . . . 39
4.0 FATIGUE ANALYSIS . . ............................... 41
5.0 CONCLUSIONS AND RECOMMENDATIONS. .......................... 47
5.1 Conclusions................ 475.2 Recommendations............. 48
References..................... 49
LIST OF FIGURES f
Figure Page
1-1 Center Sill Crack at Intersection of Lower BodyBolster Web Plate with Cope H o l e ................................. 3
1-2 Center Sill Crack at Intersection of Side BearingI-Beam Support ............................ 3
1-3 Cracks at Center Sill Intersection of Lower BodyBolster Web Plate without Cope Hole......................... 4
j
Section Page
v
1-4 Center Sill Crack Discovered on Right Side, B-End,Car # 1 ........... .................................' ............. 4
1-5 Stub Sill Cracks in Rotary Dump Car............................. 5
1-6 Typical View of Fabricated Z Center Sill/Lower Body.Bolster Intersection ........................ 6
1-7 Strain Gage Locations, Uncracked and Unmodified Car #1 . . . . .7
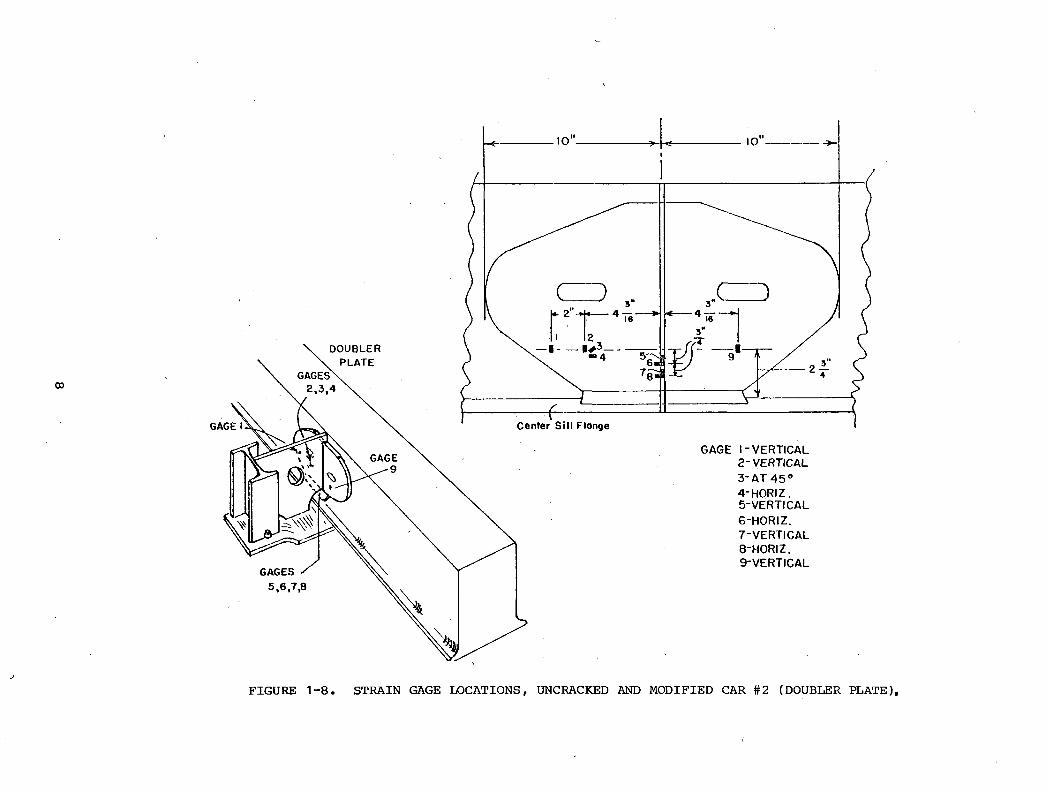
1-8 Strain Gage Locations, Uncracked and ModifiedCar #2 (Doubler Plate) . . . . . . . .............. 8
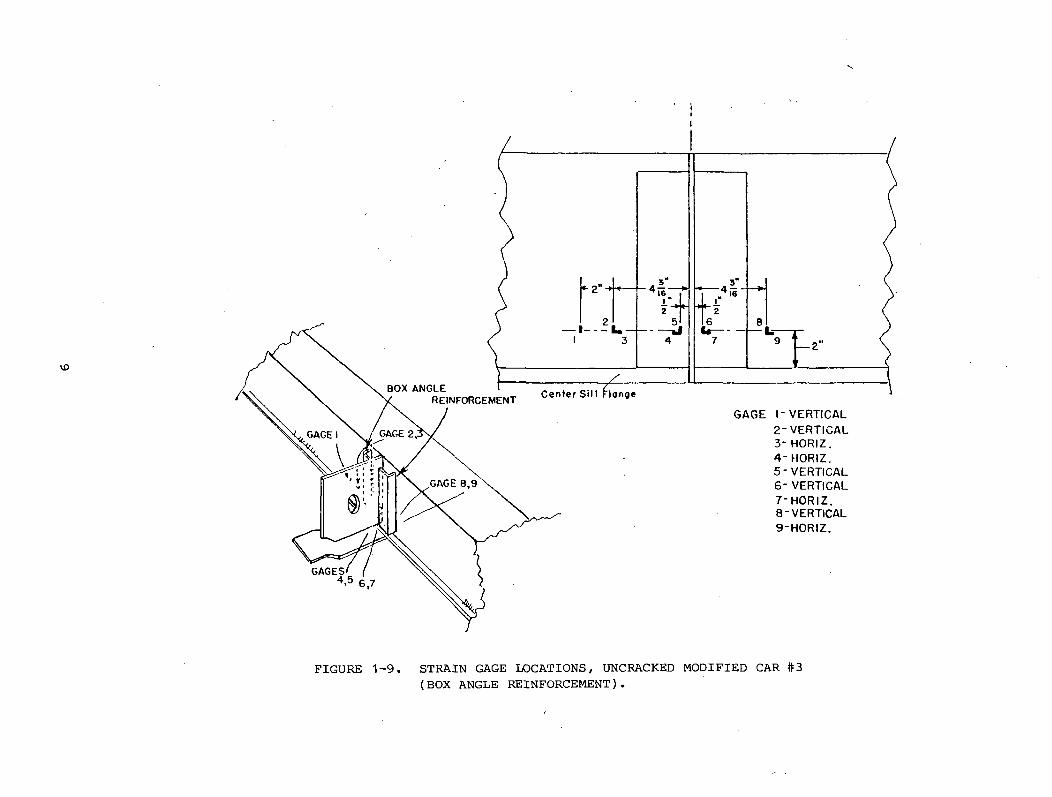
1-9 Strain Gage Locations, Uncracked Modified Car #3(Box Angle Reinforcement) . ............................. 9
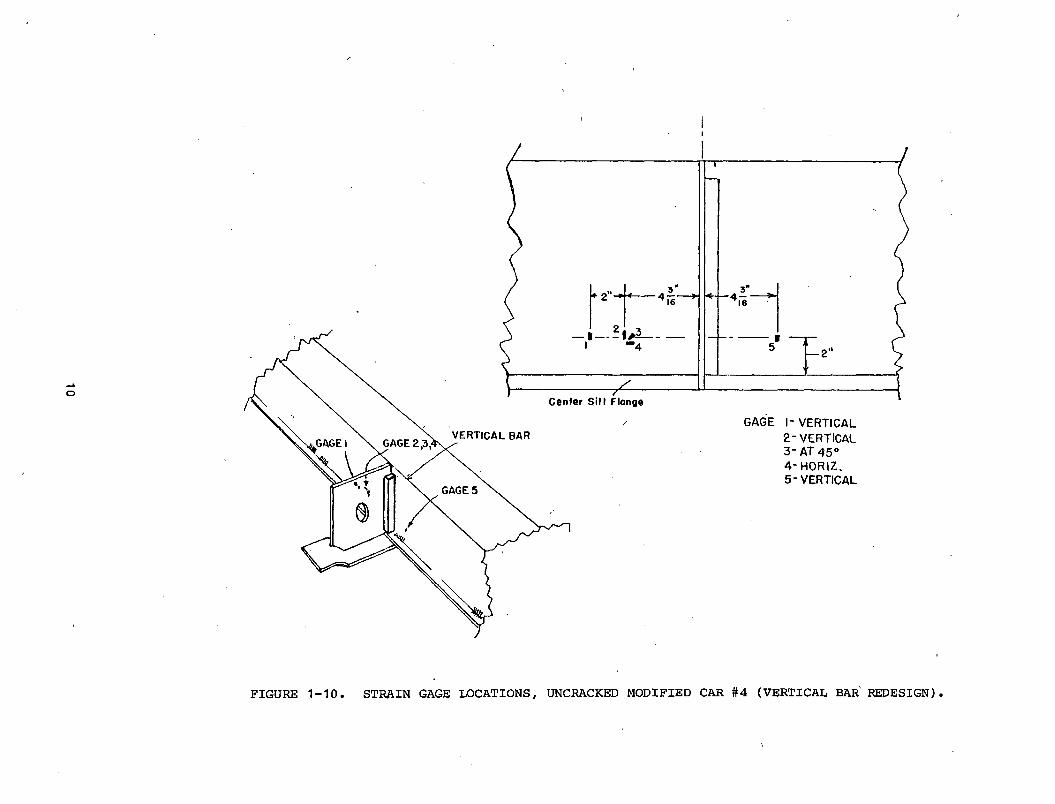
1-10 Strain Gage Locations, Uncracked Modified Car #4(Vertical Bar Redesign).......................................... 10
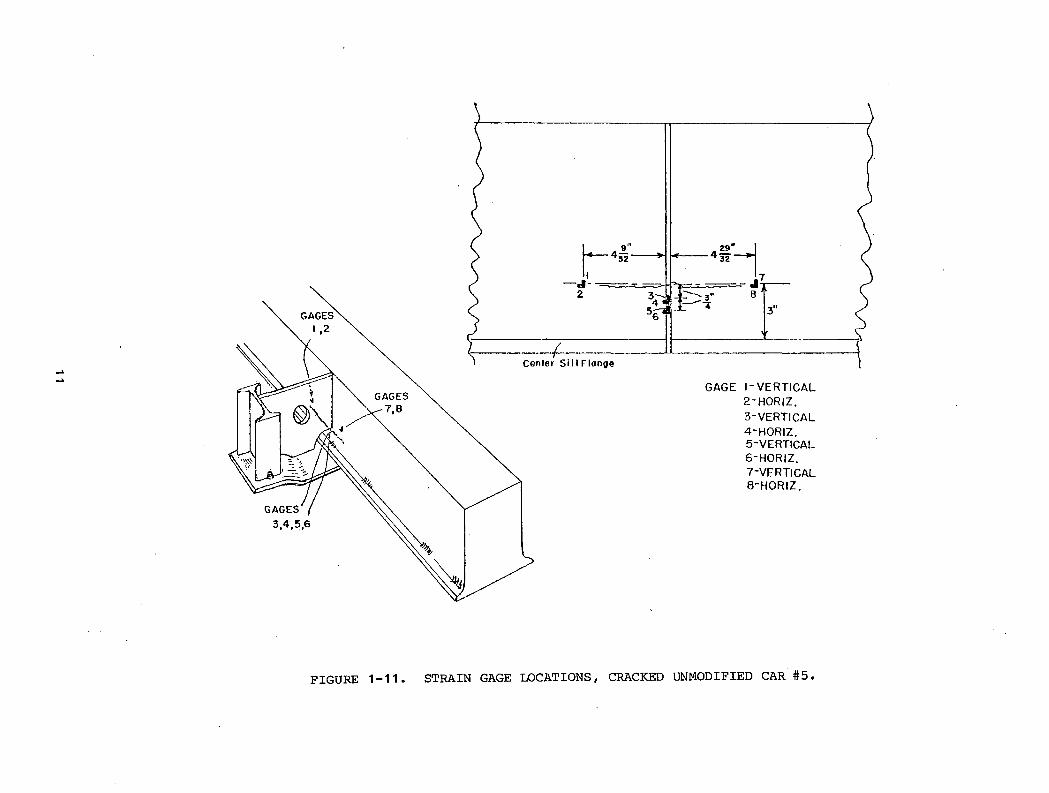
1—11 Strain Gage Locations, Cracked Unmodified Car #5 ............. 11
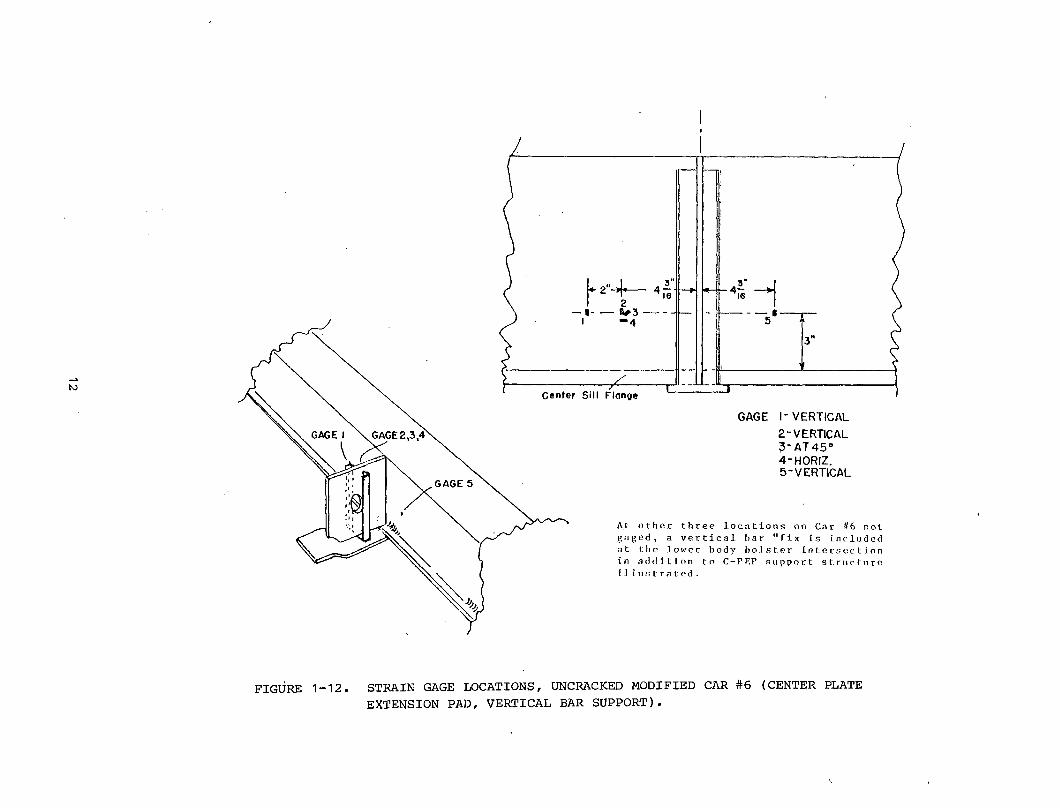
1-12 Strain Gage Locations, Uncracked Modified Car #6(Center Plate Extension Pad, Vertical Bar Support) . . . . . . 12
1-13 Strain Gages and Accelerometer, Left SideInboard B-End, Car #1. . . . . .............. ................ .. 14
1- 14 Strain Gage, Left Side Outboard B-End (Near Coupler),Car #1 . . .................. 14
1^15 AAR-Built Instrumented Load Cells, B-Ertd Truck, Car #1 . . . . 15
2- 1 Strain Gages, Right Side Inboard, A-End, Car #1 . . . . . . . 19
2-2 Weld Crack at Low Profile Center Plate, Car # 1 ................ 22
2-3 Arrangement for Edge-Loading of Center Plate .................. 24
2-4 Typical Maximum Vertical Strain Gage and AccelerometerSignal During Test Operation on F A S T ........................... 27
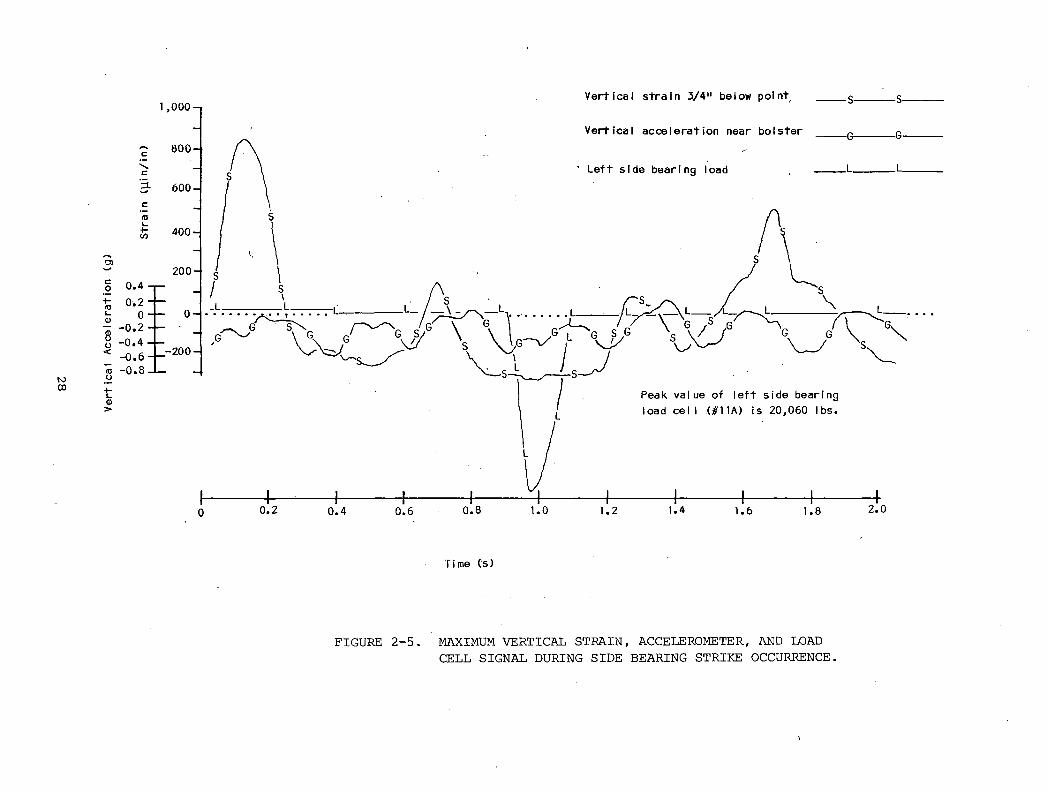
2-5 Maximum Vertical Strain, Accelerometer, and LoadCell Signal During Side Bearing Strike Occurrence............. 28
LIST OF FIGURES, CONTINUED
Figure Page
■ v . vi
}(
LIST OF TABLES
2-1 Live Load Strains, Uncracked Cars............................... 17
2-2 Strain Increments for Transfer of Loaded Car fromJack Pad Support to Truck Support............................ . 20
2-3 Repeat Test for Car #1 - Strain Increments forTransfer of Loaded Car from Jack Pad Support to .Truck Support. . . . . . . . . . . . . . . .................... 21
2-4 Strain Range and Peak Increment from Car Rollover,Offcenter Loading, and Rocking Tests ........................... 25
2-5 Occurrence of Peak Dynamic Strain for Vertical StrainGage at Centerline of Bolster in Top Position.................. 29
2-5 Occurrence of Peak Dynamic Strain for VerticalStrain Gage about 4" Inboard of Bolster Centerline ........... 30
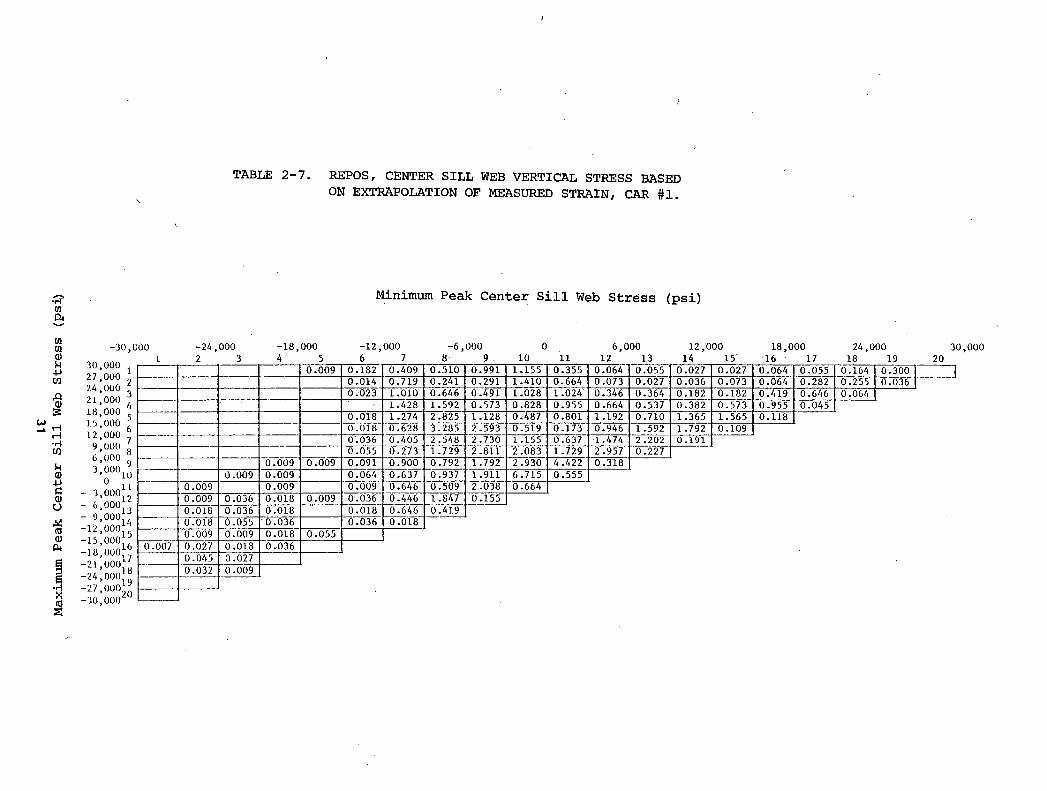
2-7 REPOS, Center Sill Web Vertical Stress Based onExtrapolation of Measured Strain, Car # 1 . . . ........... . . 31
2-8 Percentage Occurrence of Peak Vertical Acceleration,Car # 1 ............. 33
2-9 REPOS Comparison...................................... 34
2- 10 Comparison of Vertical Acceleration Statistics ............ . . 35
3- 1 Typical FAST Dynamic Stresses.................................... 37
4- 1 Assumed Fatigue Properties ...................................... 41
4-2 Fatigue Life Predictions in Miles for Car # 1 ................... 43
4-3 Relative Theoretical Fatigue Endurance Values.................... 44
Table Page
vii
ACRONYMS
AARACF
CCW
CW
FAT
FAST
FLAP
FM
FRA
MGD
MGT
REPOS
TTC
TTD
Association of American Railroads
American Car and Foundry
counterclockwi se
clockwise
Fatigue Analysis Test
Facility for Accelerated Service Testing
Fatigue Life Analysis Program
Figure of Merit
Federal Railroad Administration
Modified Goodman Diagram
million gross tons
Road Environment Percentage Occurrence Spectrum
Transportation Test Center
Track Train Dynamics
ABBREVIATIONS
yin/ in microinch per inch g gravitationalacceleration
psi pounds per square inch% percent
", in inchHz Hertz
mi mile o degreemi/h miles per hour
O/ approximate! y
viii
EXECUTIVE SUMMARY
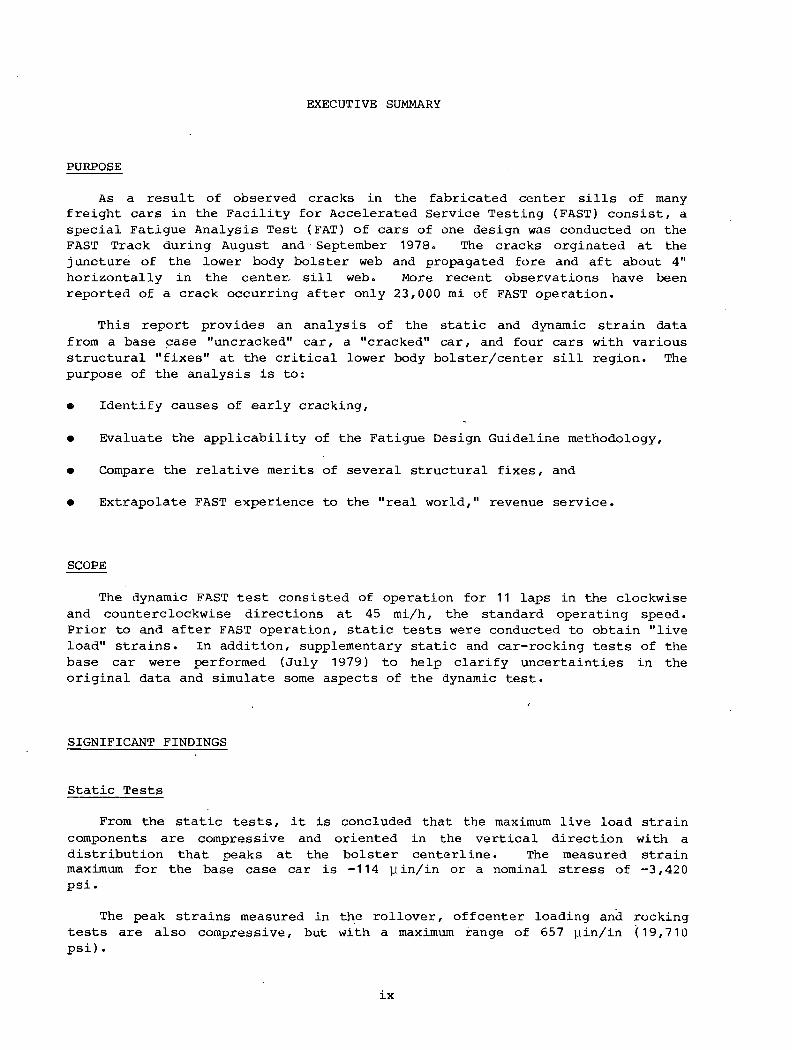
P U R P O S E
As a result of observed cracks in the fabricated center sills of many freight cars in the Facility for Accelerated Service Testing (FAST) consist, a special Fatigue Analysis Test (FAT) of cars of one design was conducted on the FAST Track during August and September 1978° The cracks orginated at the juncture of the lower body bolster web and propagated fore and aft about 4" horizontally in the center, sill web. More recent observations have been reported of a crack occurring after only 23,000 mi of FAST operation.
This report provides an analysis of the static and dynamic strain data from a base case "uncracked" car, a "cracked" car, and four cars with various structural "fixes" at the critical lower body bolster/center sill region. The purpose of the analysis is to:
• Identify causes of early cracking,
• Evaluate the applicability of the Fatigue Design Guideline methodology,
• Compare the relative merits of several structural fixes, and
• E x t r a p o l a t e F A S T e x p e r i e n c e t o t h e " r e a l w o r l d , " r e v e n u e s e r v i c e .
S C O P E
The dynamic FAST test consisted of operation for 11 laps in the clockwise and counterclockwise directions at 45 mi/h, the standard operating speed. Prior to and after FAST operation, static tests were conducted to obtain "live load" strains. In addition, supplementary static and car-rocking tests of the base car were performed (July 1979) to help clarify uncertainties in the original data and simulate some aspects of the dynamic test.
SIGNIFICANT FINDINGS
Static Tests
From the static tests, it is concluded that the maximum live load strain components are compressive and oriented in the vertical direction with a distribution that peaks at the bolster centerline. The measured strain maximum for the base case car is -114 yin/in or a nominal stress of -3,420 psi.
The peak strains measured in the rollover, offcenter loading and rocking tests are also compressive, but with a maximum range of 657 yin/in (19,710 psi) .
ix
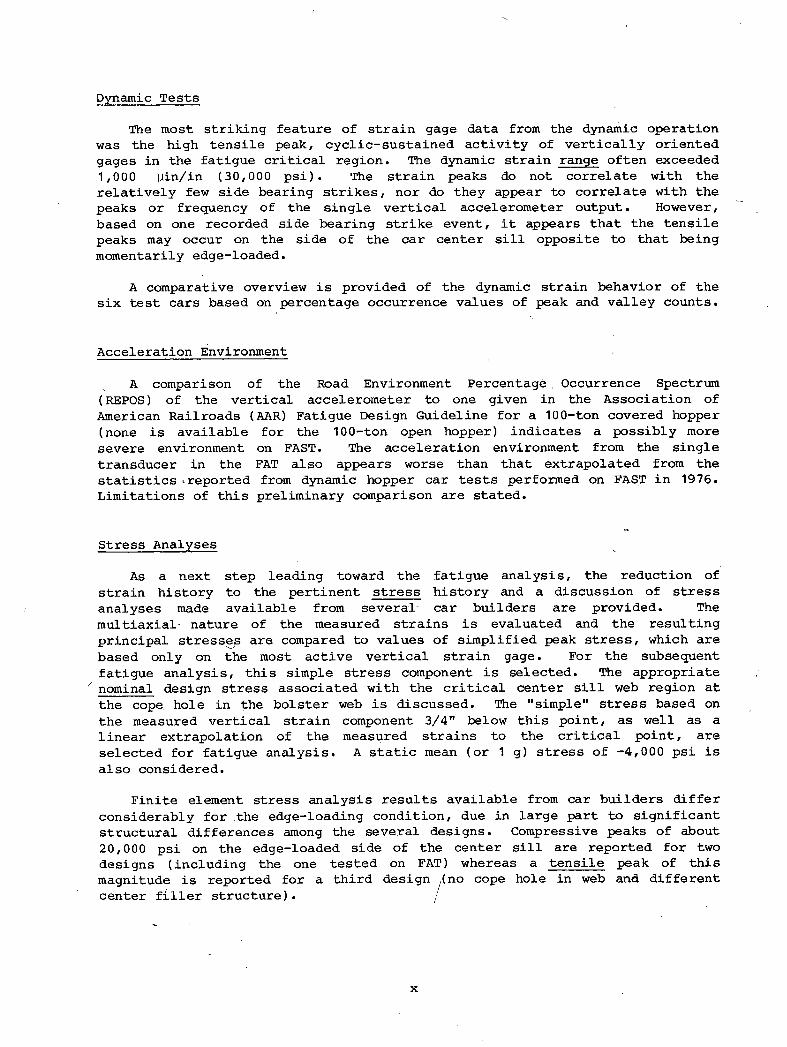
Dynamic TestsThe most striking feature of strain gage data from the dynamic operation
was the high tensile peak, cyclic-sustained activity of vertically oriented gages in the fatigue critical region. The dynamic strain range often exceeded1,000 uin/in (30,000 psi). The strain peaks do not correlate with the relatively few side bearing strikes, nor do they appear to correlate with the peaks or frequency of the single vertical accelerometer output. However, based on one recorded side bearing strike event, it appears that the tensile peaks may occur on the side of the car center sill opposite to that being momentarily edge-loaded.
A comparative overview is provided of the dynamic strain behavior of the six test cars based on percentage occurrence values of peak and valley counts.
Acceleration Environment
A comparison of the Road Environment Percentage Occurrence Spectrum (REPOS) of the vertical accelerometer to one given in the Association of American Railroads (AAR) Fatigue Design Guideline for a 100-ton covered hopper (none is available for the 100-ton open hopper) indicates a possibly more severe environment on FAST. The acceleration environment from the single transducer in the FAT also appears worse than that extrapolated from the statistics * reported from dynamic hopper car tests performed on FAST in 1976. Limitations of this preliminary comparison are stated.
Stress Analyses
As a next step leading toward the fatigue analysis, the reduction ofstrain history to the pertinent stress history and a discussion of stressanalyses made available from several car builders are provided. Themultiaxial nature of the measured strains is evaluated and the resulting principal stresses are compared to values of simplified peak stress, which are based only on the most active vertical strain gage. For the subsequentfatigue analysis, this simple stress component is selected. The appropriate
7 nominal design stress associated with the critical center sill web region at the cope hole in the bolster web is discussed. The "simple" stress based on the measured vertical strain component 3/4" below this point, as well as a linear extrapolation of the measured strains to the critical point, are selected for fatigue analysis. A static mean (or 1 g) stress of -4,000 psi is also considered.
Finite element stress analysis results available from car builders differ considerably for the edge-loading condition, due in large part to significant structural differences among the several designs. Compressive peaks of about20,000 psi on the edge-loaded side of the center sill are reported for two designs (including the one tested on FAT) whereas a tensile peak of this magnitude is reported for a third design (no cope hole in web and different center filler structure). /
x
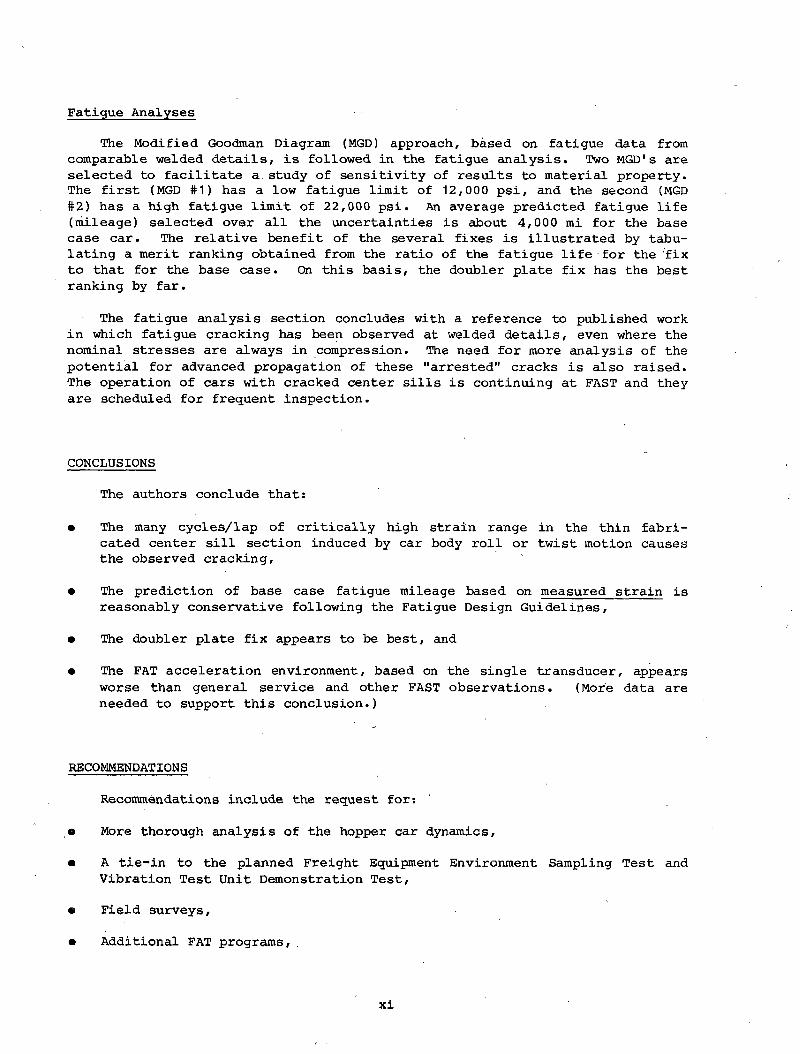
Fatigue AnalysesThe Modified Goodman Diagram (MGD) approach, based on fatigue data from
comparable welded details, is followed in the fatigue analysis. Two MGD's are selected to facilitate a. study of sensitivity of results to material property. The first (MGD #1) has a low fatigue limit of 12,000 psi, and the second (MGD #2) has a high fatigue limit of 22,000 psi. An average predicted fatigue life (mileage) selected over all the uncertainties is about 4,000 mi for the base case car. The relative benefit of the several fixes is illustrated by tabulating a merit ranking obtained from the ratio of the fatigue life for the 'fix to that for the base case. On this basis, the doubler plate fix has the best ranking by far.
The fatigue analysis section concludes with a reference to published work in which fatigue cracking has been observed at welded details, even where the nominal stresses are always in compression. The need for more analysis of the potential for advanced propagation of these "arrested" cracks is also raised. The operation of cars with cracked center sills is continuing at FAST and they are scheduled for frequent inspection.
CONCLUSIONS * •
The authors conclude that:
• The many cycles/lap of critically high strain range in the thin fabricated center sill section induced by car body roll or twist motion causes the observed cracking,
• The prediction of base case fatigue mileage based on measured strain is reasonably conservative following the Fatigue Design Guidelines,
• The doubler plate fix appears to be best, and
• The FAT acceleration environment, based on the single transducer, appears worse than general service and other FAST observations. (More data are needed to support this conclusion.)
RECOMMENDATIONS
Recommendations include the request for:
• More thorough analysis of the hopper car dynamics,
• A tie-in to the planned Freight Equipment Environment Sampling Test and Vibration Test Unit Demonstration Test,
• Field surveys,
• Additional FAT programs,
xi
• A b e n c h m a r k f i n i t e e l e m e n t a n a l y s i s , a n d
• E n h a n c e m e n t s t o t h e A A R F a t i g u e A n a l y s i s P r o g r a m .
xii
\
1.0 INTRODUCTION
1. 1 PURPOSE
Although the Facility for Accelerated Service Testing (FAST) is primarily oriented toward the study of track structure effects, significant information has been obtained concerning rolling stock endurance, including observations of fatigue cracks in freight car structures. The purpose of this report is to provide a brief overview of these observations and to concentrate on the evaluation and analysis of a special Fatigue Analysis Test (FAT) conducted on FAST during August and September of 1978.
The FAT program was designed to gather carbody load and strain environment data from six cars of the same basic design with several "fixes" in the fatigue-critical center sill/body bolster region. It was hoped that analysis of these data would provide:
• S o m e i n s i g h t i n t o c a u s e s o f t h e a p p a r e n t l y e a r l y f a t i g u e c r a c k i n g o f m a n y
f a b r i c a t e d c e n t e r s i l l s a t F A S T ,
• A n o p p o r t u n i t y t o e v a l u a t e ^ t h e p e r t i n e n c e o r v a l i d i t y o f t h e F a t i g u e
D e s i g n G u i d e l i n e t e c h n o l o g y d e v e l o p e d i n t h e c o u r s e o f t h e c o o p e r a t i v e
T r a c k T r a i n D y n a m i c s ( T T D ) P r o g r a m ,
• A c o m p a r i s o n o f t h e r e l a t i v e m e r i t s o f s e v e r a l s t r u c t u r a l f i x e s , a n d
• A n o t h e r p e r s p e c t i v e o n e x t r a p o l a t i o n o f F A S T e x p e r i e n c e t o t h e " r e a l
w o r l d " — r e v e n u e s e r v i c e .
1.2 BACKGROUND
Preliminary to discussion of the FAT program and detailed consideration of its analysis in the light of its stated objectives, a general background about FAST that relates to freight car cracks is given.
The FAST Track was completed in September 1976, and consist operations began in the same month. About 60% of the cars were less than two years old; consequently, defects reported in the early stages of operation were minor in nature--e.g., truck side frame column wear plate welds cracked, center plate bowl vertical wear ring welds cracked, and some rivets and bolts in corner posts and end sills of carbodies loosened.
In December 1977, interest focused on ten cars that had fabricated draft sills. They were all of one ownership, but had been built by three different
PrzybyI inski, P. and Halcomb, S., Interim AAR Guidelines for Fatigue Analysis of Freight Cars, Association of American Railroads, Report No. R-245, May 1977. (Now part, of AAR Mechanical Division Specification M1001.)
1
manufacturers and had three different center filler designs (with both 14" and 16" plates) in the group. At about 150 million gross tons (MGT), a crack was found in the center sill web in the center plate area of one of these cars. The crack ran longitudinally each way from the side bearing web plate (figure 1-1), located on the centerline of the truck. Eventually, cracks developed in nine of the ten cars, including cars built by the other two manufacturers (figures 1-2 and 1-3).
No center, sill cracks were reported from car inspections prior to December 1977, and little crack growth was reported after the cracks were discovered. The maximum crack observed extended about 4" on either side of the bolster centerline to within 2-3" of the Z-sill location where internal spacer plates box in the center filler region.
Although sufficient data do not exist to pinpoint life or mileage to crack initiation, a recent observation has provided a better basis for estimation. An uncracked car with low service mileage was introduced into the FAST consist in August 1978 as part of the FAT (car #1). On June 28, 1979, one of the authors observed a crack on the right side of the B-end (figure 1-4), although the same person had inspected the car a .week earlier without observing any crack. The car had then accumulated 23,000 miles on FAST.
Finally, cracks have been observed on other car types, including flat cars. . At 100,000 miles and 185 MGT, cracks were found in the center, filler area of stub sills on some of the rotary dump or bathtub cars (figure- 1-5). Some center plate failures were also reported. The cause and prevention of these failures are still being investigated.
1.3 SUMMARY OF THE FAT PROGRAM
These observations stimulated interest in and recommendations for followup tests and analyses, and the FAT Program plan was developed by the FAST Experiment Manager for cars, J. E. Burns, the cognizant Association of American Railroads (AAR) manager, Dr. A. Zarembski, and the TTD Phase II Task Manager for car structures, S.. Halcomb of American Car and Foundry ;(ACF), in consultation with others in the industry and railroads. The, resulting test program was submitted through the office of the Federal Railroad Administration (FRA) FAST Project Manager to the TTC Operations and Maintenance Contractor, Dynalectron Corporation, for implementation.
Six Chessie-built cars— one uncracked and unmodified car, one cracked but unmodified car, and four cars with several types of fixes— were instrumented and tested both statically and dynamically through operation on the FAST Track. A schematic drawing of the fatigue-critical region where strain gages were located is given in figure 1-6. Exact gage locations in the six cars are shown in figures 1-7 through 1-12. The base case, car #1, was also equipped
Department of Transportation letter from G.P. McIntosh, TTC FAST Project Manager, to E.M. Thompson, Program Manager, Dynalectron Corporation, Subject: Fatigue AnalysisTest, FRA/FPO/78-L002, May 11, 1978.
2
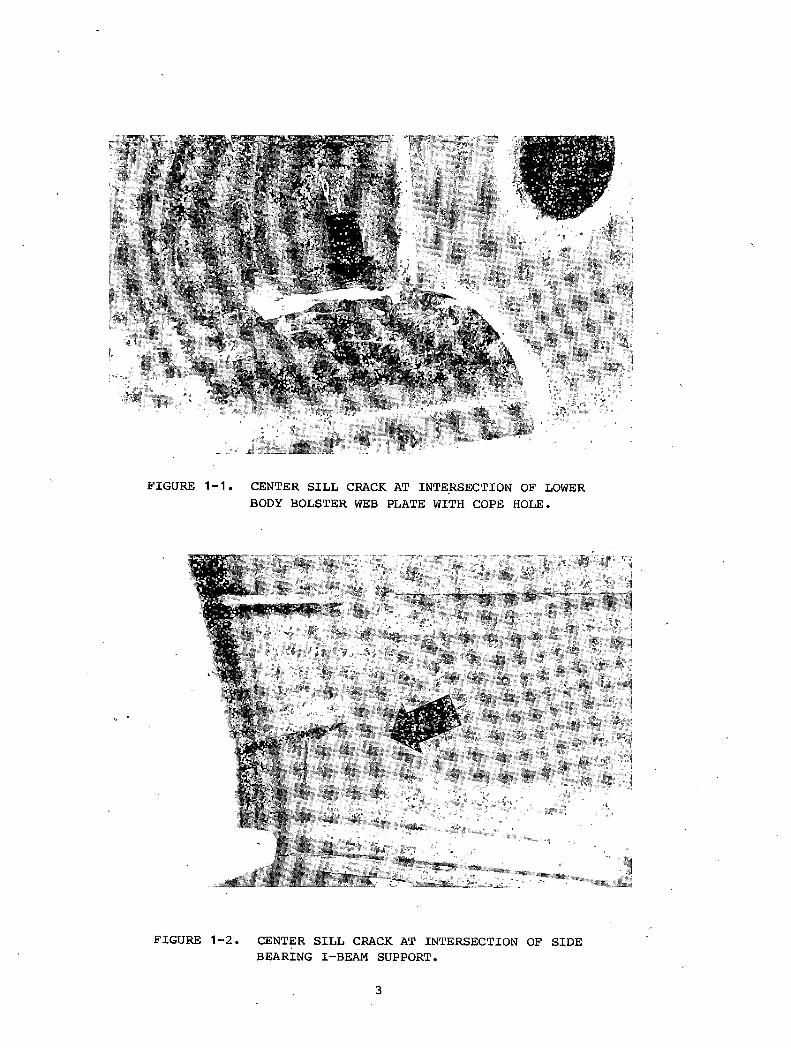
FIGURE 1-1. CENTER SILL CRACK AT INTERSECTION OF LOWER BODY BOLSTER WEB PLATE WITH COPE HOLE.
FIGURE 1-2. CENTER SILL CRACK AT INTERSECTION OF SIDE BEARING I-BEAM SUPPORT.
3
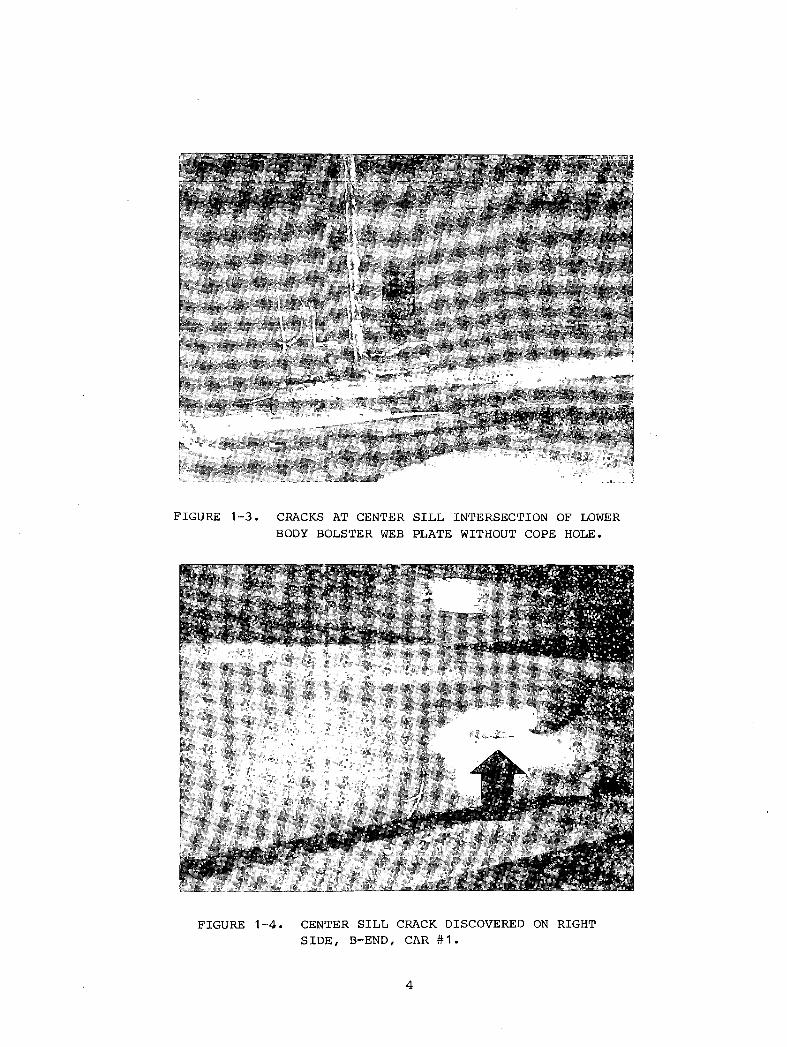
FIGURE 1-3. CRACKS AT CENTER SILL INTERSECTION OF LOWER BODY BOLSTER WEB PLATE WITHOUT COPE HOLE.
FIGURE 1-4. CENTER SILL CRACK DISCOVERED ON RIGHT SIDE, B-END, CAR #1.
4
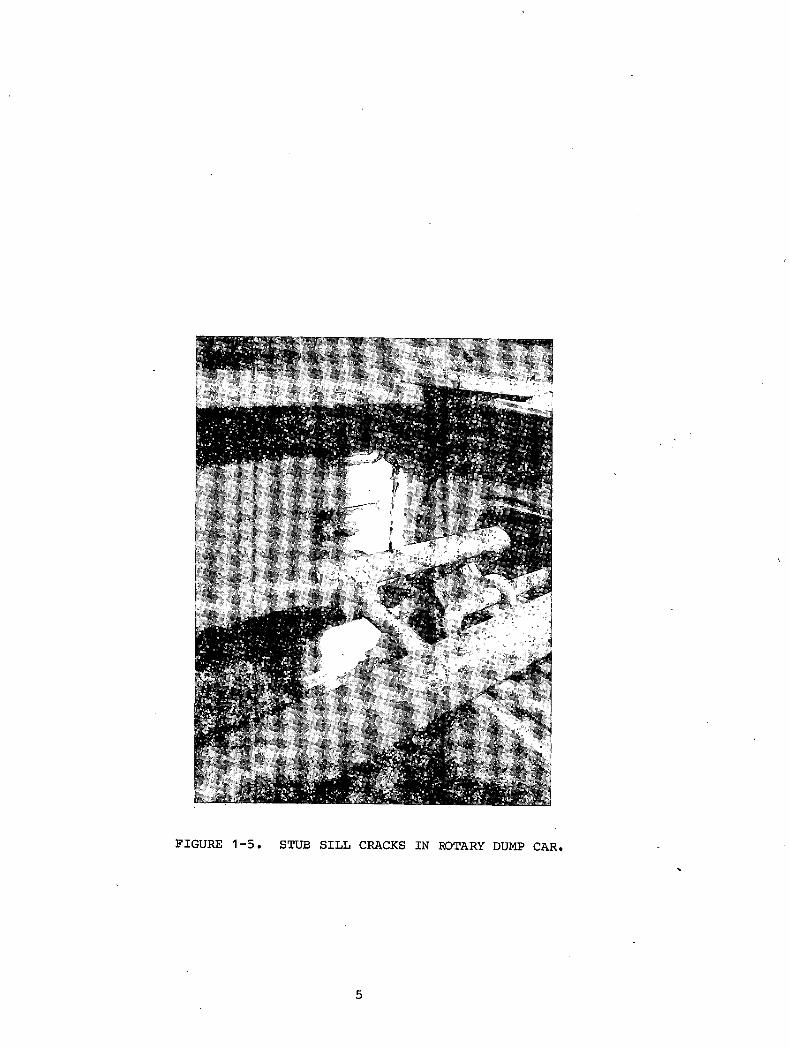
FIGURE 1-5. STUB SILL CRACKS IN ROTARY DUMP CAR.
5
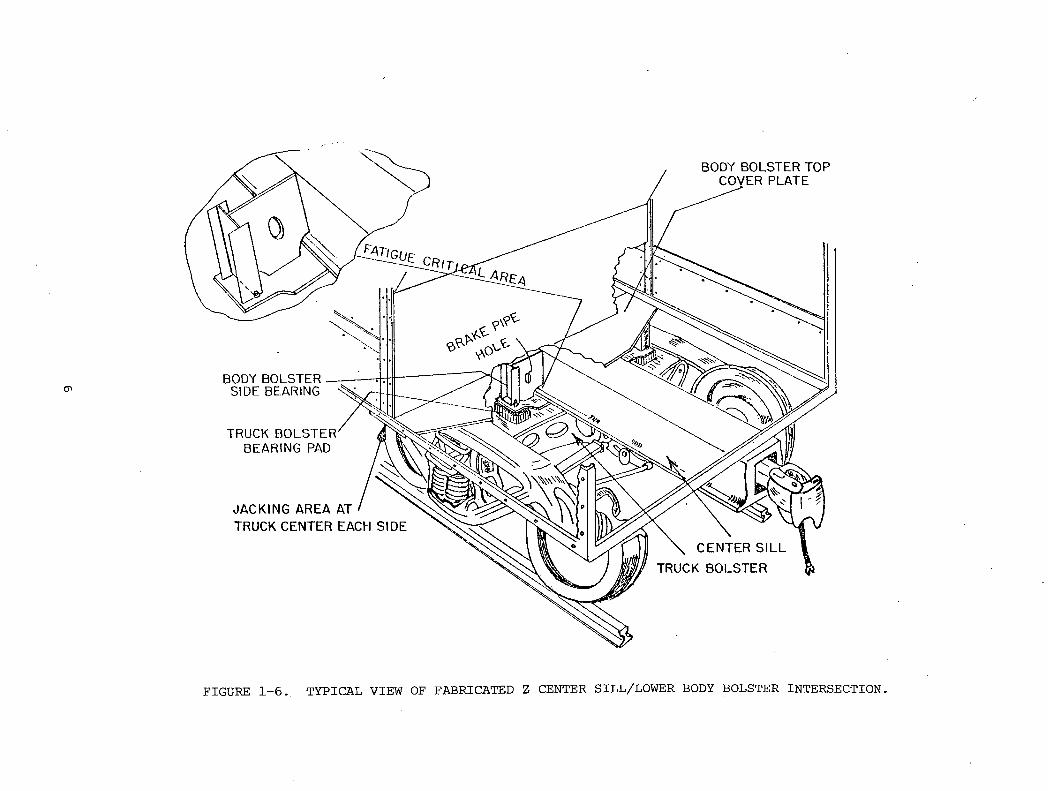
FIGURE 1-6. TYPICAL VIEW OF FABRICATED Z CENTER SILL/LOWER BODY BOLSTER INTERSECTION.
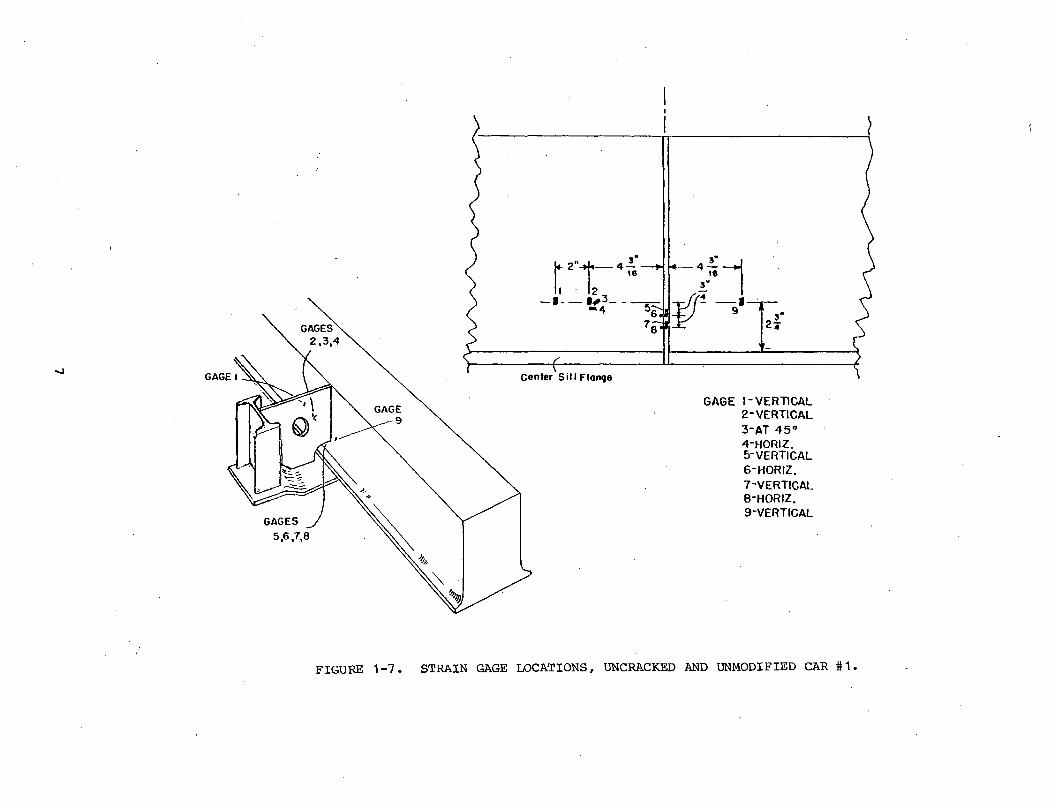
GAGE I-VERTICAL 2 - VERTICAL 3 *AT 4 5 °4 - HORIZ.5 - VERTICAL6 - HORIZ.7 - VERTICAL8 - HORIZ.9 - VERTICAL
<
FIGURE 1-7. STRAIN GAGE LOCATIONS, UNCRACKED AND UNMODIFIED CAR #1
-tr 10' 10
03
G A G E I - V E R T I C A L
2 - V E R T I C A L
3 - A T 4 5 °
4 - H O R I Z .5 - V E R T I C A L
6 - H 0 R I Z .
7 - V E R T I C A L
8 - H 0 R I Z .
9 - V E R T I C A L
FIGURE 1-8. STRAIN GAGE LOCATIONS, UNCRACKED AND MODIFIED CAR #2 (DOUBLER PLATE),
VO
I
7S i l l Flange
G A G E I - V E R T I C A L
2 - V E R T I C A L
3 - H O R I Z .
4 - H O R I Z .
5 - V E R T I C A L
6 - V E R T I C A L
7 - H O R I Z .
8 - V E R T I C A L
9 - H O R I Z .
FIGURE 1-9. STRAIN GAGE LOCATIONS, UNCRACKED MODIFIED CAR #3 (BOX ANGLE REINFORCEMENT).
I
FIGURE 1-10. STRAIN GAGE LOCATIONS, UNCRACKED MO DIFIED CAR #4 (VERTICAL BAR REDESIGN).
47
3"''
GAGE I-VERTICAL2- HORtZ.3- VERTICAL4- HORIZ.5- VERTICAL6- HORIZ.7- VERTICAL8- H0RIZ.
F IG U R E 1-11 STRAIN GAGE LOCATIONS, CRACKED UNMODIFIED CAR #5
2 - V E R T I C A L
3- AT45°4 - H O R I Z .5 - V E R T I C A L
At other three locations on Car lift not gaged, a vertical bar "fix Is Included at the lower body bolster Intersection in addition to C-PPP support structure i 1 1 us t ra ted.
FIGURE 1-12. STRAIN GAGE LOCATIONS, UNCRACKED MODIFIED CAR #6 (CENTER PLATE EXTENSION PAD, VERTICAL BAR SUPPORT).
\
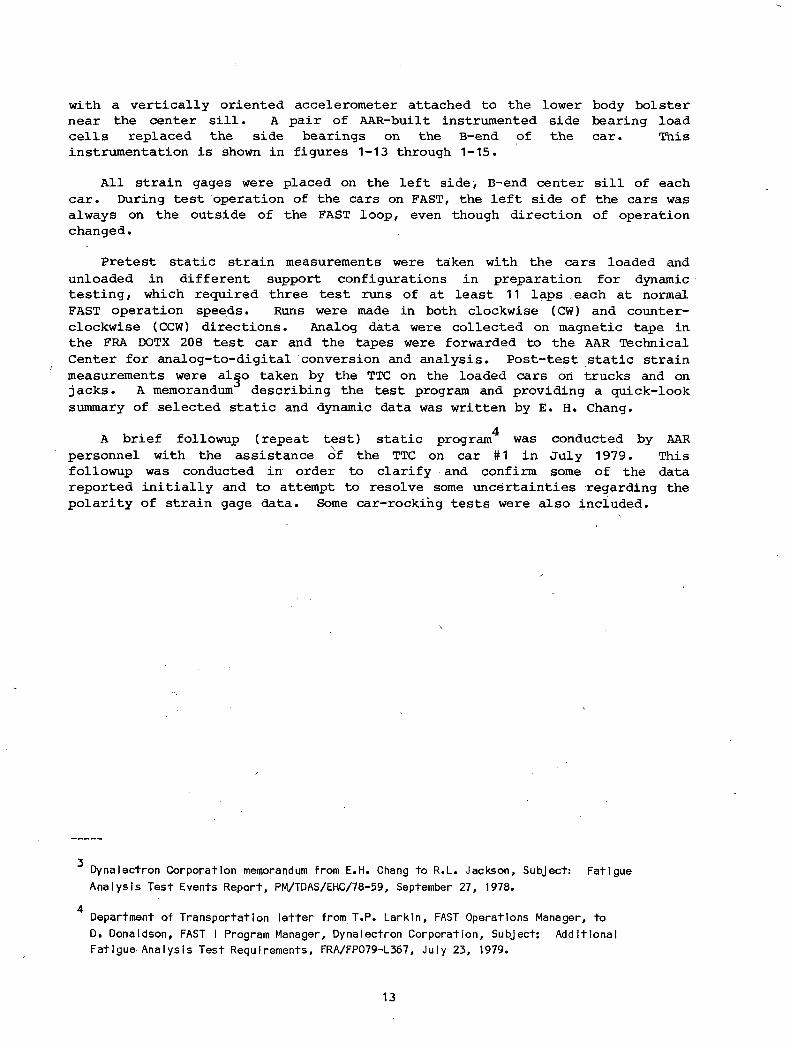
with a vertically oriented accelerometer attached to the lower body bolster near the center sill. A pair of AAR-built instrumented side bearing load cells replaced the side bearings on the B-end of the car. This instrumentation is shown in figures 1-13 through 1-15.
All strain gages were placed on the left side, B-end center sill of each car. During test operation of the cars on FAST, the left side of the cars was always on the outside of the FAST loop, even though direction of operation changed.
Pretest static strain measurements were taken with the cars loaded and unloaded in different support configurations in preparation for dynamic testing, which required three test runs of at least 11 laps each at normal FAST operation speeds. Runs were made in both clockwise (CW) and counterclockwise (CCW) directions. Analog data were collected on magnetic tape in the FRA DOTX 208 test car and the tapes were forwarded to the AAR Technical Center for analog-to-digital conversion and analysis. Post-test static strain measurements were algo taken by the TTC on the loaded cars oh trucks and on jacks. A memorandum0 describing the test program and providing a quick-look summary of selected static and dynamic data was written by E. H. Chang.
4A brief followup (repeat test) static program was conducted by AAR personnel with the assistance of the TTC on car #1 in July 1979. This followup was conducted in order to clarify and confirm some of the data reported initially and to attempt to resolve some uncertainties regarding the polarity of strain gage data. Some car-rocking tests were also included.
Dynalectron Corporation memorandum from E.H. Chang to R.L. Jackson, Subject: FatigueAnalysis Test Events Report, PM/TDAS/EHC/78-59, September 27, 1978.
Department of Transportation letter from T.P. Larkin, FAST Operations Manager, to D. Donaldson, FAST I Program Manager, Dynalectron Corporation, Subject: AdditionalFatigue Analysis Test Requirements, FRA/FP079-L367, July 23, 1979.
13
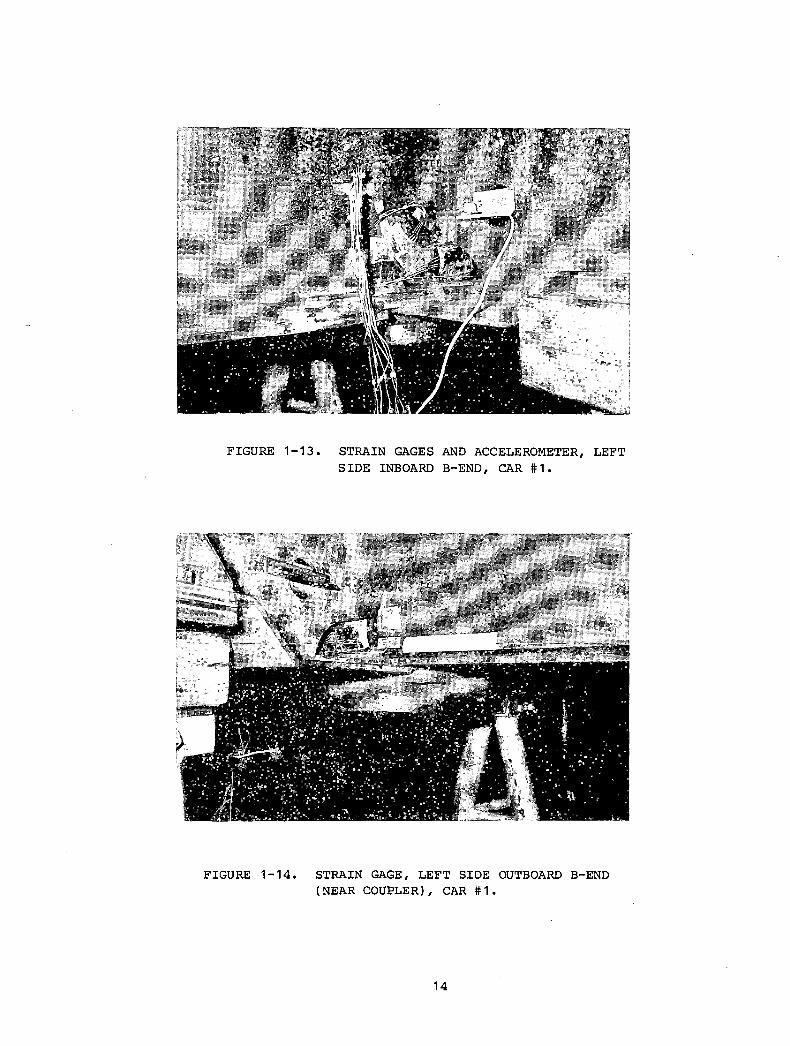
FIGURE 1-13. STRAIN GAGES AND ACCELEROMETER, LEFT SIDE INBOARD B-END, CAR #1.
FIGURE 1-14. STRAIN GAGE, LEFT SIDE OUTBOARD B-END (NEAR COUPLER), CAR #1.
14
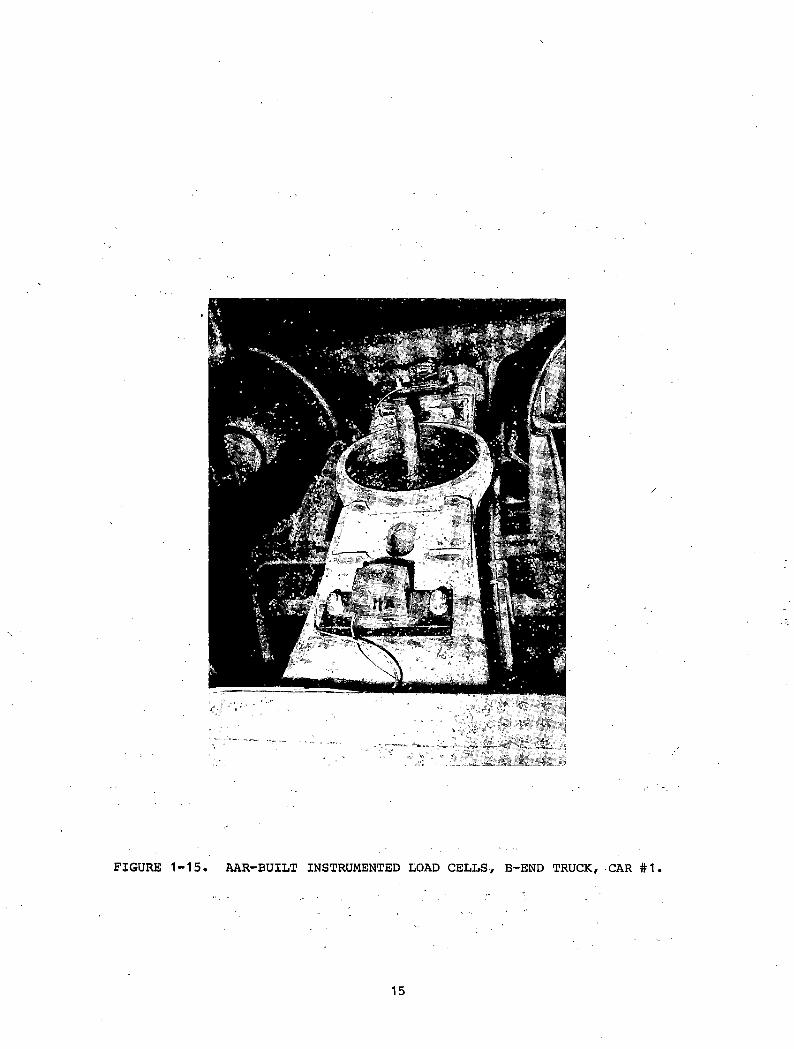
FIGURE -15. AAR-BUILT INSTRUMENTED LOAD CELLS, B-END TRUCK, CAR #1
15
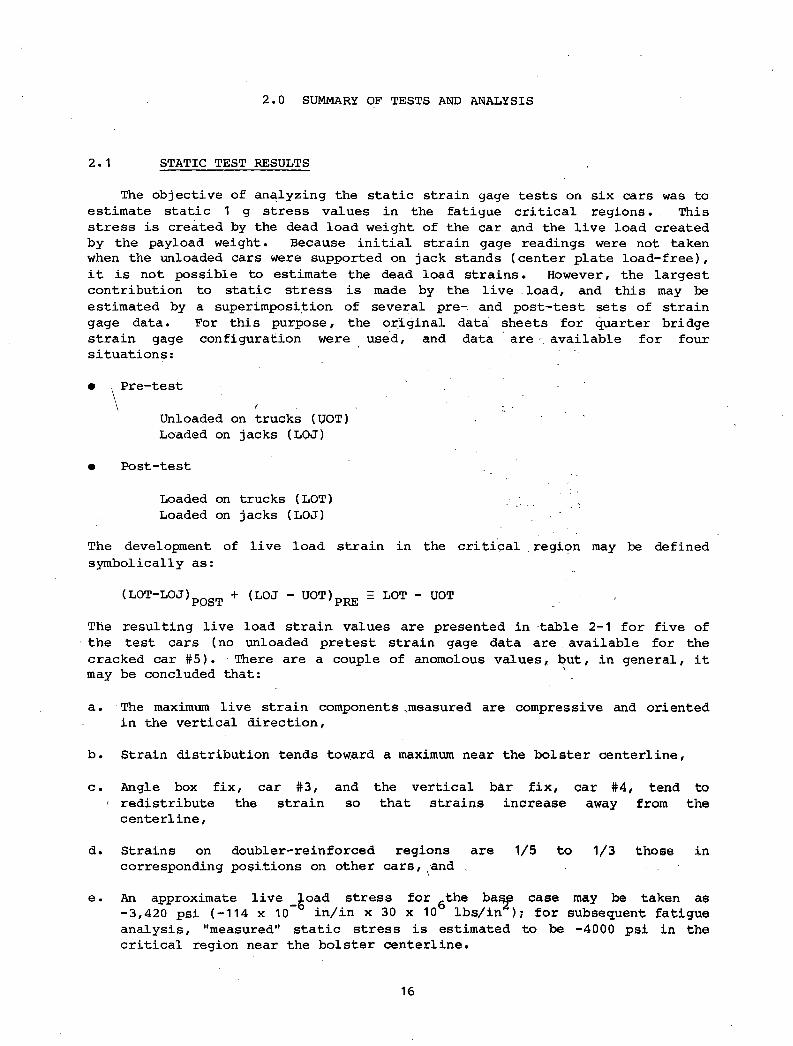
2.0 SUMMARY OF TESTS AND ANALYSIS
2.1 STATIC TEST RESULTS
The objective of analyzing the static strain gage tests on six cars was to estimate static 1 g stress values in the fatigue critical regions. This stress is created by the dead load weight of the car and the live load created by the payload weight. Because initial strain gage readings were not taken when the unloaded cars were supported on jack stands (center plate load-free), it is not possible to estimate the dead load strains. However, the largest contribution to static stress is made by the live load, and this may be estimated by a superimposition of several pre- and post-test sets of strain gage data. For this purpose, the original data sheets for quarter bridge strain gage configuration were used, and data are available for four situations:
• . Pre-test\ < ■Unloaded on trucks (UOT) ,
Loaded on jacks (LQJ)
• Post-test
Loaded on trucks (LOT)Loaded on jacks (LOJ)
The development of live load strain in the critical region may be defined symbolically as:
(LOT-LOJ)pQST + (LOJ - UOT)pRE E LOT - UOT ,
The resulting live load strain values are presented in table 2-1 for five of the test cars (no unloaded pretest strain gage data are . available for the cracked car #5). There are a couple of anomolous values, but, in general, it may be concluded that:
a. The maximum live strain components ^measured are compressive and oriented in the vertical direction,
b. Strain distribution tends toward a maximum near the bolster centerline,
c. Angle box fix, car #3, and the vertical bar fix, car #4, tend to< redistribute the strain so that strains increase away from thecenterline,
d. Strains on doubler-reinforced regions are 1/5 to 1/3 those incorresponding positions on other cars, and . •
e . An approximate live load stress for gthe bagj^ case may be taken as-3,420 psi (-114 x 10 in/in x 30 x 10® lbs/in ); for subsequent fatigue analysis, "measured" static stress is estimated to be -4000 psi in the critical region near the bolster centerline.
16
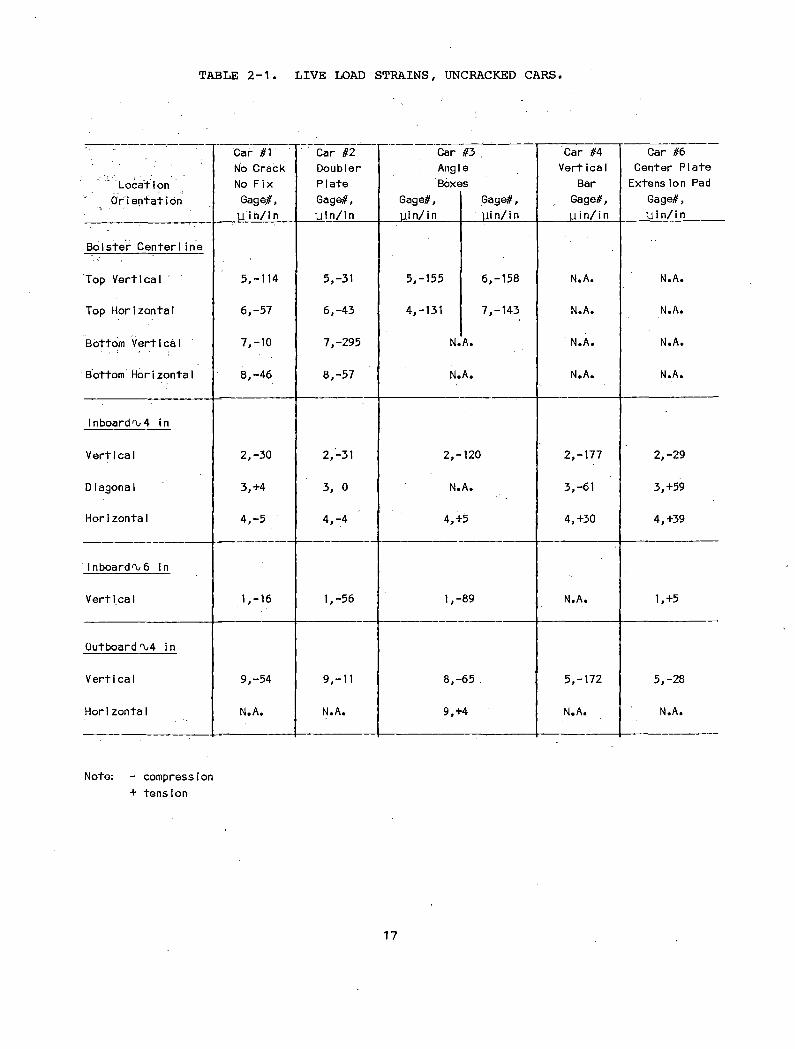
TABLE 2-1 LIVE LOAD STRAINS, UNCRACKED CARS
.... LocationOrientati on
Car #1 No Crack No Fix Gage#,
U in/in
Car #2DoublerPlateGage#,Uin/in
Car Ang 1 Boxc
Gage#,Uin/in
#3 . e
!S
Gage#, Uin/in
Car #4 Vert ica1
Bar Gage#, Uin/in
Car #6Center Plate
Extension Pad Gage#, Uin/in
Bolster Center I ine
Top Vertical 5,-114 5,-31 5,-155 6,-158 N.A. N.A.
Top Horizontal 6,-57 6,-43 4,-131 7,-143 N.A. N.A.
Bottom Vertical 7,-10 7,-295 N.A. N.A. N.A.
Bottom’Hor i zontaI 8,-46 8,-57 N.A. N.A. N.A.
Inboard0/4 in
V ert i caI 2,-30 2,-31 2,- 120 2,-177 2,-29
Diagonal 3,+4 3, 0 N.A. 3,-61 3,+59
HorIzontaI 4,-5 4,-4 4,+5 4,+30 4,+39
I nboardo 6 i n
V ert i caI 1,-16 1,-56 1,- 89 N.A. 1.+5
Outboard 0/4 in
V ert i caI 9,-54 9,-11 8,- 65 . 5,-172 5,-28
Hori zontaI N.A. N.A. 9,+4 N.A. N.A.
Note: - compression+ tension
17
In view of the limited number of gages, lack of gages on the inside center sill web to detect bending, and the indirect nature of the computational derivation, analysis of these conclusions are really only indications. The data show that the large strain ranges produced during FAST operation dominate the fatigue analysis. The rectangular strain gage rosette position 4" inboard* of the bolster centerline and on a level with the potential crack path is the only location where a corresponding state of stress may be inferred. The principal stress calculated for this location is -1,324 psi, oriented 30 from the vertical, and the other principal stress is -176 psi. Noticeably, the measured live load strain or stress increment is compressive, in contrast to the tensile strain peaks recorded in dynamic tests, and corresponding tensile stresses in certain finite element model studies (discussed in later sections)'.
Because recorded gage polarity is uncertain, some aspects of the static post-test were repeated in July 1979 on ca r #1 in the Center Seryices Building, Transportation Test Center (TTC)• The original gages on the B-end of the car were, found to be still operative. In addition, five gages were applied at the A-end of the car on the right side (figure 2-1). These gages included two horizontal gages placed on each side of the bolster web, 1/2" above the cope hole and 1/2" from the center sill.
The results of the original post-test, in terms of strain increment for transfer of the loaded car from jack support to truck support, are listed in table 2-2 for all six cars. The results of the retest are given in table 2-3 for car #1. To facilitate comparison, the original values for car #1 are represented in the right column. Although these, values are not identical, they are judged to be a substantial confirmation of the original values.
Uncertainty still'remains, however, because the center sill of car #1 was discovered to have cracked after the original test. In addition to the center sill web crack on the right side of the B-end (figure 1-4), the low profile center plate weld was found to be cracked on both sides of the A-end of the car (figure 2-2).
\
2.2 CAR-ROCKING TEST RESULTS
In addition to repeating the original static post-tests, several tests that involved edge-loading of the center plate by various means were conducted in July 1979. These additional tests were inspired by the desire to simulate some aspects of the dynamic tests which may have contributed to the' critical range of fatigue stresses.
Cracks in the fabricated center sills of cars of similar design have been reported in some cyclic "rocking" tests. Edge-loading and rocking tests to two million cycles, using 100-ton hopper cars, have also been described in
* Away from coupler.
18
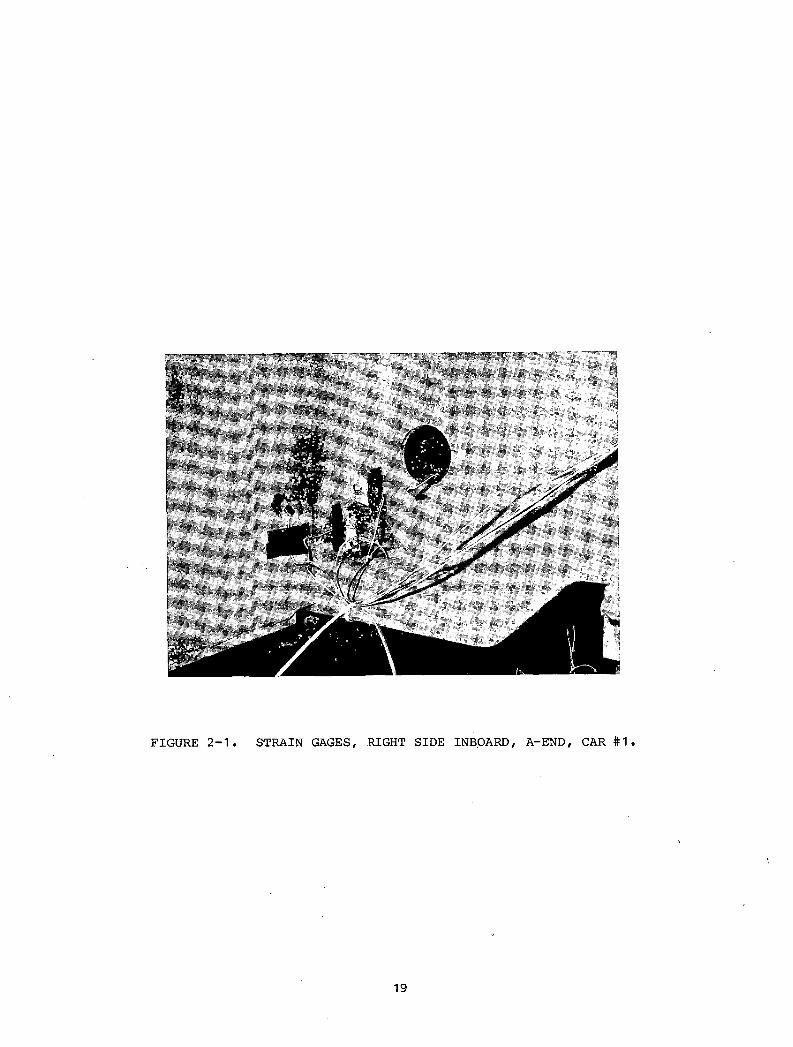
FIGURE 2-1. STRAIN GAGES, RIGHT SIDE INBOARD, A-END, CAR #1.
I
19
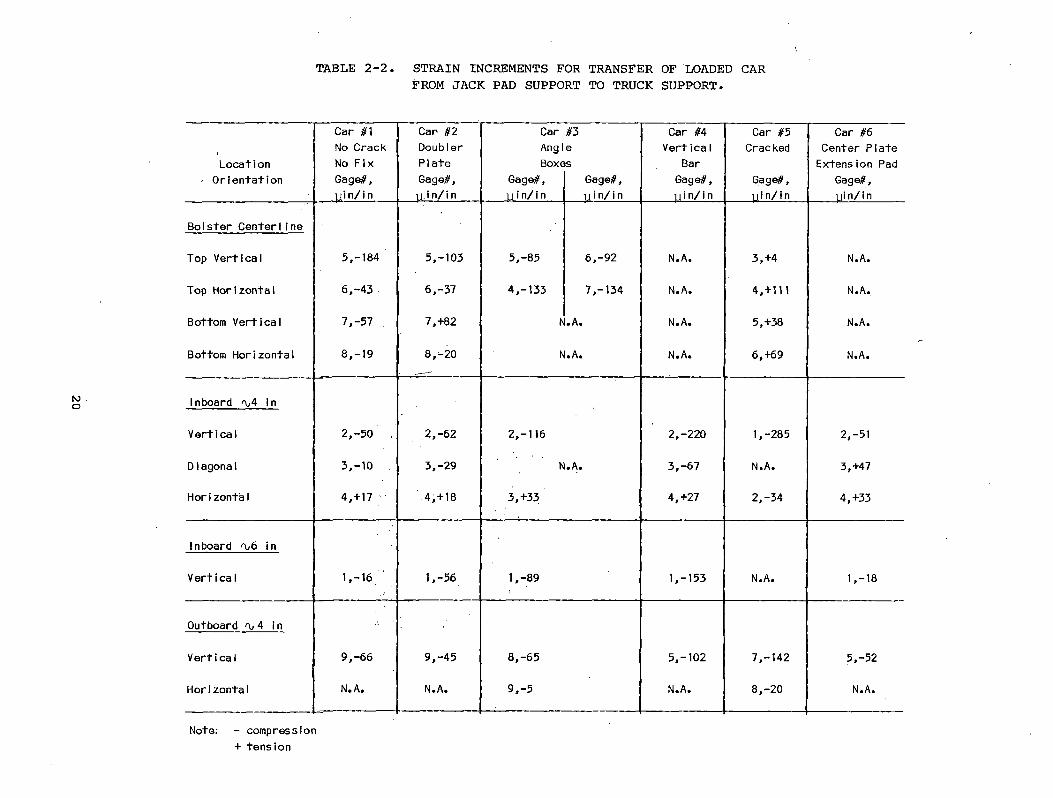
TABLE 2-2. STRAIN INCREMENTS FOR TR AN SF ER OF LOADED CARFR OM J A C K PAD SUPPORT TO TR UC K SUPPORT.
/Location
- Orientation
Car #1 No Crack No Fix Gage#, uin/in
Car- #2 Doubler Plate Gage#, yin/in
Car Angl Boxe
Gage#, yin/in
#3es
Gage#,yin/in
Car #4 Vert ica I
Bar Gage#, yin/in
Car #5 Cracked
Gage#, uin/in
Car #6Center Plate Extension Pad
Gage#, uin/in
Bolster Centerline
Top Vertical 5,-184 5,-103 5,-85 6,-92 N.A. 3,+4 N.A.
Top Horizontal 6,-43 6,-37 4,-133 7,-134 N.A. 4,+111 N.A.
Bottom Vertical 7,-57 7,+82 N• A. N.A. 5,+38 N.A.
Bottom Horizontal 8,-19 8,-20 N.A. N.A. 6,+69 N.A.
Inboard Oi4 in
Vertica 1 2,-50 2,-62 2,-116 2,-220 1,-285 2,-51
D iagona1 3,-10 3,-29 N.A. 3,-67 N.A. 3,+47
Hor i zonta1 4,+ 17 .4,+18 3,+33 4,+27 2,-34 4,+33
Inboard 0.6 in
Vertical 1,-16 1,-56 1,-89 1,-153 N.A. 1,-18
Outboard 4 in
V ert i ca1 9,-66 9,-45 8,-65 5,-102 7,-142 5,-52
Horizontal N.A. N.A. 9,-5 N.A. 8,-20 N.A.
Note: - compression+ tension
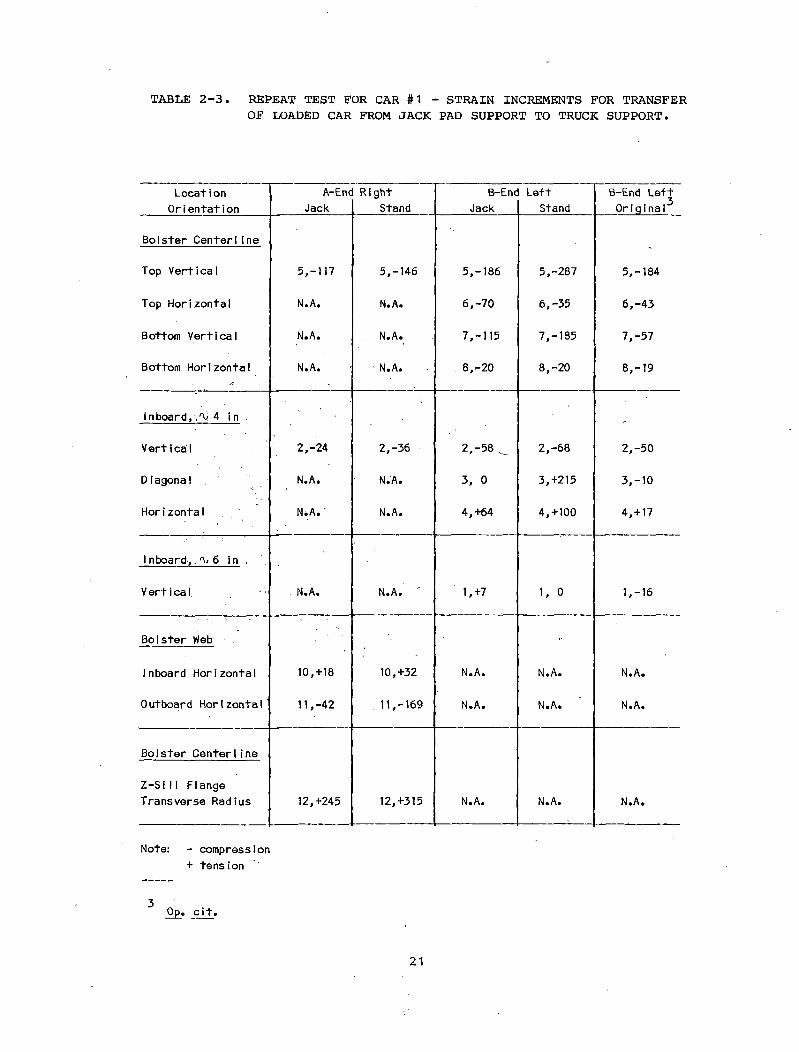
TA BL E 2-3 REPEAT TEST FOR CAR #1 - STRAIN INCREMENTS FOR TRANSFEROF LOADED CAR FROM J A C K PAD SUPPORT TO TR UC K SUPPORT.
LocationOrientation
A-EndJack
RightStand
B-Enc!Jack
LeftStand
B-End Left Original
Bolster Centerline
Top Vert i ca I 5,-117 5,-146 5,-186 5,-287 5,-184
Top Horizontal N.A. N.A. 6,-70 6,-35 6,-43
Bottom Vertical N.A. N.A. 7,-115 7,-185 7,-57
Bottom Horizontal N.A. N.A.
0CM1CO 0CM1CO 8,-19
In board,, 'O 4 in
Vertical 2,-24 2,-36 2,-58 ̂ 2,-68 2,-50
Diagonal N.A. N.A. 3, 0 3,+215 3,-10
Horizontal N.A. ' N.A. 4,+64 4,+100 4,+ 17
Inboard, , 0.6 in .
V ert i ca I . N.A. N.A. ' 1,+7 1, o 1,-16
Bolster Web
In boa rd Hor i zonta i 10,t18 10,+32 N.A. N.A. N.A.
0 utboard Hor i zontaI 11,-42 11,-169 N.A. N.A. N.A.
Bolster Centerline
Z-Si11 Flange Transverse Radius 12,t245 12,+315 N.A. N.A. N.A.
Note: - compression+ tension '
Op. cit.
21
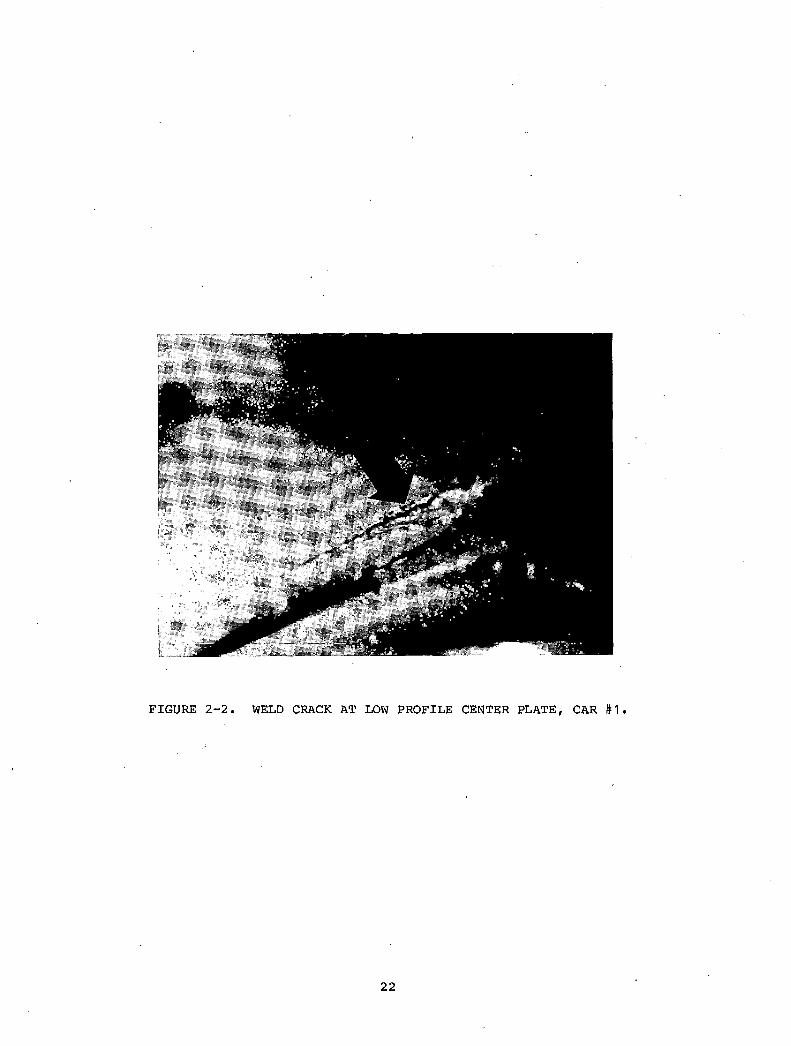
FIGURE 2-2. WELD CRACK AT LOW PROFILE CENTER PLATE, CAR (M .
22
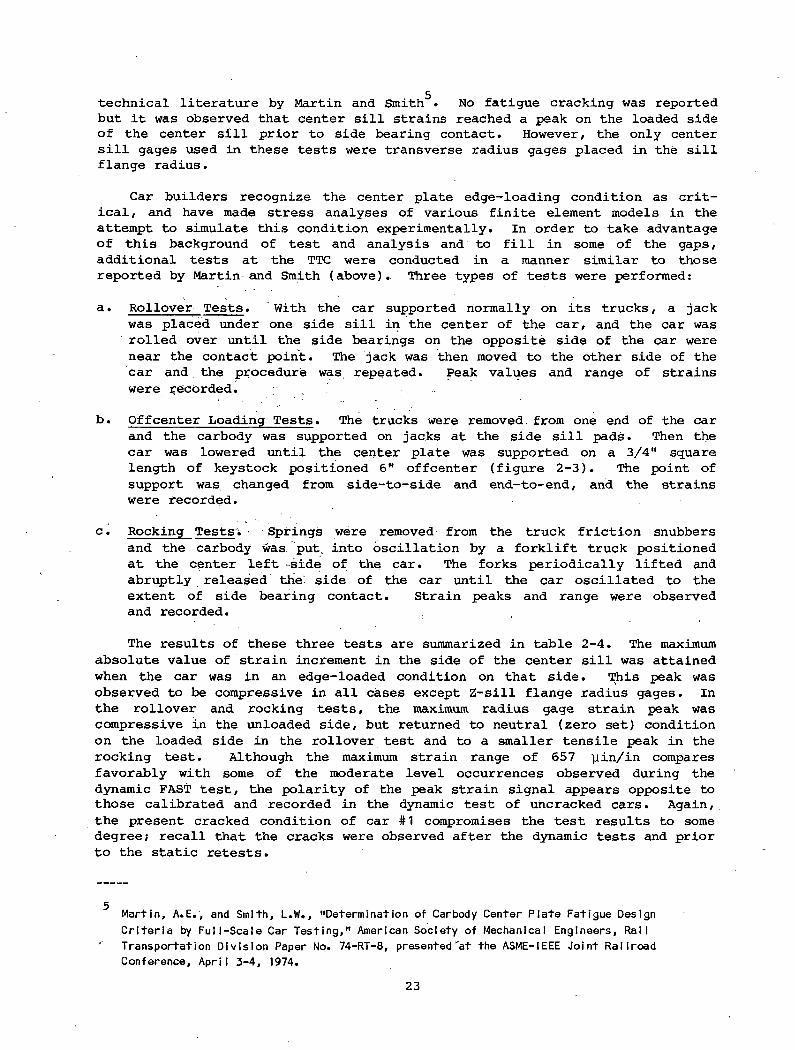
technical literature by Martin and Smith . No fatigue cracking was reported but it was observed that center sill strains reached a peak on the loaded side of the center sill prior to side bearing contact. However, the only center sill gages used in these tests were transverse radius gages placed in the sill flange radius.
Car builders recognize the center plate edge-loading condition as critical, and have made stress analyses of various finite element models in the attempt to simulate this condition experimentally. In order to take advantage of this background of test and analysis and to fill in some of the gaps, additional tests at the TTC were conducted in a manner similar to those reported by Martin-and Smith (above). Three types of tests were performed:
a. Rollover Tests. With the car supported normally on its trucks, a jack was placed under one side sill in the center of the car, and the car was rolled over until the side bearings on the opposite side of the car were near the contact point. The jack was then moved to the other side of the car and the procedure was repeated. Peak values and range of strains were recorded.
b. Offcenter Loading Tests. The trucks were removed from one end of the car and the carbody was supported on jacks at the side sill pads. Then the car was lowered until the center plate was supported on a 3/4" square length of keystock positioned 6" offcenter (figure 2-3). The point of support was changed from side-to-side and end-to-end, and the strains were recorded.
c. Rocking Tests; Springs were removed from the truck friction snubbers and the carbody was put, into oscillation by a forklift truck positioned at the center left side of the car. The forks periodically lifted and abruptly released the side of the car until the car oscillated to the extent of side bearing contact. Strain peaks and range were observed and recorded.
The results of these three tests are summarized in table 2-4. The maximum absolute value of strain increment in the side of the center sill was attained when the car was in an edge-loaded condition on that side. This peak was observed to be compressive in all cases except Z-sill flange radius gages. In the rollover and rocking tests, the maximum radius gage strain peak was compressive in the unloaded side, but returned to neutral (zero set) condition on the loaded side in the rollover test and to a smaller tensile peak in the rocking test. Although the maximum strain range of 657 yin/in compares favorably with some of the moderate level occurrences observed during the dynamic FAST test, the polarity of the peak strain signal appears opposite to those calibrated and recorded in the dynamic test of uncracked cars. Again, the present cracked condition of car #1 compromises the test results to some degree; recall that the cracks were observed after the dynamic tests and prior to the static retests.
5
Martin, A.E., and Smith, L.W., "Determination of Carbody Center Plate Fatigue Design Criteria by Full-Scale Car Testing," American Society of Mechanical Engineers, Rail Transportation Division Paper No. 74-RT-8, presented"at the ASME-IEEE Joint Railroad Conference, April 3-4, 1974.
23
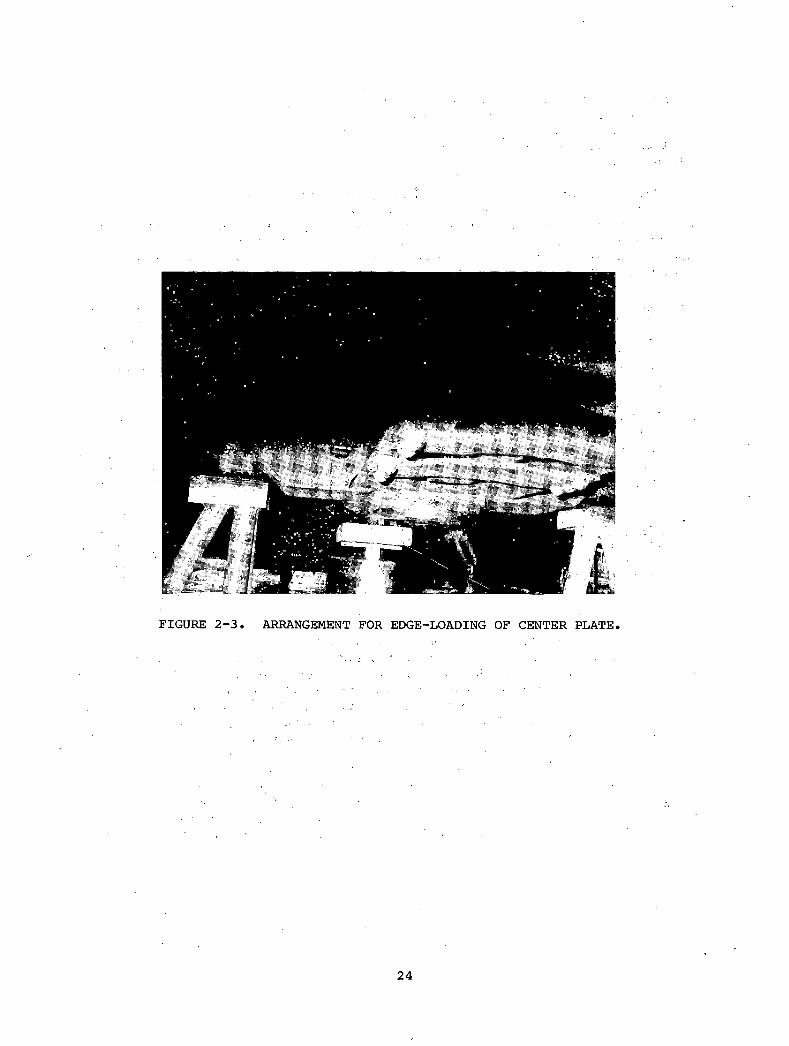
FIGURE 2-3. ARRANGEMENT FOR EDGE-LOADING OF CENTER PLATE.
24
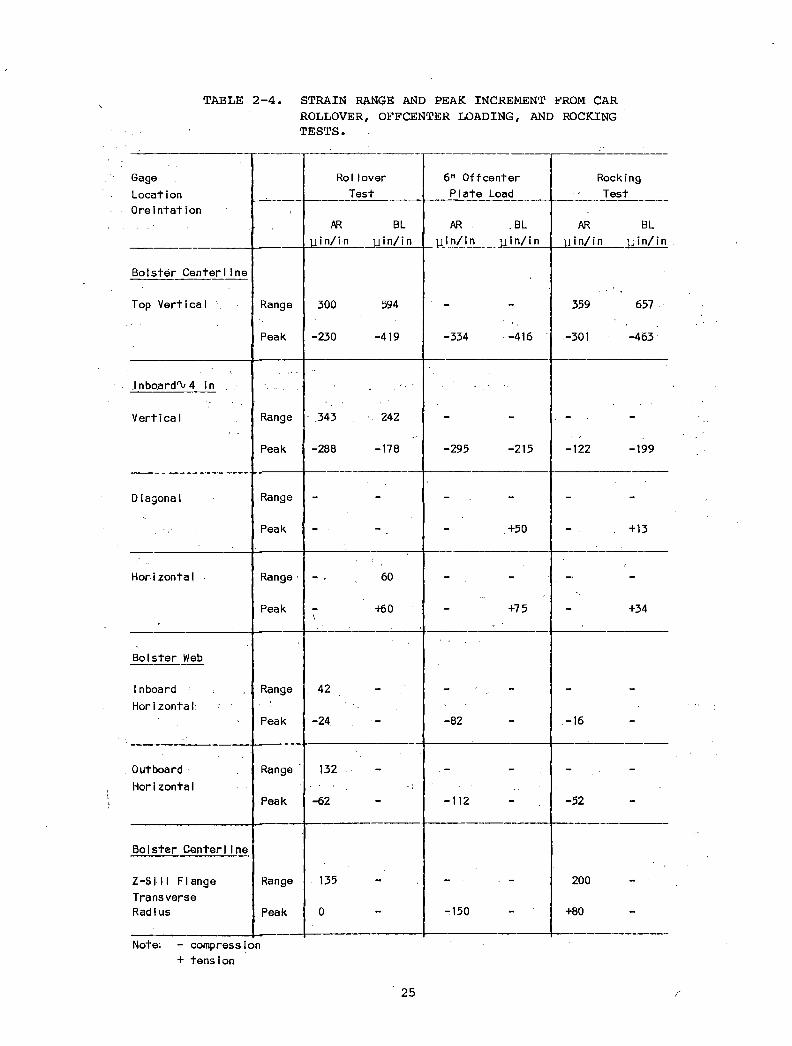
TABLE 2-4. STRAIN RANGE AND PEAK INCREMENT FROM CAR ROLLOVER, OFFCENTER LOADING, AND ROCKING TESTS.
GageLocationOreintation
Rollover Test
6" Offcenter Plate Load
RockingTest
1AR BL
uin/in uin/inAR .BL
uin/in uin/inAR BL
uin/in uin/in
Bolster Centerline
Range
Peak
300 594
-230 -419 -334 -416
359 657
-301 -463
Top Vertical
Inboard'W in ,
V ert i ca 1 Range
Peak
343 242
-288 -178 -295 -215 -122 -199
Diagonal Range
Peak - ■ +50 +13
Hor i zonta1 Range
Peak
60
+60 +75 +34
Bolster Web
1nboard Horizontal:
Range
Peak
42
-24 -82 -16
OutboardHorizontal
Range '
Peak
132 -
-62 -112 -52
Bolster Center 1ine
Range
Peak
135
0 -150
200
+80
Z-Sill FlangeTransverseRadius
Note; - compression + tension
r25
2.3 DYNAMIC TEST RESULTS
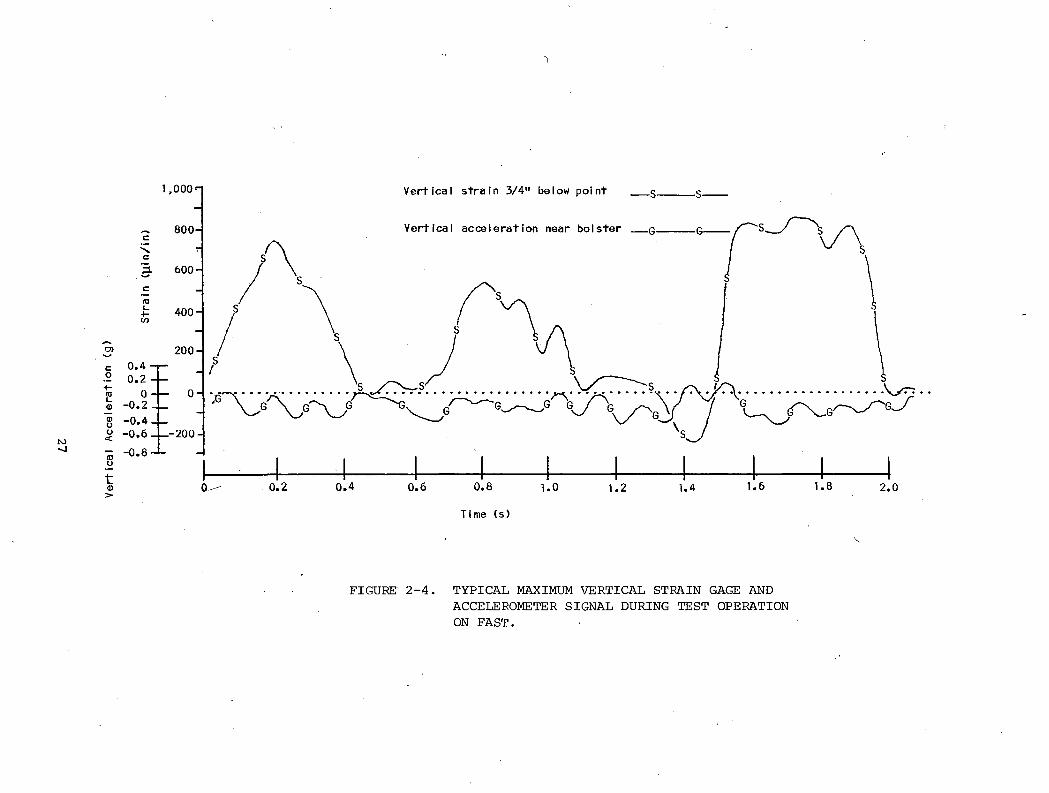
The most striking feature of the transducer output from the FAST operation is the high-peak, cyclic-sustained activity of vertically oriented strain gages in the fatigue-critical region. This is illustrated in figure 2-4, which presents a brief, but typical, period for the unmodified car #1. The strain history for the three most active strain gages and the vertical accelerometer history were plotted for a FAST consist operation passing through Section 10 in the counterclockwise direction at a speed of approximately 37 mi/h.
The period of the dominant peaks shown is representative of those that occurred throughout the run on a frequency of 1 to 2 Hz. They do not correlate with the side bearing strikes that occurred only a few times around the loop, nor do they appear to correlate in any obvious way with peaks or frequency of the vertical accelerometer output.
Figure 2-5 provides similar strain and acceleration history during a relatively rare side bearing strike. Note the compressive strain on the edge- loaded side of the center sill during the strike. Conversely, the tensile strain peak occurs on the side opposite that being edge-loaded. This event appears to be consistent with compressive strain observations in the static tests.
A comparative overview of the dynamic strain behavior of the six cars is provided in tables 2-5 and 2-6. Table 2-5 lists the percentage occurrence of peak dynamic strains from the vertical gage on the center sill web at centerline of the bolster. Not all the cars had this position gaged, but those having gages within 3/4" of the apparent point of crack initiation are given. Table 2-6 provides the same data for the vertical gage located 4" from the bolster centerline in the path of a potential crack. On most cars, the rectangular strain rosette was placed at this same point.
These percentage occurrence values (within specified levels) are based on peak and valley founts of the strain history obtained as part of the Fatigue Analysis Program.
Although the peak occurrence tables do not contain critical range information explicitly, they do provide a valuable quick comparison of the various cars; maximum ranges of strain are observed to have occurred in car #1. Table 2-7 gives^a more complete picture of minimum-maximum ranges based on the rainflow count of strain peaks and valleys. The data are converted to stress values by multiplying the strain values by a modulus of 30 x 10° psi. Note that stress ranges as high as 30,000 psi are not uncommon in car #1.
Zarembskl, A.M. and Sobash, V., User's Guide to Fatigue L ife Analysis Program (FLAP). Association of American Railroads, Report No. R-273, July, 1977.
Zarembskl, A.M., "Freight Car Environmental Characterization for Fatigue Life Analysis," Track/Traln Dynamics and Design, Association of American Railroads Report No. R-289, edited by G.J. Moyar, W.D. Pllkey, and B.F. Pilkey, Pergamon Press, Inc. (1978), p. 205.
26
(U!/U
|rl) ujBj+s
V
FIGURE 2-4. TYPICAL MAXIMUM VERTICAL STRAIN GAGE ANDACCELEROMETER SIGNAL DURING TEST OPERATION ON FAST.
Vert
ical
Ac
cele
rati
on (g)
T ime Cs)
FIGURE 2-5. MAXIMUM VERTICAL STRAIN, ACCELEROMETER, AND LOADCELL SIGNAL DURING SIDE BEARING STRIKE OCCURRENCE.
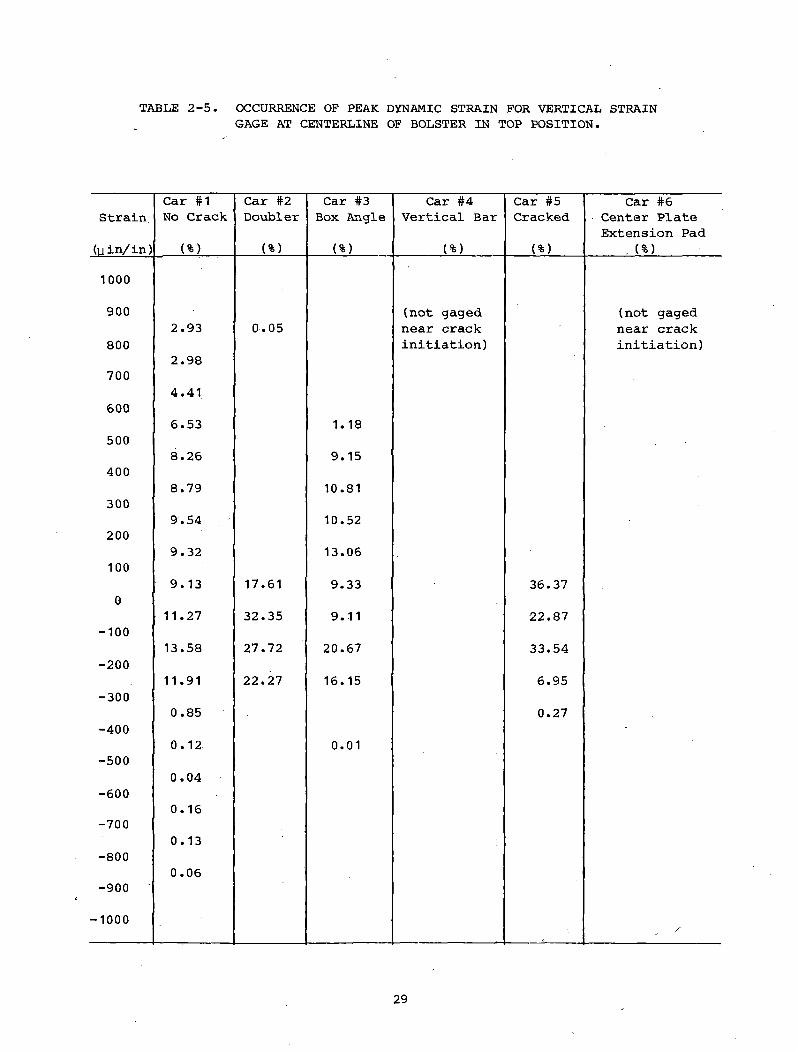
TABLE 2-5 OCCURRENCE OF PEAK DYNAMIC STRAIN FOR VERTICAL STRAIN GAGE AT CENTERLINE OF BOLSTER IN TOP POSITION.
Car #1 Car #2 Car #3 Car #4 Car #5 Car #6Strain No Crack Doubler Box Angle Vertical Bar Cracked Center Plate
Extension Pad(uin/in) (%) (%) (%) (%) (%) . (%)
1000
900 (not gaged (not gaged2.93 0.05 near crack near crack
8002.98
initiation) initiation)
7004.41
6006.53 1.18
5008.26 9.15
4008.79 10.81
3009.54 10.52
2009.32 13.06
1009.13 17.61 9.33 36.37
011.27 32.35 9.11 22.87
-10013.58 27.72 20.67 33.54
-20011.91 22.27 16.15 6.95
-3000.85 0.27
-4000.12 0.01
-5000.04
-6000.16
-7000.13
-8000.06
-900
-1000
29
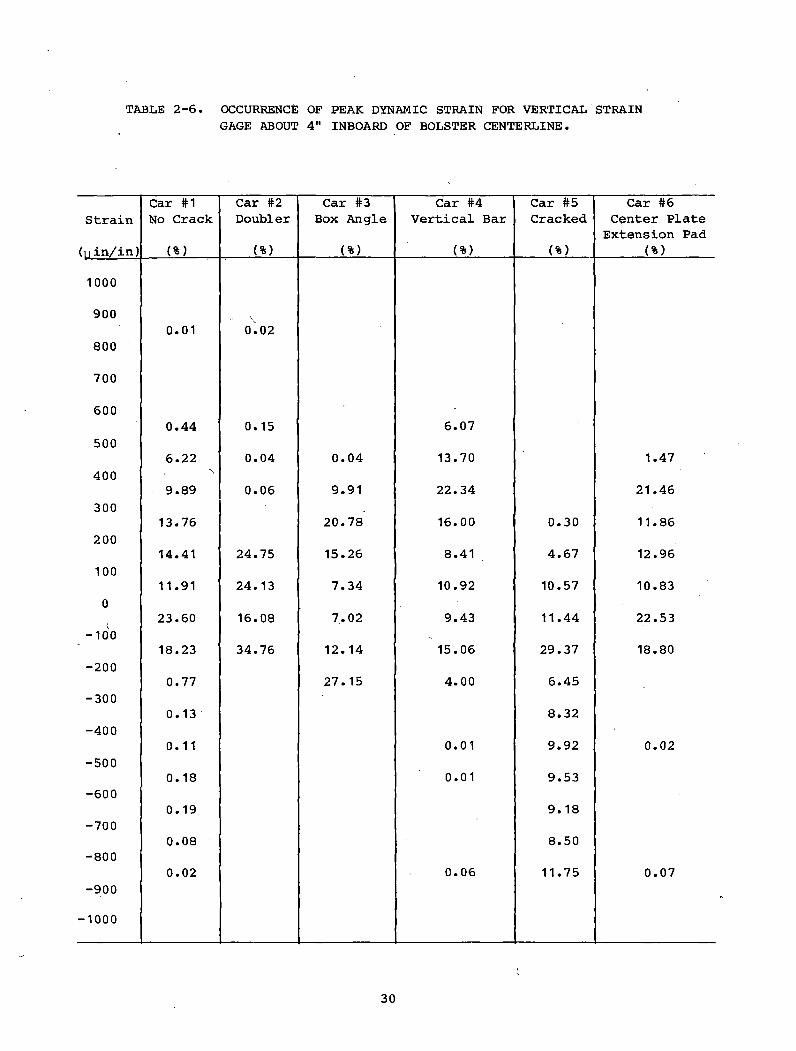
TABLE 2-6. OCCURRENCE OF PEAK DYNAMIC STRAIN FOR VERTICAL STRAIN GAGE ABOUT 4" INBOARD OF BOLSTER CENTERLINE.
Car #1 Car #2 Car #3 Car #4 Car #5 Car #6Strain No Crack Doubler Box Angle Vertical Bar Cracked Center Plate
Extension Pad(uin/in) (%) (%) (%) (%) (%) (%)
1000
900 \0.01 0.02
800
700
600 -0.44 0.15 6.07
5006.22 0.04 0.04 13.70 1.47
4009.89 0.06 9.91 22.34 21.46
30013.76 20.78 16.00 0.30 11.86
20014.41 24.75 15.26 8.41 4.67 12.96
10011.91 24.13 7.34 10.92 10.57 10.83
0
-10023.60 16.08 7.02 9.43 11.44 22.53
18.23 34.76 12.14 15.06 29.37 18.80-200
0.77 27.15 4.00 6.45-300
0.13 8.32-400
0.11 0.01 9.92 0.02-500
0.18 0.01 9.53-600
0.19 9.18-700
0.08 8.50-800
0.02 0.06 11.75 0.07-900
-1000
30
Maximum Peak Center Sill Web Stress
(psi)
TABLE 2-7. REPOS, CENTER SILL WEB VERTICAL STRESS BASED ON EXTRAPOLATION OF MEASURED STRAIN, CAR #1.
Minimum Peak Center Sill Web Stress (psi)
-30,00030 27, 24, 21, 18, 15, 12, 9, 6, 3,
- 3,- 6, - 9, -12, -15, -18, -21, -24, -27, -30,
0000000000000000000000000000000000000000000000000000000000000
-24,000 2 3
-184
,000 -12,6 000 -6,000 6,00010 11 12 1312,000
14 1518,000
16 1724,000 18 19
30,000200.009 0.182 0.409 0.510 0.991 1.155 0.355 0.064 0.055 0.027 0.027 0.064 0.055 0.164 0.300
0.014 0.719 0.241 0.291 1.410 0.664 0.073 0.027 0.036 0.073 0.064 0.282 0.255 0.0360.023 1.010 0.646 0.491 1.028 1.024 0.346 0.364 0.182 0.182 0.419 0.646 0.064
1.428 1.592 0.573 0.828 0.955 0.664 0.537 0.382 0.573 0.955 0.0450.018 1.274 2.825 1.128 0.487 0.801 1.192 0.710 1.365 1.565 0.1180.018 0.628 3.285 2.593 0.519 0.173 0.946 1.592 1.792 0.1090.036 0.605 2.548 2.730 1.155 0.637 1.474 2.202 0.1910.055 0.273 1.729 2.811 2.083 1.729 2.957 0.227
0.009 0.009 0.091 0.900 0.792 1.792 2.930 4.422 0.3180.009 0.009 0.064 0.637 0.937 1.911 6.715 0.555
0.009 0.009 0.009 0.646 0.509 2.038 0.6640.009 0.036 0.018 0.009 0.036 0.446 1.847 0.1550.018 0.036 0.018 0.018 0.646 0.4190.018 0.055 0.036 0.036 0.0180.009 0.009 0.018 0.055
0.007 0.027 0.018 0.0360.045 0.0270.032 0.009
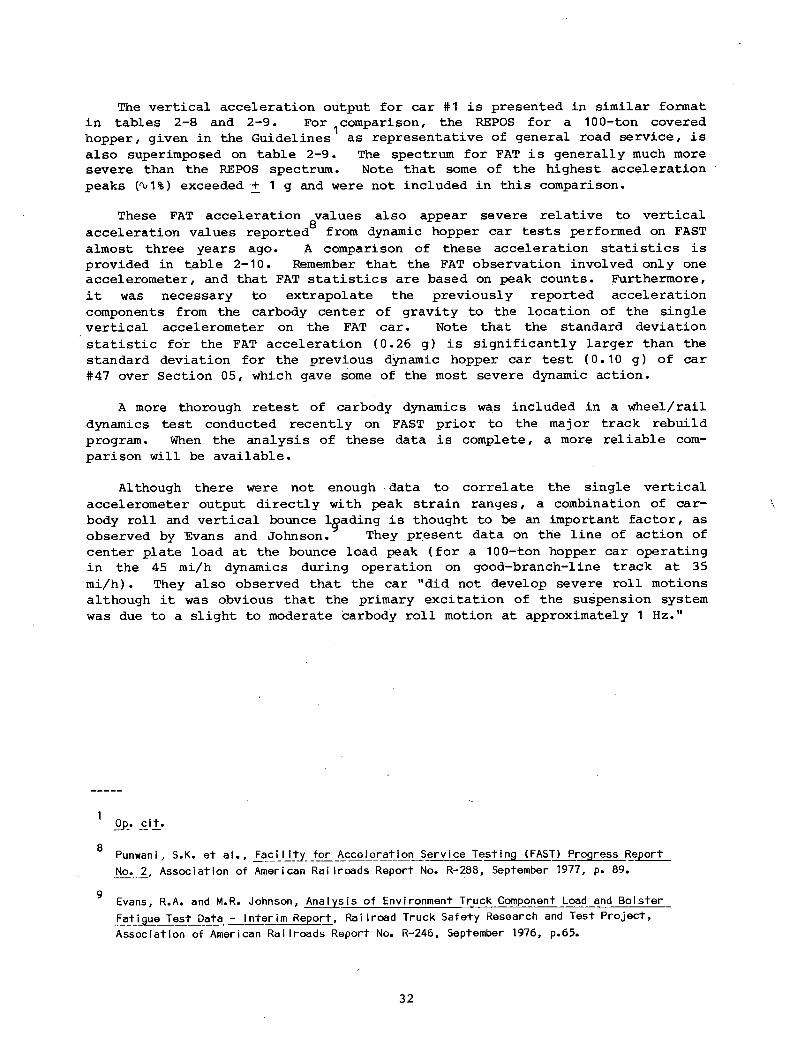
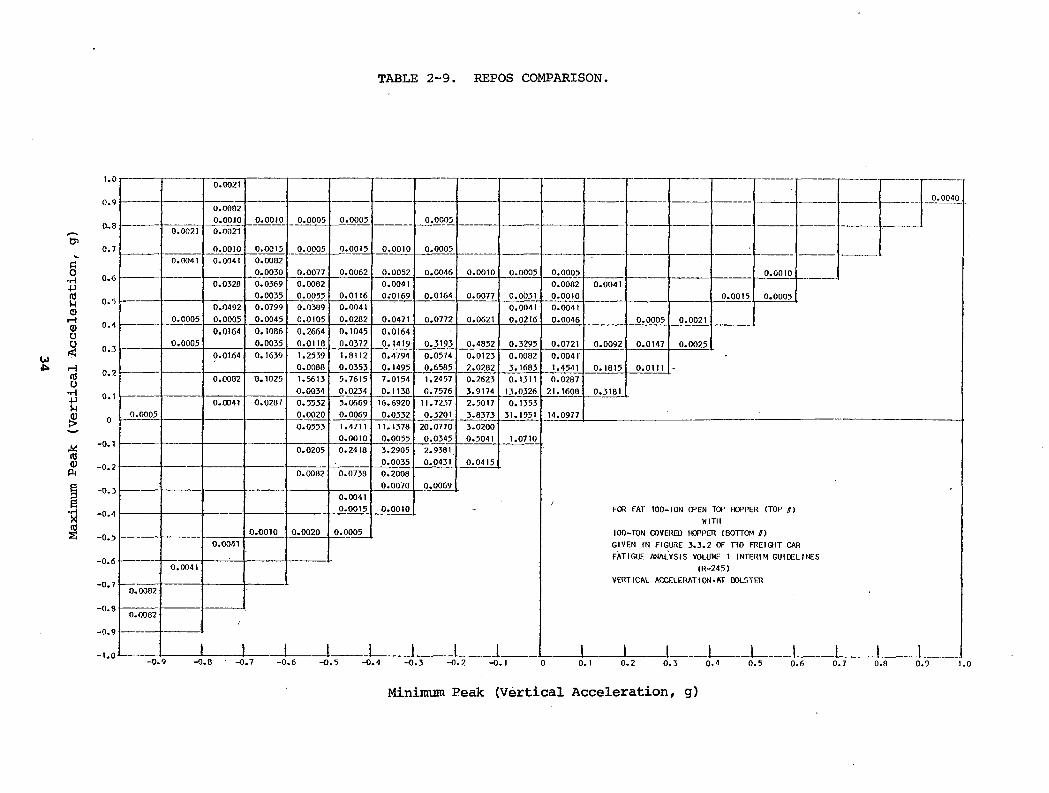
The vertical acceleration output for car #1 is presented in similar format in tables 2-8 and 2-9. For ^comparison, the REPOS for a 100-ton covered hopper, given in the Guidelines as representative of general road service, is also superimposed on table 2-9. The spectrum for FAT is generally mu c h more severe than the REPOS spectrum. Note that some of the highest acceleration peaks (^1%) exceeded + 1 g and were not included in this comparison.
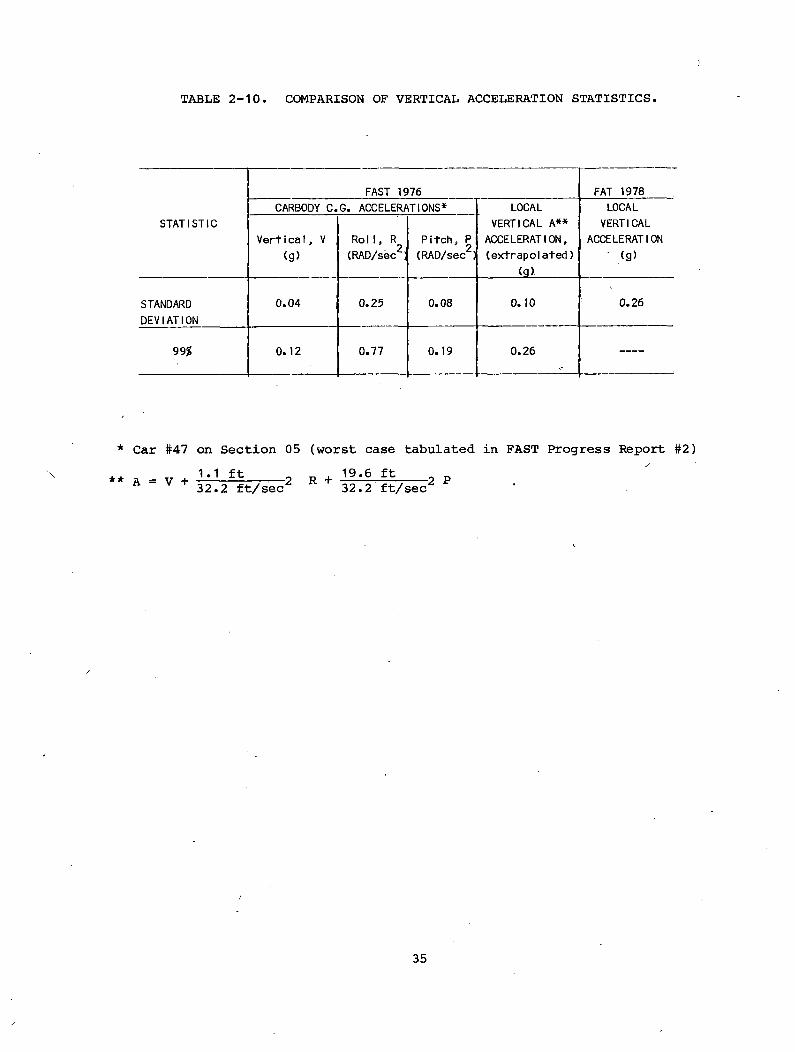
These FAT acceleration values also appear severe relative to vertical acceleration values reported0 from dynamic hopper car tests performed on FAST almost three years ago. A comparison of these acceleration statistics is provided in table 2-10. Remember that the FAT observation involved only one accelerometer, and that FAT statistics are based on peak counts. Furthermore, it was necessary to extrapolate the previously reported acceleration components from the carbody center of gravity to the location of the single vertical accelerometer on the FAT car. Note that the standard deviation statistic for the FAT acceleration (0.26 g) is significantly larger than the standard deviation for the previous dynamic hopper car test (0.10 g) of car #47 over Section 05, which gave some of the most severe dynamic action.
A more thorough retest of carbody dynamics wa,s included in a wheel/rail dynamics test conducted recently on FAST prior to the major track rebuild program. When the analysis of these data is complete, a more reliable comparison will be available.
Although there were not enough data to correlate the single vertical accelerometer output directly with peak strain ranges, a combination of car- body roll and vertical bounce leading is thought to be an important factor, as observed by Evans and Johnson. They present data on the line of action of center plate load at the bounce load peak (for a 100-ton hopper car operating in the 45 mi/h dynamics during operation on good-branch-line track at 35 mi/h) . They also observed that the car "did not develop severe roll motions although it was obvious that the primary excitation of the suspension system was due to a slight to moderate carbody roll motion at approximately 1 Hz."
O p . c i j f .
Punwani, S.K. e+ a l . , Facility for Acceleration Service Testing (FAST) Progress Report No .^ , Association of American Railroads Report No. R-288, September 1977, p. 89.
Evans, R.A. and M.R. Johnson, Analysis of Environment Truck Component Load and Bolster Fatigue Test Data - Interim Report, Railroad Truck Safety Research and Test Project, Association of American Railroads Report No. R-246, September 1976, p.65.
32
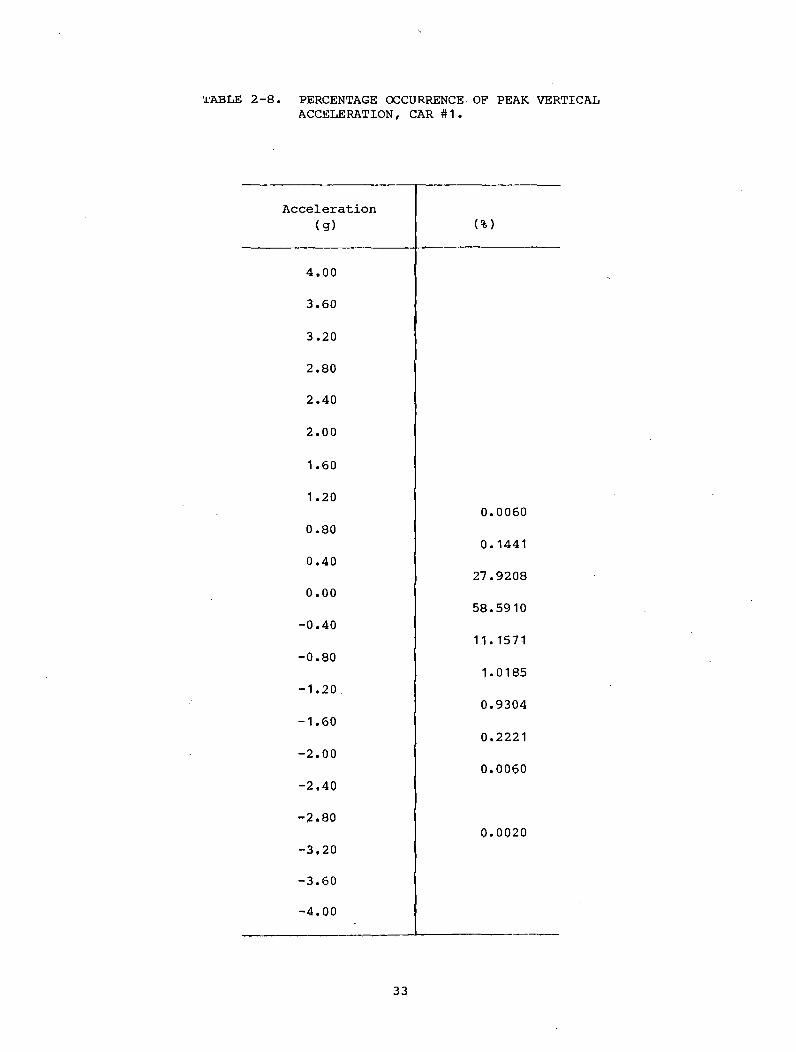
TABLE 2-8 PERCENTAGE OCCURRENCE. OF PEAK VERTICAL ACCELERATION, CAR #1 .
Acceleration(g) (%)
4.00
3.60
3.20
2.80
2.40
2.00
1.60
1.200.0060
0.800.1441
0.4027.9208
0.0058.5910O•01
11.1571o0001
1.0185-1.20
0.9304-1.60
0.2221oO1
0.0060-2.40
0
00c*1
0.0020-3,20
-3.60
-4.00
33
Maximum Peak (
Vertical Acceleration, g)
TABLE 2-9. REPOS COMPARISON
1.0
0.9
0.80.7
0.60.5
0.40.3
0.20.10
-0.1-0.2-0.3
-0.4
-0.5
-0.6-0.7
-0.8-0.9
-1.0
0.00210.0040
0.00020.00J0 0.0010 0.0005 0.0005 0.0005
0.0021 0.0021
0.0010 0.0015 0.0005 0.0015 0.0010 0.00050.0041 0.0041 0.0082
0.0030 0.0077 0.0062 0.0052 0.0046 0.0010 0.0005 0.0005 0.00100.0328 0.0369 0.0082 0,0041 0.0082 0.0041
0.0035 0.0055 0.0116 0.-0169 0.0164 0.0077 0.0031. 0.0010 0.0015 0.00050.0492 0.0799 0.0389 0.0041 0.0041 0.0041
0.0005 0,0005 0.0045 0.0105 0.0282 0.0471 0.0772 0.0621 0.0216 0.0046 0.0005 0.00210.0)64 0.1086 0.2664 0.1045 0.0164
0.0005 0.0035 0.0110 0.0372 0.1419 0.3193 0.4052 0.3295 0.0721 0.0092 0.0147 0.00250.0164 0.1639 1.2539 1.8112 0.4794 0.0574 0.0123 0.0002 0.0041
0.0008 0.0353 0.1495 0.6585 2.0262 3.1683 1.4541 0.1815 0.0111 -
0.0002 0.1025 1.5613 5.7615 7.0154 1.2457 0.2623 0.13M 0.02870.0034 0.0234 0.1138 0.7576 3.9174 13.0326 21.1608 0.3181
0.0041 0,0207 0.5532 5.0669 16.6920 11.7237 2.5017 0.13530.0005 0.0020 0.0069 0.0332 0.3201 3.8373 31.1551 14.0977
0.0553 1.4711 11.1378 20.0770 3.02000.0010 0.0055 0.0345 0.5041 1.0710
0.0205 0.24 18 3.2905 2.93010.0035 0.0431 0.0415
0.0082 0.0738 0.20080.0070 0.0069
0.00410.0015 0.0010 - FOR FAT 100-TON OPEN TOP HOPPER (TOP tn
WITH0.0010 0.0020 0.0005 100-TON COVERED HOPPER (BOTTOM 8)
0.0041 GIVEN IN FIGURE 3.3.2 OF n o FREIGHT CARFATIGUE ANALYSIS VOLUME 1 INTERIM GUIDELINES
0.0041 < R - 245)VERTICAL ACCELERATION.AT BOLSTER
0.0082
0.0082
______________
/
______________ ______________ J | | | | 1 1 1-0.9 -0.8 -0.7 -0.6 -0.5 -0.4 -0.3 -0.2 -0.1 0 0.1 0.2 0.3 0.4 0.5 0.6 0.7 0.8 0.9 1
Minimum Peak (Vertical Acceleration, g)
)
TABLE 2-10. COMPARISON OF VERTICAL ACCELERATION STATISTICS.
FAST 1976 FAT 1978CARBODY C.G. ACCELERATIONS* LOCAL LOCAL
STATISTICVert i ca I, V
(g>Roll, R CRAD/sec2]
Pitch, P (RAD/sec2)
VERTICAL A** ACCELERAT1 ON, (extrapolated)
<g>
VERTICAL ACCELERATION
' ,<9>
STANDARDDEVIATION
0.04 0.25 0.08 0.10 0.26
99% 0.12 0.77 0.19 0.26 —
* Car #47 on Section 05 (worst case tabulated in FAST Progress Report #2)1.1 ft 32.2 ft/sec2 R + 19.6 ft -2 PA = V + 32.2 ft/sec
3.0 STRESS ANALYSIS
3.1 PRINCIPAL STRESSES
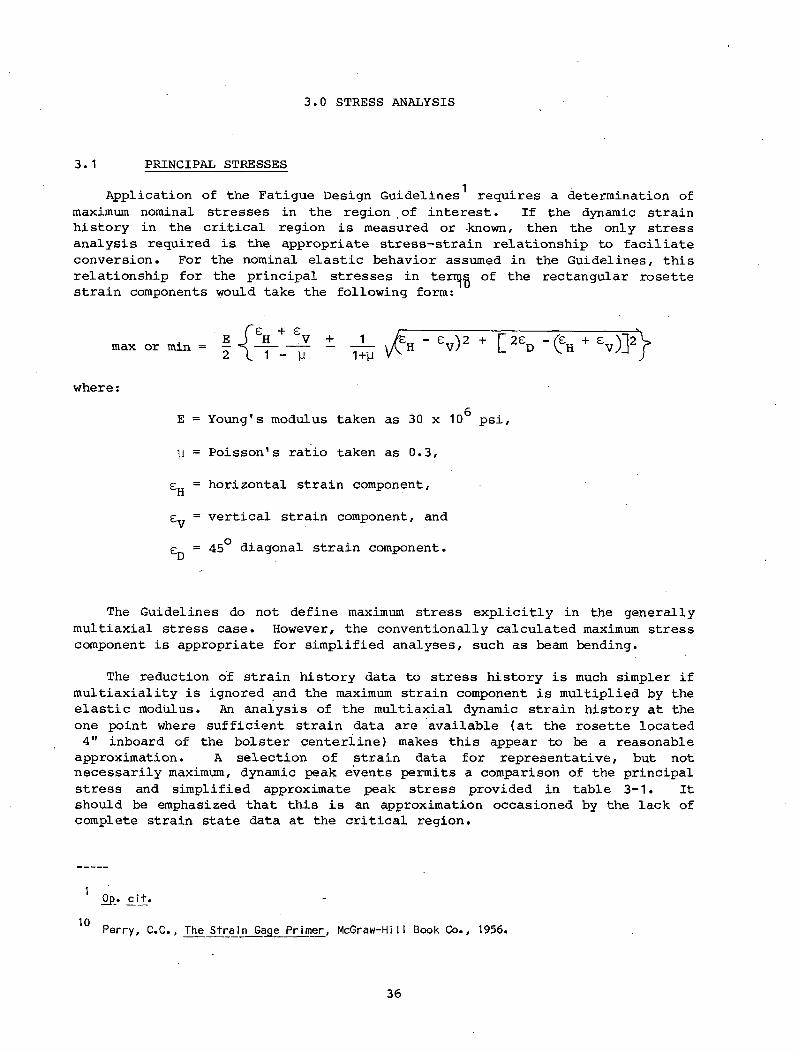
Application of the Fatigue Design Guidelines^ requires a determination of maximum nominal stresses in the region of interest. If the dynamic strain history in the critical region is measured or known, then the only stress analysis required is the appropriate stress-strain relationship to faciliate conversion. For the nominal elastic behavior assumed in the Guidelines, this relationship for the principal stresses in terujig of the rectangular rosette strain components would take the following form:
- S ) 2 + O d - ( eH + Sv)]2)>
as 30 x 10 psi,
as 0.3,
e = horizontal strain component,
Ev = vertical strain component, and
= 45° diagonal strain component.
max or m m• E J £H + £VLn 2 \ 1 - y 1+y
where:
E = Young's modulus taken
y = Poisson's ratio taken
The Guidelines do not define maximum stress explicitly in the generally multiaxial stress case. However, the conventionally calculated maximum stress component is appropriate for simplified analyses, such as beam bending.
The reduction of strain history data to stress history is much simpler if multiaxiality is ignored and the maximum strain component is multiplied by the elastic modulus. An analysis of the multiaxial dynamic strain history at the one point where sufficient strain data are available (at the rosette located 4" inboard of the bolster centerline) makes this appear to be a reasonable
approximation. A selection of strain data for representative, but not necessarily maximum, dynamic peak events permits a comparison of the principal stress and simplified approximate peak stress provided in table 3-1. It should be emphasized that this is an approximation occasioned by the lack of complete strain state data at the critical region.
0p_. cjt.
Perry, C.C., The Strain Gage Primer, McGraw-Hill Book Co., 1956.
36
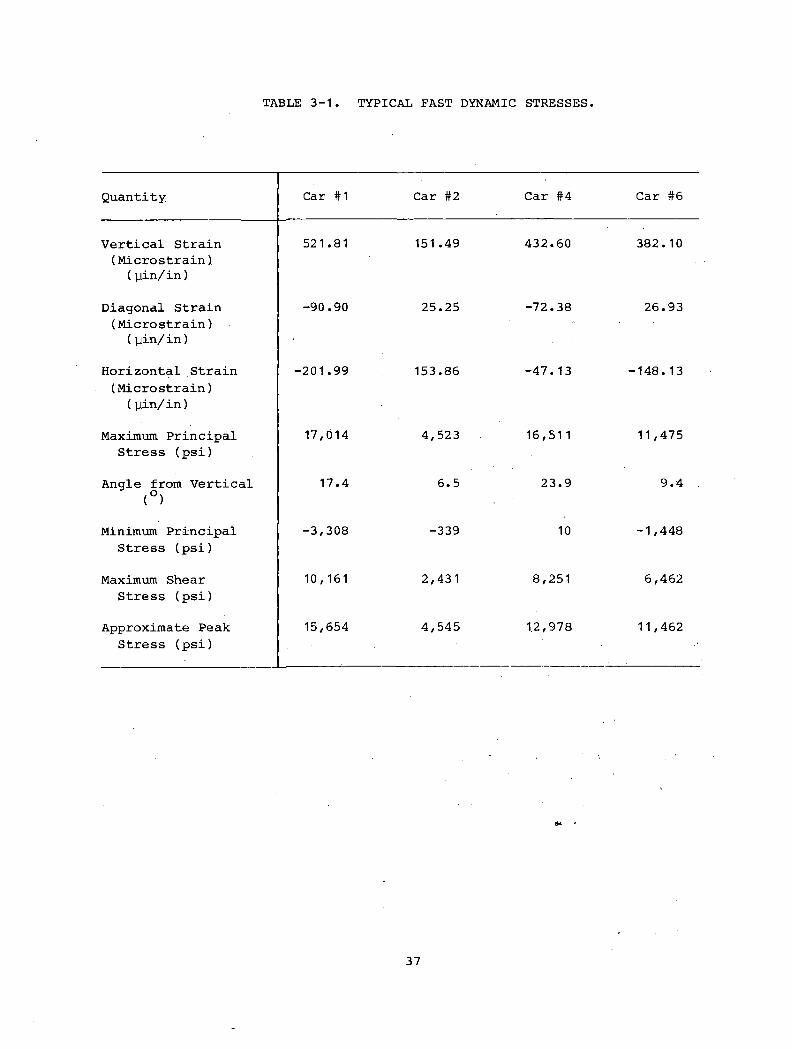
TABLE 3-1 TYPICAL FAST DYNAMIC STRESSES
Quantity Car #1 Car #2 Car #4 Car #6
Vertical Strain (Microstrain)
(yin/in)
521.81 151.49 432.60 382.10
Diagonal Strain (Microstrain)
( yin/in)
-90.90 25.25 -72.38 26.93
Horizontal Strain (Microstrain)
(yin/in)
-201.99 153.86 -47.13 -148.13
Maximum Principal Stress (psi)
17,014 4,523 16,511 11,475
Angle from Vertical (°)
17.4 6.5 23.9 9.4
Minimum Principal Stress (psi)
-3,308 -339 10 -1,448
Maximum Shear Stress (psi)
10,161 2,431 8,251 6,462
Approximate Peak Stress (psi)
15,654 4,545 12,978 11,462
37
3.2 CRITICAL STRESSThe critical center sill web region for car #1 is at the bolster cen
terline weld termination at the cope hole in the bolster web. The nearest gages are 3/4" and 1-1/2" below this point. Even if we adopt the simplified strain-to-stress conversion discussed above, there is still some uncertainty in knowing how to extrapolate or select a maximum nominal stress value that can be related to those values for which an MGD of the structural detail has been prepared. Even in those cases where the determination of principal stress is more appropriate, the simple beam formulas for shear stress and bending stress at the point of interest for critical section are used. An example i^ the case of a particular stiffener in a fabricated beam discussed by Munse.
Thus, it is evident that measured stress in the immediate vicinity of an abrupt discontinuity is not appropriate for use • with thp conventional structural detail MGD approach. As stated in the Guidelines, "In the case of welded connections, the stresses required are nominal stresses without consideration of stress concentrations of the detail." Since the bolster web thickness was only 15/32", any gage placed within a couple of thicknesses of this point would certainly be affected by the high local concentration. Therefore, it would seem appropriate— in fact somewhat conservative--to use either the simple maximum stress based on the strain reading at the centerline gage 3/4" from the critical point, or a linear extrapolation to the critical point based oh the strain gradient between two gages 3/4" and 1-1/2" away from the critical point. In fact, stress values based on these two cases are used in the fatigue analysis that follows.
3.3 ■ STATIC STRESS
Recall that the fatigue analysis requires both the static and dynamic stress values. To be consistent with previous experimental static' preand post-test results, a compressive value of 4,000 psi was selected for the static component at the critical location. This is assumed to be the sum of dead and live load stresses when the car was centered in its trucks and at rest.
When only the external carbody loads or accelerations are known, a structural analysis is needed to arrive at appropriate static (1 g) stresses in order to follow the conventional method described in the Guidelines. In this instance, a pseudodynamic stress history is created by multiplying the 1 g stresses by the acceleration spectrum. Shortcomings inherent in this "pseudo-" and "ad-hoc" approach to structural dynamics are explored to some
O p. c ij t .
Munse, W.H., Fatigue of Welded Steel Struct ures, edited by LaMotte Grover, Welding Research Council, 1964, p. 171.
38
1212extent in TTD Report No. R-322. Nevertheless, this simple dynamic approachis adopted in this report and the complexity of the structural static stresssituation will be considered in more detail.
3.4 FINITE ELEMENT ANALYSES
The center filler region of the .fabricated7 center sill is indeed a complicated three-dimensional plate .structure that appears to defy a simple model representation for purposes of arriving at maximum nominal stresses. Some progress has been made through the use of finite element models in the investigation of^nternal member-load distribution and stresses. The analysis summary by Naik, of a fabricated center filler design different from the one in the FAT cars, is nevertheless pertinent to this issue. As other manufacturers do, Naik chooses the center plate edge-loading case as the critical one for study. For his boundary conditions and model of a significant portion of the car, including the center filler section, the NASTRAN solution for the 1 g center plate edge load of 121,000 lbs is presented. Naik tabulates minor principal stresses in the region of the center sill web where the lateral side bearing support beam intersects. The largest value tabulated is a compressive stress of 18,869 psi on the loaded side.
Some additional stress analysis results (side sill web stresses for center plate edge-loading of 121,000 lbs) have been made available to AAR by ACF Industries. It is noted that this is a different model with a different center filler design, and it features a lower body bolster web without cope hole. In this case, the maximum principal stress (in the element near the bolster centerline at the center sill flange) is 19,300 psi tension. Considerable bending is indicated, since the stress on the inside of the web at this location is 1,500 psi compression. When the center plate is centrally loaded, this same element has an outside web tensile stress of 3,200 psi. The centroid of the element in question is estimated to be 3/4" from the centerline and 1/2" up from the sill flange.
Dresser Industries has provided AAR with the results of a revised finite element analysis of the center sill area of interest for a design like FAT car #1. The center plate edge-loading results from this analysis indicate that the principal stress having the largest absolute value at the gage location 3/4" below the critical bolster web intersection is 11,689 psi compression,
Prasad, B. et a I, Freight Car Dynamics-Demonstration Test and Analysis Volume ll-Forced
Vibration, Dynamic Stress Analysis and Fatigue Life Prediction, Association of American RaiIroads Report No. R-322, June 1978.
Naik, D.T., "Application of Advanced Stress Analysis Techniques in Freight Car Components Design," Track/Train Dynamics and Design, Association of American Railroads Report No. R-289, edited by G.J. Moyar, W.D. Pilkey, and B.F. Pilkey, Pergamon Press, Inc. (1978), p. 407.
39
oriented 28° from the vertical. At the rosette gage point 4" inboard from the bolster centerline, the corresponding principal stress is 6,173 psi compression.
Differences in results are obvious among the models and with the centered static and edge-load experiments on the now-cracked structure of car #1. More experimental and coordinated analytical work will be needed to resolve these differences. Nevertheless, present knowledge of the problem allows some estimate of the static range of maximum nominal stresses created by shifting the load from center to edge of bowl. This range may vary between 16,000 and20,000 psi. To construct a conservative estimate of the dynamic stress component, assume that the vertical acceleration amplifies a maximum static tensile stress of magnitude equal to this range.
40
4.0 FATIGUE ANALYSIS
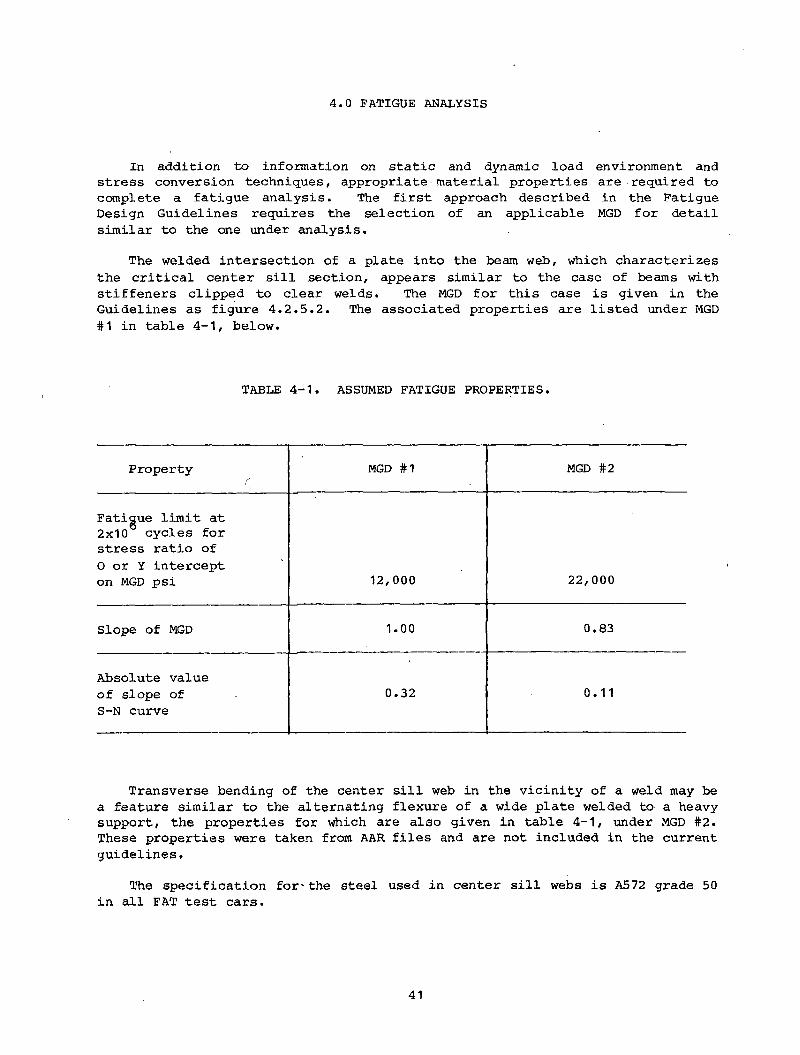
In addition to information on static and dynamic load environment and stress conversion techniques, appropriate material properties are required to complete a fatigue analysis. The first approach described in the Fatigue Design Guidelines requires the selection of an applicable MGD for detail similar to the one under analysis.
The welded intersection of a plate into the beam web, which characterizes the critical center sill section, appears similar to the case of beams with stiffeners clipped to clear welds. The MGD for this case is given in the Guidelines as figure 4.2.5.2. The associated properties are listed under MGD #1 in table 4-1, below.
TABLE 4-1. ASSUMED FATIGUE PROPERTIES.
Propertyr
MGD #1 MGD #2
Fatigue limit at 2x10° cycles for stress ratio of 0 or Y intercept on MGD psi 12,000 22,000
Slope of MGD 1.00 0.83
Absolute value of slope of S-N curve
0.32 0.11
Transverse bending of the center sill web in the vicinity of a weld may be a feature similar to the alternating flexure of a wide plate welded to a heavy support, the properties for which are also given in table 4-1, under MGD #2. These properties were taken from AAR files and are not included in the current guidelines.
The specification for' the steel used in center sill webs is A572 grade 50 in all FAT test cars.
41
Fatigue life or mileage predictions were made for car #1 usigg both MGD's and the Fatigue Life Analysis Program (FLAP) computer program. Table 4-2 displays the results for several selected assumptions to explore the range of uncertainties in peak, stress magnitude, polarity, mean stress, and the method of dynamic analysis (measured strain or acceleration)• ■ Also given is the mileage to crack initiation derived from the Guideline acceleration REPOS for a 100-ton covered hopper.
For measured FAT acceleration inputs, the lowest mileage predicted is 1,351, with MGD #2 for a 0 static mean stress and the strain of original polarity extrapolated to the point of crack initiation. The highest mileage is 7,181, with MGD #2 for a -4,000 psi static mean stress and the strain 'polarity reversed at the strain gage position 3/4" below the point of crack initiation.
Neither mean stress nor strain signal polarity have a very strong effect on predicted life. An average predicted life selected over all the uncertainties might be 4,000 miles. This can be compared to the 23,000 miles of FAST operation until the earliest report of a crack in the center sill. In consideration of the conservatism built into the Guideline design basis, this may be considered a reasonable result.
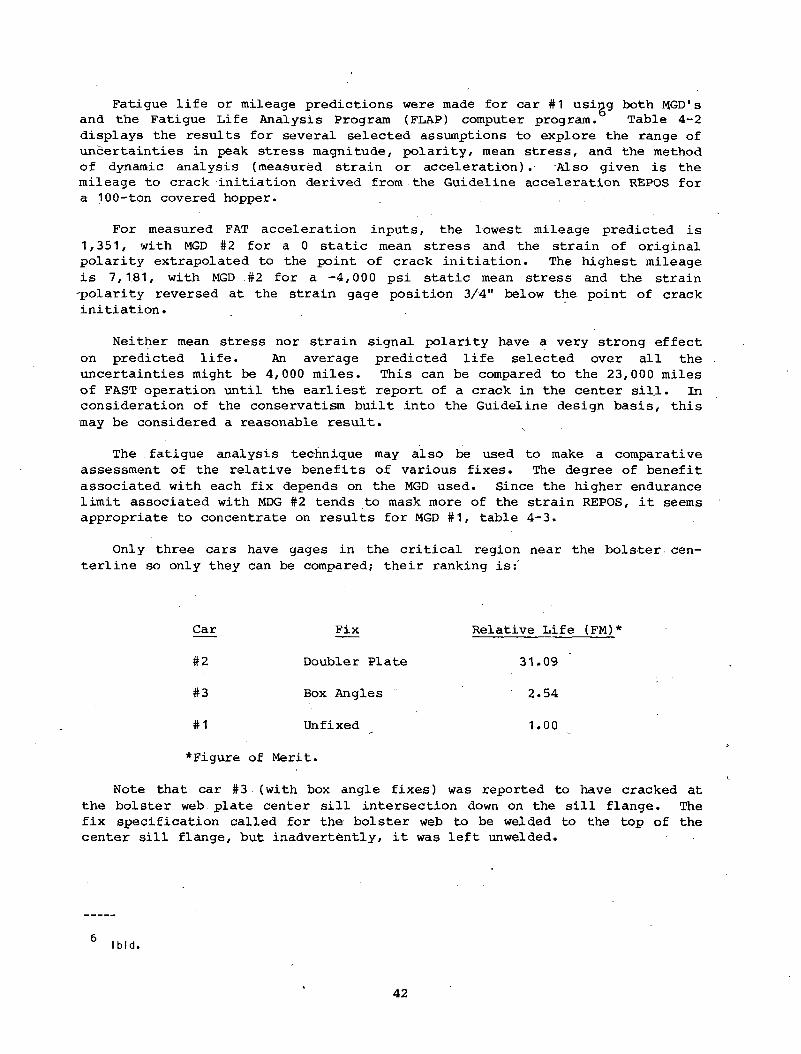
The fatigue analysis technique may also be used to make a comparative assessment of the relative benefits of various fixes. The degree of benefit associated with each fix depends on the MGD used. Since the higher endurance limit associated with MDG #2 tends to mask more of the strain REPOS, it seems appropriate to concentrate on results for MGD #1, table 4-3.
Only three cars have gages in the critical region near the bolster centerline so only they can be compared; their ranking is:'
Car Fix Relative Life (FM)*
#2 Doubler Plate 31.09
#3 Box Angles ' 2.54
#1 Unfixed 1.00
*Figure of Merit.
Note that car #3 (with box angle fixes) was reported to have cracked at the bolster web plate center sill intersection down on the sill flange. The fix specification called for the bolster web to be welded to the top of the center sill flange, but inadvertently, it was left unwelded.
6b i d .
42
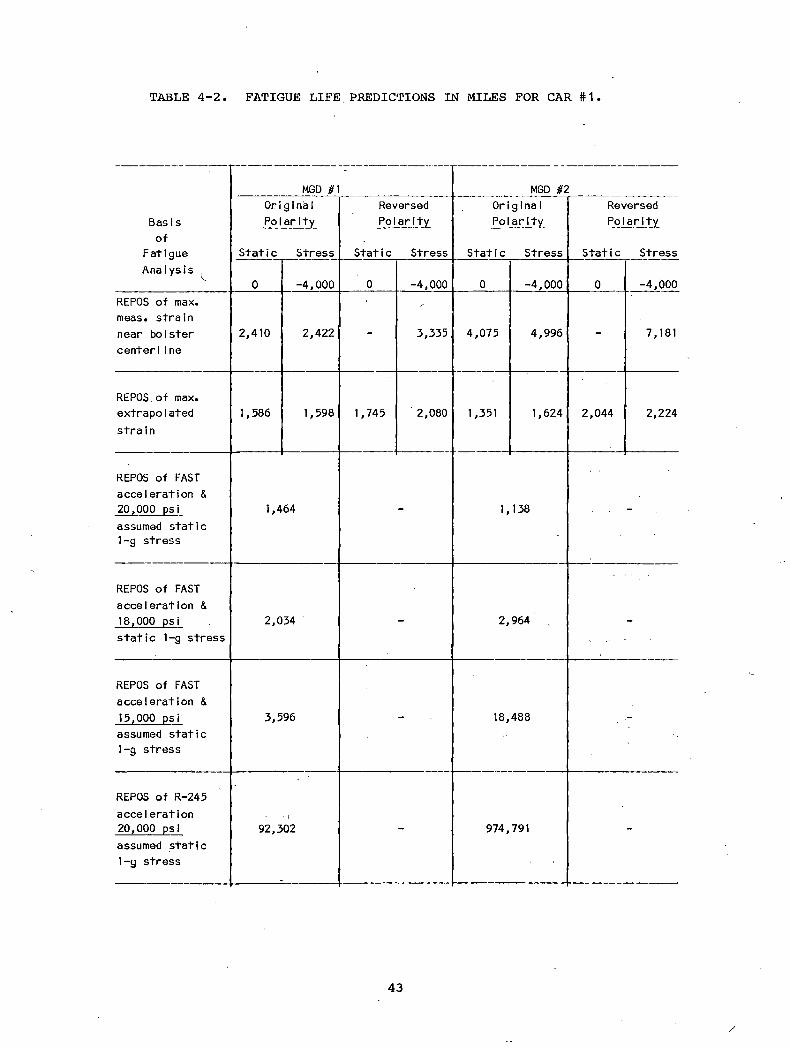
TABLE 4-2 FATIGUE LIFE. PREDICTIONS IN MILES FOR CA R #1
Bas i s of
Fatigue Analysis .
V
MGD #1 MGD #2OriginalPolarity
Static Stress
ReversedPolarity
Static Stress
OriginalPolarity
Static Stress
ReversedPolarity
Static Stress
0 -4,000 0 -4,000 0 -4,000 0 -4,000REPOS of max. meas. strain near bolster center I ine
2,410 2,422 -
r
3,335 4,075 4,996 7,181
REPOS, of max. extrapolated stra i n
1,586 1,598 1,745 2,080 1,351 1,624 2,044 2,224
REPOS of FAST acceleration & 20,000 psi assumed static 1-g stress
1,464 - 1,138 -
REPOS of FAST acceleration & 18,000 psi static 1-g stress
2,034 - 2,964 -
REPOS of FAST acceleration & 15,000 psi assumed static 1-g stress
3,596 - 18,488
REPOS of R-245 acceleration 20,000 psi assumed static 1-g stress
92,302 - 974,791 -
43
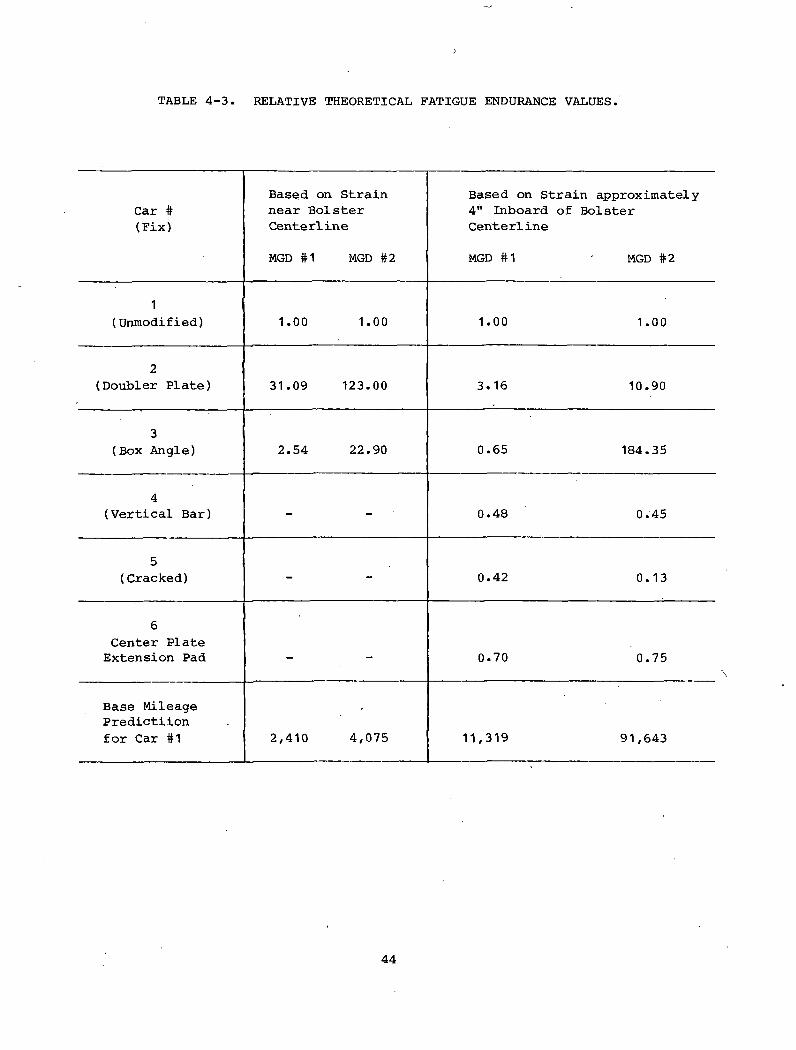
TABLE 4-3. RELATIVE THEORETICAL FATIGUE ENDURANCE VALUES.
Car # (Fix)
Based on Strain near Bolster Centerline
Based on Strain approximately 4" Inboard of Bolster Centerline
MGD #1 MGD #2 MGD #1 MGD #2
1(Unmodified) 1.00 1.00 1.00 1.00
2(Doubler Plate) 31.09 123.00 3.16 10.90
3(Box Angle) 2.54 22.90 0.65 184.35
4(Vertical Bar) - 0.48 0.45
5(Cracked) - 0.42 0.13
6Center Plate
Extension Pad
•
0.70 0.75
Base Mileage Predictiion for Car #1 2,410 4,075 11,319 91,643
44
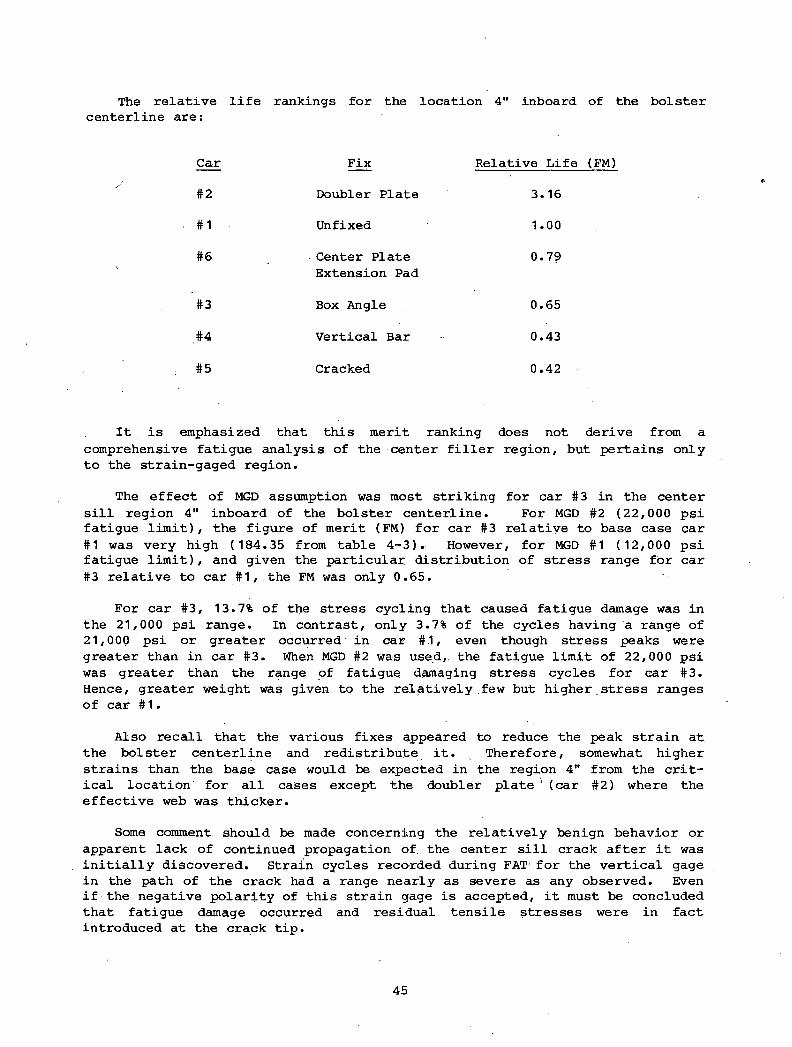
The relative life rankings for the location 4" inboard of the bolster centerline are:
Car Fix Relative Life
#2 Doubler Plate 3.16
#1 Unfixed 1.00
#6 Center Plate Extension Pad
0.79
#3 Box Angle 0.65
#4 Vertical Bar 0.43
#5 Cracked 0.42
It is emphasized that this merit ranking does not derive from a comprehensive fatigue analysis of the center filler region, but pertains only to the strain-gaged region.
The effect of MGD assumption was most striking for car #3 in the center sill region 4" inboard of the bolster centerline. For MGD #2 (22,000 psi fatigue limit), the figure of merit (FM) for car #3 relative to base case car #1 was very high (184.35 from table 4-3). However, for MGD #1 ( 12,000 psi fatigue limit), and given the particular distribution of stress range for car #3 relative to car #1,.the FM was only 0.65.
For car #3, 13.7% of the stress cycling that caused fatigue damage was in the 21,000 psi range. In contrast, only 3.7% of the cycles having a range of21,000 psi or greater occurred in car #1, even though stress peaks were greater than in car #3. When MGD #2 was used,, the fatigue limit of 22,000 psi was greater than the range of fatigue damaging stress cycles for car #3. Hence, greater weight was given to the relatively few but higher stress ranges of car #1.
Also recall that the various fixes appeared to reduce the peak strain at the bolster centerline and redistribute it. Therefore, somewhat higher strains than the base case would be expected in the region 4" from the critical location for all cases except the doubler plate ' (car #2) where the effective web was thicker.
Some comment should be made concerning the relatively benign behavior or apparent lack of continued propagation of. the center sill crack after it was initially discovered. Strain cycles recorded during FAT for the vertical gage in the path of the crack had a range nearly as severe as any observed. Even if the negative polarity of this strain gage is accepted, it must be concluded that fatigue damage occurred and residual tensile stresses were in fact introduced at the crack tip.
45
As Fisher, et al., observed in a recent paper:
"the applied nominal stress range...accounts for nearly all the variation in fatigue life of...welded beams and girders.... Statistically it has been shown that the minimum stress, the maximum stress, and the grade of steel has little effect on stress range-fatigue life relationship of welded structures.
"Since the nominal stress range is the algebraic difference between the maximum and the minimum applied nominal stresses, the stresses to be considered in the structure are those due to live load alone.
"Fatigue cracking in the laboratory tests has also been observed at welded details where the nominal stresses are solely in compression. The reason that the minimum or mean stress has no significant influence upon fatigue life can be attributed to residual tensile stresses that are produced by the differential cooling of the weldment. The small initial discontinuities in or adjacent to the weldment grow in the tensile residual stress region regardless of the sign of the applied stress. The maximum stress in the stress cycle is in reality near the yield strength of the steel. The stress range concept provides a simple and consistent means of evaluating the fatigue performance of as-welded structural details."
14
While this may be accepted as a plausible explanation of the control of the stress range on the crack initiation process, it does not appear to apply to the matter of advanced crack propagation. It may be that the structural restraint on continued crack advance imposed by the transverse spacer plates inside the center sill is a dominant influence ' on the cracked ̂ tructure at this stage. A more comprehensive fracture mechanics approach based on additional information is needed to explore this issue. Such an investigation is beyond the scope of this paper, but it may be appropriate in studies of the ultimate structural integrity of fabricated center sills Under a full spectrum of high mileage service loadings and environments. It would be appropriately conservative to view these cracks- as potential threats to structural integrity and-make efforts in design and/or manufacture to prevent their initiation.
The cars with cracked center sills are continuing in the FAST train along with several others equipped with various fixes. They will be inspected at frequent intervals to monitor crack growth and possible crack initiation in cars with fixes.
Fisher, J.W* Yen, B.T., and Frank, K.H., "Minimizing Fatigue and Fracture’in Steel Bridges," Structural Integrity Technology, American Society of Mechanical Engineers,May 1979, p. 155.
Stone,- D.H., Pel I ini W.S., "The Application of Fracture Control Principles to Freight Car Centersill Structures",'American Society of Mechanical Engineers, Rail Transportation Division Paper No. 78-RT-7, presented at the ASME-IEEE Joint Railroad Conference,April 11-13, 1978.
46
1
5.0 CONCLUSIONS AND RECOMMENDATIONS
5.1 CONCLUSIONS
It is not surprising that many technical uncertainties and questions remain after an investigation of this complexity, particularly when the effort has involved an auxiliary test spanning more than a year and a half, and considering the many individuals and organizations having separate part-time roles in its initiation, conduct, and interpretation. Nevertheless, the authors believe that a number of tentative conclusions can be drawn, and that some questions raised and issues defined by the FAT program are , its most important contribution to the TTD and FAST technology.
With appropriate recognition of the many qualifications discussed in this report, we arrive at the following conclusions in each area of the FAT objectives:
a. Cause of Fatigue Cracking. The strain range is critically high in the relatively thin fabricated centersill section at the complex structural geometry and weld termination at the cope hole on the centerline of the body bolster intersection. The measured strain range in the gage 3/4" away from the point of crack initiation often exceeded 1,000 in/in (30,000 psi nominal stress) during FAST operation.
The source of the critical strain cycles appears to be carbody roll or twist motion short of side bearing contact. Vertical bounce acceleration may interact dynamically to amplify the stresses caused by offcenter loading of the center plate.
b. Validity of the Fatigue Guideline. The prediction of base case freight mileage to crack initiation (about 4,000 mi) derived from measured strain is reasonably conservative compared with the minimum FAST mileage (23,000 mi) to first crack detection. However, there were inadequate data from which to draw conclusions regarding acceleration-based life predictions, and uncertainties in estimating nominal static stresses in the critical region are not yet resolved.
c. Relative Merits of Fixes. A ranking of the merit of the several fixes based on an application of the FLAP to measured strain histories at particular locations is:
• Doubler plate,
• Box angle,
• Center plate extension pad, and
• Vertical bar.
d. FAST ys. "Real World." The vertical acceleration environment on FAST, based on the single accelerometer included in FAT, appears worse than
47
represented in the Guidelines for general service. It also appears to have deteriorated over a two-year period of FAST operation. Fatigue cracks similar to those produced on FAST have been produced in extended car rocking tests, but have been not been reported in general service.
5.2 RECOMMENDATIONS
To answer some of the questions raised by the FAT program, the following recommendations are made:
a. A more thorough analysis of hopper car dynamics relative to potential fatigue critical modes should be conducted based on the recently completed wheel/rail dynamic load test on FAST. Sufficient vertical and lateral acceleration data from the special wheel/rail dynamic load test should be available soon.
b. A few strain gages should be installed on a car in the Freight Equipment Environmental Sampling Test consist to provide a link to general service conditions.
c. An evaluation of the output of center sill gages on the TTC Vibration Test Unit acceptance test vehicle (a Thrall-built, 100-ton, high-side gondola) should be done to shed additional light on the car dynamics/critical strain range issue.
di A more extensive field survey for cracks in fabricated center sills of heavy cars should be- conducted.
e. Additional FAT programs should be included in FAST.
f. A section of cracked center sill should be subjected to detailed destructive examination.
g. A benchmark, finite-element analysis of a representative fabricated center sill design should be established based on cooperative participation by the manufacturers.
h . Certain enhancements to the Fatigue Analysis Program now underway should be introduced in the public version including those to:
• Accommodate mean or static stress input directly,
• Provide alternative properties for higher mileage endurance limits, and
• Output cyclic range/mean statistics.
i. The current assumption in the Fatigue Analysis Program that negative-negative stress cycles do no damage should be reconsidered. Alternate analyses and properties based only on stress range should be studied for comparison.
48
REFERENCES
1. Przybylinski, P. and Halcomb, S., Interim AAR Guidelines for Fatigue Analysis of Freight Cars, Association of American Railroads, Report No. R-245, May 1977. (Now part of AAR Mechanical Division Specification M1001.)
2. Department of Transportation letter from G. P. McIntosh, TTC FASTProject Manager, to E. M* Thompson, Program Manager, Dynalectron Corporation, Subject: Fatigue Analysis Test, FRA/FPO/78-L002,May 11, 1978.
3. Dynalectron Corporation memorandum from E. H. Chang to R. L. Jackson,Subject: Fatigue Analysis Test Events Report, PM/TDAS/EHC/78-59,September 27, 1978.
4. Department of Transportation letter from T. P. Larkin, FAST OperationsManager, to D. Donaldson, FAST I Program Manager, Dynalectron Corporation, Subject: Additional Fatigue Analysis Test Requirements,FRA/FP079-L367, July 23, 1979.
5. Martin, A.E., and Smith, L.W., "Determination of Carbody Center.Plate Fatigue Design Criteria by Full-Scale Car Testing," American Society of Mechanical Engineers, Rail Transportation Division Paper No. 74-RT-8, presented at the ASME-IEEE Joint Railroad Conference,April 3-4, 1974.
6. Zarembski, A.M. and Sobash, V., User's Guide to Fatigue Life Analysis Program (FLAP), Association, of American Railroads, Report No. R-273, July, 1977.
7. Zarembski, A.M., "Freight Car Environmental Characterization for Fatigue Life Analysis," Track/Train Dynamics and Design, Association of American Railroads Report No. R-289, edited by G.J. Moyar, W.D. Pilkey, and B.F. Pilkey, Pergamon Press, Inc. (1978), p. 205.
8 . Punwani, S.K., et al., Facility for Acceleration Service Testing (FAST) Progress Report No. 2, Association of American Railroads Report No. R-288, September 1977, p. 89.
9. Evans, R. A. and M. R. Johnson, Analysis of Environmental Truck Component Load and Bolster Fatigue Test Data - Interim Report,Railroad Truck Safety Research and Test Project, Association of American Railroads Report No. R-246, September 1976, p. 65.
10. Perry, C.C., The Strain Gage Primer, McGraw-Hill Book Co., 1956.11. Munse, W. H., Fatigue of Welded Steel Structures, edited by LaMotte
Grover, Welding Research Council, 1964, p. 171.
49
REFERENCES, CONTINUED
12. Prasad, B. et al, Freight Car Dynamics-Demonstration Test and Analysis Volume II-Forced Vibration, Dynamic Stress Analysis and Fatigue Life Prediction, Association of American Railroads Report No. R-322,June 1978.
13. Naik, D. T., "Application of Advanced Stress Analysis Techniques in Freight Car Components Design," Track/Train Dynamics and Design, Association of American Railroads Report No. R-289, edited byG. J. Moyar, W. D. Pilkey, and B. F. Pilkey, Pergamon Press, Inc. (19.78), p. 407.
14. Fisher, J.W., Yen, B.T., and Frank, K.H., "Minimizing Fatigue and Fracture in Steel Bridges," Structural Integrity Technology, American Society of Mechanical Engineers, May 1979, p. 155.
15. Stone, D. H., Pellini W. S., "The Application of Fracture Control Principles to Freight Car Centersill Structures", American Society of Mechanical Engineers, Rail Transportation Division Paper No. 78-RT-7, presented at the ASME-IEEE Joint Railroad Conference, April 11-13-, 1978.
50 GPO 858 - t 10
Freight Car Fatigue Analysis Test on FAST (Final Report), 1980 GJ Moyar, JE Burns