Embed Size (px)
Citation preview
Ensuring our transport system helps New Zealand thrive
Freight Information Gathering System & Container Handling StatisticsOctober 2014 – September 2015 December 2015
ISSN 2253-2560
Page 2 of 45
Contents
1. Executive summary ................................................................................................................. 3
Section A – Trade Data ........................................................................................................... 4
Section B – Coastal Bulk Cargo ............................................................................................. 11
Section C – Container Freight................................................................................................ 12
2. Container shipping at a glance .............................................................................................. 12
3. Map 1: Container loads and discharges (full and empty) ........................................................ 16
4. Map 2: Container loads and discharges (full) ......................................................................... 17
5. Map 3: Container loads and discharges (empty) .................................................................... 18
6. Container movements: imports, exports, and transhipment loads ........................................... 19
7. International ship visits and container exchanges .................................................................. 20
8. Ship visits .............................................................................................................................. 22
9. Exports and imports – 20 foot and 40 foot container balance ................................................. 24
10. Coastal movements ............................................................................................................... 25
11. Map 4: Arrival port – where the containers are from ............................................................... 26
12. Map 5: Departure port – where the containers are going ........................................................ 27
13. Containerised export classification ......................................................................................... 28
14. Land transportation mode – road or rail ................................................................................. 30
15. Coastal movements of containers on domestic ships ............................................................. 31
16. Hazardous containerised cargo ............................................................................................. 32
Section D – Container Handling Statistics .............................................................................. 33
Section E – Rail and Road Data ............................................................................................ 36
17. FIGS cargo movements – explanatory note ........................................................................... 41
18. Glossary ................................................................................................................................ 44
Appendix A – Quarterly Trade Commodity Codes .................................................................. 45
Page 3 of 45
1. Executive summary
This Freight Information Gathering System (FIGS) report covers the period 1 October 2014 to 30 September 2015.
Exports and imports
39.3 million tonnes were exported from New Zealand by sea in the year to September 2015. By volume, 65 percent was bulk exports, and 35 percent was containerised. The real value of sea exports was $43.9 billion, of which 82 percent was containerised and 18 percent was bulk export.
20.0 million tonnes were imported by sea in the year to September 2015. In real value, imports by sea were worth $53.3 billion.
More information on quarterly trade data is available in section A.
Ship visits
New Zealand is continuing to see a marked increase in ship visits made by large ships. In the quarter ending June 2012 there were 5 ship visits from ships of 5000 TEU or greater; in the quarter ending September 2015 there were 43. Approximately 42 percent of import and export containers travel by ships of 4000 TEU or greater.
In September 2015, the share of import and export containers carried on 4000 TEU or greater ships was 39.2%
More information about ship visits is available in section C.
Container handling statistics
The container handling statistics for New Zealand measure ship rate, crane rate, and vessel rate. The weighted average ship rate, the average crane rate, and the weighted average vessel rate per labour hour were relatively unchanged in the quarter ending September 2015.
More information about container handling statistics is available in section D. Rail freight
Dairy and milk products, wood products, and coal were the largest commodity groups moved by rail in the year to September 2015. Cumulatively they accounted for 60.3 percent of all rail tonnes, and 44.6 percent of all rail tonne-kms.
More information about rail movements is available in section E.
Page 4 of 45
Section A – Trade Data
The following data has been provided by Statistics New Zealand. It provides a summary of all international freight movements, both containerised and bulk. All values have been split into sea and airfreight. Appendix A provides more detail on commodity codes.
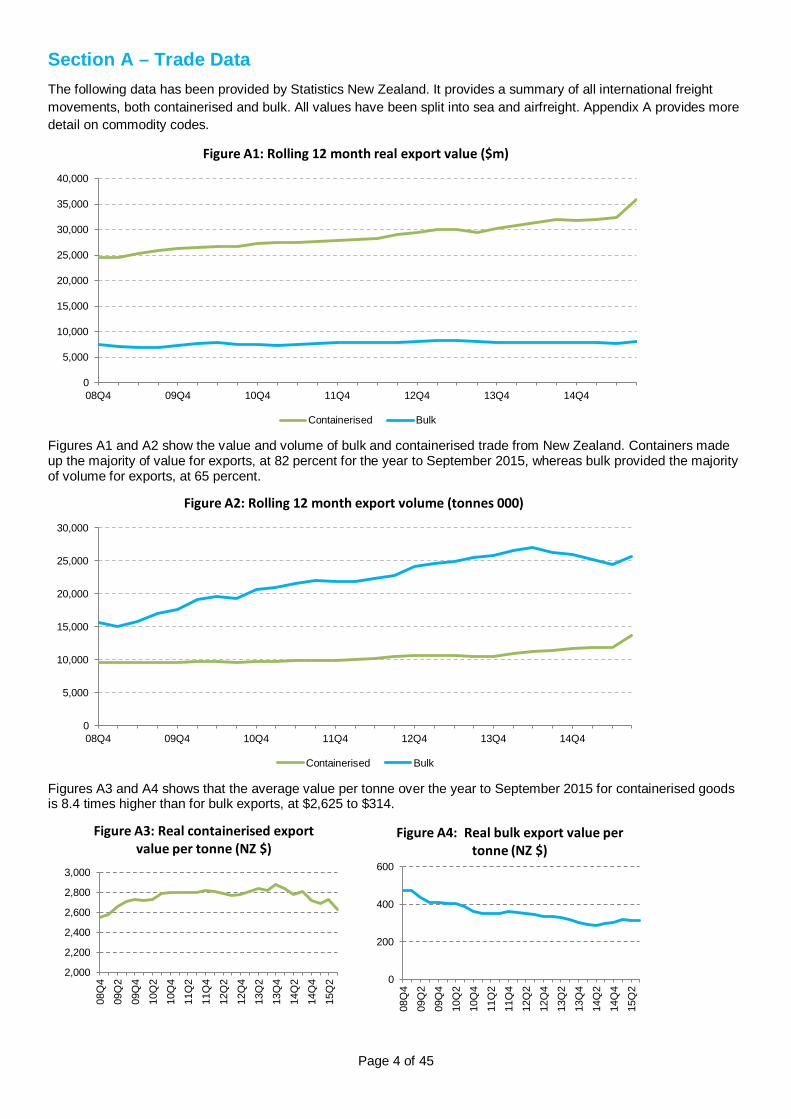
Figures A1 and A2 show the value and volume of bulk and containerised trade from New Zealand. Containers made up the majority of value for exports, at 82 percent for the year to September 2015, whereas bulk provided the majority of volume for exports, at 65 percent.
Figures A3 and A4 shows that the average value per tonne over the year to September 2015 for containerised goods is 8.4 times higher than for bulk exports, at $2,625 to $314.
0
5,000
10,000
15,000
20,000
25,000
30,000
35,000
40,000
08Q4 09Q4 10Q4 11Q4 12Q4 13Q4 14Q4
Figure A1: Rolling 12 month real export value ($m)
Containerised Bulk
0
5,000
10,000
15,000
20,000
25,000
30,000
08Q4 09Q4 10Q4 11Q4 12Q4 13Q4 14Q4
Figure A2: Rolling 12 month export volume (tonnes 000)
Containerised Bulk
2,000
2,200
2,400
2,600
2,800
3,000
08Q
4
09Q
2
09Q
4
10Q
2
10Q
4
11Q
2
11Q
4
12Q
2
12Q
4
13Q
2
13Q
4
14Q
2
14Q
4
15Q
2
Figure A3: Real containerised export value per tonne (NZ $)
0
200
400
600
08Q
4
09Q
2
09Q
4
10Q
2
10Q
4
11Q
2
11Q
4
12Q
2
12Q
4
13Q
2
13Q
4
14Q
2
14Q
4
15Q
2
Figure A4: Real bulk export value per tonne (NZ $)
Page 5 of 45
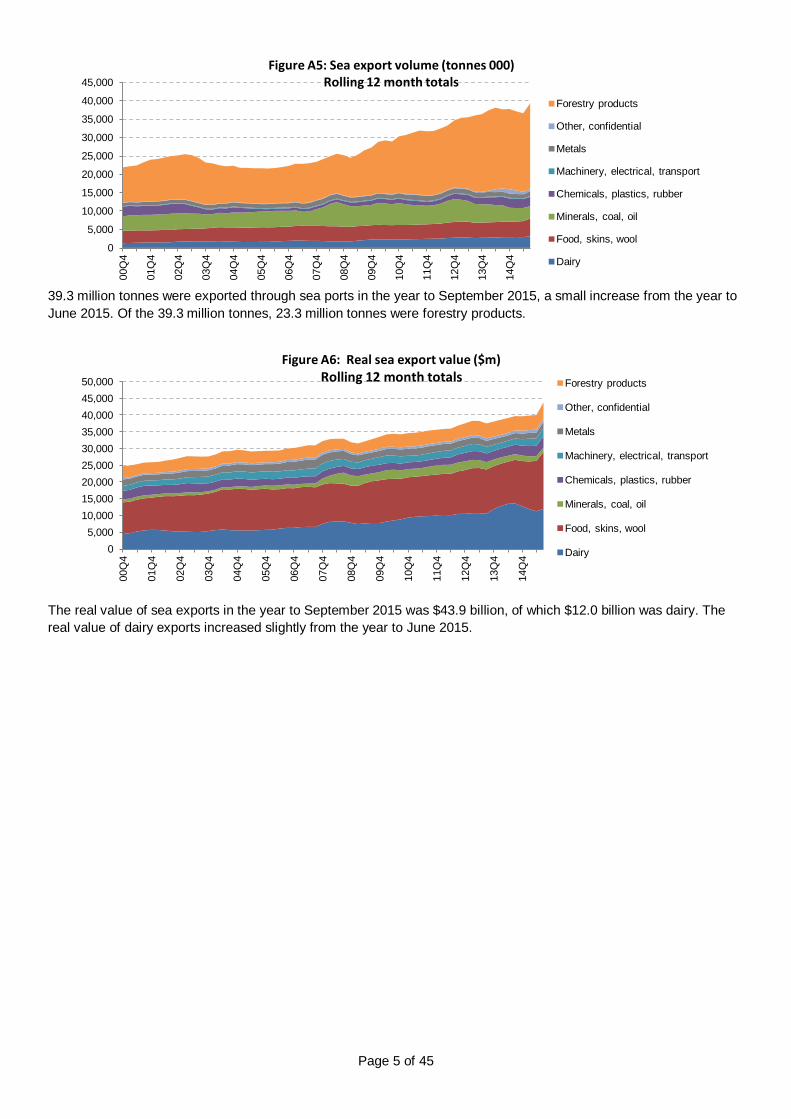
39.3 million tonnes were exported through sea ports in the year to September 2015, a small increase from the year to June 2015. Of the 39.3 million tonnes, 23.3 million tonnes were forestry products.
The real value of sea exports in the year to September 2015 was $43.9 billion, of which $12.0 billion was dairy. The real value of dairy exports increased slightly from the year to June 2015.
0
5,000
10,000
15,000
20,000
25,000
30,000
35,000
40,000
45,000
00Q
4
01Q
4
02Q
4
03Q
4
04Q
4
05Q
4
06Q
4
07Q
4
08Q
4
09Q
4
10Q
4
11Q
4
12Q
4
13Q
4
14Q
4
Figure A5: Sea export volume (tonnes 000) Rolling 12 month totals
Forestry products
Other, confidential
Metals
Machinery, electrical, transport
Chemicals, plastics, rubber
Minerals, coal, oil
Food, skins, wool
Dairy
0 5,000
10,000 15,000 20,000 25,000 30,000 35,000 40,000 45,000 50,000
00Q
4
01Q
4
02Q
4
03Q
4
04Q
4
05Q
4
06Q
4
07Q
4
08Q
4
09Q
4
10Q
4
11Q
4
12Q
4
13Q
4
14Q
4
Figure A6: Real sea export value ($m) Rolling 12 month totals
Forestry products
Other, confidential
Metals
Machinery, electrical, transport
Chemicals, plastics, rubber
Minerals, coal, oil
Food, skins, wool
Dairy
Page 6 of 45
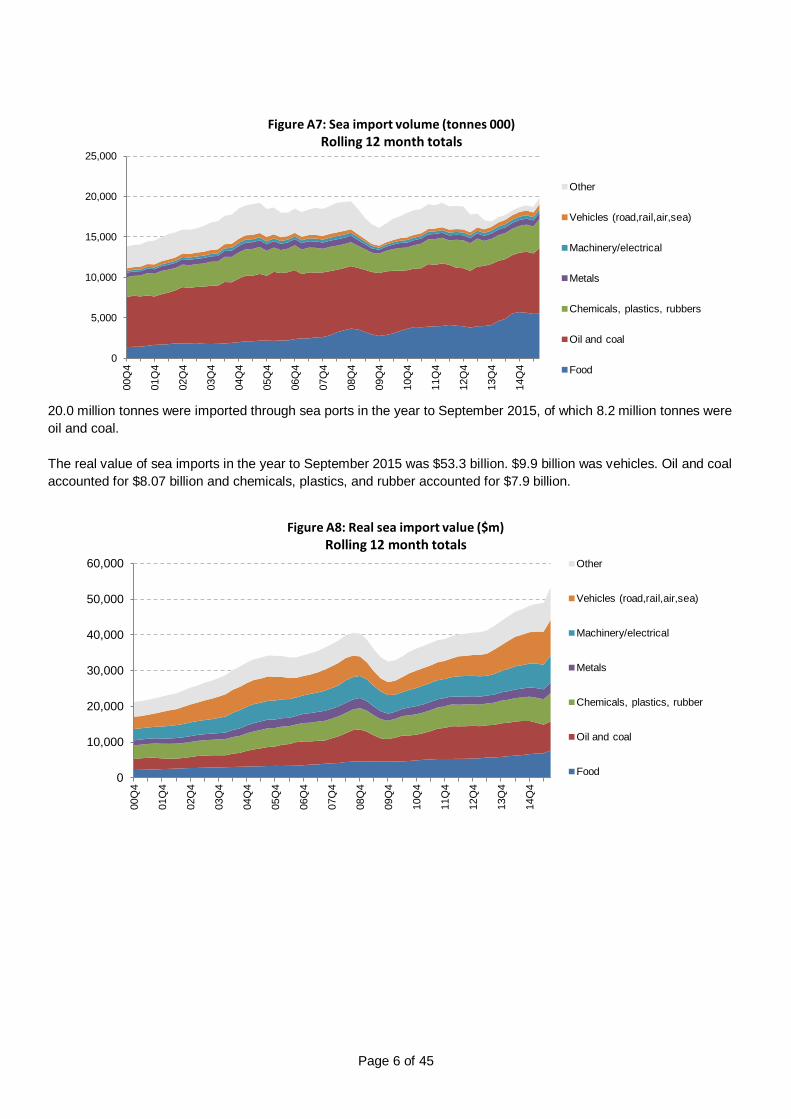
20.0 million tonnes were imported through sea ports in the year to September 2015, of which 8.2 million tonnes were oil and coal.
The real value of sea imports in the year to September 2015 was $53.3 billion. $9.9 billion was vehicles. Oil and coal accounted for $8.07 billion and chemicals, plastics, and rubber accounted for $7.9 billion.
0
5,000
10,000
15,000
20,000
25,000
00Q
4
01Q
4
02Q
4
03Q
4
04Q
4
05Q
4
06Q
4
07Q
4
08Q
4
09Q
4
10Q
4
11Q
4
12Q
4
13Q
4
14Q
4
Figure A7: Sea import volume (tonnes 000) Rolling 12 month totals
Other
Vehicles (road,rail,air,sea)
Machinery/electrical
Metals
Chemicals, plastics, rubbers
Oil and coal
Food
0
10,000
20,000
30,000
40,000
50,000
60,000
00Q
4
01Q
4
02Q
4
03Q
4
04Q
4
05Q
4
06Q
4
07Q
4
08Q
4
09Q
4
10Q
4
11Q
4
12Q
4
13Q
4
14Q
4 Figure A8: Real sea import value ($m)
Rolling 12 month totals Other
Vehicles (road,rail,air,sea)
Machinery/electrical
Metals
Chemicals, plastics, rubber
Oil and coal
Food
Page 7 of 45
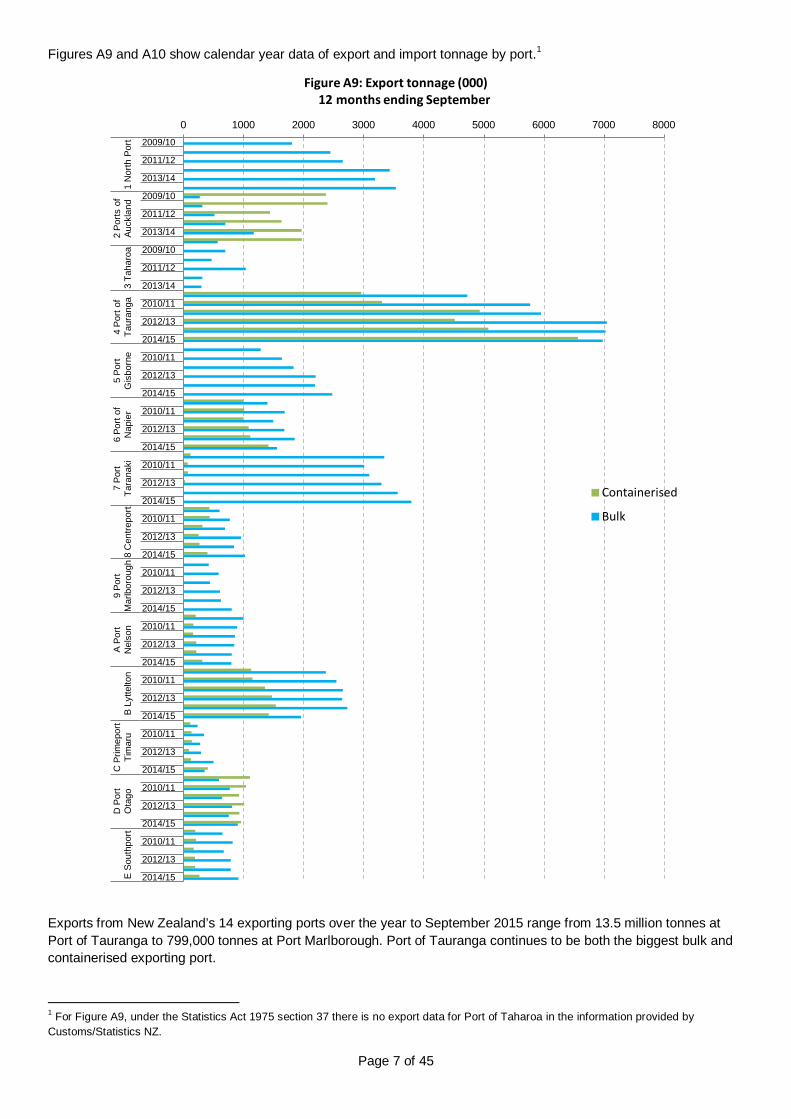
Figures A9 and A10 show calendar year data of export and import tonnage by port.1
Exports from New Zealand’s 14 exporting ports over the year to September 2015 range from 13.5 million tonnes at Port of Tauranga to 799,000 tonnes at Port Marlborough. Port of Tauranga continues to be both the biggest bulk and containerised exporting port.
1 For Figure A9, under the Statistics Act 1975 section 37 there is no export data for Port of Taharoa in the information provided by Customs/Statistics NZ.
0 1000 2000 3000 4000 5000 6000 7000 8000 2009/10
2011/12
2013/14
2009/10
2011/12
2013/14
2009/10
2011/12
2013/14
2010/11
2012/13
2014/15
2010/11
2012/13
2014/15
2010/11
2012/13
2014/15
2010/11
2012/13
2014/15
2010/11
2012/13
2014/15
2010/11
2012/13
2014/15
2010/11
2012/13
2014/15
2010/11
2012/13
2014/15
2010/11
2012/13
2014/15
2010/11
2012/13
2014/15
2010/11
2012/13
2014/15
1 N
orth
Por
t 2
Ports
of
Auck
land
3
Taha
roa
4 Po
rt of
Ta
uran
ga
5 Po
rt G
isbo
rne
6 Po
rt of
N
apie
r 7
Port
Tara
naki
8
Cen
trepo
rt 9
Port
Mar
lbor
ough
A
Port
Nel
son
B Ly
ttelto
n C
Prim
epor
t Ti
mar
u D
Por
t O
tago
E
Sout
hpor
t
Figure A9: Export tonnage (000) 12 months ending September
Containerised
Bulk
Page 8 of 45
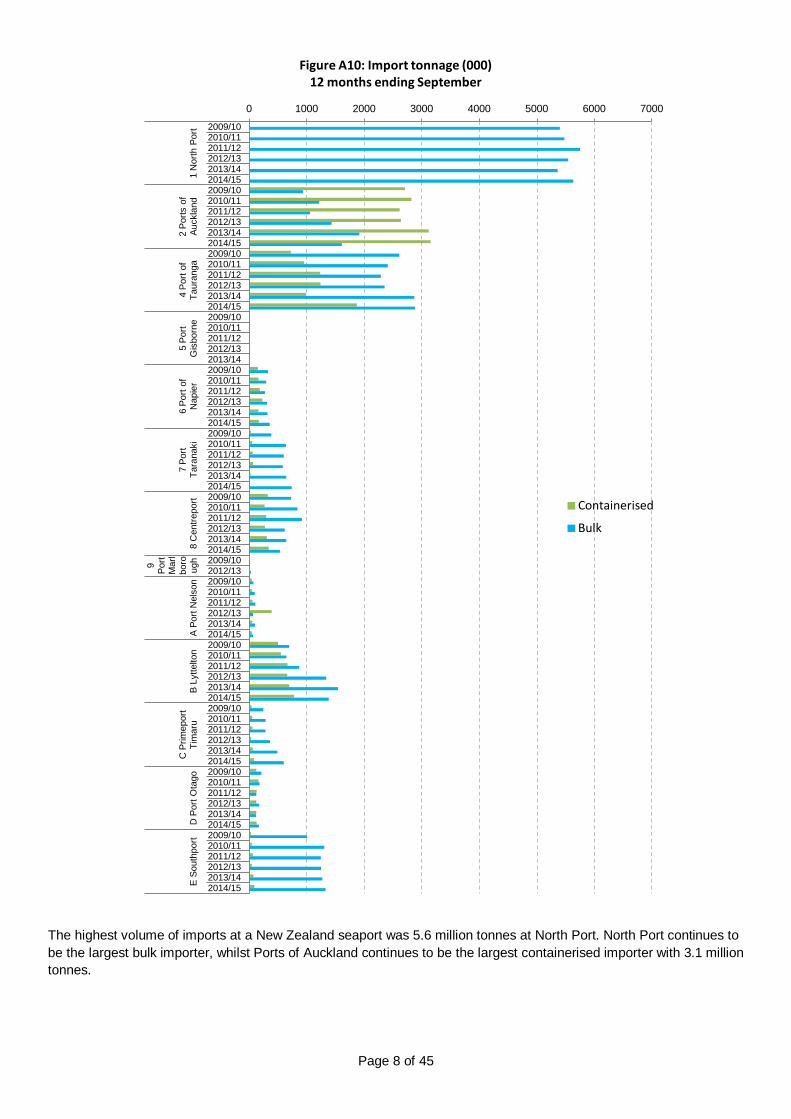
The highest volume of imports at a New Zealand seaport was 5.6 million tonnes at North Port. North Port continues to be the largest bulk importer, whilst Ports of Auckland continues to be the largest containerised importer with 3.1 million tonnes.
0 1000 2000 3000 4000 5000 6000 7000
2009/10 2010/11 2011/12 2012/13 2013/14 2014/15 2009/10 2010/11 2011/12 2012/13 2013/14 2014/15 2009/10 2010/11 2011/12 2012/13 2013/14 2014/15 2009/10 2010/11 2011/12 2012/13 2013/14 2009/10 2010/11 2011/12 2012/13 2013/14 2014/15 2009/10 2010/11 2011/12 2012/13 2013/14 2014/15 2009/10 2010/11 2011/12 2012/13 2013/14 2014/15 2009/10 2012/13 2009/10 2010/11 2011/12 2012/13 2013/14 2014/15 2009/10 2010/11 2011/12 2012/13 2013/14 2014/15 2009/10 2010/11 2011/12 2012/13 2013/14 2014/15 2009/10 2010/11 2011/12 2012/13 2013/14 2014/15 2009/10 2010/11 2011/12 2012/13 2013/14 2014/15
1 N
orth
Por
t 2
Ports
of
Auck
land
4
Port
of
Taur
anga
5
Port
Gis
born
e 6
Port
of
Nap
ier
7 Po
rt Ta
rana
ki
8 C
entre
port
9 Port
Mar
lbo
roug
h A
Port
Nel
son
B Ly
ttelto
n C
Prim
epor
t Ti
mar
u D
Por
t Ota
go
E So
uthp
ort
Figure A10: Import tonnage (000) 12 months ending September
Containerised
Bulk
Page 9 of 45
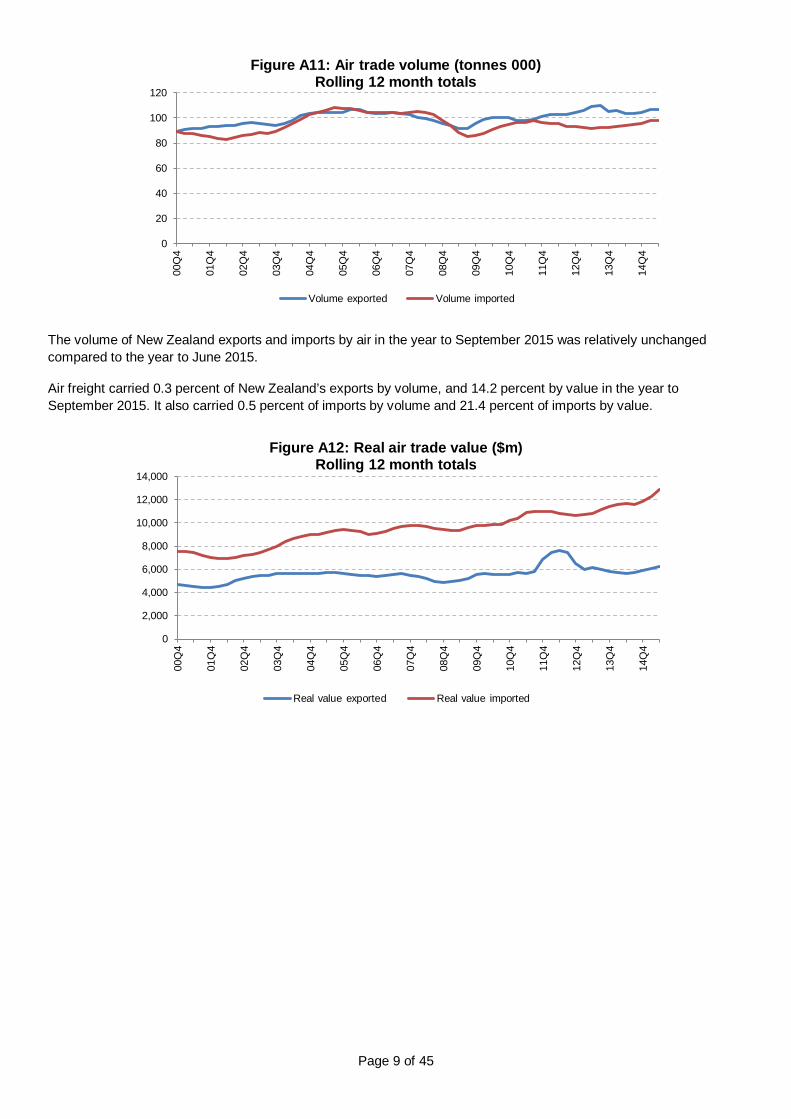
The volume of New Zealand exports and imports by air in the year to September 2015 was relatively unchanged compared to the year to June 2015.
Air freight carried 0.3 percent of New Zealand’s exports by volume, and 14.2 percent by value in the year to September 2015. It also carried 0.5 percent of imports by volume and 21.4 percent of imports by value.
0
20
40
60
80
100
120
00Q
4
01Q
4
02Q
4
03Q
4
04Q
4
05Q
4
06Q
4
07Q
4
08Q
4
09Q
4
10Q
4
11Q
4
12Q
4
13Q
4
14Q
4
Figure A11: Air trade volume (tonnes 000) Rolling 12 month totals
Volume exported Volume imported
0
2,000
4,000
6,000
8,000
10,000
12,000
14,000
00Q
4
01Q
4
02Q
4
03Q
4
04Q
4
05Q
4
06Q
4
07Q
4
08Q
4
09Q
4
10Q
4
11Q
4
12Q
4
13Q
4
14Q
4
Figure A12: Real air trade value ($m) Rolling 12 month totals
Real value exported Real value imported
Page 10 of 45
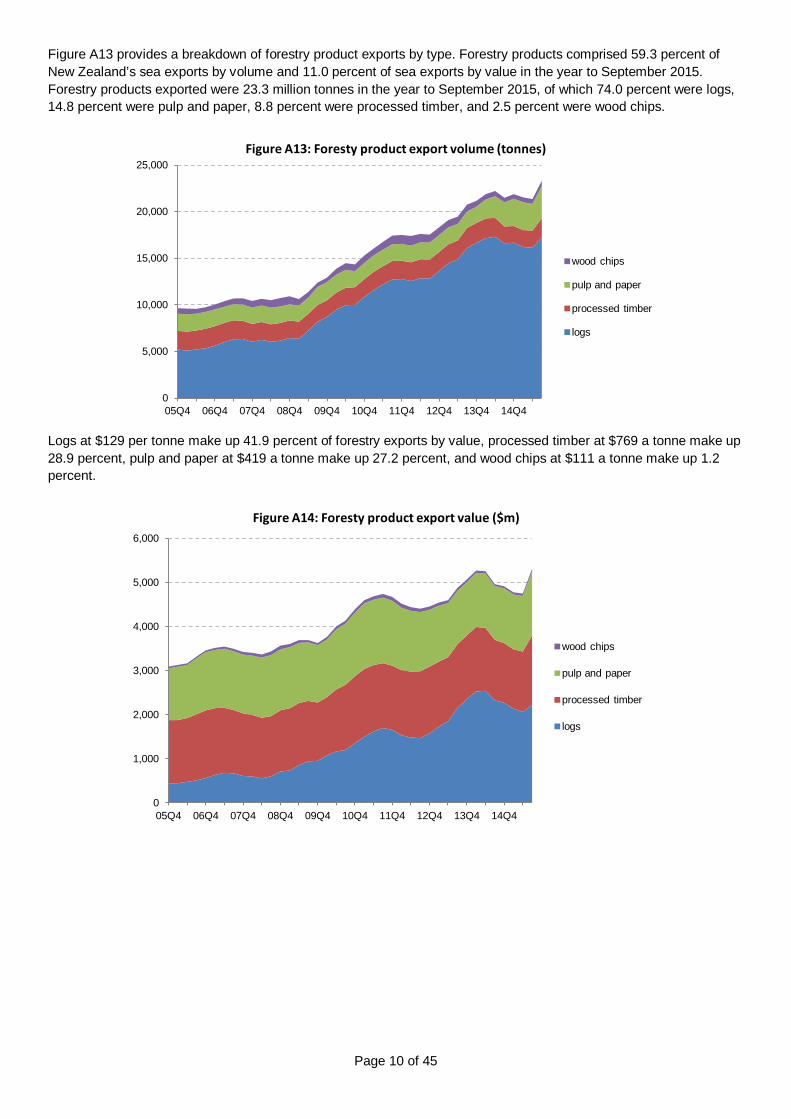
Figure A13 provides a breakdown of forestry product exports by type. Forestry products comprised 59.3 percent of New Zealand’s sea exports by volume and 11.0 percent of sea exports by value in the year to September 2015. Forestry products exported were 23.3 million tonnes in the year to September 2015, of which 74.0 percent were logs, 14.8 percent were pulp and paper, 8.8 percent were processed timber, and 2.5 percent were wood chips.
Logs at $129 per tonne make up 41.9 percent of forestry exports by value, processed timber at $769 a tonne make up 28.9 percent, pulp and paper at $419 a tonne make up 27.2 percent, and wood chips at $111 a tonne make up 1.2 percent.
0
5,000
10,000
15,000
20,000
25,000
05Q4 06Q4 07Q4 08Q4 09Q4 10Q4 11Q4 12Q4 13Q4 14Q4
Figure A13: Foresty product export volume (tonnes)
wood chips
pulp and paper
processed timber
logs
0
1,000
2,000
3,000
4,000
5,000
6,000
05Q4 06Q4 07Q4 08Q4 09Q4 10Q4 11Q4 12Q4 13Q4 14Q4
Figure A14: Foresty product export value ($m)
wood chips
pulp and paper
processed timber
logs
Page 11 of 45
Section B – Coastal Bulk Cargo
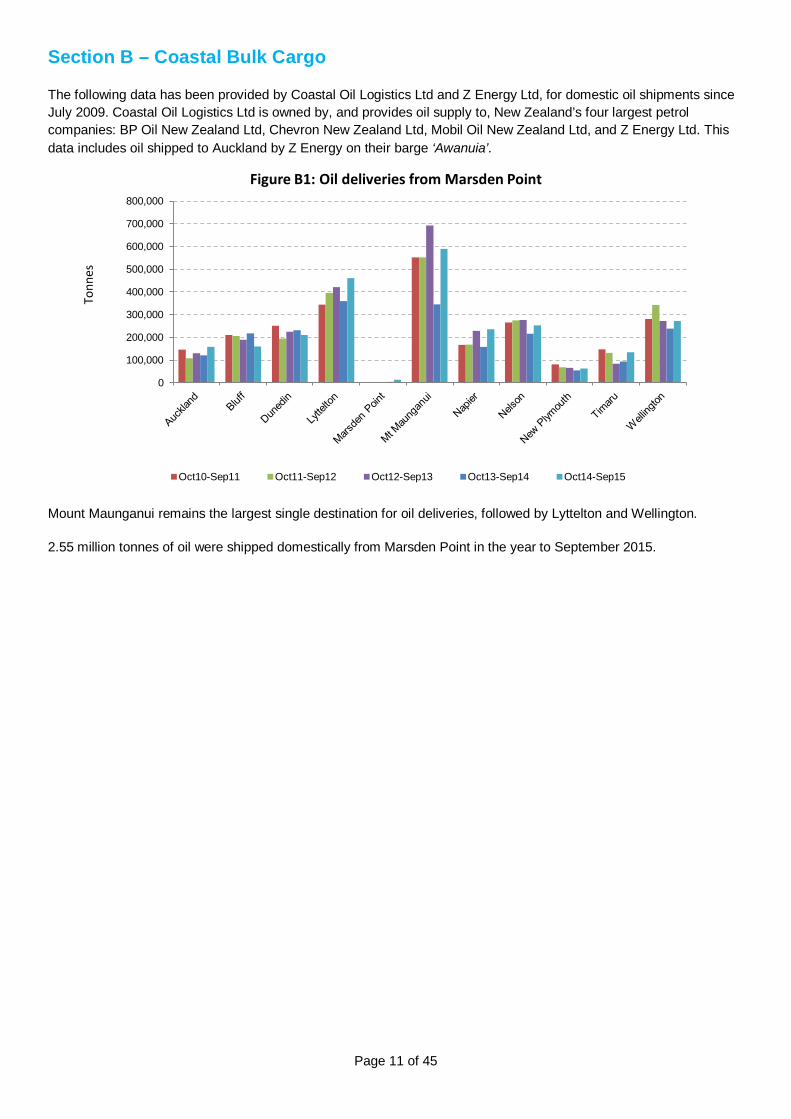
The following data has been provided by Coastal Oil Logistics Ltd and Z Energy Ltd, for domestic oil shipments since July 2009. Coastal Oil Logistics Ltd is owned by, and provides oil supply to, New Zealand’s four largest petrol companies: BP Oil New Zealand Ltd, Chevron New Zealand Ltd, Mobil Oil New Zealand Ltd, and Z Energy Ltd. This data includes oil shipped to Auckland by Z Energy on their barge ‘Awanuia’.
Mount Maunganui remains the largest single destination for oil deliveries, followed by Lyttelton and Wellington.
2.55 million tonnes of oil were shipped domestically from Marsden Point in the year to September 2015.
0
100,000
200,000
300,000
400,000
500,000
600,000
700,000
800,000
Tonn
es
Figure B1: Oil deliveries from Marsden Point
Oct10-Sep11 Oct11-Sep12 Oct12-Sep13 Oct13-Sep14 Oct14-Sep15
Page 12 of 45
Section C – Container Freight
2. Container shipping at a glance
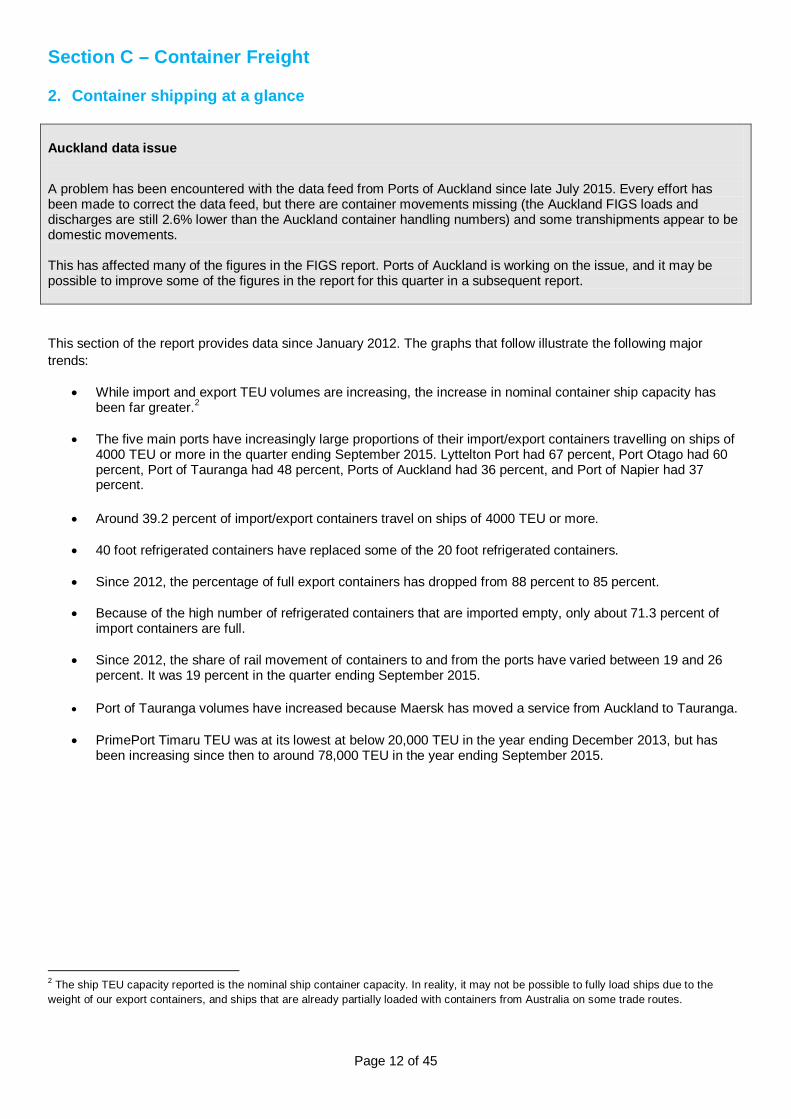
Auckland data issue A problem has been encountered with the data feed from Ports of Auckland since late July 2015. Every effort has been made to correct the data feed, but there are container movements missing (the Auckland FIGS loads and discharges are still 2.6% lower than the Auckland container handling numbers) and some transhipments appear to be domestic movements. This has affected many of the figures in the FIGS report. Ports of Auckland is working on the issue, and it may be possible to improve some of the figures in the report for this quarter in a subsequent report.
This section of the report provides data since January 2012. The graphs that follow illustrate the following major trends:
• While import and export TEU volumes are increasing, the increase in nominal container ship capacity has been far greater.2
• The five main ports have increasingly large proportions of their import/export containers travelling on ships of 4000 TEU or more in the quarter ending September 2015. Lyttelton Port had 67 percent, Port Otago had 60 percent, Port of Tauranga had 48 percent, Ports of Auckland had 36 percent, and Port of Napier had 37 percent.
• Around 39.2 percent of import/export containers travel on ships of 4000 TEU or more.
• 40 foot refrigerated containers have replaced some of the 20 foot refrigerated containers.
• Since 2012, the percentage of full export containers has dropped from 88 percent to 85 percent.
• Because of the high number of refrigerated containers that are imported empty, only about 71.3 percent of import containers are full.
• Since 2012, the share of rail movement of containers to and from the ports have varied between 19 and 26
percent. It was 19 percent in the quarter ending September 2015.
• Port of Tauranga volumes have increased because Maersk has moved a service from Auckland to Tauranga.
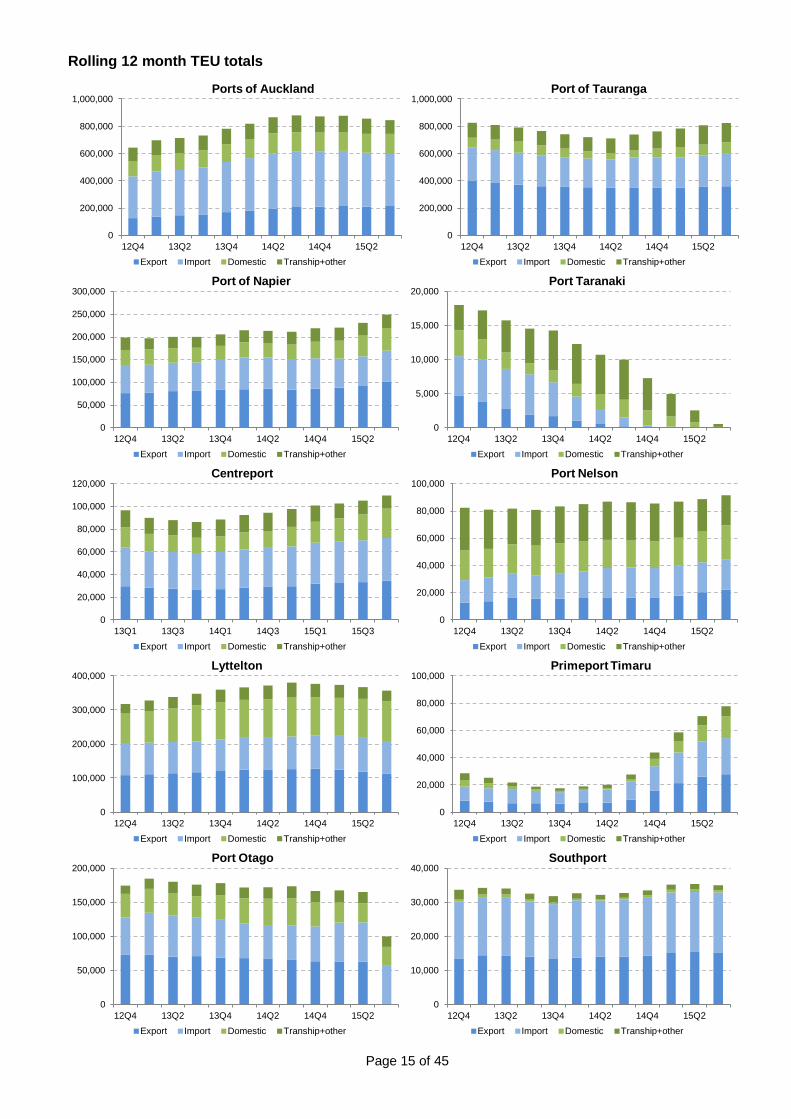
• PrimePort Timaru TEU was at its lowest at below 20,000 TEU in the year ending December 2013, but has been increasing since then to around 78,000 TEU in the year ending September 2015.
2 The ship TEU capacity reported is the nominal ship container capacity. In reality, it may not be possible to fully load ships due to the weight of our export containers, and ships that are already partially loaded with containers from Australia on some trade routes.
Page 13 of 45
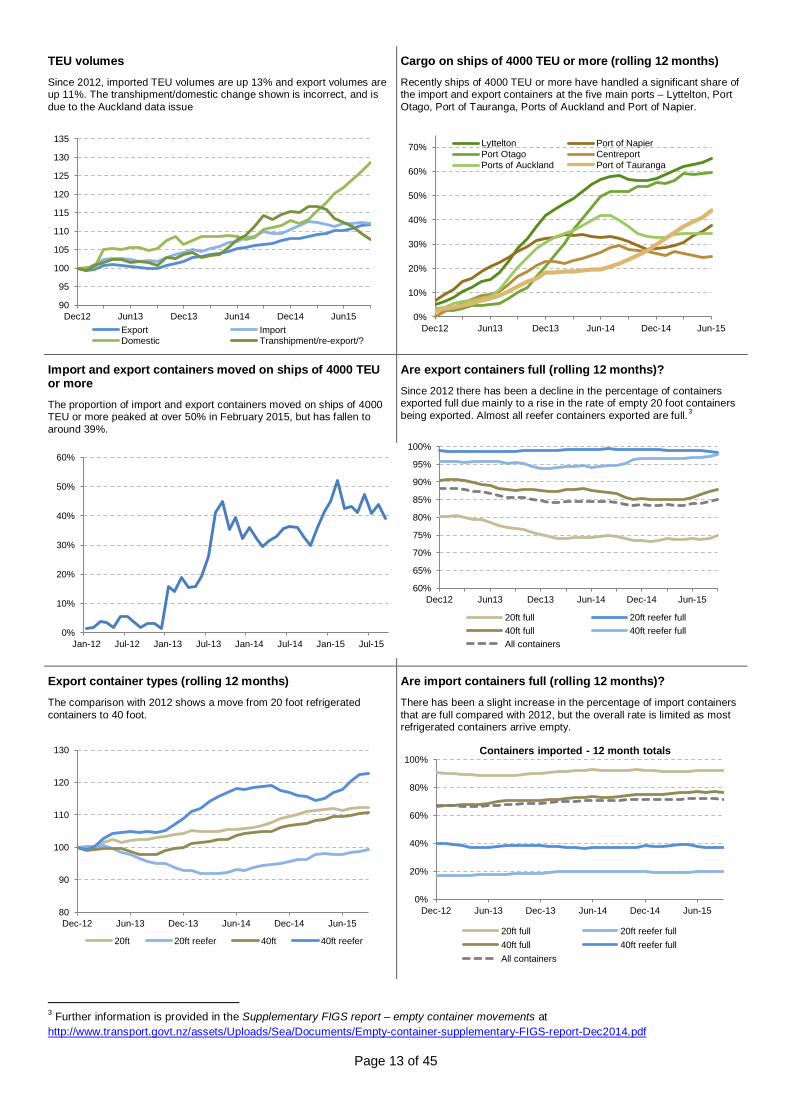
TEU volumes Since 2012, imported TEU volumes are up 13% and export volumes are up 11%. The transhipment/domestic change shown is incorrect, and is due to the Auckland data issue
Cargo on ships of 4000 TEU or more (rolling 12 months) Recently ships of 4000 TEU or more have handled a significant share of the import and export containers at the five main ports – Lyttelton, Port Otago, Port of Tauranga, Ports of Auckland and Port of Napier.
Import and export containers moved on ships of 4000 TEU or more The proportion of import and export containers moved on ships of 4000 TEU or more peaked at over 50% in February 2015, but has fallen to around 39%.
Are export containers full (rolling 12 months)? Since 2012 there has been a decline in the percentage of containers exported full due mainly to a rise in the rate of empty 20 foot containers being exported. Almost all reefer containers exported are full.3
Export container types (rolling 12 months) The comparison with 2012 shows a move from 20 foot refrigerated containers to 40 foot.
Are import containers full (rolling 12 months)? There has been a slight increase in the percentage of import containers that are full compared with 2012, but the overall rate is limited as most refrigerated containers arrive empty.
3 Further information is provided in the Supplementary FIGS report – empty container movements at http://www.transport.govt.nz/assets/Uploads/Sea/Documents/Empty-container-supplementary-FIGS-report-Dec2014.pdf
90
95
100
105
110
115
120
125
130
135
Dec12 Jun13 Dec13 Jun14 Dec14 Jun15 Export Import Domestic Transhipment/re-export/?
0%
10%
20%
30%
40%
50%
60%
70%
Dec12 Jun13 Dec13 Jun-14 Dec-14 Jun-15
Lyttelton Port of Napier Port Otago Centreport Ports of Auckland Port of Tauranga
0%
10%
20%
30%
40%
50%
60%
Jan-12 Jul-12 Jan-13 Jul-13 Jan-14 Jul-14 Jan-15 Jul-15
60%
65%
70%
75%
80%
85%
90%
95%
100%
Dec12 Jun13 Dec13 Jun-14 Dec-14 Jun-15
20ft full 20ft reefer full 40ft full 40ft reefer full All containers
80
90
100
110
120
130
Dec-12 Jun-13 Dec-13 Jun-14 Dec-14 Jun-15
20ft 20ft reefer 40ft 40ft reefer
0%
20%
40%
60%
80%
100%
Dec-12 Jun-13 Dec-13 Jun-14 Dec-14 Jun-15
Containers imported - 12 month totals
20ft full 20ft reefer full 40ft full 40ft reefer full All containers
Page 14 of 45
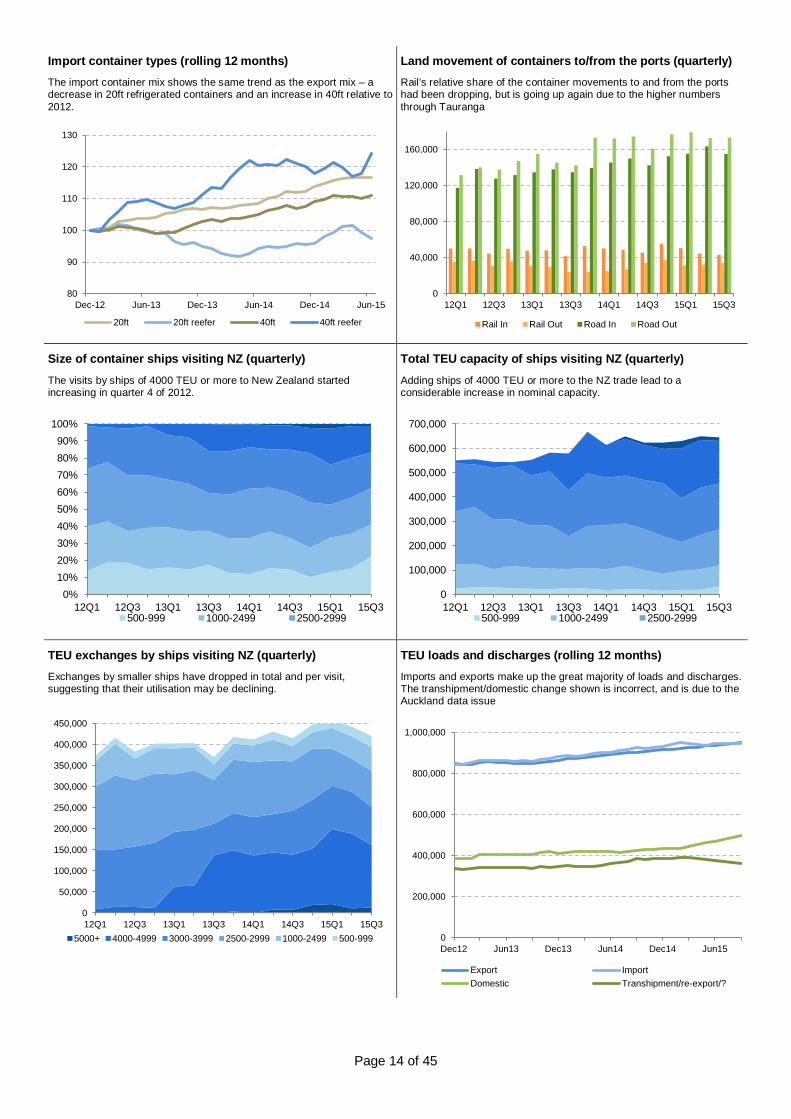
Import container types (rolling 12 months) The import container mix shows the same trend as the export mix – a decrease in 20ft refrigerated containers and an increase in 40ft relative to 2012.
Land movement of containers to/from the ports (quarterly) Rail’s relative share of the container movements to and from the ports had been dropping, but is going up again due to the higher numbers through Tauranga
Size of container ships visiting NZ (quarterly) The visits by ships of 4000 TEU or more to New Zealand started increasing in quarter 4 of 2012.
Total TEU capacity of ships visiting NZ (quarterly) Adding ships of 4000 TEU or more to the NZ trade lead to a considerable increase in nominal capacity.
TEU exchanges by ships visiting NZ (quarterly) Exchanges by smaller ships have dropped in total and per visit, suggesting that their utilisation may be declining.
TEU loads and discharges (rolling 12 months) Imports and exports make up the great majority of loads and discharges. The transhipment/domestic change shown is incorrect, and is due to the Auckland data issue
80
90
100
110
120
130
Dec-12 Jun-13 Dec-13 Jun-14 Dec-14 Jun-15
20ft 20ft reefer 40ft 40ft reefer
0
40,000
80,000
120,000
160,000
12Q1 12Q3 13Q1 13Q3 14Q1 14Q3 15Q1 15Q3
Rail In Rail Out Road In Road Out
0% 10% 20% 30% 40% 50% 60% 70% 80% 90%
100%
12Q1 12Q3 13Q1 13Q3 14Q1 14Q3 15Q1 15Q3 500-999 1000-2499 2500-2999
0
100,000
200,000
300,000
400,000
500,000
600,000
700,000
12Q1 12Q3 13Q1 13Q3 14Q1 14Q3 15Q1 15Q3 500-999 1000-2499 2500-2999
0
50,000
100,000
150,000
200,000
250,000
300,000
350,000
400,000
450,000
12Q1 12Q3 13Q1 13Q3 14Q1 14Q3 15Q1 15Q3 5000+ 4000-4999 3000-3999 2500-2999 1000-2499 500-999 0
200,000
400,000
600,000
800,000
1,000,000
Dec12 Jun13 Dec13 Jun14 Dec14 Jun15
Export Import Domestic Transhipment/re-export/?
Page 15 of 45
Rolling 12 month TEU totals
0
200,000
400,000
600,000
800,000
1,000,000
12Q4 13Q2 13Q4 14Q2 14Q4 15Q2
Ports of Auckland
Export Import Domestic Tranship+other
0
200,000
400,000
600,000
800,000
1,000,000
12Q4 13Q2 13Q4 14Q2 14Q4 15Q2
Port of Tauranga
Export Import Domestic Tranship+other
0
50,000
100,000
150,000
200,000
250,000
300,000
12Q4 13Q2 13Q4 14Q2 14Q4 15Q2
Port of Napier
Export Import Domestic Tranship+other
0
5,000
10,000
15,000
20,000
12Q4 13Q2 13Q4 14Q2 14Q4 15Q2
Port Taranaki
Export Import Domestic Tranship+other
0
20,000
40,000
60,000
80,000
100,000
120,000
13Q1 13Q3 14Q1 14Q3 15Q1 15Q3
Centreport
Export Import Domestic Tranship+other
0
20,000
40,000
60,000
80,000
100,000
12Q4 13Q2 13Q4 14Q2 14Q4 15Q2
Port Nelson
Export Import Domestic Tranship+other
0
100,000
200,000
300,000
400,000
12Q4 13Q2 13Q4 14Q2 14Q4 15Q2
Lyttelton
Export Import Domestic Tranship+other
0
20,000
40,000
60,000
80,000
100,000
12Q4 13Q2 13Q4 14Q2 14Q4 15Q2
Primeport Timaru
Export Import Domestic Tranship+other
0
50,000
100,000
150,000
200,000
12Q4 13Q2 13Q4 14Q2 14Q4 15Q2
Port Otago
Export Import Domestic Tranship+other
0
10,000
20,000
30,000
40,000
12Q4 13Q2 13Q4 14Q2 14Q4 15Q2
Southport
Export Import Domestic Tranship+other
Page 16 of 45
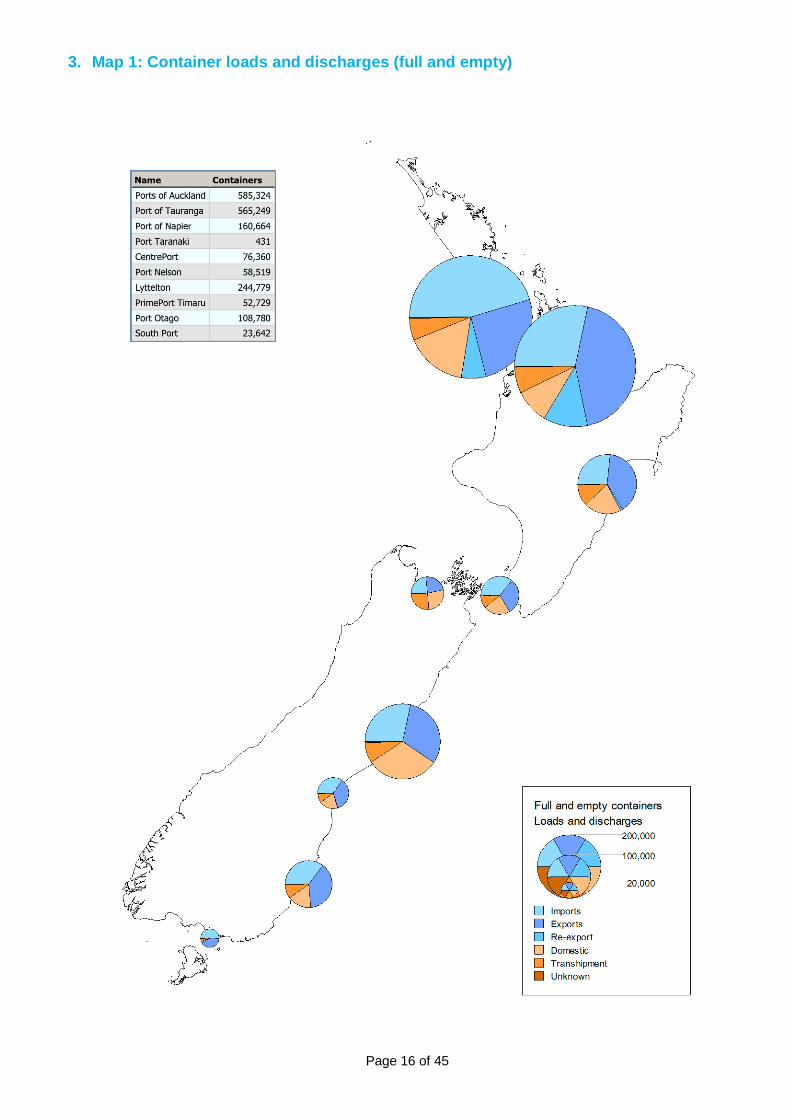
3. Map 1: Container loads and discharges (full and empty)
Page 17 of 45
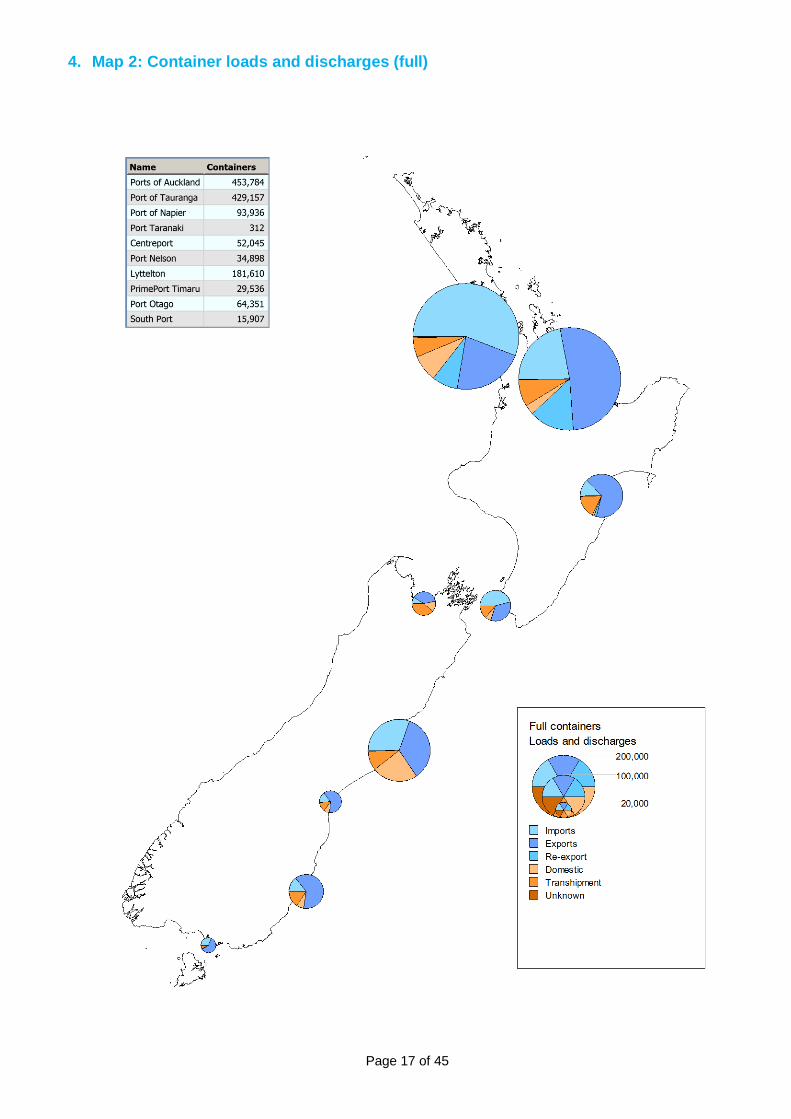
4. Map 2: Container loads and discharges (full)
Page 18 of 45
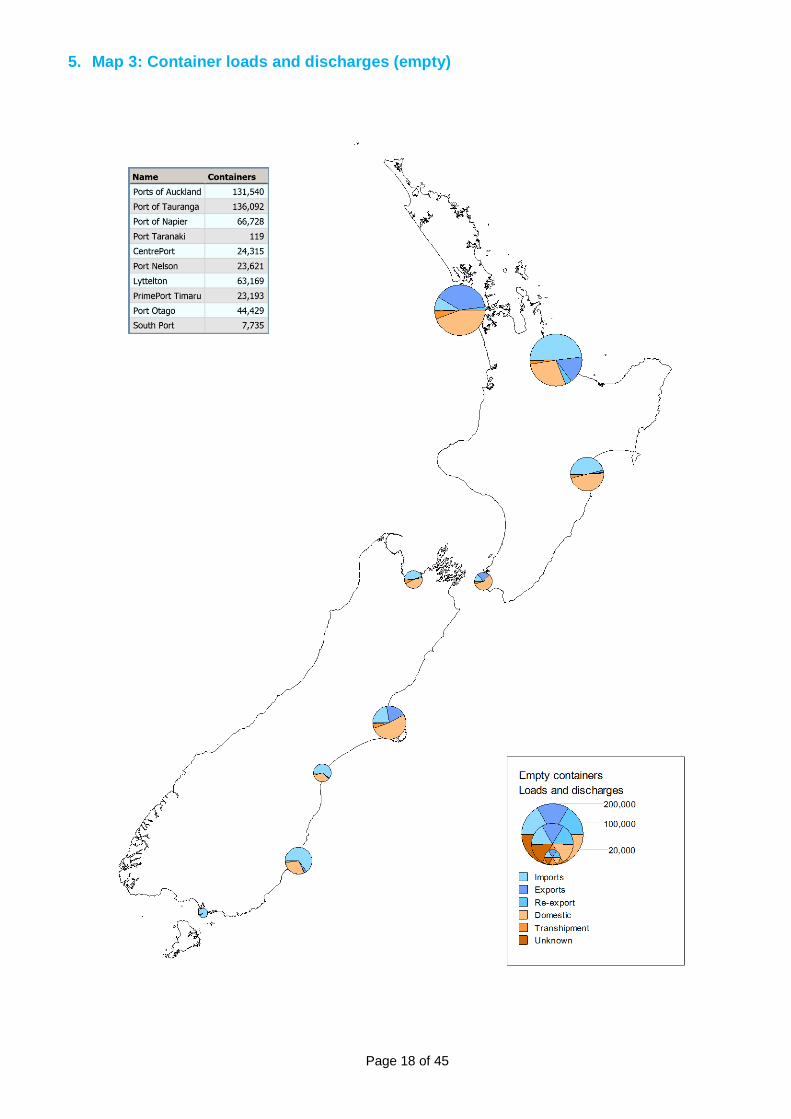
5. Map 3: Container loads and discharges (empty)
Page 19 of 45
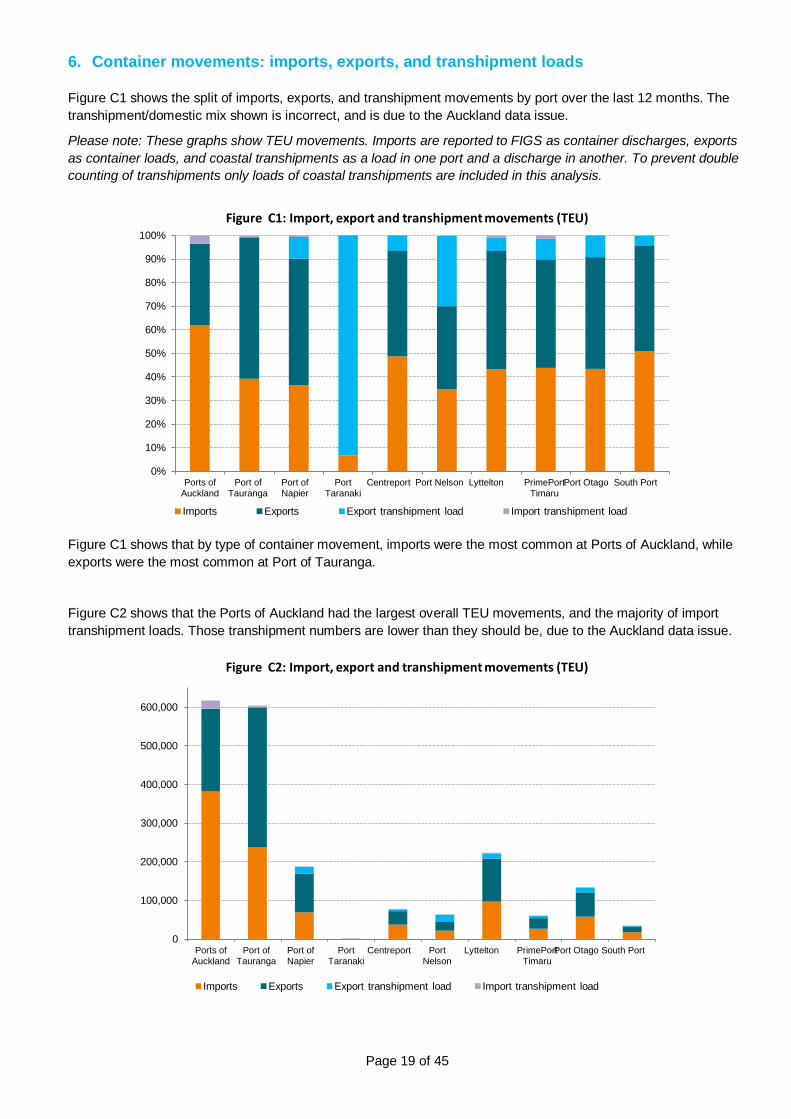
6. Container movements: imports, exports, and transhipment loads
Figure C1 shows the split of imports, exports, and transhipment movements by port over the last 12 months. The transhipment/domestic mix shown is incorrect, and is due to the Auckland data issue.
Please note: These graphs show TEU movements. Imports are reported to FIGS as container discharges, exports as container loads, and coastal transhipments as a load in one port and a discharge in another. To prevent double counting of transhipments only loads of coastal transhipments are included in this analysis.
Figure C1 shows that by type of container movement, imports were the most common at Ports of Auckland, while exports were the most common at Port of Tauranga.
Figure C2 shows that the Ports of Auckland had the largest overall TEU movements, and the majority of import transhipment loads. Those transhipment numbers are lower than they should be, due to the Auckland data issue.
0%
10%
20%
30%
40%
50%
60%
70%
80%
90%
100%
Ports of Auckland
Port of Tauranga
Port of Napier
Port Taranaki
Centreport Port Nelson Lyttelton PrimePort Timaru
Port Otago South Port
Figure C1: Import, export and transhipment movements (TEU)
Imports Exports Export transhipment load Import transhipment load
0
100,000
200,000
300,000
400,000
500,000
600,000
Ports of Auckland
Port of Tauranga
Port of Napier
Port Taranaki
Centreport Port Nelson
Lyttelton PrimePort Timaru
Port Otago South Port
Figure C2: Import, export and transhipment movements (TEU)
Imports Exports Export transhipment load Import transhipment load
Page 20 of 45
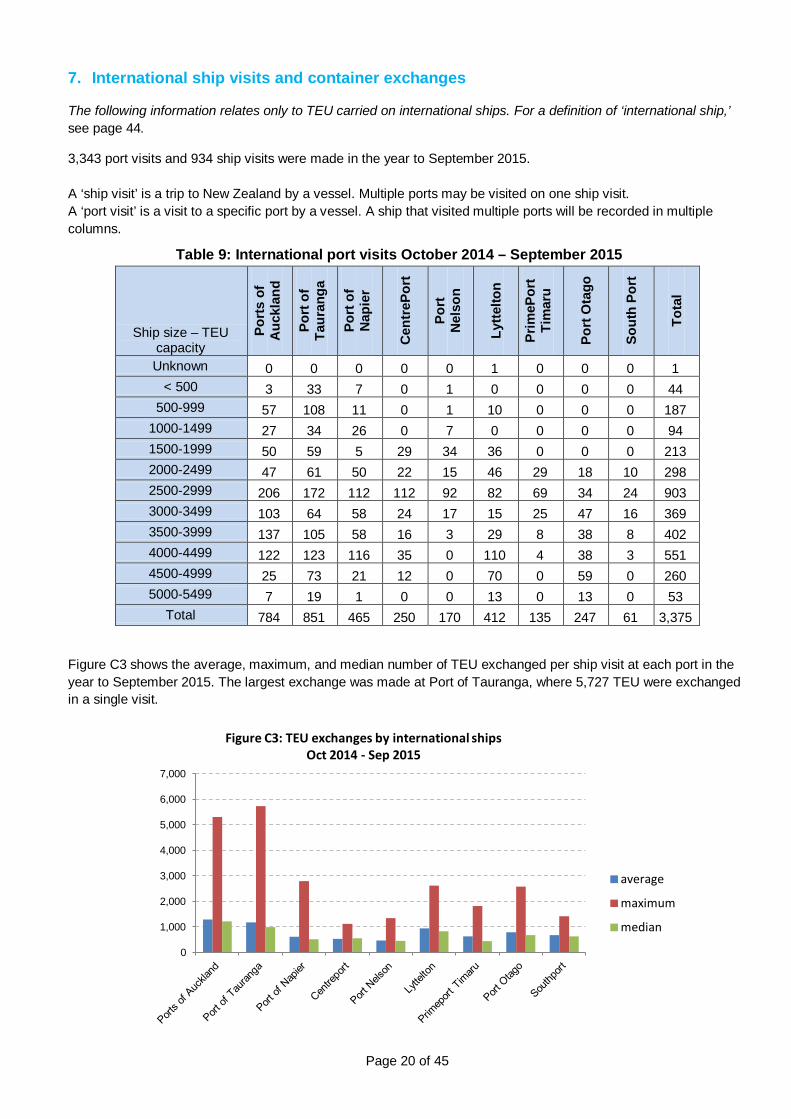
7. International ship visits and container exchanges
The following information relates only to TEU carried on international ships. For a definition of ‘international ship,’ see page 44.
3,343 port visits and 934 ship visits were made in the year to September 2015. A ‘ship visit’ is a trip to New Zealand by a vessel. Multiple ports may be visited on one ship visit. A ‘port visit’ is a visit to a specific port by a vessel. A ship that visited multiple ports will be recorded in multiple columns.
Table 9: International port visits October 2014 – September 2015
Ship size – TEU capacity
Port
s of
A
uckl
and
Port
of
Taur
anga
Port
of
Nap
ier
Cen
treP
ort
Port
N
elso
n
Lytte
lton
Prim
ePor
t Ti
mar
u
Port
Ota
go
Sout
h Po
rt
Tota
l
Unknown 0 0 0 0 0 1 0 0 0 1 < 500 3 33 7 0 1 0 0 0 0 44
500-999 57 108 11 0 1 10 0 0 0 187 1000-1499 27 34 26 0 7 0 0 0 0 94 1500-1999 50 59 5 29 34 36 0 0 0 213 2000-2499 47 61 50 22 15 46 29 18 10 298 2500-2999 206 172 112 112 92 82 69 34 24 903 3000-3499 103 64 58 24 17 15 25 47 16 369 3500-3999 137 105 58 16 3 29 8 38 8 402 4000-4499 122 123 116 35 0 110 4 38 3 551 4500-4999 25 73 21 12 0 70 0 59 0 260 5000-5499 7 19 1 0 0 13 0 13 0 53
Total 784 851 465 250 170 412 135 247 61 3,375
Figure C3 shows the average, maximum, and median number of TEU exchanged per ship visit at each port in the year to September 2015. The largest exchange was made at Port of Tauranga, where 5,727 TEU were exchanged in a single visit.
0
1,000
2,000
3,000
4,000
5,000
6,000
7,000
Figure C3: TEU exchanges by international ships Oct 2014 - Sep 2015
average
maximum
median
Page 21 of 45
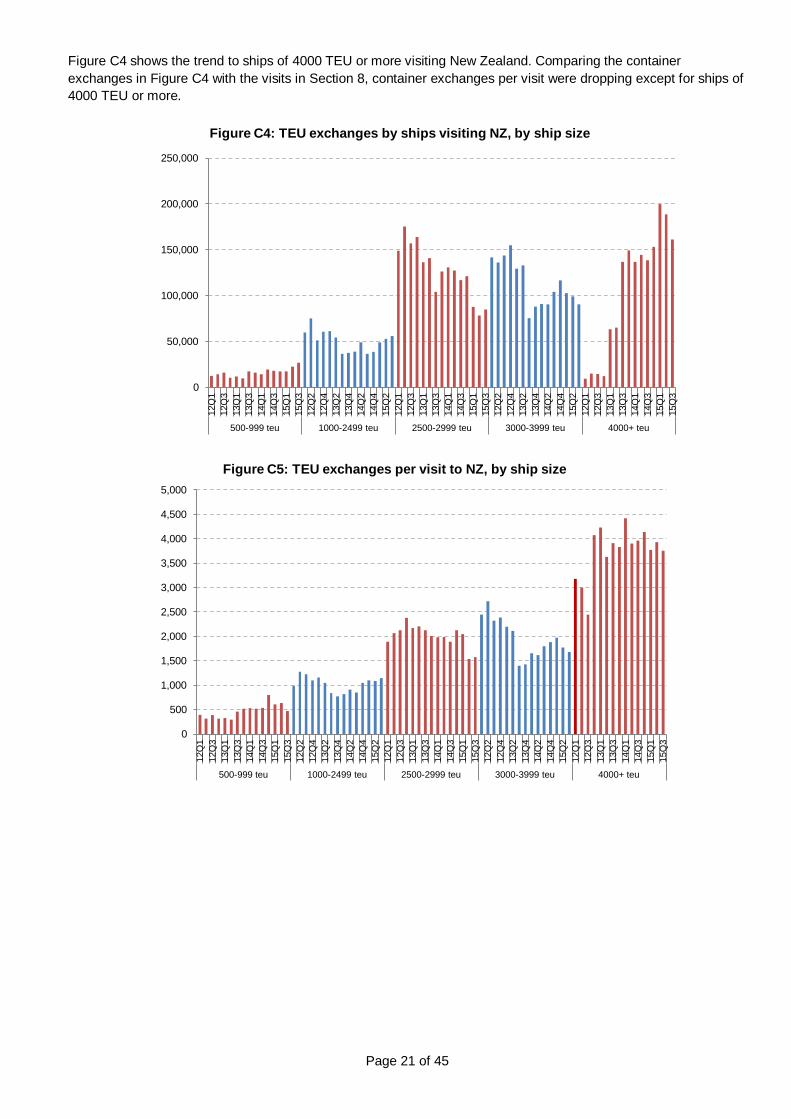
Figure C4 shows the trend to ships of 4000 TEU or more visiting New Zealand. Comparing the container exchanges in Figure C4 with the visits in Section 8, container exchanges per visit were dropping except for ships of 4000 TEU or more.
0
50,000
100,000
150,000
200,000
250,000
12Q
1 12
Q3
13Q
1 13
Q3
14Q
1 14
Q3
15Q
1 15
Q3
12Q
2 12
Q4
13Q
2 13
Q4
14Q
2 14
Q4
15Q
2 12
Q1
12Q
3 13
Q1
13Q
3 14
Q1
14Q
3 15
Q1
15Q
3 12
Q2
12Q
4 13
Q2
13Q
4 14
Q2
14Q
4 15
Q2
12Q
1 12
Q3
13Q
1 13
Q3
14Q
1 14
Q3
15Q
1 15
Q3
500-999 teu 1000-2499 teu 2500-2999 teu 3000-3999 teu 4000+ teu
Figure C4: TEU exchanges by ships visiting NZ, by ship size
0
500
1,000
1,500
2,000
2,500
3,000
3,500
4,000
4,500
5,000
12Q
1 12
Q3
13Q
1 13
Q3
14Q
1 14
Q3
15Q
1 15
Q3
12Q
2 12
Q4
13Q
2 13
Q4
14Q
2 14
Q4
15Q
2 12
Q1
12Q
3 13
Q1
13Q
3 14
Q1
14Q
3 15
Q1
15Q
3 12
Q2
12Q
4 13
Q2
13Q
4 14
Q2
14Q
4 15
Q2
12Q
1 12
Q3
13Q
1 13
Q3
14Q
1 14
Q3
15Q
1 15
Q3
500-999 teu 1000-2499 teu 2500-2999 teu 3000-3999 teu 4000+ teu
Figure C5: TEU exchanges per visit to NZ, by ship size
Page 22 of 45
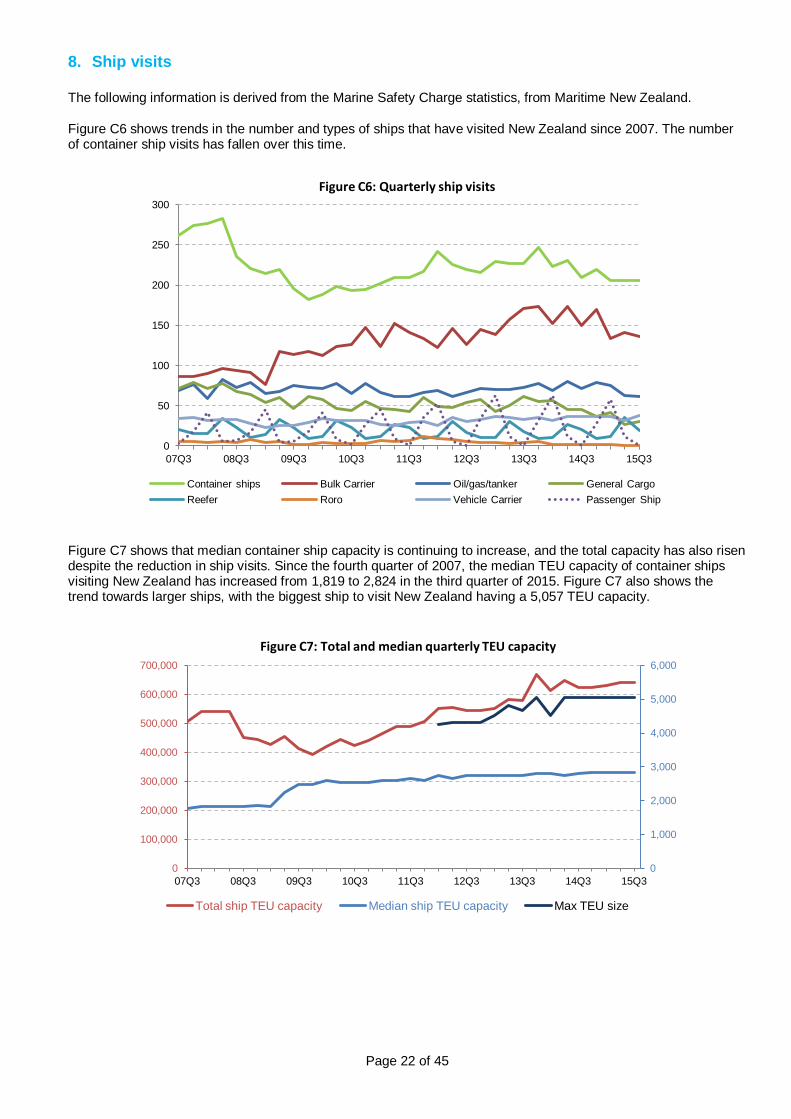
8. Ship visits
The following information is derived from the Marine Safety Charge statistics, from Maritime New Zealand.
Figure C6 shows trends in the number and types of ships that have visited New Zealand since 2007. The number of container ship visits has fallen over this time.
Figure C7 shows that median container ship capacity is continuing to increase, and the total capacity has also risen despite the reduction in ship visits. Since the fourth quarter of 2007, the median TEU capacity of container ships visiting New Zealand has increased from 1,819 to 2,824 in the third quarter of 2015. Figure C7 also shows the trend towards larger ships, with the biggest ship to visit New Zealand having a 5,057 TEU capacity.
0
50
100
150
200
250
300
07Q3 08Q3 09Q3 10Q3 11Q3 12Q3 13Q3 14Q3 15Q3
Figure C6: Quarterly ship visits
Container ships Bulk Carrier Oil/gas/tanker General Cargo Reefer Roro Vehicle Carrier Passenger Ship
0
1,000
2,000
3,000
4,000
5,000
6,000
0
100,000
200,000
300,000
400,000
500,000
600,000
700,000
07Q3 08Q3 09Q3 10Q3 11Q3 12Q3 13Q3 14Q3 15Q3
Figure C7: Total and median quarterly TEU capacity
Total ship TEU capacity Median ship TEU capacity Max TEU size
Page 23 of 45
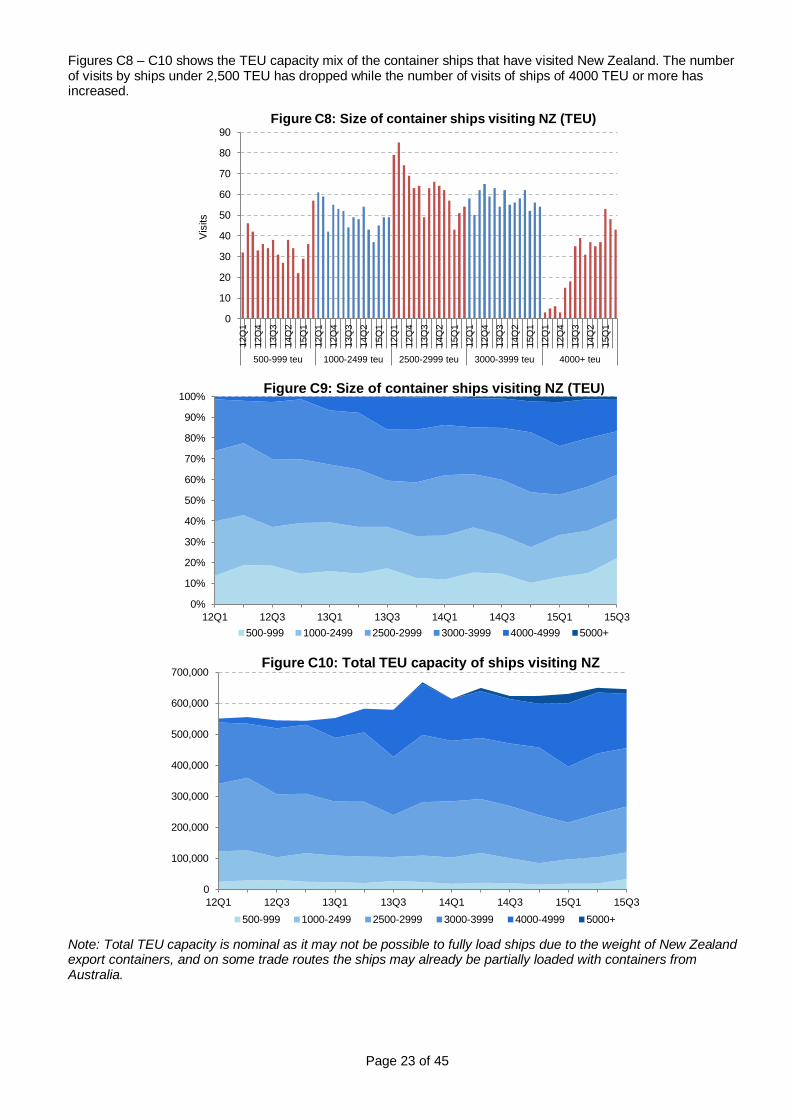
Figures C8 – C10 shows the TEU capacity mix of the container ships that have visited New Zealand. The number of visits by ships under 2,500 TEU has dropped while the number of visits of ships of 4000 TEU or more has increased.
Note: Total TEU capacity is nominal as it may not be possible to fully load ships due to the weight of New Zealand export containers, and on some trade routes the ships may already be partially loaded with containers from Australia.
0
10
20
30
40
50
60
70
80
90
12Q
1 12
Q4
13Q
3 14
Q2
15Q
1 12
Q1
12Q
4 13
Q3
14Q
2 15
Q1
12Q
1 12
Q4
13Q
3 14
Q2
15Q
1 12
Q1
12Q
4 13
Q3
14Q
2 15
Q1
12Q
1 12
Q4
13Q
3 14
Q2
15Q
1
500-999 teu 1000-2499 teu 2500-2999 teu 3000-3999 teu 4000+ teu
Vis
its
Figure C8: Size of container ships visiting NZ (TEU)
0%
10%
20%
30%
40%
50%
60%
70%
80%
90%
100%
12Q1 12Q3 13Q1 13Q3 14Q1 14Q3 15Q1 15Q3
Figure C9: Size of container ships visiting NZ (TEU)
500-999 1000-2499 2500-2999 3000-3999 4000-4999 5000+
0
100,000
200,000
300,000
400,000
500,000
600,000
700,000
12Q1 12Q3 13Q1 13Q3 14Q1 14Q3 15Q1 15Q3
Figure C10: Total TEU capacity of ships visiting NZ
500-999 1000-2499 2500-2999 3000-3999 4000-4999 5000+
Page 24 of 45
9. Exports and imports – 20 foot and 40 foot container balance
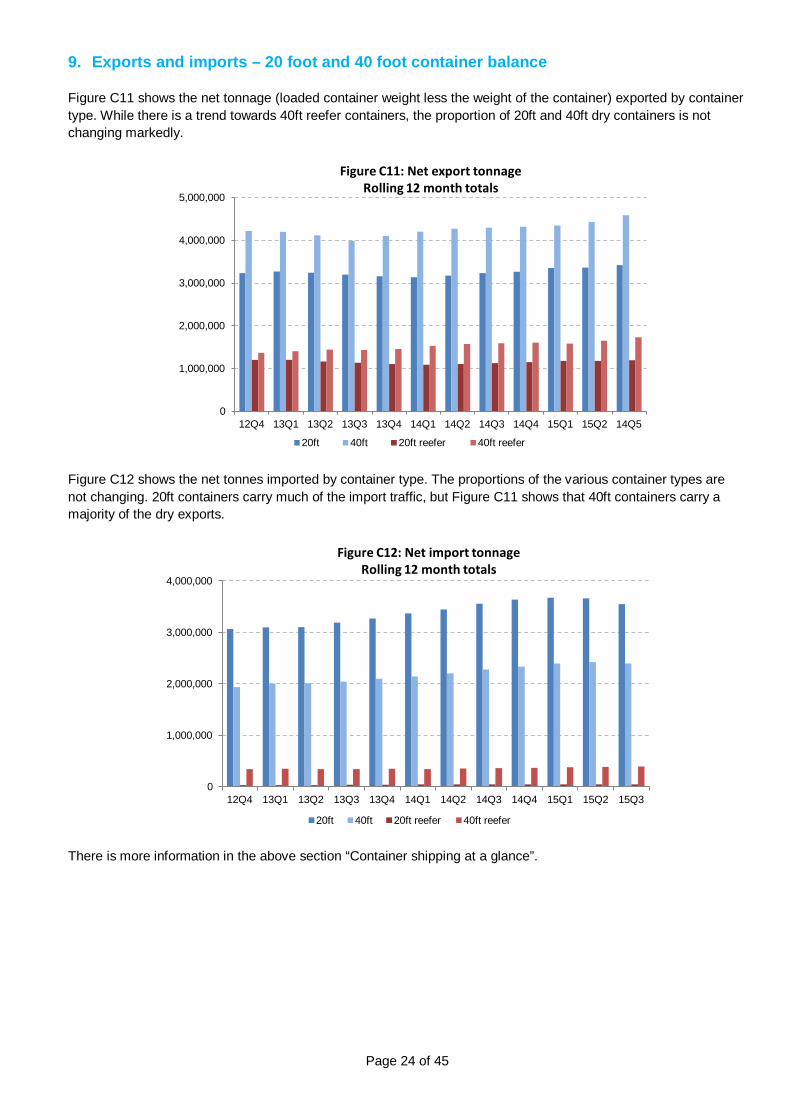
Figure C11 shows the net tonnage (loaded container weight less the weight of the container) exported by container type. While there is a trend towards 40ft reefer containers, the proportion of 20ft and 40ft dry containers is not changing markedly.
Figure C12 shows the net tonnes imported by container type. The proportions of the various container types are not changing. 20ft containers carry much of the import traffic, but Figure C11 shows that 40ft containers carry a majority of the dry exports.
There is more information in the above section “Container shipping at a glance”.
0
1,000,000
2,000,000
3,000,000
4,000,000
5,000,000
12Q4 13Q1 13Q2 13Q3 13Q4 14Q1 14Q2 14Q3 14Q4 15Q1 15Q2 14Q5
Figure C11: Net export tonnage Rolling 12 month totals
20ft 40ft 20ft reefer 40ft reefer
0
1,000,000
2,000,000
3,000,000
4,000,000
12Q4 13Q1 13Q2 13Q3 13Q4 14Q1 14Q2 14Q3 14Q4 15Q1 15Q2 15Q3
Figure C12: Net import tonnage Rolling 12 month totals
20ft 40ft 20ft reefer 40ft reefer
Page 25 of 45
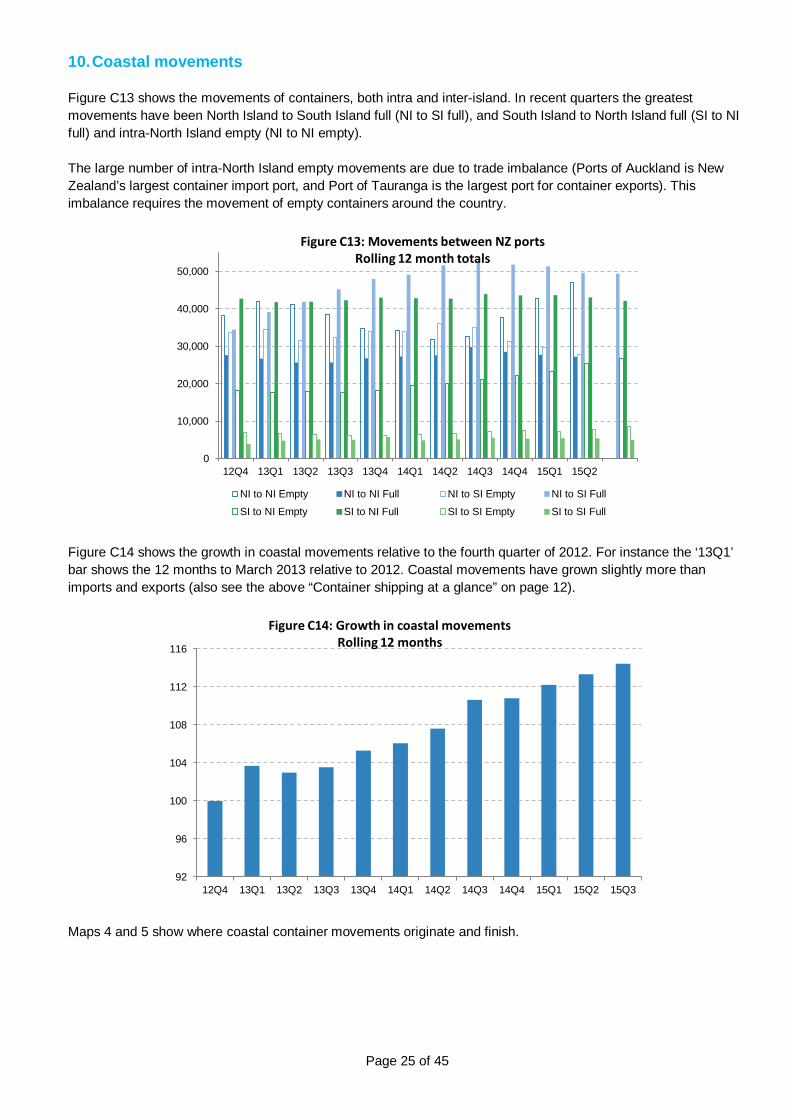
10. Coastal movements
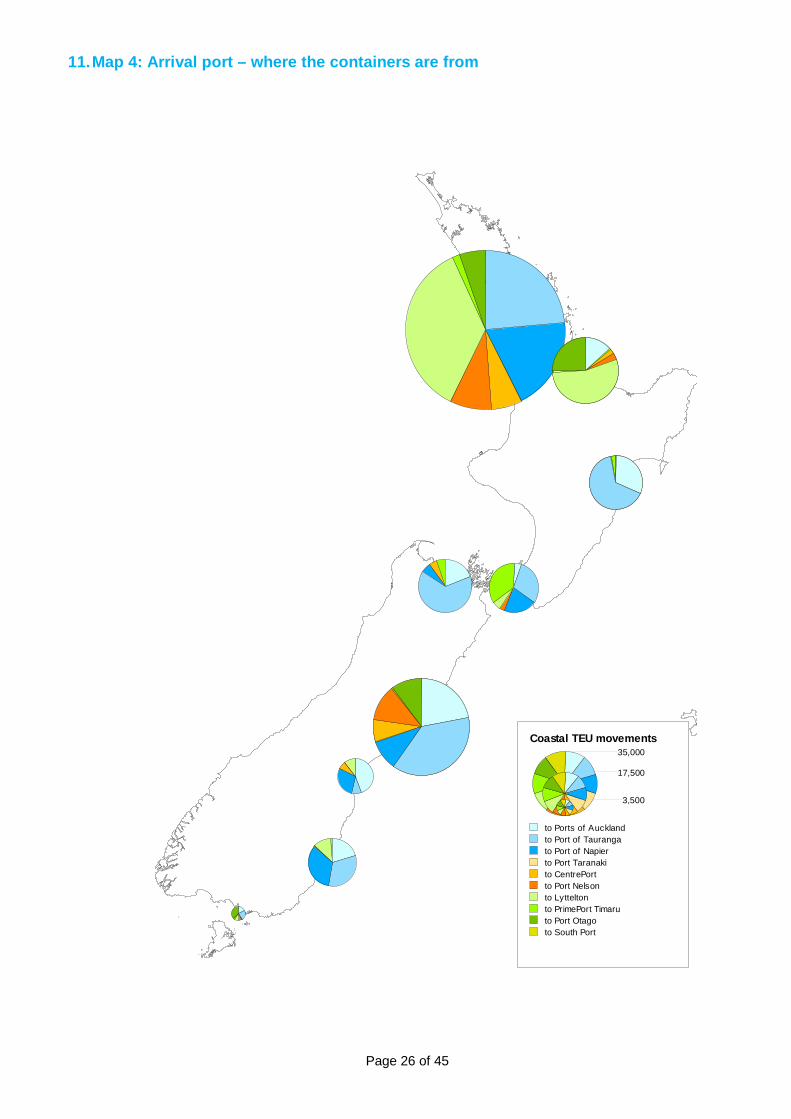
Figure C13 shows the movements of containers, both intra and inter-island. In recent quarters the greatest movements have been North Island to South Island full (NI to SI full), and South Island to North Island full (SI to NI full) and intra-North Island empty (NI to NI empty). The large number of intra-North Island empty movements are due to trade imbalance (Ports of Auckland is New Zealand’s largest container import port, and Port of Tauranga is the largest port for container exports). This imbalance requires the movement of empty containers around the country.
Figure C14 shows the growth in coastal movements relative to the fourth quarter of 2012. For instance the ‘13Q1’ bar shows the 12 months to March 2013 relative to 2012. Coastal movements have grown slightly more than imports and exports (also see the above “Container shipping at a glance” on page 12).
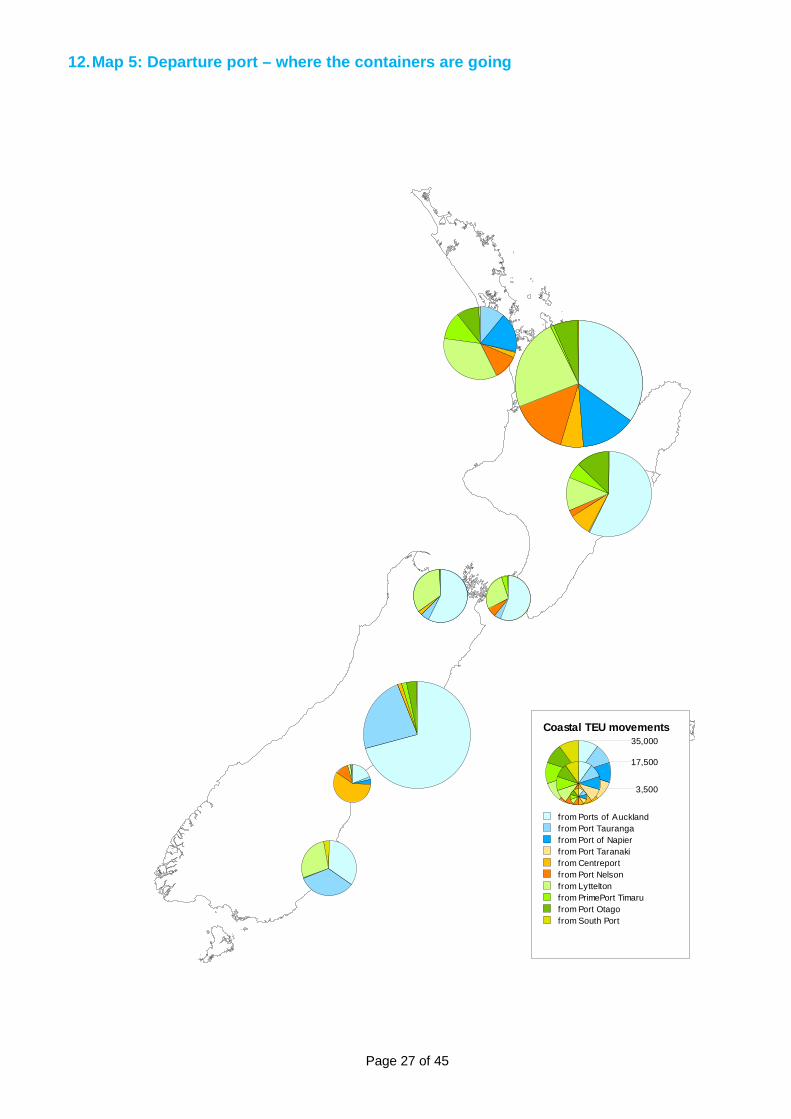
Maps 4 and 5 show where coastal container movements originate and finish.
0
10,000
20,000
30,000
40,000
50,000
12Q4 13Q1 13Q2 13Q3 13Q4 14Q1 14Q2 14Q3 14Q4 15Q1 15Q2
Figure C13: Movements between NZ ports Rolling 12 month totals
NI to NI Empty NI to NI Full NI to SI Empty NI to SI Full
SI to NI Empty SI to NI Full SI to SI Empty SI to SI Full
92
96
100
104
108
112
116
12Q4 13Q1 13Q2 13Q3 13Q4 14Q1 14Q2 14Q3 14Q4 15Q1 15Q2 15Q3
Figure C14: Growth in coastal movements Rolling 12 months
Page 26 of 45
11. Map 4: Arrival port – where the containers are from
Coastal TEU movements35,000
17,500
3,500
to Ports of Aucklandto Port of Taurangato Port of Napierto Port Taranakito CentrePortto Port Nelsonto Lytteltonto PrimePort Timaruto Port Otagoto South Port
Page 27 of 45
12. Map 5: Departure port – where the containers are going
Coastal TEU movements35,000
17,500
3,500
from Ports of Aucklandfrom Port Taurangafrom Port of Napierfrom Port Taranakifrom Centreportfrom Port Nelsonfrom Lytteltonfrom PrimePort Timarufrom Port Otagofrom South Port
Page 28 of 45
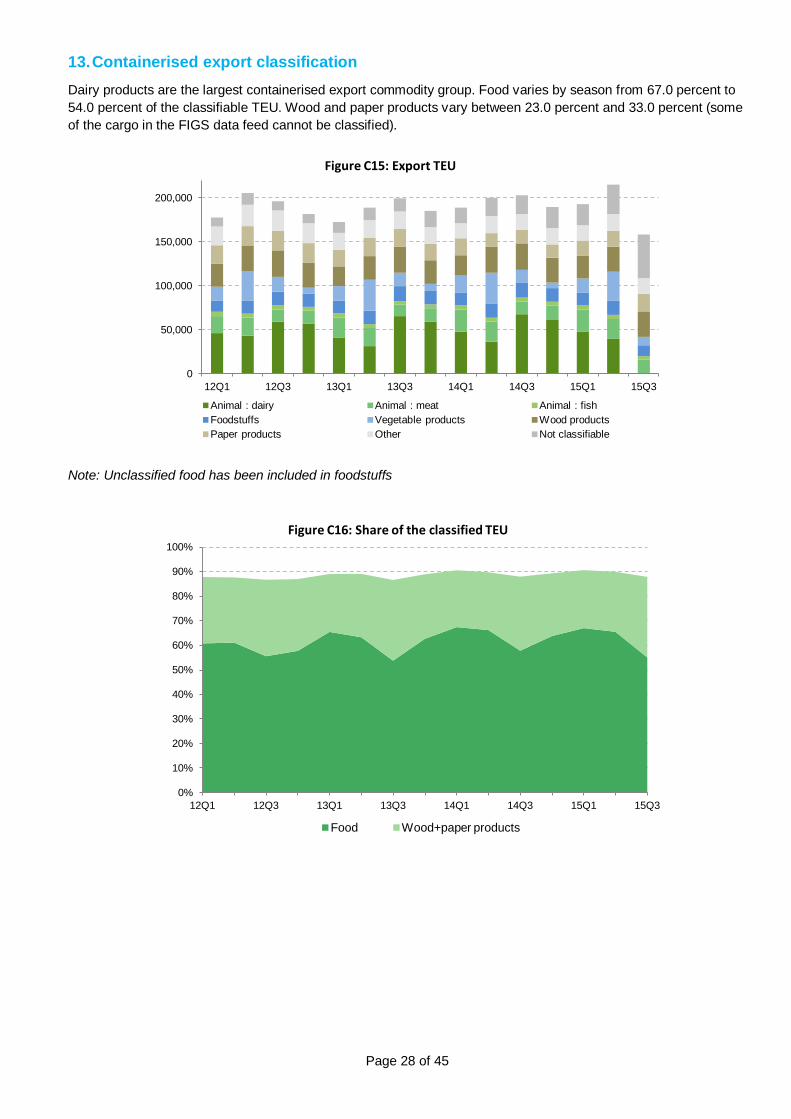
13. Containerised export classification Dairy products are the largest containerised export commodity group. Food varies by season from 67.0 percent to 54.0 percent of the classifiable TEU. Wood and paper products vary between 23.0 percent and 33.0 percent (some of the cargo in the FIGS data feed cannot be classified).
Note: Unclassified food has been included in foodstuffs
0
50,000
100,000
150,000
200,000
12Q1 12Q3 13Q1 13Q3 14Q1 14Q3 15Q1 15Q3
Figure C15: Export TEU
Animal : dairy Animal : meat Animal : fish Foodstuffs Vegetable products Wood products Paper products Other Not classifiable
0%
10%
20%
30%
40%
50%
60%
70%
80%
90%
100%
12Q1 12Q3 13Q1 13Q3 14Q1 14Q3 15Q1 15Q3
Figure C16: Share of the classified TEU
Food Wood+paper products
Page 29 of 45
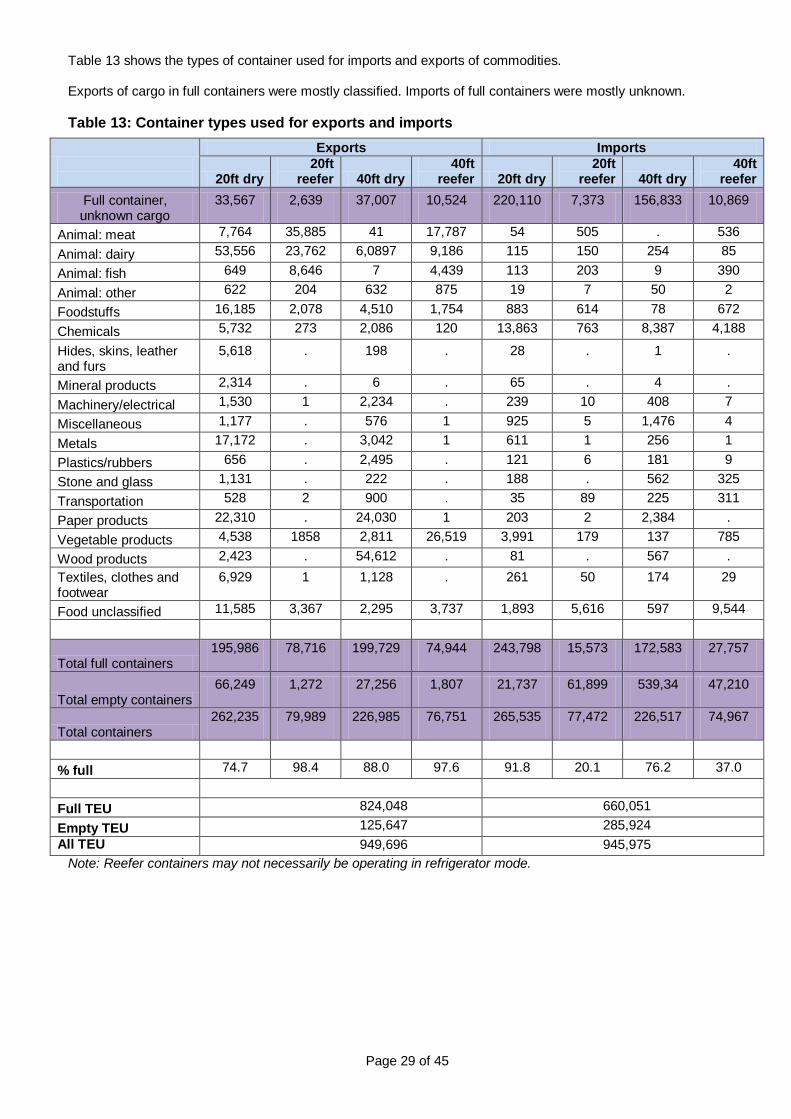
Table 13 shows the types of container used for imports and exports of commodities.
Exports of cargo in full containers were mostly classified. Imports of full containers were mostly unknown.
Table 13: Container types used for exports and imports
Note: Reefer containers may not necessarily be operating in refrigerator mode.
Exports Imports
20ft dry 20ft
reefer 40ft dry 40ft
reefer 20ft dry 20ft
reefer 40ft dry 40ft
reefer Full container, unknown cargo
33,567 2,639 37,007 10,524 220,110 7,373 156,833 10,869
Animal: meat 7,764 35,885 41 17,787 54 505 . 536
Animal: dairy 53,556 23,762 6,0897 9,186 115 150 254 85
Animal: fish 649 8,646 7 4,439 113 203 9 390
Animal: other 622 204 632 875 19 7 50 2
Foodstuffs 16,185 2,078 4,510 1,754 883 614 78 672
Chemicals 5,732 273 2,086 120 13,863 763 8,387 4,188
Hides, skins, leather and furs
5,618 . 198 . 28 . 1 .
Mineral products 2,314 . 6 . 65 . 4 .
Machinery/electrical 1,530 1 2,234 . 239 10 408 7
Miscellaneous 1,177 . 576 1 925 5 1,476 4
Metals 17,172 . 3,042 1 611 1 256 1
Plastics/rubbers 656 . 2,495 . 121 6 181 9
Stone and glass 1,131 . 222 . 188 . 562 325
Transportation 528 2 900 . 35 89 225 311
Paper products 22,310 . 24,030 1 203 2 2,384 .
Vegetable products 4,538 1858 2,811 26,519 3,991 179 137 785
Wood products 2,423 . 54,612 . 81 . 567 . Textiles, clothes and footwear
6,929 1 1,128 . 261 50 174 29
Food unclassified 11,585 3,367 2,295 3,737 1,893 5,616 597 9,544
Total full containers 195,986 78,716 199,729 74,944 243,798 15,573 172,583 27,757
Total empty containers 66,249 1,272 27,256 1,807 21,737 61,899 539,34 47,210
Total containers 262,235 79,989 226,985 76,751 265,535 77,472 226,517 74,967
% full 74.7 98.4 88.0 97.6 91.8 20.1 76.2 37.0
Full TEU 824,048 660,051
Empty TEU 125,647 285,924 All TEU 949,696 945,975
Page 30 of 45
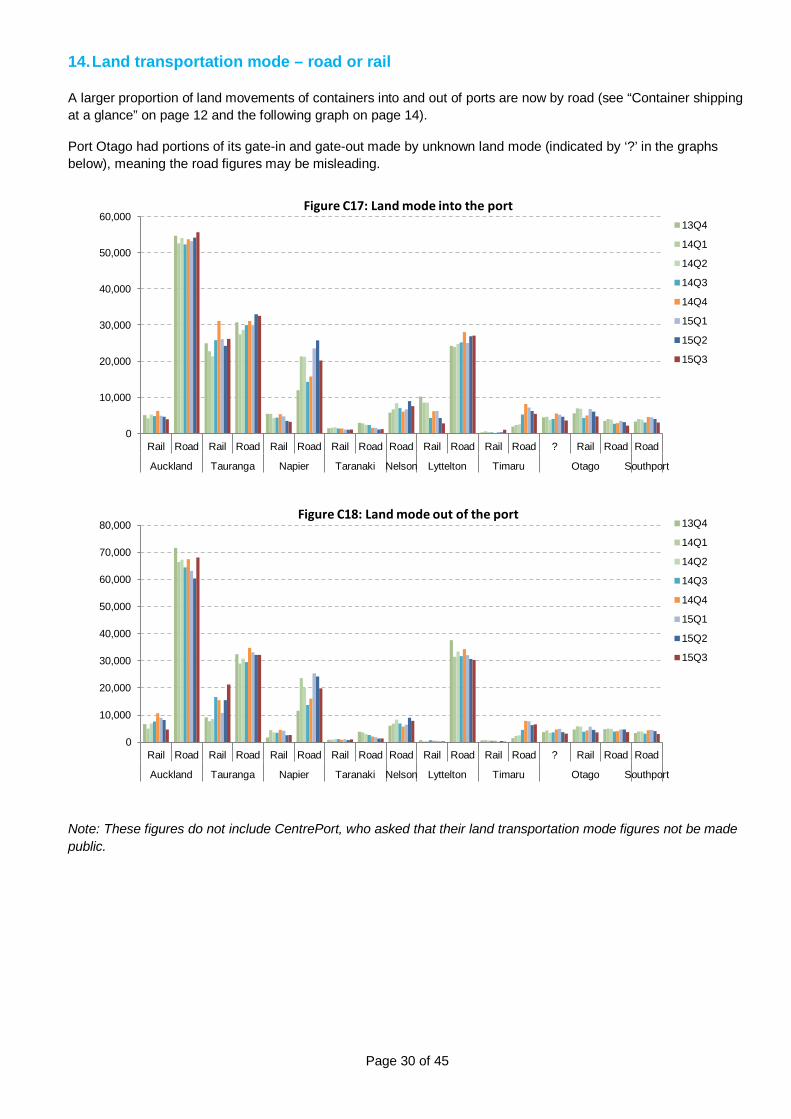
14. Land transportation mode – road or rail
A larger proportion of land movements of containers into and out of ports are now by road (see “Container shipping at a glance” on page 12 and the following graph on page 14).
Port Otago had portions of its gate-in and gate-out made by unknown land mode (indicated by ‘?’ in the graphs below), meaning the road figures may be misleading.
Note: These figures do not include CentrePort, who asked that their land transportation mode figures not be made public.
0
10,000
20,000
30,000
40,000
50,000
60,000
Rail Road Rail Road Rail Road Rail Road Road Rail Road Rail Road ? Rail Road Road
Auckland Tauranga Napier Taranaki Nelson Lyttelton Timaru Otago Southport
Figure C17: Land mode into the port 13Q4
14Q1
14Q2
14Q3
14Q4
15Q1
15Q2
15Q3
0
10,000
20,000
30,000
40,000
50,000
60,000
70,000
80,000
Rail Road Rail Road Rail Road Rail Road Road Rail Road Rail Road ? Rail Road Road
Auckland Tauranga Napier Taranaki Nelson Lyttelton Timaru Otago Southport
Figure C18: Land mode out of the port 13Q4
14Q1
14Q2
14Q3
14Q4
15Q1
15Q2
15Q3
Page 31 of 45
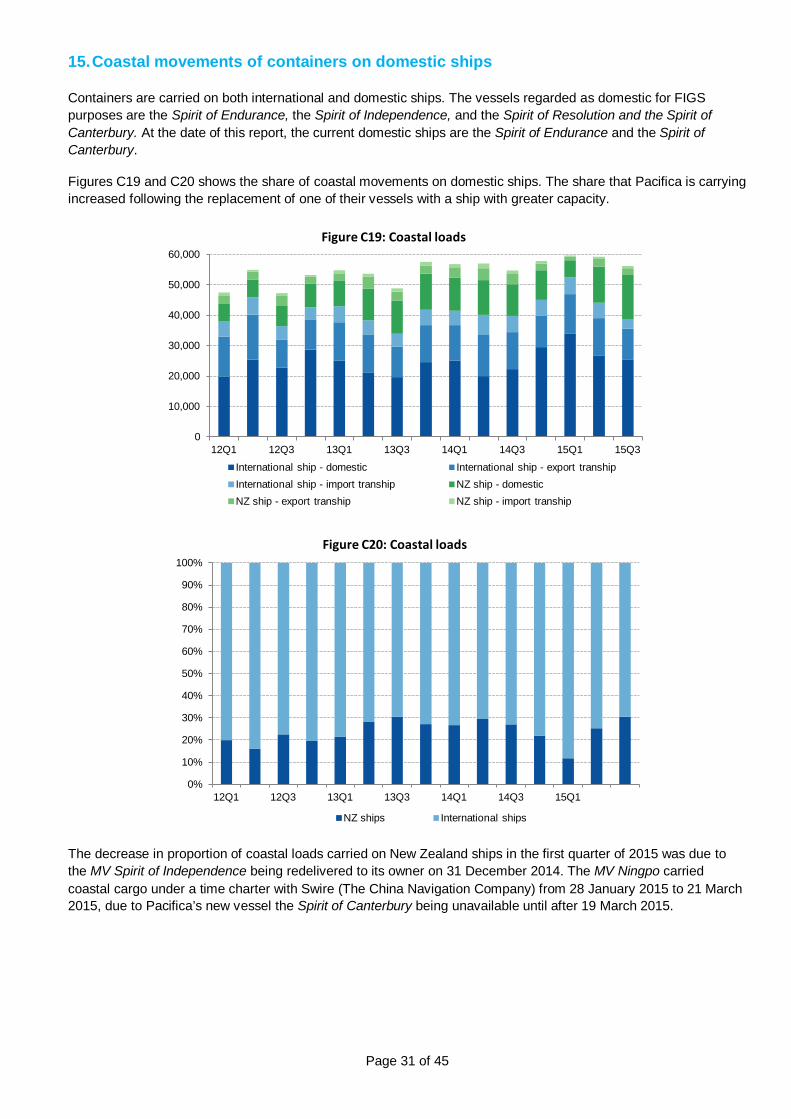
15. Coastal movements of containers on domestic ships
Containers are carried on both international and domestic ships. The vessels regarded as domestic for FIGS purposes are the Spirit of Endurance, the Spirit of Independence, and the Spirit of Resolution and the Spirit of Canterbury. At the date of this report, the current domestic ships are the Spirit of Endurance and the Spirit of Canterbury.
Figures C19 and C20 shows the share of coastal movements on domestic ships. The share that Pacifica is carrying increased following the replacement of one of their vessels with a ship with greater capacity.
The decrease in proportion of coastal loads carried on New Zealand ships in the first quarter of 2015 was due to the MV Spirit of Independence being redelivered to its owner on 31 December 2014. The MV Ningpo carried coastal cargo under a time charter with Swire (The China Navigation Company) from 28 January 2015 to 21 March 2015, due to Pacifica’s new vessel the Spirit of Canterbury being unavailable until after 19 March 2015.
0
10,000
20,000
30,000
40,000
50,000
60,000
12Q1 12Q3 13Q1 13Q3 14Q1 14Q3 15Q1 15Q3
Figure C19: Coastal loads
International ship - domestic International ship - export tranship International ship - import tranship NZ ship - domestic NZ ship - export tranship NZ ship - import tranship
0%
10%
20%
30%
40%
50%
60%
70%
80%
90%
100%
12Q1 12Q3 13Q1 13Q3 14Q1 14Q3 15Q1
Figure C20: Coastal loads
NZ ships International ships
Page 32 of 45
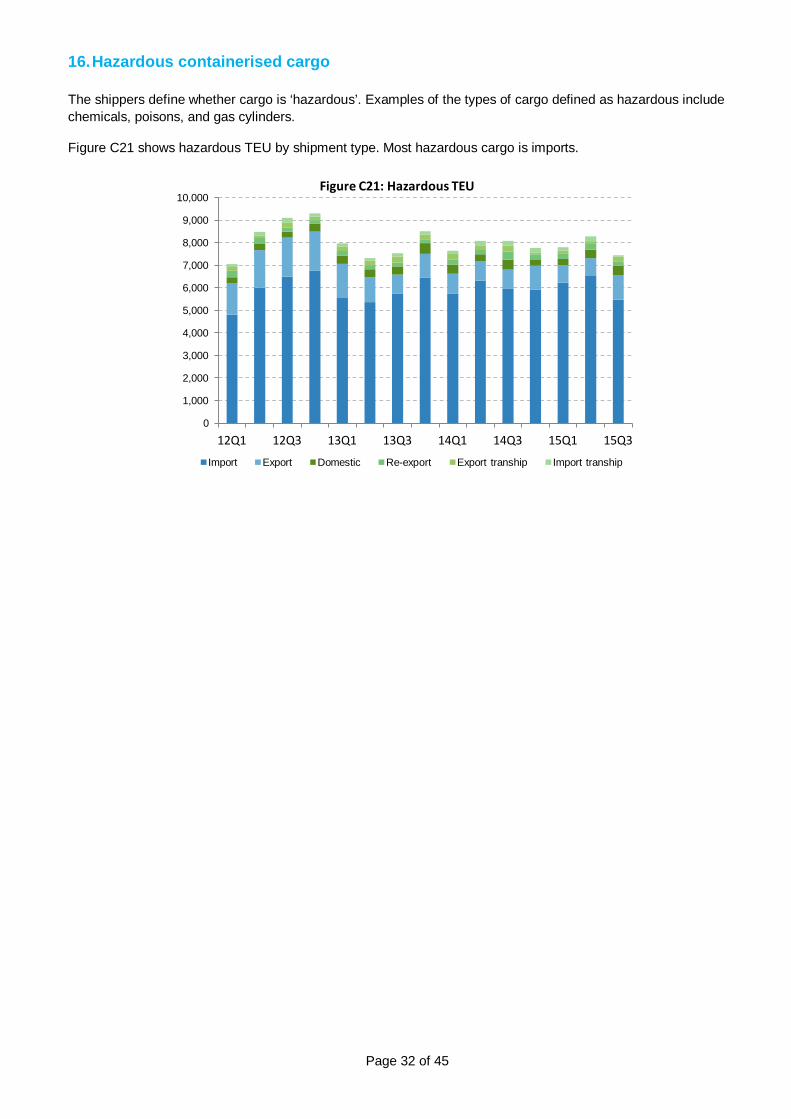
16. Hazardous containerised cargo The shippers define whether cargo is ‘hazardous’. Examples of the types of cargo defined as hazardous include chemicals, poisons, and gas cylinders.
Figure C21 shows hazardous TEU by shipment type. Most hazardous cargo is imports.
0
1,000
2,000
3,000
4,000
5,000
6,000
7,000
8,000
9,000
10,000
12Q1 12Q3 13Q1 13Q3 14Q1 14Q3 15Q1 15Q3
Figure C21: Hazardous TEU
Import Export Domestic Re-export Export tranship Import tranship
Page 33 of 45
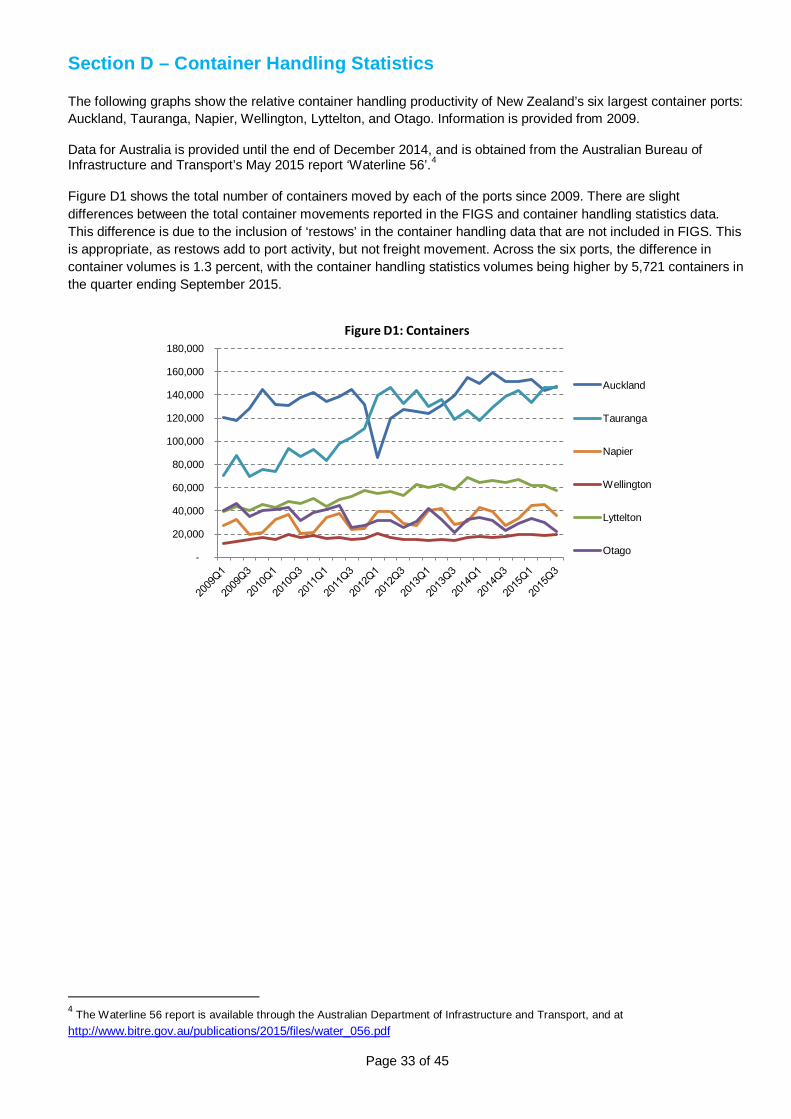
Section D – Container Handling Statistics
The following graphs show the relative container handling productivity of New Zealand’s six largest container ports: Auckland, Tauranga, Napier, Wellington, Lyttelton, and Otago. Information is provided from 2009.
Data for Australia is provided until the end of December 2014, and is obtained from the Australian Bureau of Infrastructure and Transport’s May 2015 report ‘Waterline 56’.4
Figure D1 shows the total number of containers moved by each of the ports since 2009. There are slight differences between the total container movements reported in the FIGS and container handling statistics data. This difference is due to the inclusion of ‘restows’ in the container handling data that are not included in FIGS. This is appropriate, as restows add to port activity, but not freight movement. Across the six ports, the difference in container volumes is 1.3 percent, with the container handling statistics volumes being higher by 5,721 containers in the quarter ending September 2015.
4 The Waterline 56 report is available through the Australian Department of Infrastructure and Transport, and at http://www.bitre.gov.au/publications/2015/files/water_056.pdf
-
20,000
40,000
60,000
80,000
100,000
120,000
140,000
160,000
180,000 Figure D1: Containers
Auckland
Tauranga
Napier
Wellington
Lyttelton
Otago
Page 34 of 45
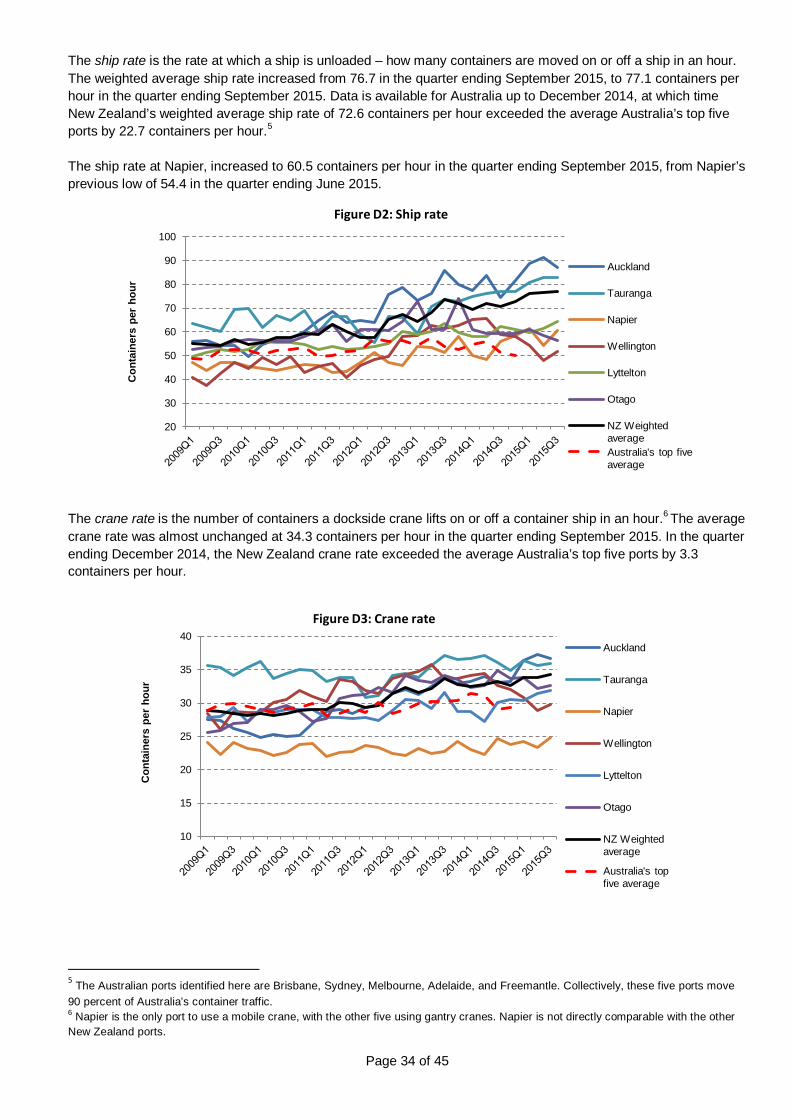
The ship rate is the rate at which a ship is unloaded – how many containers are moved on or off a ship in an hour. The weighted average ship rate increased from 76.7 in the quarter ending September 2015, to 77.1 containers per hour in the quarter ending September 2015. Data is available for Australia up to December 2014, at which time New Zealand’s weighted average ship rate of 72.6 containers per hour exceeded the average Australia’s top five ports by 22.7 containers per hour.5 The ship rate at Napier, increased to 60.5 containers per hour in the quarter ending September 2015, from Napier’s previous low of 54.4 in the quarter ending June 2015.
The crane rate is the number of containers a dockside crane lifts on or off a container ship in an hour.6 The average crane rate was almost unchanged at 34.3 containers per hour in the quarter ending September 2015. In the quarter ending December 2014, the New Zealand crane rate exceeded the average Australia’s top five ports by 3.3 containers per hour.
5 The Australian ports identified here are Brisbane, Sydney, Melbourne, Adelaide, and Freemantle. Collectively, these five ports move 90 percent of Australia’s container traffic. 6 Napier is the only port to use a mobile crane, with the other five using gantry cranes. Napier is not directly comparable with the other New Zealand ports.
20
30
40
50
60
70
80
90
100
Con
tain
ers
per
hour
Figure D2: Ship rate
Auckland
Tauranga
Napier
Wellington
Lyttelton
Otago
NZ Weighted average Australia's top five average
10
15
20
25
30
35
40
Con
tain
ers
per
hour
Figure D3: Crane rate
Auckland
Tauranga
Napier
Wellington
Lyttelton
Otago
NZ Weighted average
Australia's top five average
Page 35 of 45
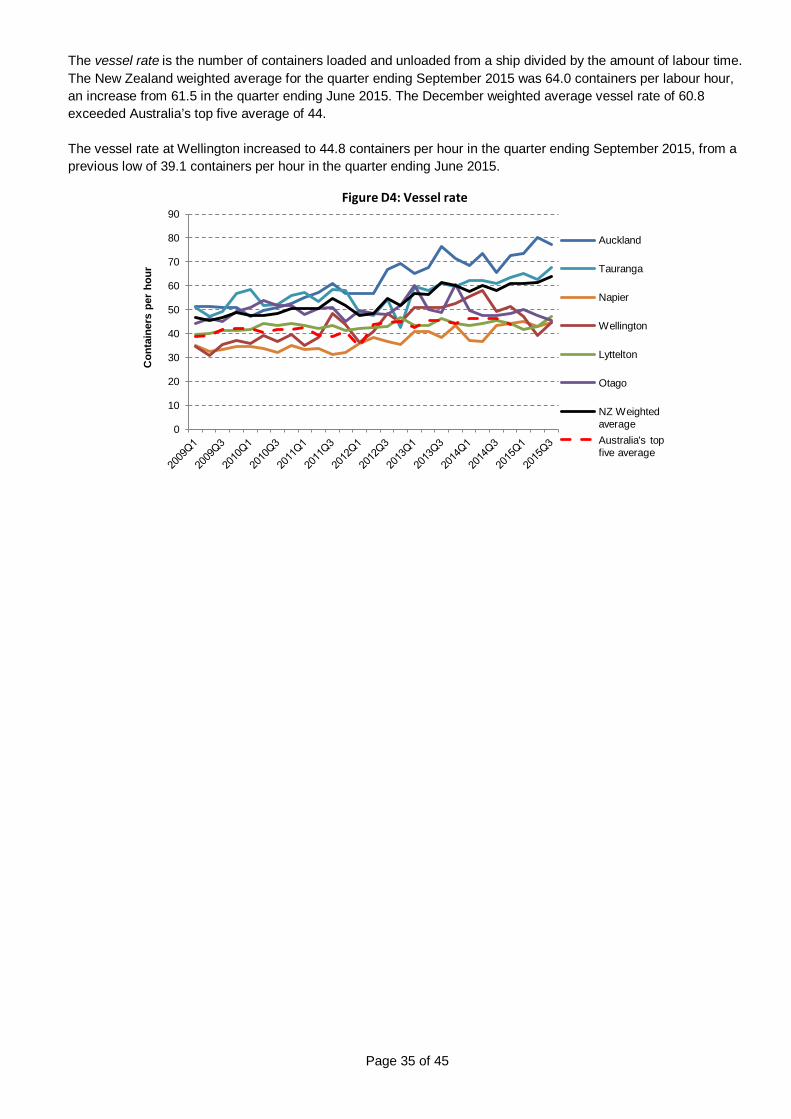
The vessel rate is the number of containers loaded and unloaded from a ship divided by the amount of labour time. The New Zealand weighted average for the quarter ending September 2015 was 64.0 containers per labour hour, an increase from 61.5 in the quarter ending June 2015. The December weighted average vessel rate of 60.8 exceeded Australia’s top five average of 44. The vessel rate at Wellington increased to 44.8 containers per hour in the quarter ending September 2015, from a previous low of 39.1 containers per hour in the quarter ending June 2015.
0
10
20
30
40
50
60
70
80
90
Con
tain
ers
per
hour
Figure D4: Vessel rate
Auckland
Tauranga
Napier
Wellington
Lyttelton
Otago
NZ Weighted average Australia's top five average
Page 36 of 45
Section E – Rail and Road Data
17. Rail movements and volumes
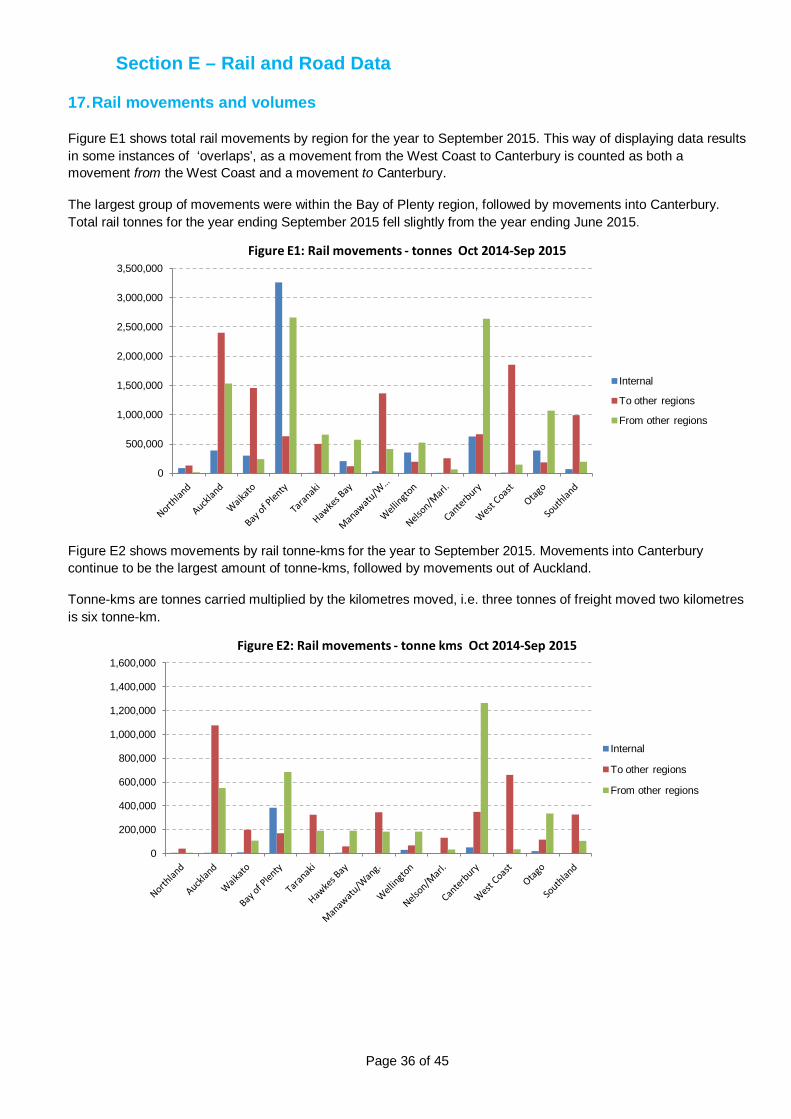
Figure E1 shows total rail movements by region for the year to September 2015. This way of displaying data results in some instances of ‘overlaps’, as a movement from the West Coast to Canterbury is counted as both a movement from the West Coast and a movement to Canterbury.
The largest group of movements were within the Bay of Plenty region, followed by movements into Canterbury. Total rail tonnes for the year ending September 2015 fell slightly from the year ending June 2015.
Figure E2 shows movements by rail tonne-kms for the year to September 2015. Movements into Canterbury continue to be the largest amount of tonne-kms, followed by movements out of Auckland.
Tonne-kms are tonnes carried multiplied by the kilometres moved, i.e. three tonnes of freight moved two kilometres is six tonne-km.
0
500,000
1,000,000
1,500,000
2,000,000
2,500,000
3,000,000
3,500,000 Figure E1: Rail movements - tonnes Oct 2014-Sep 2015
Internal
To other regions
From other regions
0
200,000
400,000
600,000
800,000
1,000,000
1,200,000
1,400,000
1,600,000 Figure E2: Rail movements - tonne kms Oct 2014-Sep 2015
Internal
To other regions
From other regions
Page 37 of 45
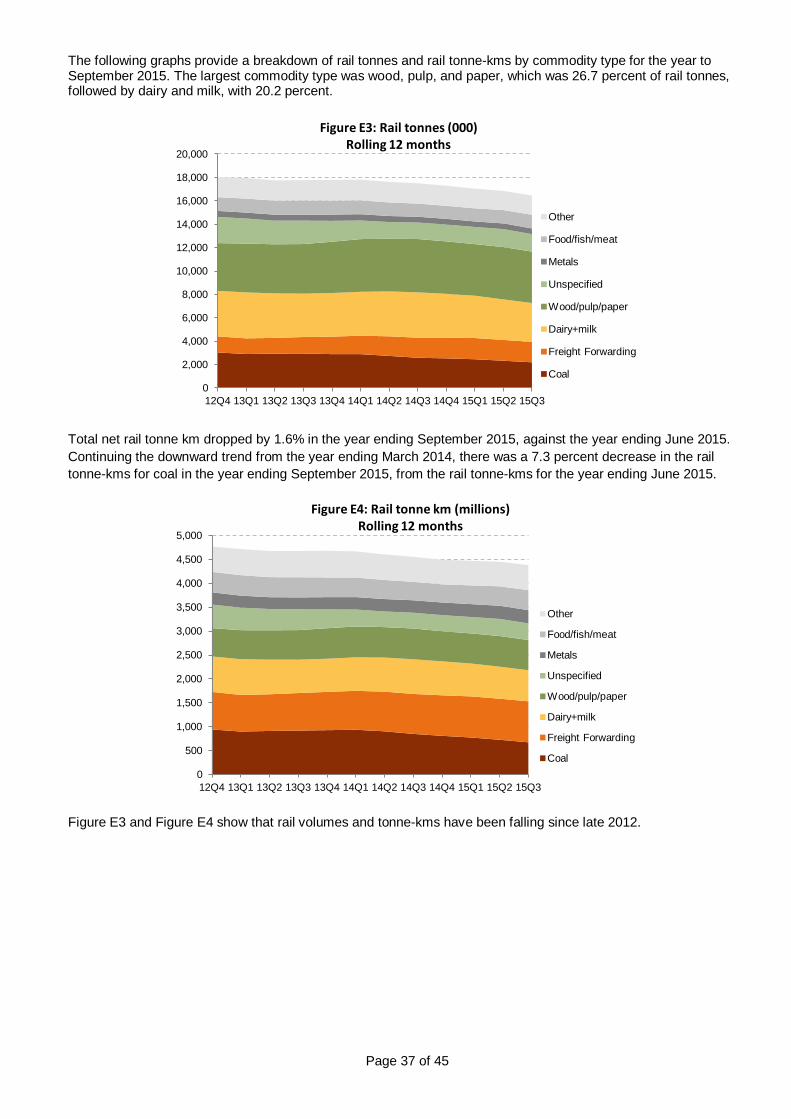
The following graphs provide a breakdown of rail tonnes and rail tonne-kms by commodity type for the year to September 2015. The largest commodity type was wood, pulp, and paper, which was 26.7 percent of rail tonnes, followed by dairy and milk, with 20.2 percent.
Total net rail tonne km dropped by 1.6% in the year ending September 2015, against the year ending June 2015. Continuing the downward trend from the year ending March 2014, there was a 7.3 percent decrease in the rail tonne-kms for coal in the year ending September 2015, from the rail tonne-kms for the year ending June 2015.
Figure E3 and Figure E4 show that rail volumes and tonne-kms have been falling since late 2012.
0
2,000
4,000
6,000
8,000
10,000
12,000
14,000
16,000
18,000
20,000
12Q4 13Q1 13Q2 13Q3 13Q4 14Q1 14Q2 14Q3 14Q4 15Q1 15Q2 15Q3
Figure E3: Rail tonnes (000) Rolling 12 months
Other
Food/fish/meat
Metals
Unspecified
Wood/pulp/paper
Dairy+milk
Freight Forwarding
Coal
0
500
1,000
1,500
2,000
2,500
3,000
3,500
4,000
4,500
5,000
12Q4 13Q1 13Q2 13Q3 13Q4 14Q1 14Q2 14Q3 14Q4 15Q1 15Q2 15Q3
Figure E4: Rail tonne km (millions) Rolling 12 months
Other
Food/fish/meat
Metals
Unspecified
Wood/pulp/paper
Dairy+milk
Freight Forwarding
Coal
Page 38 of 45
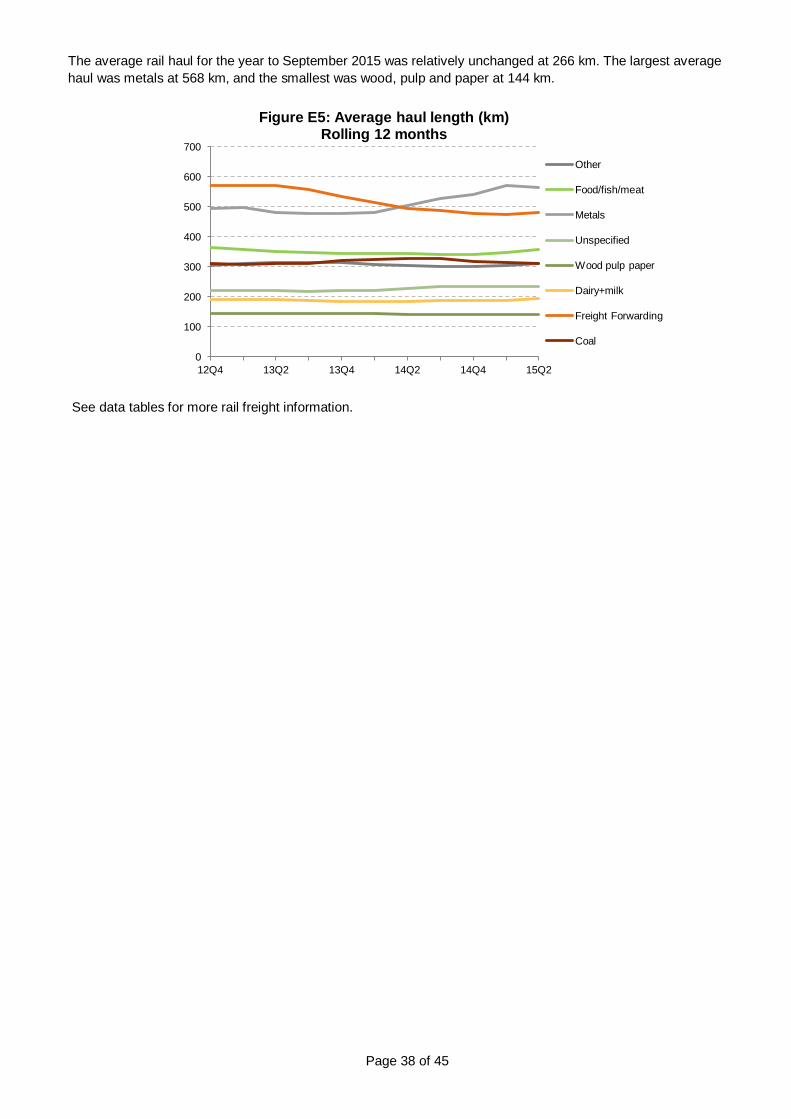
The average rail haul for the year to September 2015 was relatively unchanged at 266 km. The largest average haul was metals at 568 km, and the smallest was wood, pulp and paper at 144 km.
See data tables for more rail freight information.
0
100
200
300
400
500
600
700
12Q4 13Q2 13Q4 14Q2 14Q4 15Q2
Figure E5: Average haul length (km) Rolling 12 months
Other
Food/fish/meat
Metals
Unspecified
Wood pulp paper
Dairy+milk
Freight Forwarding
Coal
Page 39 of 45
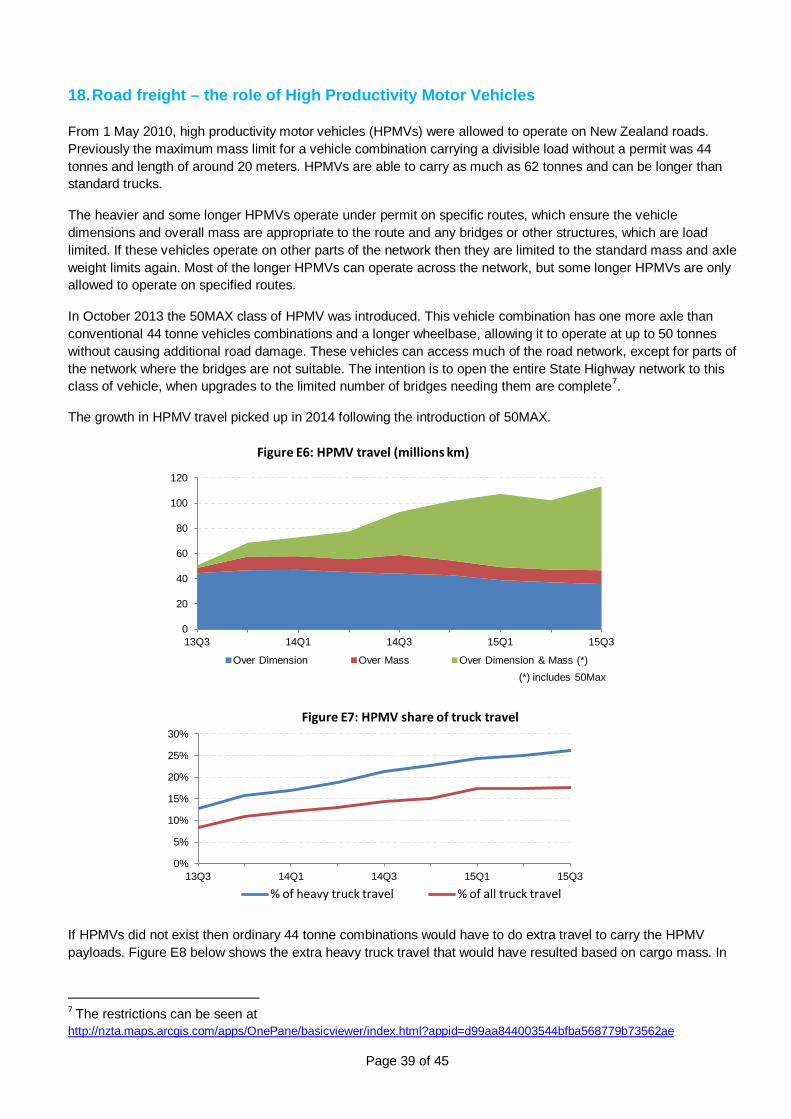
18. Road freight – the role of High Productivity Motor Vehicles
From 1 May 2010, high productivity motor vehicles (HPMVs) were allowed to operate on New Zealand roads. Previously the maximum mass limit for a vehicle combination carrying a divisible load without a permit was 44 tonnes and length of around 20 meters. HPMVs are able to carry as much as 62 tonnes and can be longer than standard trucks.
The heavier and some longer HPMVs operate under permit on specific routes, which ensure the vehicle dimensions and overall mass are appropriate to the route and any bridges or other structures, which are load limited. If these vehicles operate on other parts of the network then they are limited to the standard mass and axle weight limits again. Most of the longer HPMVs can operate across the network, but some longer HPMVs are only allowed to operate on specified routes.
In October 2013 the 50MAX class of HPMV was introduced. This vehicle combination has one more axle than conventional 44 tonne vehicles combinations and a longer wheelbase, allowing it to operate at up to 50 tonnes without causing additional road damage. These vehicles can access much of the road network, except for parts of the network where the bridges are not suitable. The intention is to open the entire State Highway network to this class of vehicle, when upgrades to the limited number of bridges needing them are complete7.
The growth in HPMV travel picked up in 2014 following the introduction of 50MAX.
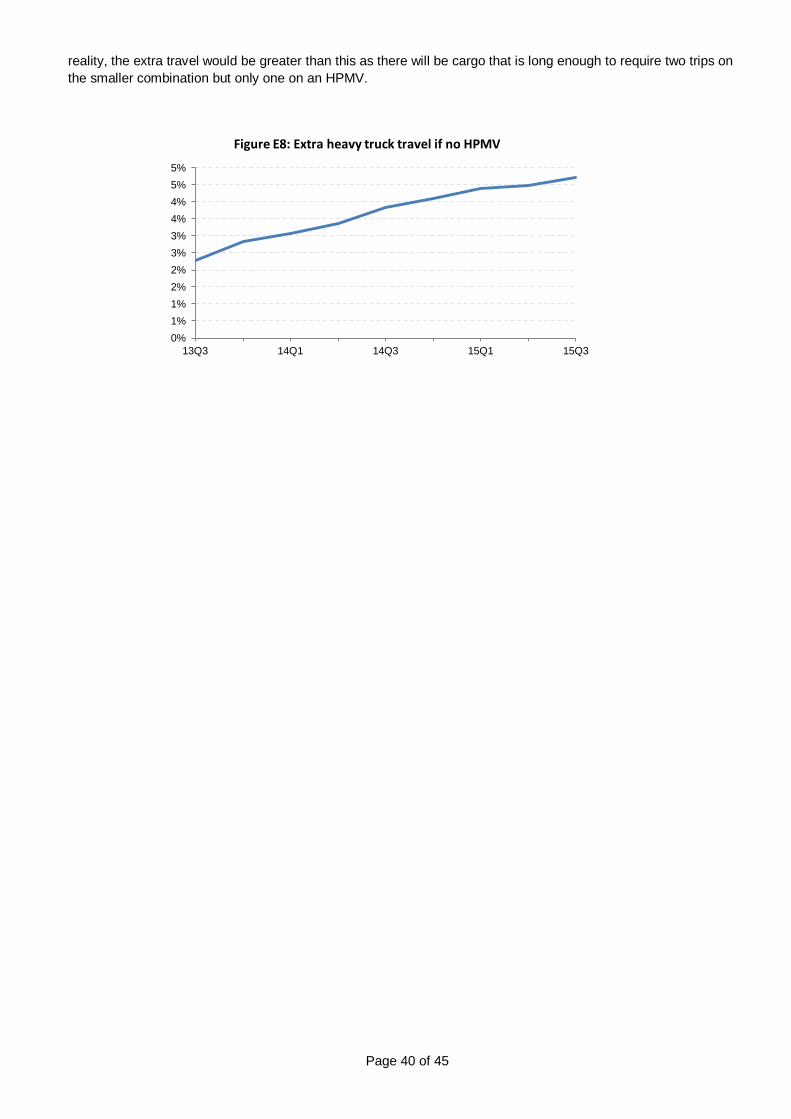
If HPMVs did not exist then ordinary 44 tonne combinations would have to do extra travel to carry the HPMV payloads. Figure E8 below shows the extra heavy truck travel that would have resulted based on cargo mass. In
7 The restrictions can be seen at http://nzta.maps.arcgis.com/apps/OnePane/basicviewer/index.html?appid=d99aa844003544bfba568779b73562ae
0
20
40
60
80
100
120
13Q3 14Q1 14Q3 15Q1 15Q3
Figure E6: HPMV travel (millions km)
Over Dimension Over Mass Over Dimension & Mass (*) (*) includes 50Max
0%
5%
10%
15%
20%
25%
30%
13Q3 14Q1 14Q3 15Q1 15Q3
Figure E7: HPMV share of truck travel
% of heavy truck travel % of all truck travel
Page 40 of 45
reality, the extra travel would be greater than this as there will be cargo that is long enough to require two trips on the smaller combination but only one on an HPMV.
0% 1% 1% 2% 2% 3% 3% 4% 4% 5% 5%
13Q3 14Q1 14Q3 15Q1 15Q3
Figure E8: Extra heavy truck travel if no HPMV
Page 41 of 45
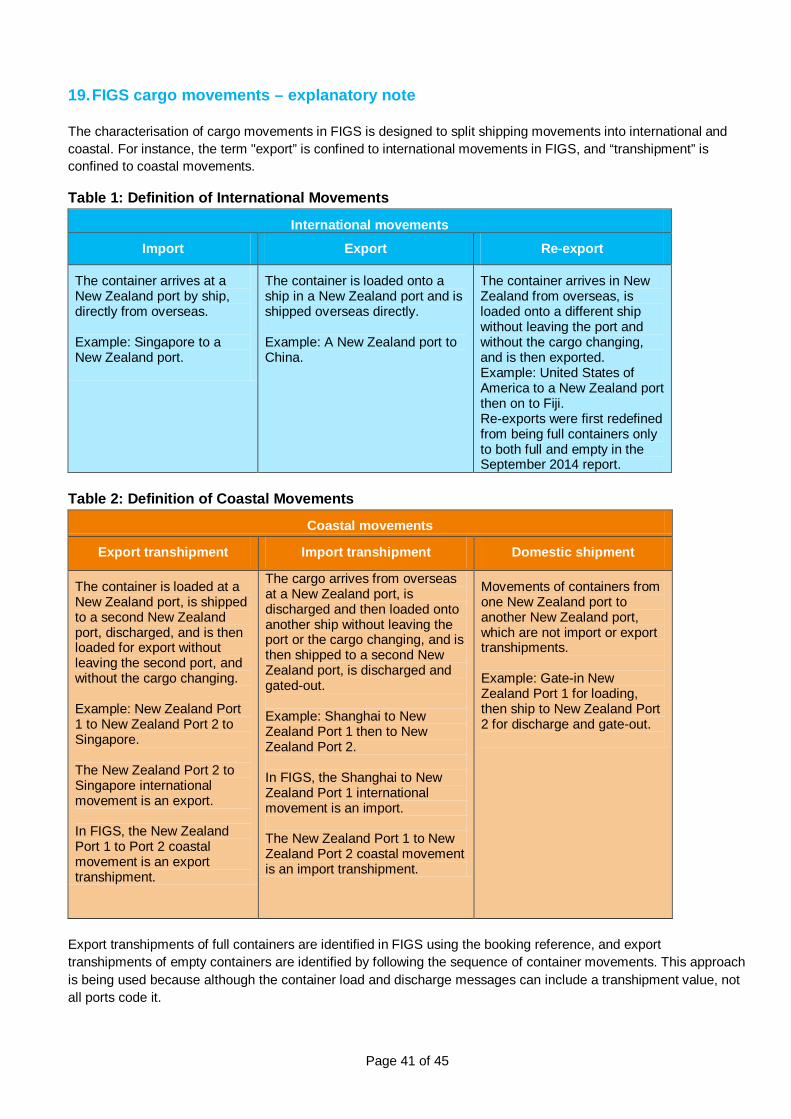
19. FIGS cargo movements – explanatory note
The characterisation of cargo movements in FIGS is designed to split shipping movements into international and coastal. For instance, the term "export” is confined to international movements in FIGS, and “transhipment” is confined to coastal movements.
Table 1: Definition of International Movements
International movements
Import Export Re-export
The container arrives at a New Zealand port by ship, directly from overseas. Example: Singapore to a New Zealand port.
The container is loaded onto a ship in a New Zealand port and is shipped overseas directly. Example: A New Zealand port to China.
The container arrives in New Zealand from overseas, is loaded onto a different ship without leaving the port and without the cargo changing, and is then exported. Example: United States of America to a New Zealand port then on to Fiji. Re-exports were first redefined from being full containers only to both full and empty in the September 2014 report.
Table 2: Definition of Coastal Movements
Coastal movements
Export transhipment Import transhipment Domestic shipment
The container is loaded at a New Zealand port, is shipped to a second New Zealand port, discharged, and is then loaded for export without leaving the second port, and without the cargo changing. Example: New Zealand Port 1 to New Zealand Port 2 to Singapore. The New Zealand Port 2 to Singapore international movement is an export. In FIGS, the New Zealand Port 1 to Port 2 coastal movement is an export transhipment.
The cargo arrives from overseas at a New Zealand port, is discharged and then loaded onto another ship without leaving the port or the cargo changing, and is then shipped to a second New Zealand port, is discharged and gated-out. Example: Shanghai to New Zealand Port 1 then to New Zealand Port 2. In FIGS, the Shanghai to New Zealand Port 1 international movement is an import. The New Zealand Port 1 to New Zealand Port 2 coastal movement is an import transhipment.
Movements of containers from one New Zealand port to another New Zealand port, which are not import or export transhipments. Example: Gate-in New Zealand Port 1 for loading, then ship to New Zealand Port 2 for discharge and gate-out.
Export transhipments of full containers are identified in FIGS using the booking reference, and export transhipments of empty containers are identified by following the sequence of container movements. This approach is being used because although the container load and discharge messages can include a transhipment value, not all ports code it.
Page 42 of 45
This report only includes containers moved through the container facilities at the ten container ports. For instance, it excludes container movements by the Cook Strait operators, loads in Onehunga, container loads and discharges at the Mount Maunganui wharf and the wharves outside the container port operation in Lyttelton.
Page 43 of 45
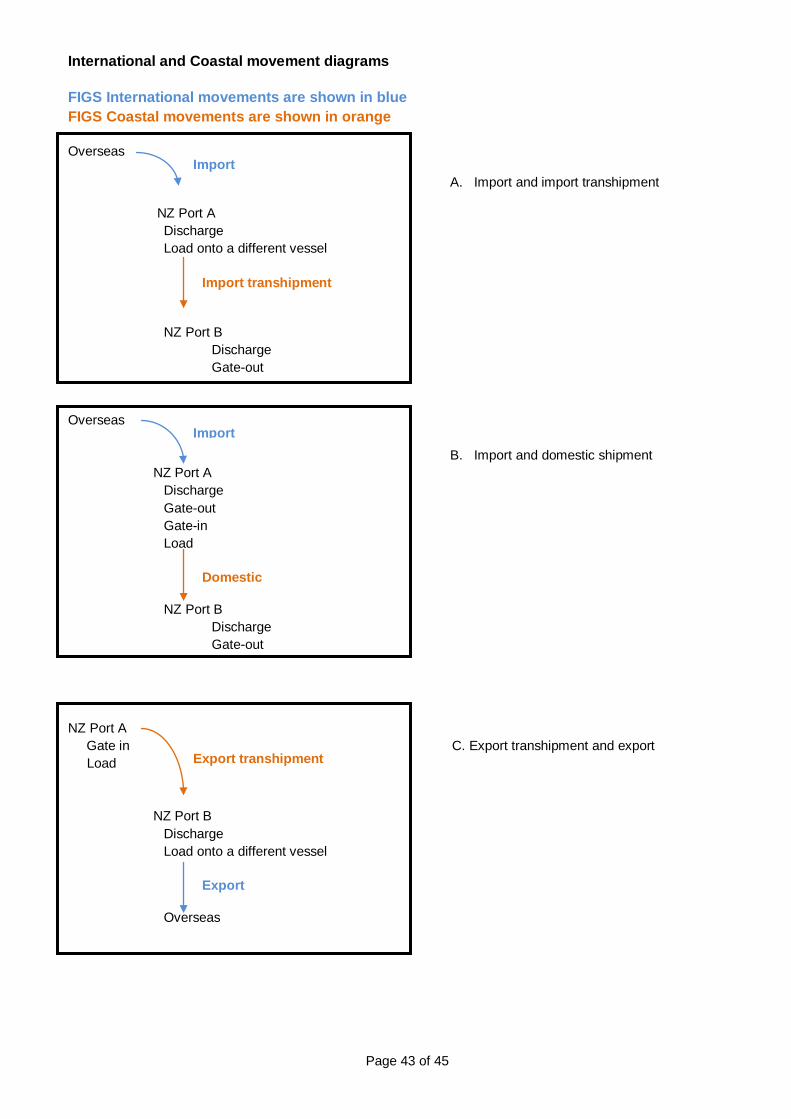
International and Coastal movement diagrams FIGS International movements are shown in blue FIGS Coastal movements are shown in orange Overseas
A. Import and import transhipment
NZ Port A Discharge Load onto a different vessel
NZ Port B
Discharge Gate-out
Overseas
B. Import and domestic shipment NZ Port A
Discharge Gate-out Gate-in Load
NZ Port B Discharge Gate-out
NZ Port A Gate in C. Export transhipment and export Load NZ Port B
Discharge Load onto a different vessel
Overseas
Import
Import transhipment
Import Import
Domestic shipment Domestic
Export transhipment
Export
Page 44 of 45
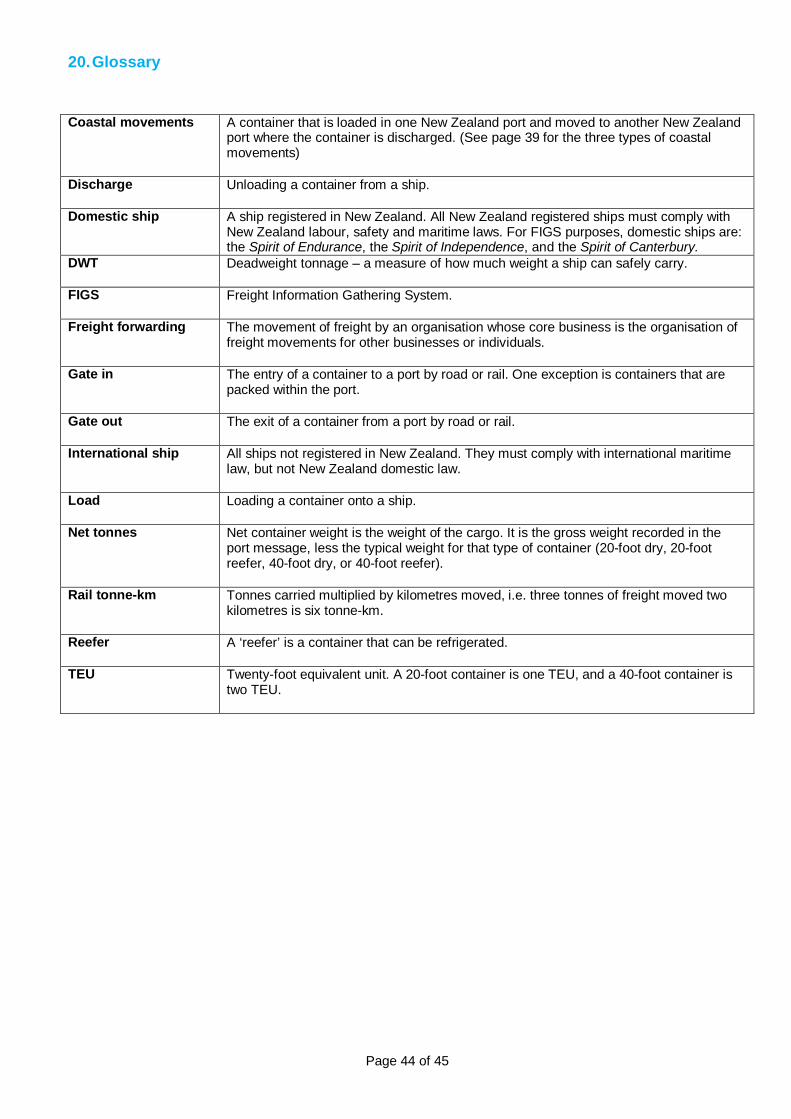
20. Glossary
Coastal movements A container that is loaded in one New Zealand port and moved to another New Zealand port where the container is discharged. (See page 39 for the three types of coastal movements)
Discharge Unloading a container from a ship.
Domestic ship A ship registered in New Zealand. All New Zealand registered ships must comply with New Zealand labour, safety and maritime laws. For FIGS purposes, domestic ships are: the Spirit of Endurance, the Spirit of Independence, and the Spirit of Canterbury.
DWT Deadweight tonnage – a measure of how much weight a ship can safely carry.
FIGS Freight Information Gathering System.
Freight forwarding The movement of freight by an organisation whose core business is the organisation of freight movements for other businesses or individuals.
Gate in The entry of a container to a port by road or rail. One exception is containers that are packed within the port.
Gate out The exit of a container from a port by road or rail.
International ship All ships not registered in New Zealand. They must comply with international maritime law, but not New Zealand domestic law.
Load Loading a container onto a ship.
Net tonnes Net container weight is the weight of the cargo. It is the gross weight recorded in the port message, less the typical weight for that type of container (20-foot dry, 20-foot reefer, 40-foot dry, or 40-foot reefer).
Rail tonne-km Tonnes carried multiplied by kilometres moved, i.e. three tonnes of freight moved two kilometres is six tonne-km.
Reefer A ‘reefer’ is a container that can be refrigerated.
TEU Twenty-foot equivalent unit. A 20-foot container is one TEU, and a 40-foot container is two TEU.
Page 45 of 45
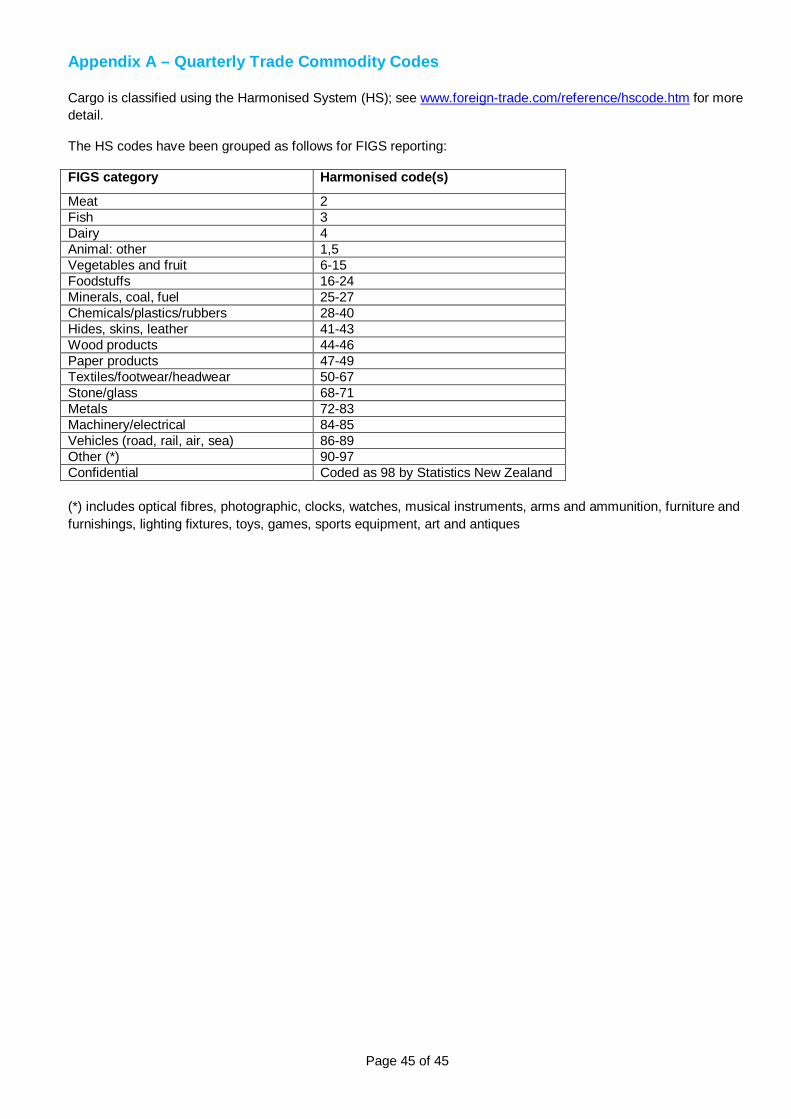
Appendix A – Quarterly Trade Commodity Codes
Cargo is classified using the Harmonised System (HS); see www.foreign-trade.com/reference/hscode.htm for more detail.
The HS codes have been grouped as follows for FIGS reporting:
FIGS category Harmonised code(s)
Meat 2 Fish 3 Dairy 4 Animal: other 1,5 Vegetables and fruit 6-15 Foodstuffs 16-24 Minerals, coal, fuel 25-27 Chemicals/plastics/rubbers 28-40 Hides, skins, leather 41-43 Wood products 44-46 Paper products 47-49 Textiles/footwear/headwear 50-67 Stone/glass 68-71 Metals 72-83 Machinery/electrical 84-85 Vehicles (road, rail, air, sea) 86-89 Other (*) 90-97 Confidential Coded as 98 by Statistics New Zealand (*) includes optical fibres, photographic, clocks, watches, musical instruments, arms and ammunition, furniture and furnishings, lighting fixtures, toys, games, sports equipment, art and antiques