Embed Size (px)
Citation preview
1
French banks’ performance in 2014
No. 46 – May 2015
2
CONTENTS
1. FINANCIAL PERFORMANCE OF FRENCH BANKING GROUPS IN 2014 5
1.1. Earnings improved, excluding exceptional items 5
1.2. Profits rise mostly on the continued decline in cost of risk in 2014 6
1.2.1. Lacklustre income 6
1.2.2. Cost-to-income ratio remains high despite cost-cutting efforts 9
1.2.3. Cost of risk continues to decline 11
1.2.4. Higher net profit excluding exceptional items 13
1.3. Earnings increased moderately across all business lines 16
1.3.1. Retail banking and specialist finance 19
1.3.2. Corporate and investment banking 20
1.3.3. Insurance and asset management 20
2. BALANCE SHEETS AND SOLVENCY 22
2.1. Aggregate assets for the five groups up 8% 22
2.2. Efforts to improve capital strengthened solvency somewhat further in 2014 25
2.2.1. Another increase in capital 27
2.2.2. Capital requirements increased in 2014 28
2.3. Leverage ratios above 3% 29
3. RISKS 30
3.1. Capital requirements for credit risk up sharply 31
3.1.1. Regulatory developments affected the credit risk structure at 31 December 2014 31
3.1.2. The quality of the loan portfolio improved further in 2014 32
3.2. Capital requirements for credit valuation adjustment (CVA) 37
3.3. Capital requirements for market risk declined once again 38
3.4. A marginal increase in capital requirements for operational risk 42
3.5. Liquidity risk stable due to particularly favourable funding conditions 44
3.5.1 French banks' refinancing risk is down sharply since the 2011 eurozone crisis. 44
3.5.2 Sharp improvement in liquidity ratios 46
ANNEX 1 – KEY RISK INDICATORS 49
ANNEX 2 – EQUIVALENCE TABLES 53
REFERENCES 54
TABLES AND CHARTS 55

3
Executive Summary
Earnings of the top six French banking groups1 contracted in 2014 compared with 2013. They were, however, affected by a number of fairly sizeable exceptional items, including payment of the fine imposed on BNP Paribas by the US authorities. Excluding these exceptional items, profitability rose slightly: - Aggregate net banking income (NBI) for the six groups rose by a modest 1.8%
(0.8% after correcting for accounting effects related to own debt adjustment) on the strong performance by insurance and asset management. In contrast, French retail banking NBI was flat overall, and even deteriorated at some banks reflecting the combined impact of fee stabilisation, mainly because of the cap on service fees, and pressure on interest margin : on the asset side, the average return on outstanding personal home loans diminished further in a context of record high loan transfers and renegotiations while production of loans to businesses remained low given the sluggish economy in 2014 ; on the liabilities side, while banks have so far taken advantage of the sharp drop in the cost of market-based financing, returns on regulated deposits have fallen more slowly than non-administered funds.
- Cost of risk fell 17.8% and was concentrated in retail banking and corporate
and investment banking. This trend reflects significant progress on risk quality. The improvement in cost of risk is only partially mitigated by the 1% increase in operating expenses: NBI less operating expenses and cost of risk rose 15.3%.
- Tax expense rose 14.4%, due mainly to the non-deductibility of the systemic risk tax and the increase, from 5% to 10.7%, in the exceptional contribution on the corporate tax, which was introduced in 2013 and then extended.
- In sum, the six largest French banking groups generated net profit (group share) of EUR 14.3 billion in 2014, down 20.6% from 2013. Adjusted for exceptional items, net profit (group share) rose 8%.
Earnings in Q1 2015 indicated an overall improvement in profitability, confirming the underlying trends of 2014 while highlighting the weaknesses observed in French retail banking: - The main French banking groups that publish quarterly financial statements
(BNPP, SG, GCA, GBPCE) generated net profit (group share) of EUR 4.4 billion, up 22.8% relative to Q1 2014. This sharp increase resulted primarily from the financial markets’ strong performance in response to the launch of the ECB's asset purchase programme in January 2015 and from a favourable foreign exchange effect.
- Income from French retail banking continued to slide, by as much as 0.8% in Q1 2015 compared with the year-ago period, despite renewed demand for credit by businesses and households.
At the same time, the groups continued to refocus their balance sheets and strengthen their financial structure: - The six groups posted full CRD IV Common Equity Tier 1 ratios of more than
10%, with the overall ratio rising to 11.8% at 31 December 2014 from 11% at 31 December 2013. All the banks reported leverage ratios of more than 3%, calculated in accordance with the provisions of the European Commission delegated regulation of 10 October 2014.
1 BNP Paribas (BNPP), Société Générale (SG), Crédit Agricole Group (GCA), BPCE Group (GBPCE), Crédit Mutuel Group (GCM) and Banque Postale (LBP).

4
- All groups had solid liquidity positions based on the new liquidity ratios: with the exception of Crédit Mutuel Group, which does not disclose this information, the groups all reported LCRs of more than 100%. The improvement in the LCR stemmed mainly from an increase, in the numerator of the ratio, in the share of high-quality assets (consisting mostly of sovereign securities and cash deposited with central banks), which was 11.4% of total assets at 31 December 2014.
- Loan-to-deposit ratios continued to decline due to the combined impact of
increasing customer deposits and stagnating outstanding loan amounts. Despite this progress, risks remain and are weighing on banks' profitability: - The low interest rate environment poses a twofold risk: first, the smallness of
the slope of the curve automatically reduces bank margins, with a particularly significant impact in France due to the slow adjustment of funding costs to market conditions because of the high proportion of regulated savings, and to the significant rise in home loan renegotiations; second, a sharp increase in interest rates could cause funding conditions for banks to deteriorate and reduce interest margins if rate hikes cannot be quickly passed on to customer loans.
- Other factors having an adverse impact on French banks' profitability also bear watching: pending litigation risks, geopolitical risks related to international exposures, and regulations under discussion at the international and European level.
- Lastly, the banks' poor profitability is pushing them to question their business models. The underwhelming performance of French retail banking could prompt banks to seek other sources of growth, whether internationally or by focusing on other more dynamic businesses such as insurance and asset management. Moreover, this poor profitability could cause banks to cut costs even further.
Authors: Catherine Adenot, Eugenio Avisoa, Sébastien Frappa, Joël Guilmo and Juliette Offner Key words: net banking income, operating costs, cost-to-income ratio, cost of risk, net profit, solvency ratio, key risk indicators. JEL code: G21
5
1. Financial performance of French banking groups in 2014
1.1. Earnings improved, excluding exceptional items
Foreword This analysis focuses on the consolidated accounts of the top six French banking groups: BNP Paribas (BNPP), Société Générale (SG), Crédit Agricole Group (GCA), BPCE Group (GBPCE), Crédit Mutuel Group (GCM) and La Banque Postale (LBP). All transactions, regardless of business line (banking, insurance, asset management, etc.) and geography (including foreign subsidiaries), are taken into account as long as they are within the scope of consolidation of the banking group concerned. For some risk indicators, French banks are compared with their European peers using the key risk indicators (KRIs) calculated every quarter by the European Banking Authority (EBA) for a sample of European banks.2
In 2014, earnings (Table 1) of the top six French banking groups were lacklustre and adversely affected by exceptional items. Aggregate net banking income (NBI) was EUR 137.3 billion, up 1.8% year on year. The increase in gross operating profit was marginally higher at 3.6%, benefiting from a modest 1% rise in operating expenses relative to 2013. Cost of risk fell by a substantial 17.8% in 2014 resulting in a significant 15.3% improvement in operating profit. However, significant exceptional items had an impact on final profit, resulting in a steep year-on-year drop in net profit of nearly 20%. Excluding exceptional items, net profit (group share) of the major French banks rose nearly 8% year on year (see 1.2.4 below).
Table 1 Intermediate operating totals
(EUR billions)
Source: financial disclosures from the six groups (BNPP, SG, GCA, GBPCE, GCM, LBP)
2 The scope was broadened in 2014, see details in Annex 1.
2013 2014Change
2014/2013
Net banking income 134.9 137.3 +1.8%
Operating expenses 91.7 92.6 +1.0%
Cost-to-income ratio 68.0% 67.4% -0.5 pts
Gross operating profit (GOP) 43.2 44.7 +3.6%
Cost of risk (CR) 15.3 12.6 -17.8%
Net operating profit (GOP-CR) 27.9 32.1 +15.3%
Other gains (+) and losses (-) 0.9 -6.0 N/A
Pre-tax income 28.8 26.1 -9.1%
Tax 9.0 10.3 +14.4%
Discontinued or held-for-sale operations 0.1 0.0 N/A
Net profit 19.9 15.9 -20.2%
Minority interests 1.9 1.5 -16.9%
Net profit (group share) 18.0 14.3 -20.6%
6
The negative accounting effect related to own debt adjustment was less significant in 2014 (EUR 1.5 billion compared with EUR 2.8 billion in 2013 and EUR 4.8 billion in 2012), consistent with the ongoing trend toward lower interest rates. Excluding this adverse impact on banks' income calculated in accordance with IFRS, NBI was EUR 138.8 billion in 2014, corresponding to a smaller increase of 0.8% versus 1.8%.
1.2. Profits rise mostly on the continued decline in cost of risk in 2014 1.2.1. Lacklustre income In proportion to total average assets3 for the year, aggregate NBI was 1.96% (Chart 1), up slightly over the last three years but seemingly weaker over the longer term compared with previous years (excluding 2008).
Chart 1 NBI/total assets
Source: financial disclosures from the six groups
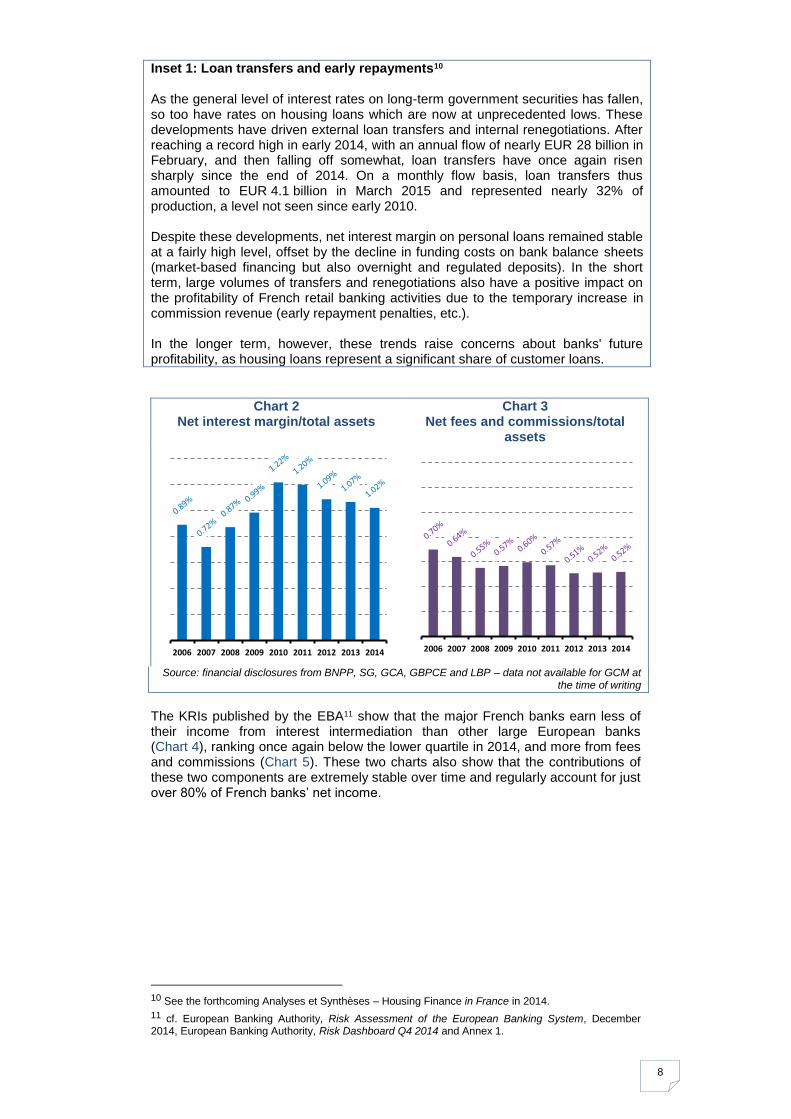
Examining the main components of NBI shows a further drop in the net interest margin in absolute terms (down 3.6% in 2014 after falling 4.3% in 2013). In proportion to total average assets, which rose over the period (see 2.1), the net interest margin thus declined slightly, from 1.09% at end-2012 to 1.07% at end-2013 and 1.02% at end-2014 (Chart 2). In light of their maturity transformation activity, banks' net interest margin has traditionally correlated positively with the slope of the yield curve. As the spread between long-term and short-term rates narrowed significantly in 2014,4 net interest margin fell. This automatic impact is compounded by two trends:
3 The average assets figure is calculated as the average of total assets from the beginning to the end of the year.
4 The spread between the 10-year yield on French Government bonds and EONIA fell from 2.16% to 0.95% between end-December 2013 and end-December 2014.
2.39%
2.09%
1.68%
1.99%
2.23% 2.14%
1.91% 1.95% 1.96%
2006 2007 2008 2009 2010 2011 2012 2013 2014
7
- On the asset side, French banks are coping with significant property loan transfers and renegotiations, leading to the production of new mortgages at lower fixed rates, which could translate into a lower return on assets and thus a lower long-term net interest margin (see inset).
- On the liabilities side, the cost of deposits has been affected by the lack of flexibility in the downward adjustment to interest on some deposits collected in the form of regulated savings (Livret A, Sustainable Development passbooks LDD, home savings accounts/plans PEL and CEL) compared with sharply declining market rates in 2014.5 Interest on these savings products remains far higher than market conditions and the automatic adjustment rules.6 The absence of a downward adjustment to these regulated rates results in higher charges for banks7 and consequently has a negative impact on net interest margin. With respect to the share of regulated savings centralised with the Caisse des Dépôts et Consignations (CDC), the decline in the commission rate, effective since July 2013,8 also had an adverse impact compared with 2013.
As a share of average assets, net fees and commissions were unchanged in 2014 at 0.52% (compared with 0.51% in 2013), but have been on a long-term downward trend since 2006 (Chart 3). Recent measures may have affected fees and commissions, namely the cap on service fees.9 In addition, the large volume of early repayment fees related to very strong loan transfer activity was a boon to 2013. This trend slowed considerably in 2014 although the segment rebounded sharply in the last few months of the year. Fees and commissions for holding and investing assets for customers helped maintain the level of commissions, as opposed to those relating to payment instruments and banking services.
5 In 2014, short-term rates continued to fall: overnight and three-month money-market rates stood at an average of 0.03% and 0.18%, respectively, in December 2014.
6 Strict application of the rate calculation formula for Livret A and the home savings plan is expected to yield returns of 0.25% and 0.40%, respectively (calculation based on January 2015 market conditions), far from the current interest rates on these two products.
7 For the home savings plan, this impact was magnified by very strong inflow momentum in 2014. This forced banks to record provisions for home savings plans which automatically reduced their earnings. The impact was greater for the major home savings plan deposit-taking institutions like Crédit Agricole.
8 See Decree no. 2013-688 of 30 July 2013 on the centralisation of Livret A, sustainable development passbook LDD and people's passbook LEP savings account deposits and the compensation of entities taking deposits on Livret A and sustainable development passbook savings accounts. The decree calls for an average decrease of 0.1% in the compensation of credit institutions that distribute Livret A or sustainable development passbook savings accounts.
9 The cap on service fees was introduced with the Banking Separation and Regulation Act of 26 July 2013 and Decree no. 2013-931 of 17 October 2013 on the cap on service fees, both applicable since 1 January 2014.
8
Inset 1: Loan transfers and early repayments10 As the general level of interest rates on long-term government securities has fallen, so too have rates on housing loans which are now at unprecedented lows. These developments have driven external loan transfers and internal renegotiations. After reaching a record high in early 2014, with an annual flow of nearly EUR 28 billion in February, and then falling off somewhat, loan transfers have once again risen sharply since the end of 2014. On a monthly flow basis, loan transfers thus amounted to EUR 4.1 billion in March 2015 and represented nearly 32% of production, a level not seen since early 2010. Despite these developments, net interest margin on personal loans remained stable at a fairly high level, offset by the decline in funding costs on bank balance sheets (market-based financing but also overnight and regulated deposits). In the short term, large volumes of transfers and renegotiations also have a positive impact on the profitability of French retail banking activities due to the temporary increase in commission revenue (early repayment penalties, etc.). In the longer term, however, these trends raise concerns about banks' future profitability, as housing loans represent a significant share of customer loans.
Chart 2 Net interest margin/total assets
Chart 3 Net fees and commissions/total
assets
Source: financial disclosures from BNPP, SG, GCA, GBPCE and LBP – data not available for GCM at
the time of writing
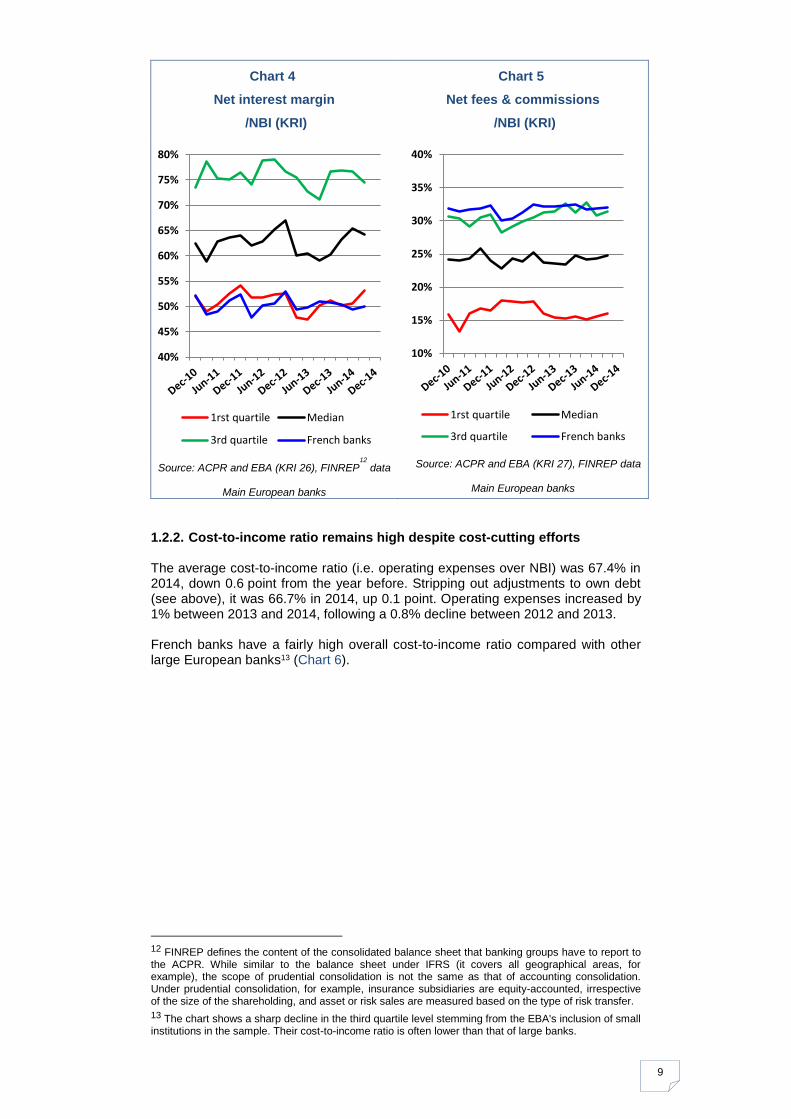
The KRIs published by the EBA11 show that the major French banks earn less of their income from interest intermediation than other large European banks (Chart 4), ranking once again below the lower quartile in 2014, and more from fees and commissions (Chart 5). These two charts also show that the contributions of these two components are extremely stable over time and regularly account for just over 80% of French banks’ net income.
10 See the forthcoming Analyses et Synthèses – Housing Finance in France in 2014.
11 cf. European Banking Authority, Risk Assessment of the European Banking System, December 2014, European Banking Authority, Risk Dashboard Q4 2014 and Annex 1.
2006 2007 2008 2009 2010 2011 2012 2013 2014 2006 2007 2008 2009 2010 2011 2012 2013 2014
9
Chart 4
Net interest margin
/NBI (KRI)
Chart 5
Net fees & commissions
/NBI (KRI)
Source: ACPR and EBA (KRI 26), FINREP12
data
Main European banks
Source: ACPR and EBA (KRI 27), FINREP data
Main European banks
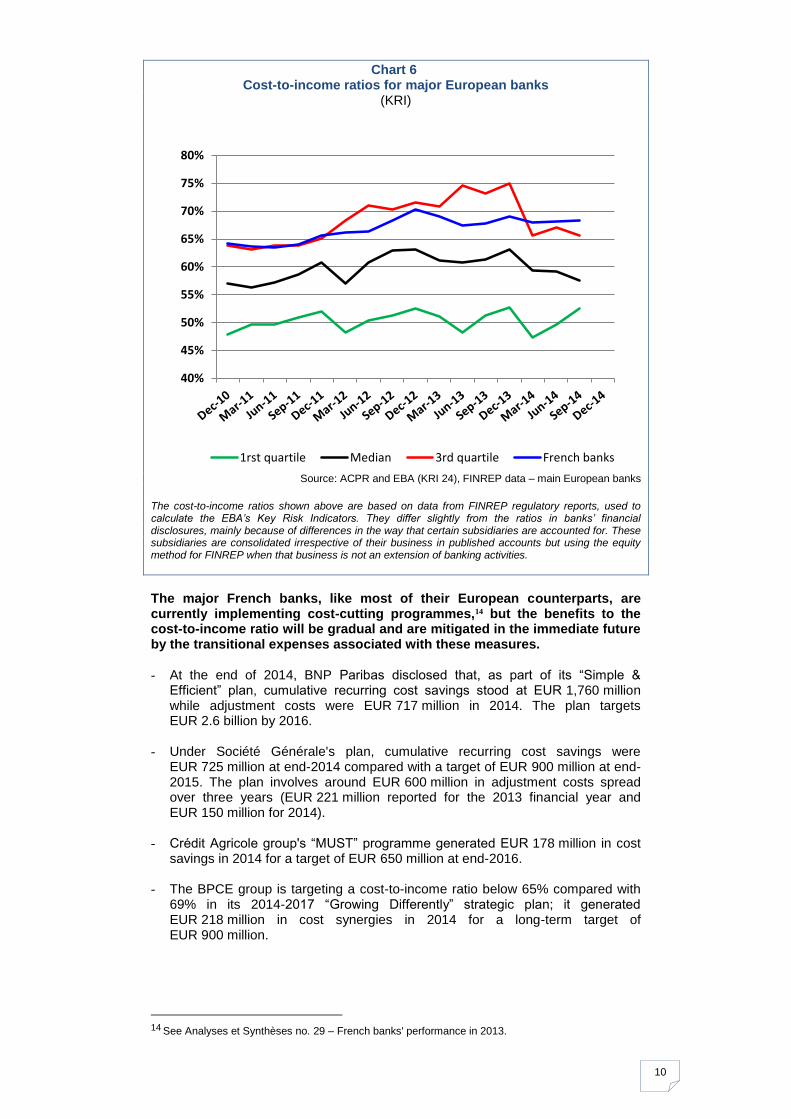
1.2.2. Cost-to-income ratio remains high despite cost-cutting efforts The average cost-to-income ratio (i.e. operating expenses over NBI) was 67.4% in 2014, down 0.6 point from the year before. Stripping out adjustments to own debt (see above), it was 66.7% in 2014, up 0.1 point. Operating expenses increased by 1% between 2013 and 2014, following a 0.8% decline between 2012 and 2013. French banks have a fairly high overall cost-to-income ratio compared with other large European banks13 (Chart 6).
12 FINREP defines the content of the consolidated balance sheet that banking groups have to report to the ACPR. While similar to the balance sheet under IFRS (it covers all geographical areas, for example), the scope of prudential consolidation is not the same as that of accounting consolidation. Under prudential consolidation, for example, insurance subsidiaries are equity-accounted, irrespective of the size of the shareholding, and asset or risk sales are measured based on the type of risk transfer.
13 The chart shows a sharp decline in the third quartile level stemming from the EBA's inclusion of small institutions in the sample. Their cost-to-income ratio is often lower than that of large banks.
40%
45%
50%
55%
60%
65%
70%
75%
80%
1rst quartile Median
3rd quartile French banks
10%
15%
20%
25%
30%
35%
40%
1rst quartile Median
3rd quartile French banks
10
Chart 6 Cost-to-income ratios for major European banks
(KRI)
Source: ACPR and EBA (KRI 24), FINREP data – main European banks
The cost-to-income ratios shown above are based on data from FINREP regulatory reports, used to calculate the EBA’s Key Risk Indicators. They differ slightly from the ratios in banks’ financial disclosures, mainly because of differences in the way that certain subsidiaries are accounted for. These subsidiaries are consolidated irrespective of their business in published accounts but using the equity method for FINREP when that business is not an extension of banking activities.
The major French banks, like most of their European counterparts, are currently implementing cost-cutting programmes,14 but the benefits to the cost-to-income ratio will be gradual and are mitigated in the immediate future by the transitional expenses associated with these measures. - At the end of 2014, BNP Paribas disclosed that, as part of its “Simple &
Efficient” plan, cumulative recurring cost savings stood at EUR 1,760 million while adjustment costs were EUR 717 million in 2014. The plan targets EUR 2.6 billion by 2016.
- Under Société Générale's plan, cumulative recurring cost savings were EUR 725 million at end-2014 compared with a target of EUR 900 million at end-2015. The plan involves around EUR 600 million in adjustment costs spread over three years (EUR 221 million reported for the 2013 financial year and EUR 150 million for 2014).
- Crédit Agricole group's “MUST” programme generated EUR 178 million in cost
savings in 2014 for a target of EUR 650 million at end-2016.
- The BPCE group is targeting a cost-to-income ratio below 65% compared with 69% in its 2014-2017 “Growing Differently” strategic plan; it generated EUR 218 million in cost synergies in 2014 for a long-term target of EUR 900 million.
14
See Analyses et Synthèses no. 29 – French banks' performance in 2013.
40%
45%
50%
55%
60%
65%
70%
75%
80%
1rst quartile Median 3rd quartile French banks
11
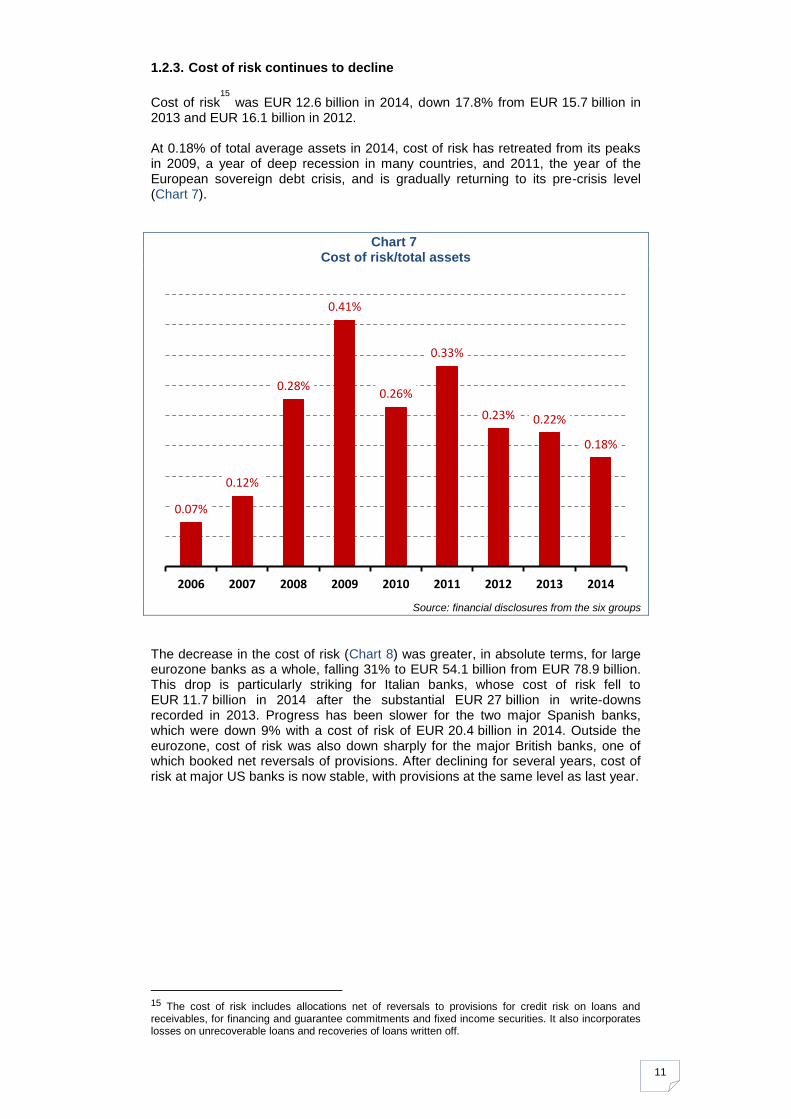
1.2.3. Cost of risk continues to decline
Cost of risk15
was EUR 12.6 billion in 2014, down 17.8% from EUR 15.7 billion in 2013 and EUR 16.1 billion in 2012. At 0.18% of total average assets in 2014, cost of risk has retreated from its peaks in 2009, a year of deep recession in many countries, and 2011, the year of the European sovereign debt crisis, and is gradually returning to its pre-crisis level (Chart 7).
Chart 7 Cost of risk/total assets
Source: financial disclosures from the six groups
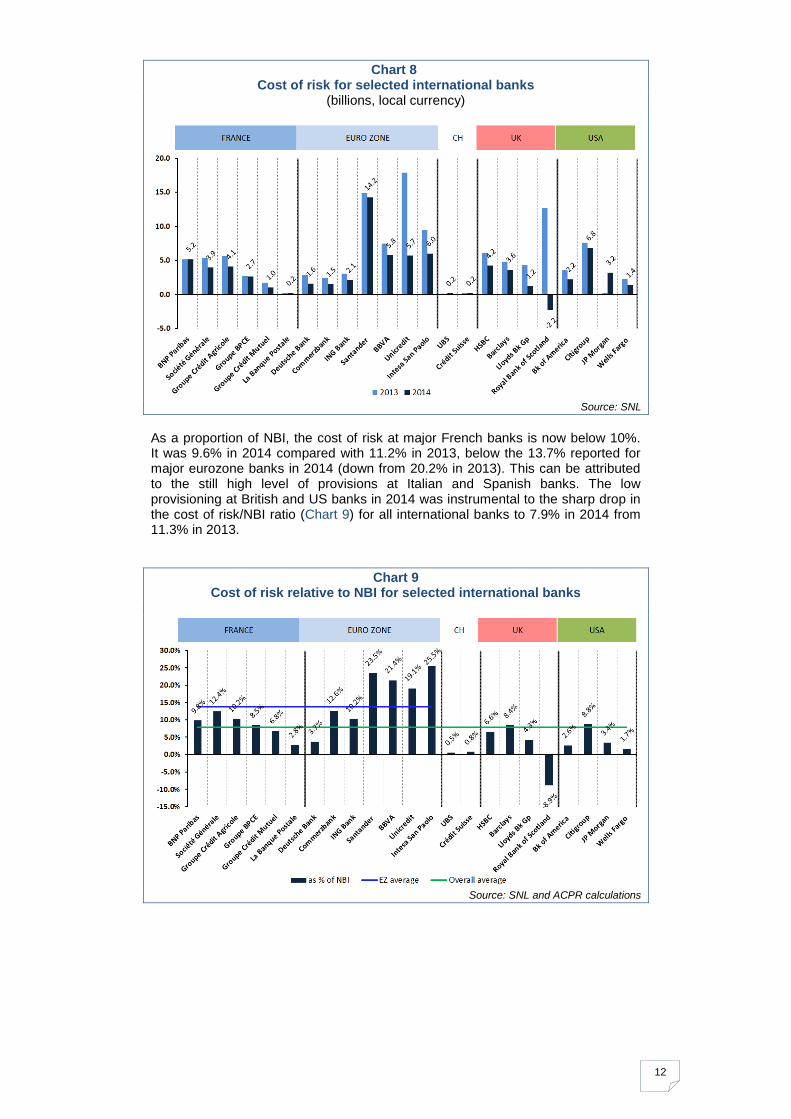
The decrease in the cost of risk (Chart 8) was greater, in absolute terms, for large eurozone banks as a whole, falling 31% to EUR 54.1 billion from EUR 78.9 billion. This drop is particularly striking for Italian banks, whose cost of risk fell to EUR 11.7 billion in 2014 after the substantial EUR 27 billion in write-downs recorded in 2013. Progress has been slower for the two major Spanish banks, which were down 9% with a cost of risk of EUR 20.4 billion in 2014. Outside the eurozone, cost of risk was also down sharply for the major British banks, one of which booked net reversals of provisions. After declining for several years, cost of risk at major US banks is now stable, with provisions at the same level as last year.
15 The cost of risk includes allocations net of reversals to provisions for credit risk on loans and receivables, for financing and guarantee commitments and fixed income securities. It also incorporates losses on unrecoverable loans and recoveries of loans written off.
0.07%
0.12%
0.28%
0.41%
0.26%
0.33%
0.23% 0.22%
0.18%
2006 2007 2008 2009 2010 2011 2012 2013 2014
12
Chart 8 Cost of risk for selected international banks
(billions, local currency)
Source: SNL
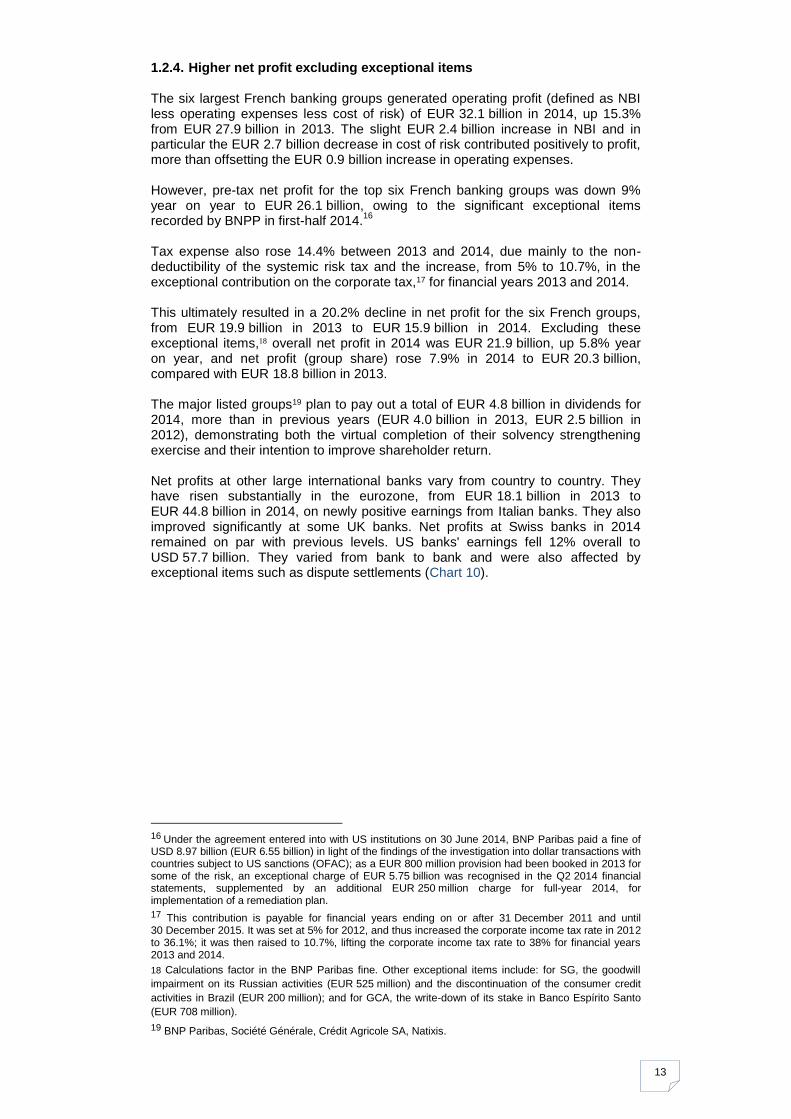
As a proportion of NBI, the cost of risk at major French banks is now below 10%. It was 9.6% in 2014 compared with 11.2% in 2013, below the 13.7% reported for major eurozone banks in 2014 (down from 20.2% in 2013). This can be attributed to the still high level of provisions at Italian and Spanish banks. The low provisioning at British and US banks in 2014 was instrumental to the sharp drop in the cost of risk/NBI ratio (Chart 9) for all international banks to 7.9% in 2014 from 11.3% in 2013.
Chart 9 Cost of risk relative to NBI for selected international banks
Source: SNL and ACPR calculations
13
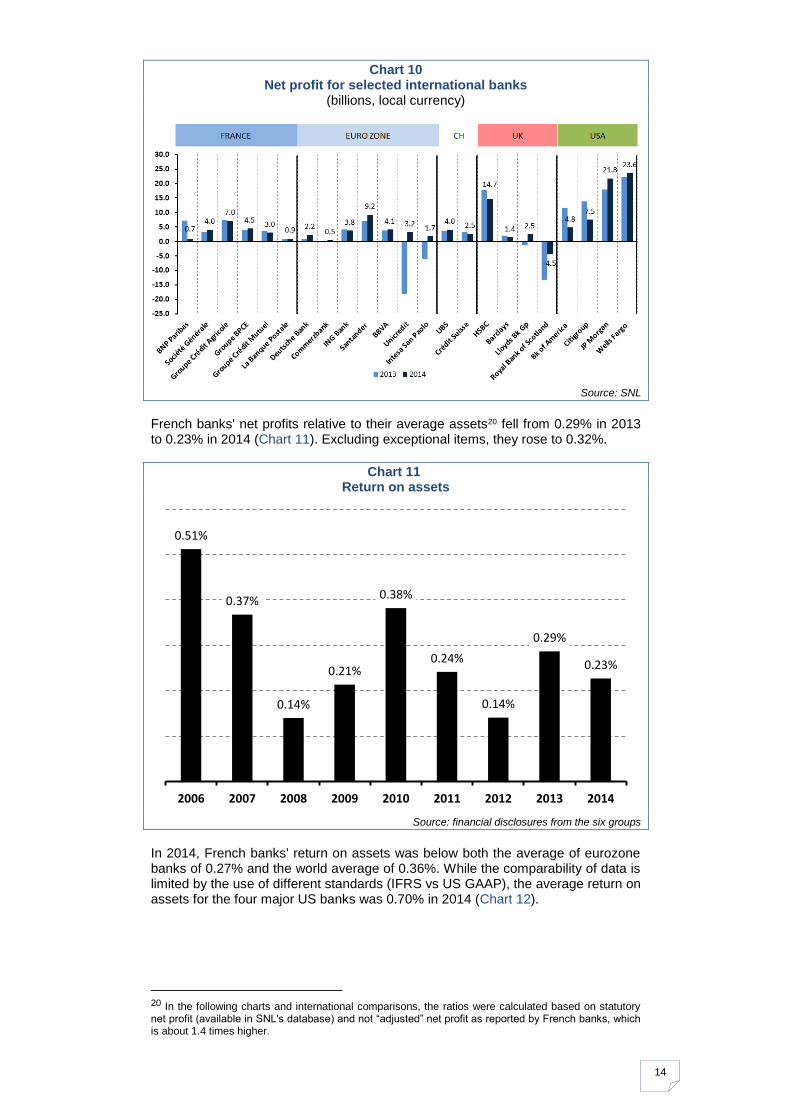
1.2.4. Higher net profit excluding exceptional items The six largest French banking groups generated operating profit (defined as NBI less operating expenses less cost of risk) of EUR 32.1 billion in 2014, up 15.3% from EUR 27.9 billion in 2013. The slight EUR 2.4 billion increase in NBI and in particular the EUR 2.7 billion decrease in cost of risk contributed positively to profit, more than offsetting the EUR 0.9 billion increase in operating expenses. However, pre-tax net profit for the top six French banking groups was down 9% year on year to EUR 26.1 billion, owing to the significant exceptional items recorded by BNPP in first-half 2014.
16
Tax expense also rose 14.4% between 2013 and 2014, due mainly to the non-deductibility of the systemic risk tax and the increase, from 5% to 10.7%, in the exceptional contribution on the corporate tax,17 for financial years 2013 and 2014. This ultimately resulted in a 20.2% decline in net profit for the six French groups, from EUR 19.9 billion in 2013 to EUR 15.9 billion in 2014. Excluding these exceptional items,18 overall net profit in 2014 was EUR 21.9 billion, up 5.8% year on year, and net profit (group share) rose 7.9% in 2014 to EUR 20.3 billion, compared with EUR 18.8 billion in 2013. The major listed groups19 plan to pay out a total of EUR 4.8 billion in dividends for 2014, more than in previous years (EUR 4.0 billion in 2013, EUR 2.5 billion in 2012), demonstrating both the virtual completion of their solvency strengthening exercise and their intention to improve shareholder return. Net profits at other large international banks vary from country to country. They have risen substantially in the eurozone, from EUR 18.1 billion in 2013 to EUR 44.8 billion in 2014, on newly positive earnings from Italian banks. They also improved significantly at some UK banks. Net profits at Swiss banks in 2014 remained on par with previous levels. US banks' earnings fell 12% overall to USD 57.7 billion. They varied from bank to bank and were also affected by exceptional items such as dispute settlements (Chart 10).
16
Under the agreement entered into with US institutions on 30 June 2014, BNP Paribas paid a fine of USD 8.97 billion (EUR 6.55 billion) in light of the findings of the investigation into dollar transactions with countries subject to US sanctions (OFAC); as a EUR 800 million provision had been booked in 2013 for some of the risk, an exceptional charge of EUR 5.75 billion was recognised in the Q2 2014 financial statements, supplemented by an additional EUR 250 million charge for full-year 2014, for implementation of a remediation plan.
17 This contribution is payable for financial years ending on or after 31 December 2011 and until 30 December 2015. It was set at 5% for 2012, and thus increased the corporate income tax rate in 2012 to 36.1%; it was then raised to 10.7%, lifting the corporate income tax rate to 38% for financial years 2013 and 2014.
18 Calculations factor in the BNP Paribas fine. Other exceptional items include: for SG, the goodwill
impairment on its Russian activities (EUR 525 million) and the discontinuation of the consumer credit
activities in Brazil (EUR 200 million); and for GCA, the write-down of its stake in Banco Espírito Santo
(EUR 708 million). 19 BNP Paribas, Société Générale, Crédit Agricole SA, Natixis.
14
Chart 10 Net profit for selected international banks
(billions, local currency)
Source: SNL
French banks' net profits relative to their average assets20 fell from 0.29% in 2013 to 0.23% in 2014 (Chart 11). Excluding exceptional items, they rose to 0.32%.
Chart 11 Return on assets
Source: financial disclosures from the six groups
In 2014, French banks' return on assets was below both the average of eurozone banks of 0.27% and the world average of 0.36%. While the comparability of data is limited by the use of different standards (IFRS vs US GAAP), the average return on assets for the four major US banks was 0.70% in 2014 (Chart 12).
20 In the following charts and international comparisons, the ratios were calculated based on statutory net profit (available in SNL's database) and not “adjusted” net profit as reported by French banks, which is about 1.4 times higher.
0.51%
0.37%
0.14%
0.21%
0.38%
0.24%
0.14%
0.29%
0.23%
2006 2007 2008 2009 2010 2011 2012 2013 2014

15
Chart 12 Return on assets at selected international banks
Source: SNL and ACPR calculations
Lastly, French banks' return on equity retreated by several points (Chart 13). It stood at 4.5% in 2014, down 1.5 points from 2013, which moves it closer to European banks' ratio of 4.9% in 2014 (compared with 3.3% in 2013). Excluding exceptional items, French banks' ratio was 6.2%, still slightly below the world average of 6.6% and US banks' ratio of 6.8%.
Chart 13 Return on equity
Source: SNL and ACPR calculations (a sample of 51 banks)
NB: “All banks” is the weighted average of the 51 banks in the sample, from all geographical areas (EU, Switzerland, USA, Canada) apart from China (2014 data not yet available)
Generally, it may be noted that a combination of improved solvency (see below) and more modest profits is putting strong downward pressure on return on equity relative to pre-crisis levels.
-10%
-5%
+0%
+5%
+10%
+15%
+20%
+25%
201420132012201120102009200820072006200520042003200220012000
US France Europe All banks
16
1.3. Earnings increased moderately across all business lines
Inset 2: Analysis by business line Large banking groups disclose information on their major operating segments (e.g. retail banking, corporate and investment banking and asset management) in their consolidated financial statements. Since this information is based on each group's internal structure, it varies significantly,
21
and adjustments have to be made for the purposes of comparison. Accordingly, the figures in the following tables and charts may differ slightly from those disclosed by the banks themselves for the business lines concerned. For example, insurance has been included in asset management for all these groups when the classification may actually be different (some include insurance in retail banking, others in asset or savings management).
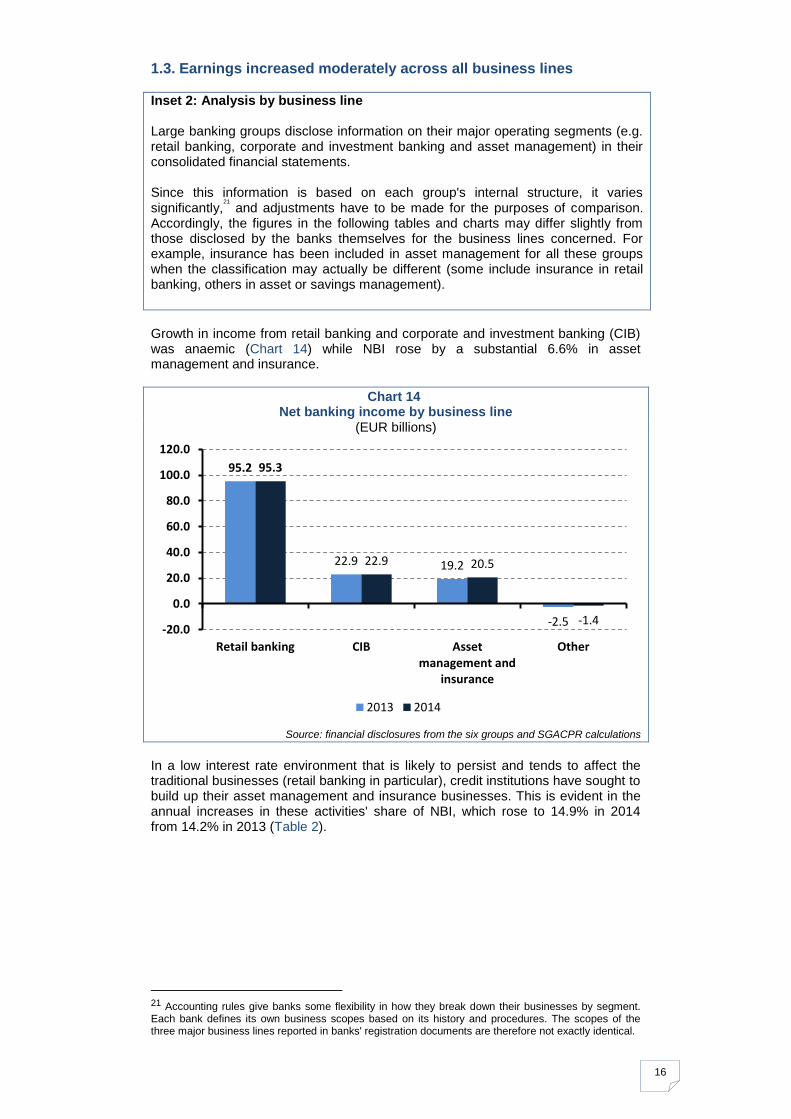
Growth in income from retail banking and corporate and investment banking (CIB) was anaemic (Chart 14) while NBI rose by a substantial 6.6% in asset management and insurance.
Chart 14 Net banking income by business line
(EUR billions)
Source: financial disclosures from the six groups and SGACPR calculations
In a low interest rate environment that is likely to persist and tends to affect the traditional businesses (retail banking in particular), credit institutions have sought to build up their asset management and insurance businesses. This is evident in the annual increases in these activities' share of NBI, which rose to 14.9% in 2014 from 14.2% in 2013 (Table 2).
21 Accounting rules give banks some flexibility in how they break down their businesses by segment. Each bank defines its own business scopes based on its history and procedures. The scopes of the three major business lines reported in banks' registration documents are therefore not exactly identical.
95.2
22.9 19.2
-2.5
95.3
22.9 20.5
-1.4 -20.0
0.0
20.0
40.0
60.0
80.0
100.0
120.0
Retail banking CIB Assetmanagement and
insurance
Other
2013 2014
17
Table 2 Contributions to NBI from major business lines since 2010
Source: financial disclosures from the six groups NB: The ‘Other’ line in the table refers to activities that have not been assigned to a specific business line, such as income related to changes in own credit risk, the centralisation of intra-group funding and equity interests.
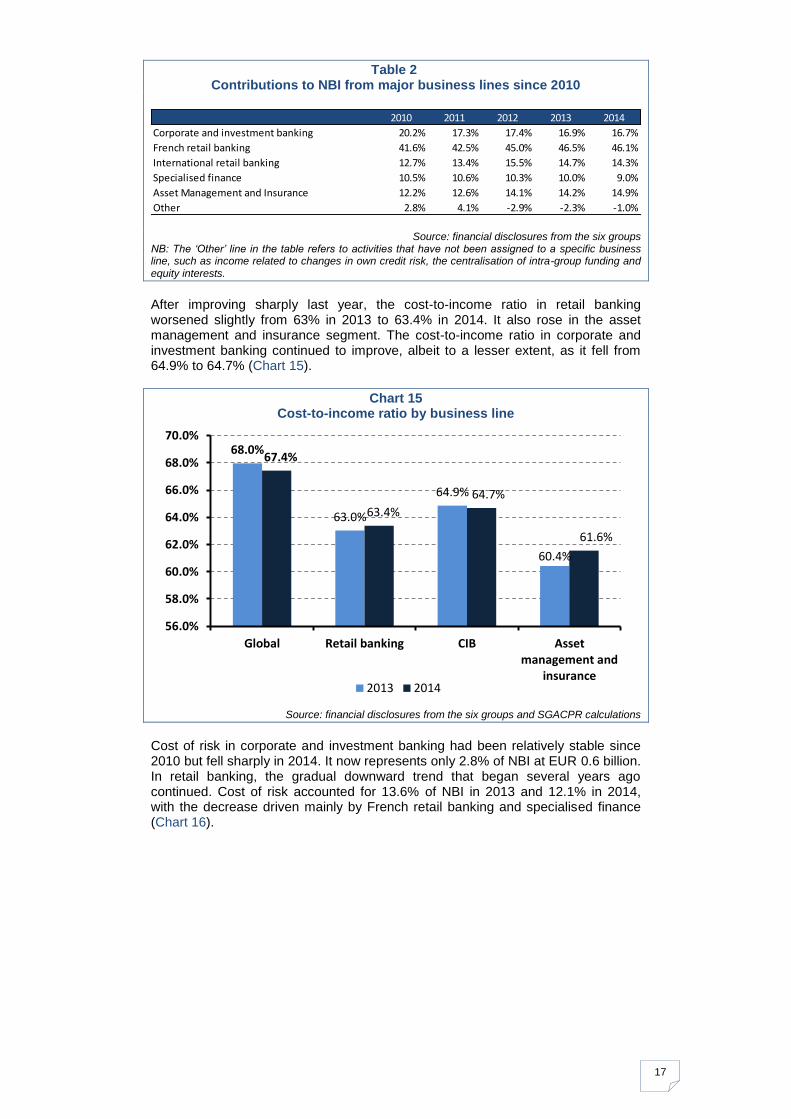
After improving sharply last year, the cost-to-income ratio in retail banking worsened slightly from 63% in 2013 to 63.4% in 2014. It also rose in the asset management and insurance segment. The cost-to-income ratio in corporate and investment banking continued to improve, albeit to a lesser extent, as it fell from 64.9% to 64.7% (Chart 15).
Chart 15 Cost-to-income ratio by business line
Source: financial disclosures from the six groups and SGACPR calculations
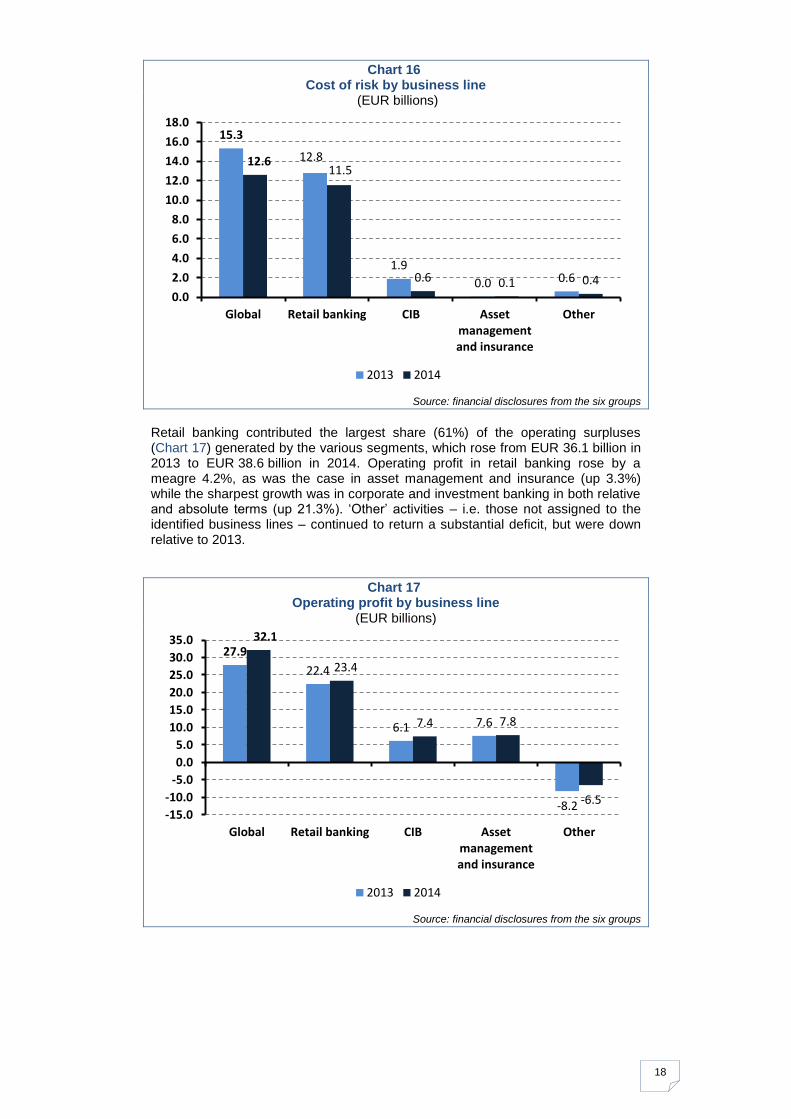
Cost of risk in corporate and investment banking had been relatively stable since 2010 but fell sharply in 2014. It now represents only 2.8% of NBI at EUR 0.6 billion. In retail banking, the gradual downward trend that began several years ago continued. Cost of risk accounted for 13.6% of NBI in 2013 and 12.1% in 2014, with the decrease driven mainly by French retail banking and specialised finance (Chart 16).
2010 2011 2012 2013 2014
Corporate and investment banking 20.2% 17.3% 17.4% 16.9% 16.7%
French retail banking 41.6% 42.5% 45.0% 46.5% 46.1%
International retail banking 12.7% 13.4% 15.5% 14.7% 14.3%
Specialised finance 10.5% 10.6% 10.3% 10.0% 9.0%
Asset Management and Insurance 12.2% 12.6% 14.1% 14.2% 14.9%
Other 2.8% 4.1% -2.9% -2.3% -1.0%
68.0%
63.0%
64.9%
60.4%
67.4%
63.4%
64.7%
61.6%
56.0%
58.0%
60.0%
62.0%
64.0%
66.0%
68.0%
70.0%
Global Retail banking CIB Assetmanagement and
insurance2013 2014
18
Chart 16 Cost of risk by business line
(EUR billions)
Source: financial disclosures from the six groups
Retail banking contributed the largest share (61%) of the operating surpluses (Chart 17) generated by the various segments, which rose from EUR 36.1 billion in 2013 to EUR 38.6 billion in 2014. Operating profit in retail banking rose by a meagre 4.2%, as was the case in asset management and insurance (up 3.3%) while the sharpest growth was in corporate and investment banking in both relative and absolute terms (up 21.3%). ‘Other’ activities – i.e. those not assigned to the identified business lines – continued to return a substantial deficit, but were down relative to 2013.
Chart 17 Operating profit by business line
(EUR billions)
Source: financial disclosures from the six groups
15.3
12.8
1.9
0.0 0.6
12.6 11.5
0.6 0.1 0.4
0.0
2.0
4.0
6.0
8.0
10.0
12.0
14.0
16.0
18.0
Global Retail banking CIB Assetmanagementand insurance
Other
2013 2014
27.9
22.4
6.1 7.6
-8.2
32.1
23.4
7.4 7.8
-6.5 -15.0
-10.0
-5.0
0.0
5.0
10.0
15.0
20.0
25.0
30.0
35.0
Global Retail banking CIB Assetmanagementand insurance
Other
2013 2014
19
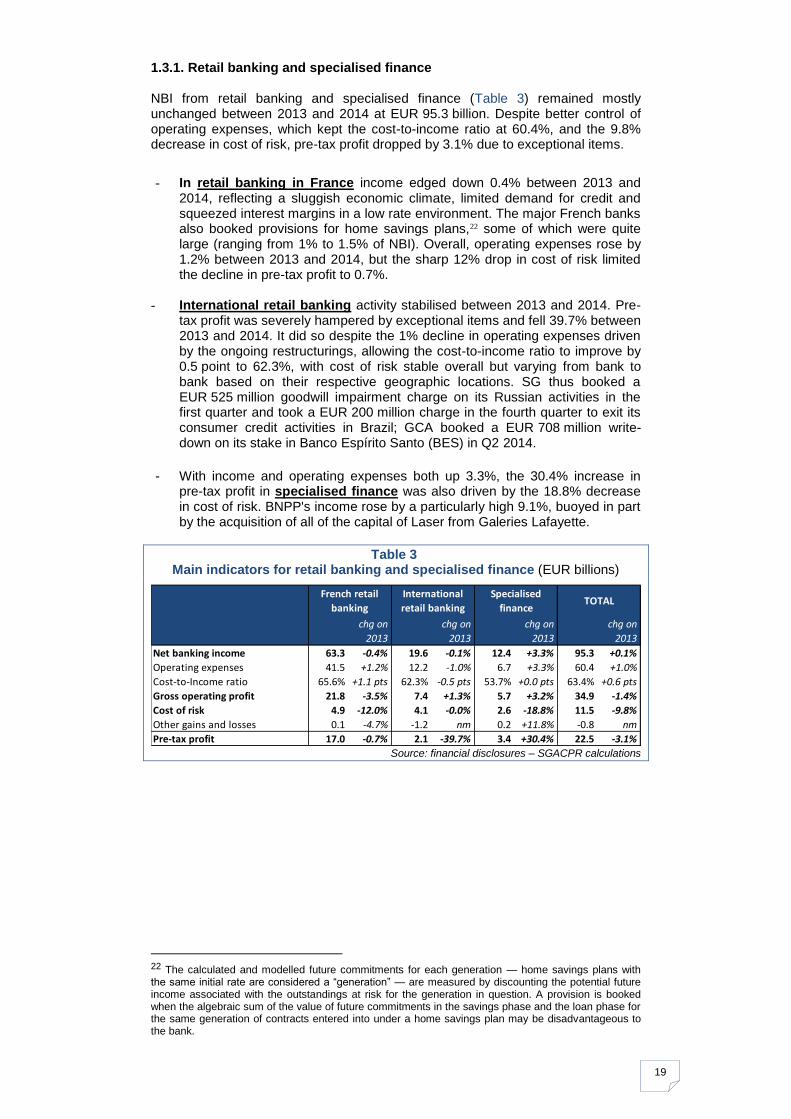
1.3.1. Retail banking and specialised finance NBI from retail banking and specialised finance (Table 3) remained mostly unchanged between 2013 and 2014 at EUR 95.3 billion. Despite better control of operating expenses, which kept the cost-to-income ratio at 60.4%, and the 9.8% decrease in cost of risk, pre-tax profit dropped by 3.1% due to exceptional items.
- In retail banking in France income edged down 0.4% between 2013 and 2014, reflecting a sluggish economic climate, limited demand for credit and squeezed interest margins in a low rate environment. The major French banks also booked provisions for home savings plans,22 some of which were quite large (ranging from 1% to 1.5% of NBI). Overall, operating expenses rose by 1.2% between 2013 and 2014, but the sharp 12% drop in cost of risk limited the decline in pre-tax profit to 0.7%.
- International retail banking activity stabilised between 2013 and 2014. Pre-
tax profit was severely hampered by exceptional items and fell 39.7% between 2013 and 2014. It did so despite the 1% decline in operating expenses driven by the ongoing restructurings, allowing the cost-to-income ratio to improve by 0.5 point to 62.3%, with cost of risk stable overall but varying from bank to bank based on their respective geographic locations. SG thus booked a EUR 525 million goodwill impairment charge on its Russian activities in the first quarter and took a EUR 200 million charge in the fourth quarter to exit its consumer credit activities in Brazil; GCA booked a EUR 708 million write-down on its stake in Banco Espírito Santo (BES) in Q2 2014.
- With income and operating expenses both up 3.3%, the 30.4% increase in
pre-tax profit in specialised finance was also driven by the 18.8% decrease in cost of risk. BNPP's income rose by a particularly high 9.1%, buoyed in part by the acquisition of all of the capital of Laser from Galeries Lafayette.
Table 3 Main indicators for retail banking and specialised finance (EUR billions)
Source: financial disclosures – SGACPR calculations
22 The calculated and modelled future commitments for each generation — home savings plans with the same initial rate are considered a “generation” — are measured by discounting the potential future income associated with the outstandings at risk for the generation in question. A provision is booked when the algebraic sum of the value of future commitments in the savings phase and the loan phase for the same generation of contracts entered into under a home savings plan may be disadvantageous to the bank.
chg on
2013
chg on
2013
chg on
2013
chg on
2013
Net banking income 63.3 -0.4% 19.6 -0.1% 12.4 +3.3% 95.3 +0.1%
Operating expenses 41.5 +1.2% 12.2 -1.0% 6.7 +3.3% 60.4 +1.0%
Cost-to-Income ratio 65.6% +1.1 pts 62.3% -0.5 pts 53.7% +0.0 pts 63.4% +0.6 pts
Gross operating profit 21.8 -3.5% 7.4 +1.3% 5.7 +3.2% 34.9 -1.4%
Cost of risk 4.9 -12.0% 4.1 -0.0% 2.6 -18.8% 11.5 -9.8%
Other gains and losses 0.1 -4.7% -1.2 nm 0.2 +11.8% -0.8 nm
Pre-tax profit 17.0 -0.7% 2.1 -39.7% 3.4 +30.4% 22.5 -3.1%
French retail
banking
International
retail banking
Specialised
financeTOTAL
20
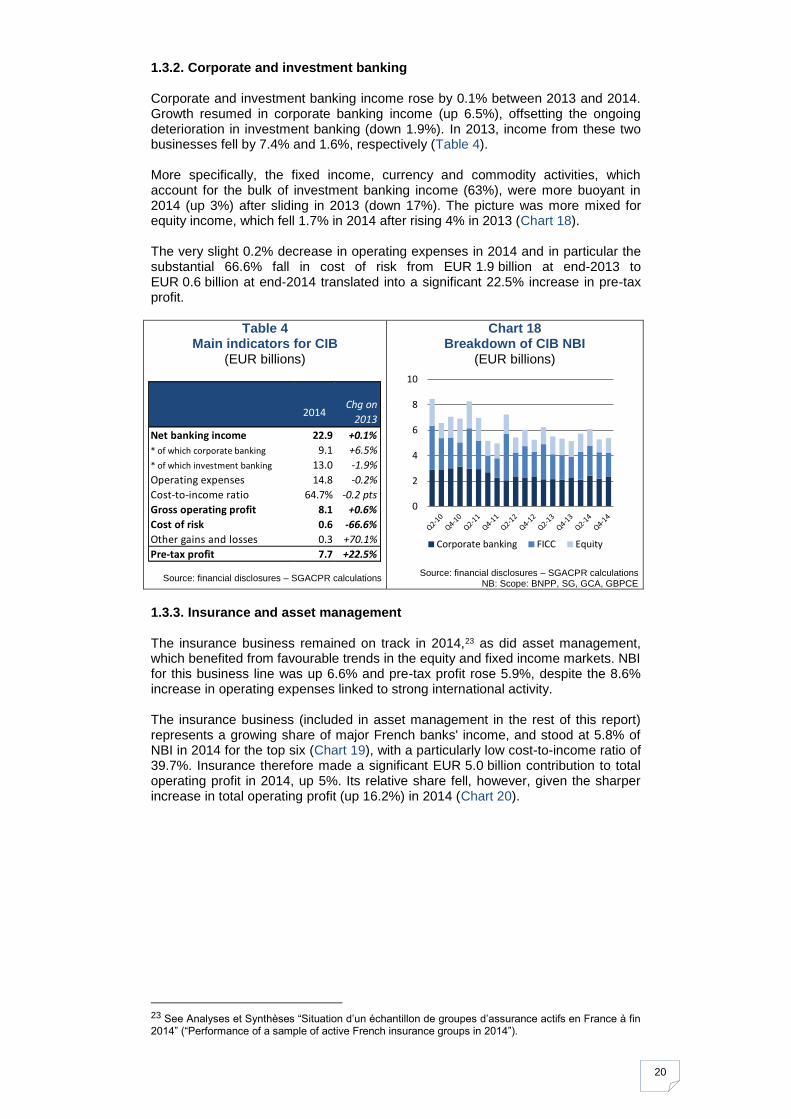
1.3.2. Corporate and investment banking Corporate and investment banking income rose by 0.1% between 2013 and 2014. Growth resumed in corporate banking income (up 6.5%), offsetting the ongoing deterioration in investment banking (down 1.9%). In 2013, income from these two businesses fell by 7.4% and 1.6%, respectively (Table 4). More specifically, the fixed income, currency and commodity activities, which account for the bulk of investment banking income (63%), were more buoyant in 2014 (up 3%) after sliding in 2013 (down 17%). The picture was more mixed for equity income, which fell 1.7% in 2014 after rising 4% in 2013 (Chart 18). The very slight 0.2% decrease in operating expenses in 2014 and in particular the substantial 66.6% fall in cost of risk from EUR 1.9 billion at end-2013 to EUR 0.6 billion at end-2014 translated into a significant 22.5% increase in pre-tax profit.
Table 4 Main indicators for CIB
(EUR billions)
Source: financial disclosures – SGACPR calculations
Chart 18 Breakdown of CIB NBI
(EUR billions)
Source: financial disclosures – SGACPR calculations NB: Scope: BNPP, SG, GCA, GBPCE
1.3.3. Insurance and asset management The insurance business remained on track in 2014,23 as did asset management, which benefited from favourable trends in the equity and fixed income markets. NBI for this business line was up 6.6% and pre-tax profit rose 5.9%, despite the 8.6% increase in operating expenses linked to strong international activity. The insurance business (included in asset management in the rest of this report) represents a growing share of major French banks' income, and stood at 5.8% of NBI in 2014 for the top six (Chart 19), with a particularly low cost-to-income ratio of 39.7%. Insurance therefore made a significant EUR 5.0 billion contribution to total operating profit in 2014, up 5%. Its relative share fell, however, given the sharper increase in total operating profit (up 16.2%) in 2014 (Chart 20).
23 See Analyses et Synthèses “Situation d’un échantillon de groupes d’assurance actifs en France à fin 2014” (“Performance of a sample of active French insurance groups in 2014”).
2014Chg on
2013
Net banking income 22.9 +0.1%
* of which corporate banking 9.1 +6.5%
* of which investment banking 13.0 -1.9%
Operating expenses 14.8 -0.2%
Cost-to-income ratio 64.7% -0.2 pts
Gross operating profit 8.1 +0.6%
Cost of risk 0.6 -66.6%
Other gains and losses 0.3 +70.1%
Pre-tax profit 7.7 +22.5%
0
2
4
6
8
10
Corporate banking FICC Equity

21
Chart 19 Insurance share of NBI
for the six banks
Chart 20 Insurance share of operating profit
(excluding GBPCE in 2011 and 2012)
Source: financial disclosures
4.3%
5.2% 5.5%
5.8%
0%
1%
2%
3%
4%
5%
6%
7%
2011 2012 2013 2014
8.5%
17.1% 17.0% 15.5%
0%
5%
10%
15%
20%
2011 2012 2013 2014

22
2. Balance sheets and solvency24
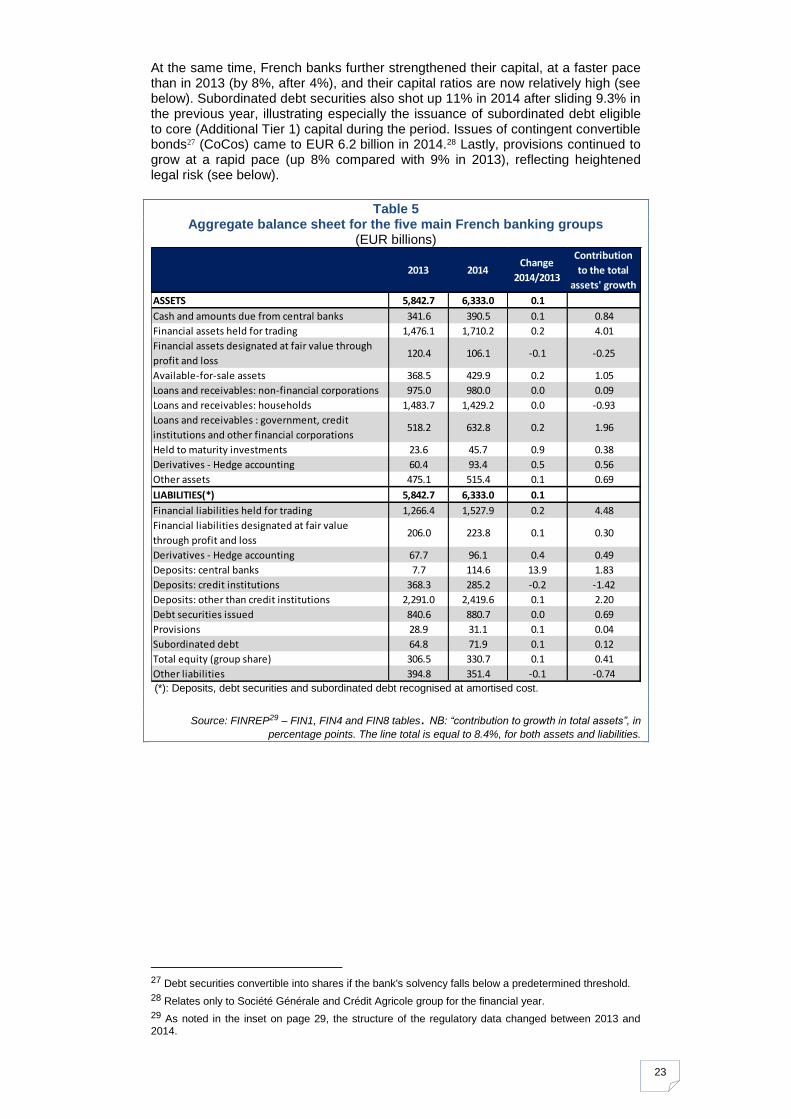
2.1. Aggregate assets for the five groups up 8% Following a 7.5% decrease between 2012 and 2013, the aggregate balance sheet total for the five banking groups rose 8% between 2013 and 2014 (Table 5). French banks made some adjustments to the structure of their balance sheets in light of implementation of CRR/CRD IV rules, some of which took effect on 1 January 2014, and in anticipation of the results of the Asset Quality Review (AQR). On the asset side, while the most striking change in percentage terms was the increase in held-to-maturity investments (a EUR 22 billion increase, up 94%), the most substantial rise in absolute terms was in financial assets held for trading (a EUR 235 billion increase, up 16%). These changes highlight the increase in balance sheet holdings of sovereign securities, strengthening the liquidity buffer as part of the transition to new prudential rules (see section 3.5.2, LCR). Available-for-sale financial assets also increased, by EUR 61 billion (up 17%), as opposed to financial assets designated at fair value through profit or loss, which fell by EUR 14 billion (down 12%). In contrast to investment activities, financing of the economy dipped slightly. Loans to households fell during the period (by EUR 54 billion, down 3.7%) and loans to non-financial corporations were stable after falling in the last two years (a EUR 5 billion increase, up 0.5% in 2014 after falling by 2.1% in 2013 and 5.1% in 2012). However, other loans and receivables25 rose significantly after declining in the previous year (a EUR 115 billion increase, up 22% in 2014 after falling 10% in 2013). Lastly, cash and amounts due from central banks continued their steady climb (increasing by EUR 49 billion, or 14% in 2014, after rising 8% in 2013), a sign that banks continued their efforts to comply with the LCR, and hedging derivatives rose by EUR 33 billion, up 55%. On the liabilities side, with the exception of other liabilities and deposits from credit institutions, which both fell significantly (by 23.4% and 22.6%, respectively), the other line items rose in 2014. The most striking change was the EUR 107 billion increase in central bank deposits, with a 1.8 point contribution to growth in total assets. This can be attributed primarily to year-end liquidity management by certain banks that adopted new pricing policies to attract deposits26 from institutional customers such as central banks. Financial instruments held for trading also rose by a substantial 21%. Conversely, deposits from credit institutions continued to fall by an equally large amount (down 23% compared with a 21% drop in 2013).
24 Unless stated otherwise, this chapter refers to BNPP, SG, GCA, GBPCE and GCM.
25 Including loans to central banks, general governments, credit institutions and other financial corporations.
26 Generally with short-term maturities (less than one month).
23
At the same time, French banks further strengthened their capital, at a faster pace than in 2013 (by 8%, after 4%), and their capital ratios are now relatively high (see below). Subordinated debt securities also shot up 11% in 2014 after sliding 9.3% in the previous year, illustrating especially the issuance of subordinated debt eligible to core (Additional Tier 1) capital during the period. Issues of contingent convertible bonds27 (CoCos) came to EUR 6.2 billion in 2014.28 Lastly, provisions continued to grow at a rapid pace (up 8% compared with 9% in 2013), reflecting heightened legal risk (see below).
Table 5 Aggregate balance sheet for the five main French banking groups
(EUR billions)
(*): Deposits, debt securities and subordinated debt recognised at amortised cost.
Source: FINREP29 – FIN1, FIN4 and FIN8 tables. NB: “contribution to growth in total assets”, in
percentage points. The line total is equal to 8.4%, for both assets and liabilities.
27 Debt securities convertible into shares if the bank's solvency falls below a predetermined threshold.
28 Relates only to Société Générale and Crédit Agricole group for the financial year.
29 As noted in the inset on page 29, the structure of the regulatory data changed between 2013 and 2014.
2013 2014Change
2014/2013
Contribution
to the total
assets' growth
ASSETS 5,842.7 6,333.0 0.1
Cash and amounts due from central banks 341.6 390.5 0.1 0.84
Financial assets held for trading 1,476.1 1,710.2 0.2 4.01
Financial assets designated at fair value through
profit and loss120.4 106.1 -0.1 -0.25
Available-for-sale assets 368.5 429.9 0.2 1.05
Loans and receivables: non-financial corporations 975.0 980.0 0.0 0.09
Loans and receivables: households 1,483.7 1,429.2 0.0 -0.93
Loans and receivables : government, credit
institutions and other financial corporations518.2 632.8 0.2 1.96
Held to maturity investments 23.6 45.7 0.9 0.38
Derivatives - Hedge accounting 60.4 93.4 0.5 0.56
Other assets 475.1 515.4 0.1 0.69
LIABILITIES(*) 5,842.7 6,333.0 0.1
Financial liabilities held for trading 1,266.4 1,527.9 0.2 4.48
Financial liabilities designated at fair value
through profit and loss206.0 223.8 0.1 0.30
Derivatives - Hedge accounting 67.7 96.1 0.4 0.49
Deposits: central banks 7.7 114.6 13.9 1.83
Deposits: credit institutions 368.3 285.2 -0.2 -1.42
Deposits: other than credit institutions 2,291.0 2,419.6 0.1 2.20
Debt securities issued 840.6 880.7 0.0 0.69
Provisions 28.9 31.1 0.1 0.04
Subordinated debt 64.8 71.9 0.1 0.12
Total equity (group share) 306.5 330.7 0.1 0.41
Other liabilities 394.8 351.4 -0.1 -0.74
24
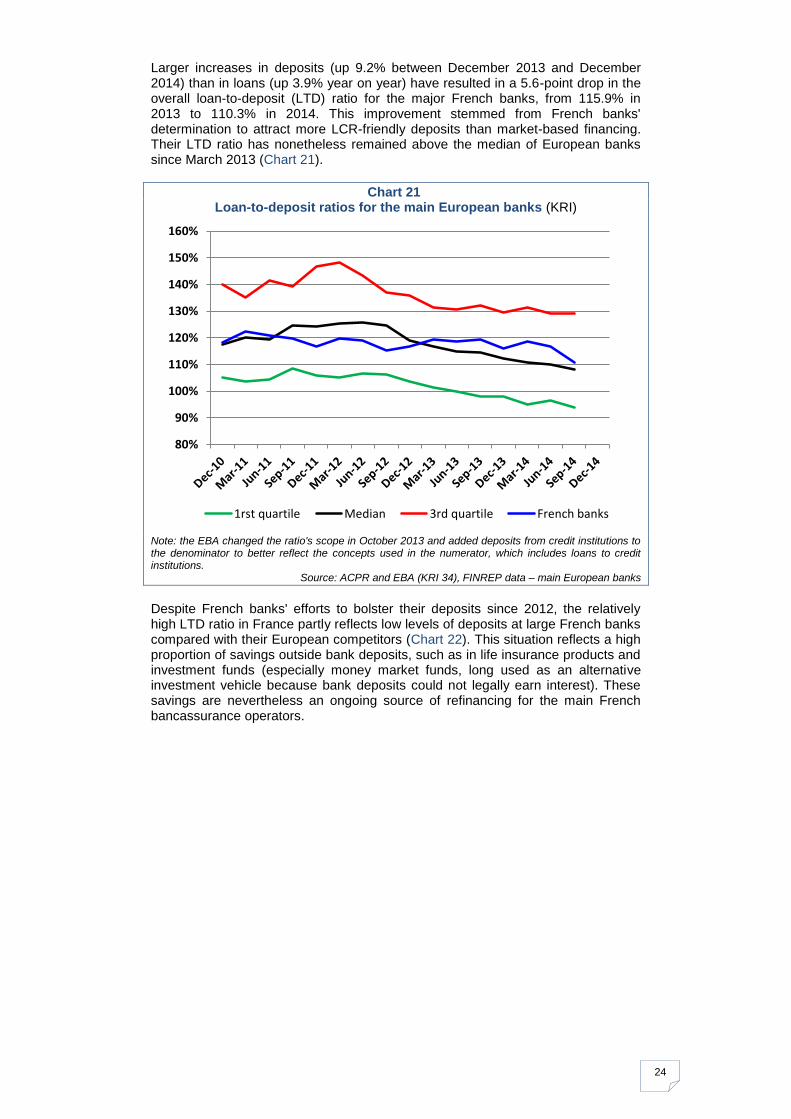
Larger increases in deposits (up 9.2% between December 2013 and December 2014) than in loans (up 3.9% year on year) have resulted in a 5.6-point drop in the overall loan-to-deposit (LTD) ratio for the major French banks, from 115.9% in 2013 to 110.3% in 2014. This improvement stemmed from French banks' determination to attract more LCR-friendly deposits than market-based financing. Their LTD ratio has nonetheless remained above the median of European banks since March 2013 (Chart 21).
Chart 21 Loan-to-deposit ratios for the main European banks (KRI)
Note: the EBA changed the ratio's scope in October 2013 and added deposits from credit institutions to the denominator to better reflect the concepts used in the numerator, which includes loans to credit institutions.
Source: ACPR and EBA (KRI 34), FINREP data – main European banks
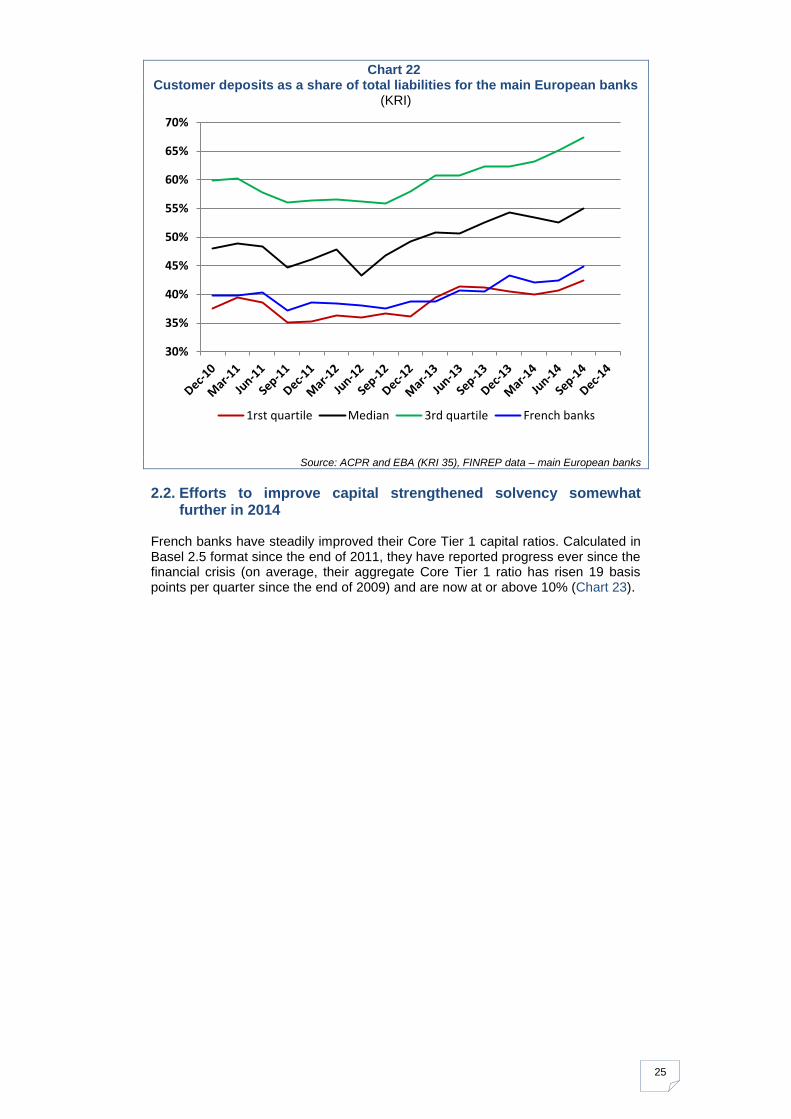
Despite French banks' efforts to bolster their deposits since 2012, the relatively high LTD ratio in France partly reflects low levels of deposits at large French banks compared with their European competitors (Chart 22). This situation reflects a high proportion of savings outside bank deposits, such as in life insurance products and investment funds (especially money market funds, long used as an alternative investment vehicle because bank deposits could not legally earn interest). These savings are nevertheless an ongoing source of refinancing for the main French bancassurance operators.
80%
90%
100%
110%
120%
130%
140%
150%
160%
1rst quartile Median 3rd quartile French banks
25
Chart 22 Customer deposits as a share of total liabilities for the main European banks
(KRI)
Source: ACPR and EBA (KRI 35), FINREP data – main European banks
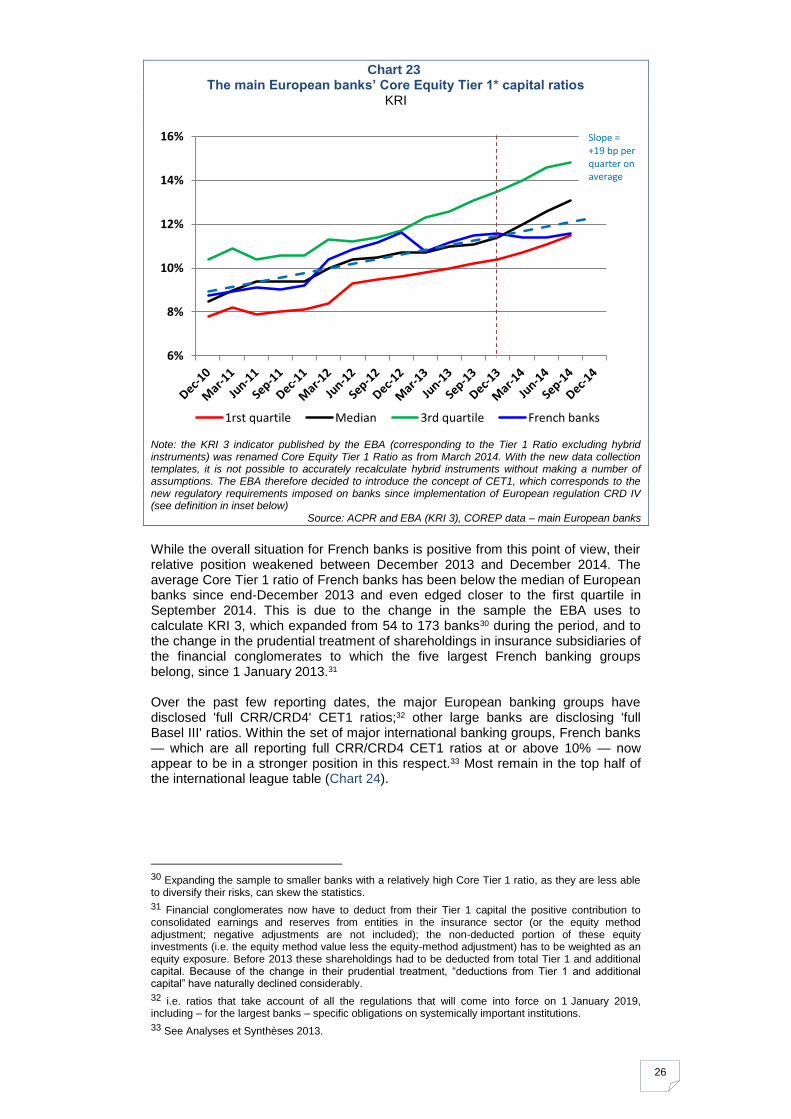
2.2. Efforts to improve capital strengthened solvency somewhat further in 2014
French banks have steadily improved their Core Tier 1 capital ratios. Calculated in Basel 2.5 format since the end of 2011, they have reported progress ever since the financial crisis (on average, their aggregate Core Tier 1 ratio has risen 19 basis points per quarter since the end of 2009) and are now at or above 10% (Chart 23).
30%
35%
40%
45%
50%
55%
60%
65%
70%
1rst quartile Median 3rd quartile French banks
26
Chart 23 The main European banks’ Core Equity Tier 1* capital ratios
KRI
Note: the KRI 3 indicator published by the EBA (corresponding to the Tier 1 Ratio excluding hybrid instruments) was renamed Core Equity Tier 1 Ratio as from March 2014. With the new data collection templates, it is not possible to accurately recalculate hybrid instruments without making a number of assumptions. The EBA therefore decided to introduce the concept of CET1, which corresponds to the new regulatory requirements imposed on banks since implementation of European regulation CRD IV (see definition in inset below)
Source: ACPR and EBA (KRI 3), COREP data – main European banks
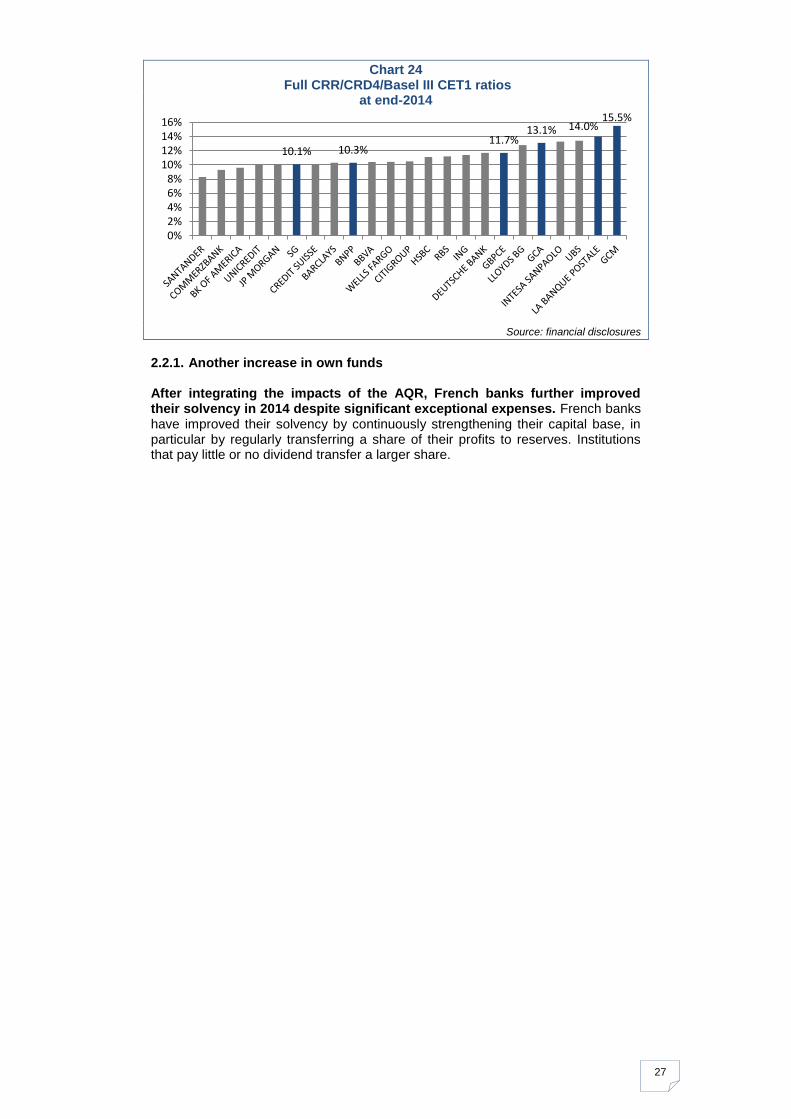
While the overall situation for French banks is positive from this point of view, their relative position weakened between December 2013 and December 2014. The average Core Tier 1 ratio of French banks has been below the median of European banks since end-December 2013 and even edged closer to the first quartile in September 2014. This is due to the change in the sample the EBA uses to calculate KRI 3, which expanded from 54 to 173 banks30 during the period, and to the change in the prudential treatment of shareholdings in insurance subsidiaries of the financial conglomerates to which the five largest French banking groups belong, since 1 January 2013.31 Over the past few reporting dates, the major European banking groups have disclosed 'full CRR/CRD4' CET1 ratios;32 other large banks are disclosing 'full Basel III' ratios. Within the set of major international banking groups, French banks — which are all reporting full CRR/CRD4 CET1 ratios at or above 10% — now appear to be in a stronger position in this respect.33 Most remain in the top half of the international league table (Chart 24).
30 Expanding the sample to smaller banks with a relatively high Core Tier 1 ratio, as they are less able to diversify their risks, can skew the statistics.
31 Financial conglomerates now have to deduct from their Tier 1 capital the positive contribution to consolidated earnings and reserves from entities in the insurance sector (or the equity method adjustment; negative adjustments are not included); the non-deducted portion of these equity investments (i.e. the equity method value less the equity-method adjustment) has to be weighted as an equity exposure. Before 2013 these shareholdings had to be deducted from total Tier 1 and additional capital. Because of the change in their prudential treatment, “deductions from Tier 1 and additional capital” have naturally declined considerably.
32 i.e. ratios that take account of all the regulations that will come into force on 1 January 2019, including – for the largest banks – specific obligations on systemically important institutions.
33 See Analyses et Synthèses 2013.
6%
8%
10%
12%
14%
16%
1rst quartile Median 3rd quartile French banks
Slope = +19 bp per quarter on average
27
Chart 24 Full CRR/CRD4/Basel III CET1 ratios
at end-2014
Source: financial disclosures
2.2.1. Another increase in own funds After integrating the impacts of the AQR, French banks further improved their solvency in 2014 despite significant exceptional expenses. French banks have improved their solvency by continuously strengthening their capital base, in particular by regularly transferring a share of their profits to reserves. Institutions that pay little or no dividend transfer a larger share.
10.1% 10.3% 11.7%
13.1% 14.0% 15.5%
0%2%4%6%8%
10%12%14%16%
28
At 31 December 2014, all full CRD4 Common Equity Tier 1 (CET1) ratios were above 10% (Table 6).
Table 6 Full CRD4 Basel III CET1 ratio without phase-in
BNPP SG GCA GBPCE GCM LBP
December 2013
10.3% 10.1% 11.3% (CASA 8.3%)
10.4% (Natixis 10.4%)
14.0% 11.2%
December 2014
10.3% 10.1% 13.1%
(CASA 10.4%)
11.7% (Natixis 11.4%)
15.5% 14.0%
Source: financial disclosures
Total CET1 capital for the six groups was EUR 253.8 billion, up 5% year on year, or an average CET1 ratio of 11.8% at end-2014 compared with 11% at 31 December 2013.
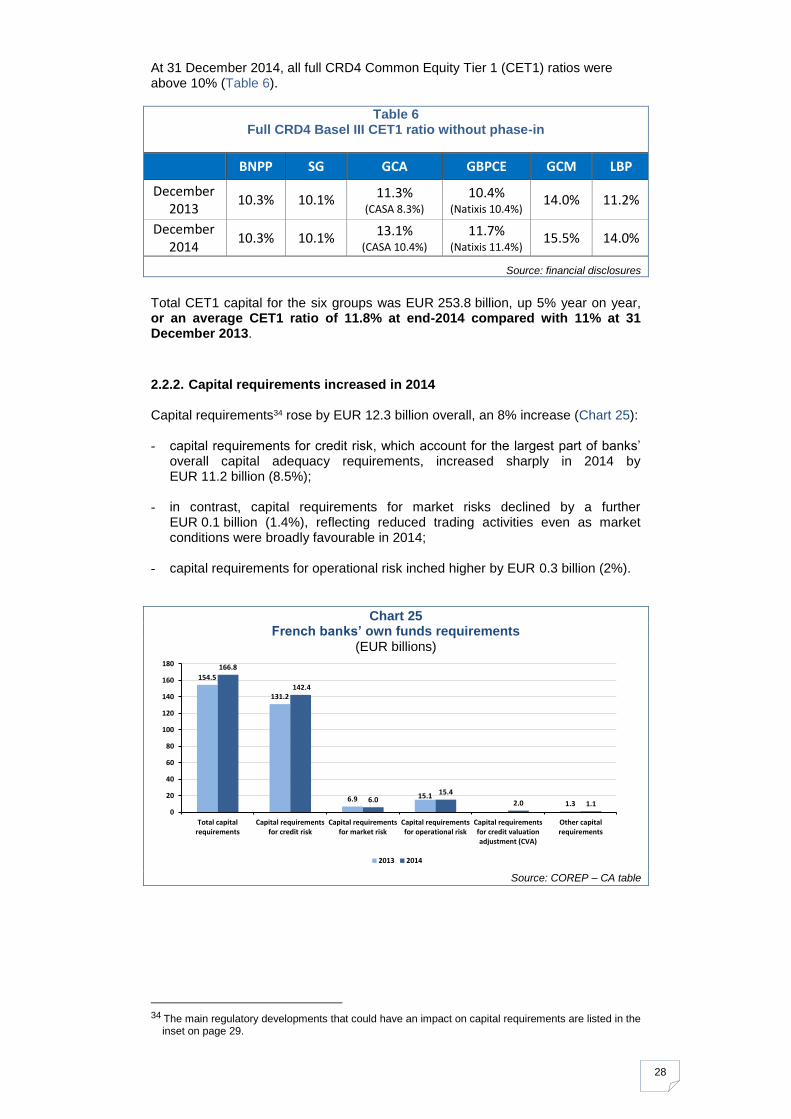
2.2.2. Capital requirements increased in 2014 Capital requirements34 rose by EUR 12.3 billion overall, an 8% increase (Chart 25): - capital requirements for credit risk, which account for the largest part of banks’
overall capital adequacy requirements, increased sharply in 2014 by EUR 11.2 billion (8.5%);
- in contrast, capital requirements for market risks declined by a further
EUR 0.1 billion (1.4%), reflecting reduced trading activities even as market conditions were broadly favourable in 2014;
- capital requirements for operational risk inched higher by EUR 0.3 billion (2%).
Chart 25 French banks’ own funds requirements
(EUR billions)
Source: COREP – CA table
34 The main regulatory developments that could have an impact on capital requirements are listed in the
inset on page 29.
154.5
131.2
6.9 15.11.3
166.8
142.4
6.015.4
2.0 1.10
20
40
60
80
100
120
140
160
180
Total capitalrequirements
Capital requirementsfor credit risk
Capital requirementsfor market risk
Capital requirementsfor operational risk
Capital requirementsfor credit valuationadjustment (CVA)
Other capitalrequirements
2013 2014
29
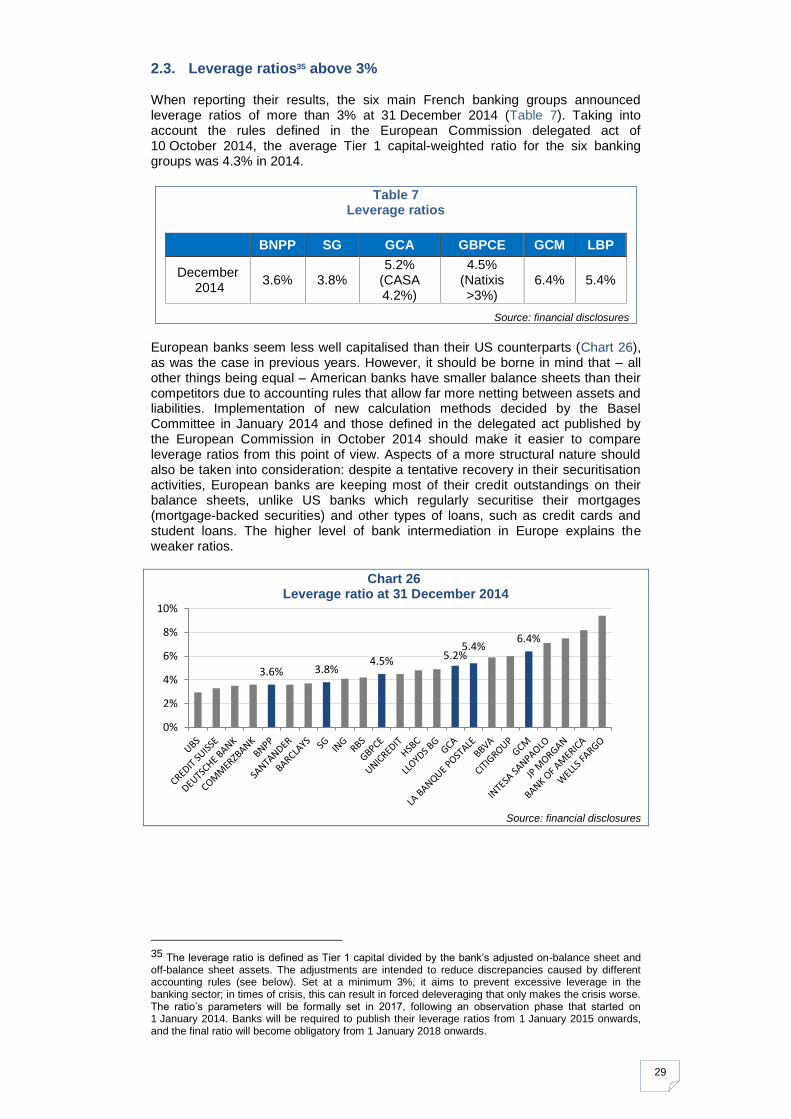
2.3. Leverage ratios35 above 3% When reporting their results, the six main French banking groups announced leverage ratios of more than 3% at 31 December 2014 (Table 7). Taking into account the rules defined in the European Commission delegated act of 10 October 2014, the average Tier 1 capital-weighted ratio for the six banking groups was 4.3% in 2014.
Table 7
Leverage ratios
BNPP SG GCA GBPCE GCM LBP
December 2014
3.6% 3.8% 5.2%
(CASA 4.2%)
4.5% (Natixis >3%)
6.4% 5.4%
Source: financial disclosures
European banks seem less well capitalised than their US counterparts (Chart 26), as was the case in previous years. However, it should be borne in mind that – all other things being equal – American banks have smaller balance sheets than their competitors due to accounting rules that allow far more netting between assets and liabilities. Implementation of new calculation methods decided by the Basel Committee in January 2014 and those defined in the delegated act published by the European Commission in October 2014 should make it easier to compare leverage ratios from this point of view. Aspects of a more structural nature should also be taken into consideration: despite a tentative recovery in their securitisation activities, European banks are keeping most of their credit outstandings on their balance sheets, unlike US banks which regularly securitise their mortgages (mortgage-backed securities) and other types of loans, such as credit cards and student loans. The higher level of bank intermediation in Europe explains the weaker ratios.
Chart 26 Leverage ratio at 31 December 2014
Source: financial disclosures
35 The leverage ratio is defined as Tier 1 capital divided by the bank’s adjusted on-balance sheet and off-balance sheet assets. The adjustments are intended to reduce discrepancies caused by different accounting rules (see below). Set at a minimum 3%, it aims to prevent excessive leverage in the banking sector; in times of crisis, this can result in forced deleveraging that only makes the crisis worse. The ratio’s parameters will be formally set in 2017, following an observation phase that started on 1 January 2014. Banks will be required to publish their leverage ratios from 1 January 2015 onwards, and the final ratio will become obligatory from 1 January 2018 onwards.
3.6% 3.8% 4.5% 5.2%
5.4% 6.4%
0%
2%
4%
6%
8%
10%
30
3. Risks36
A review of risks in 2014, based on an analysis of capital requirements, is characterised by significant changes in methodology. Banks provided their data
pursuant to European regulation CRR/CRD IV on prudential requirements,37
derived from the Basel III framework, which has applied to credit institutions since 1 January 2014. The changes to the reporting templates can make it difficult to compare information between 31 December 2013 and 31 December 2014.
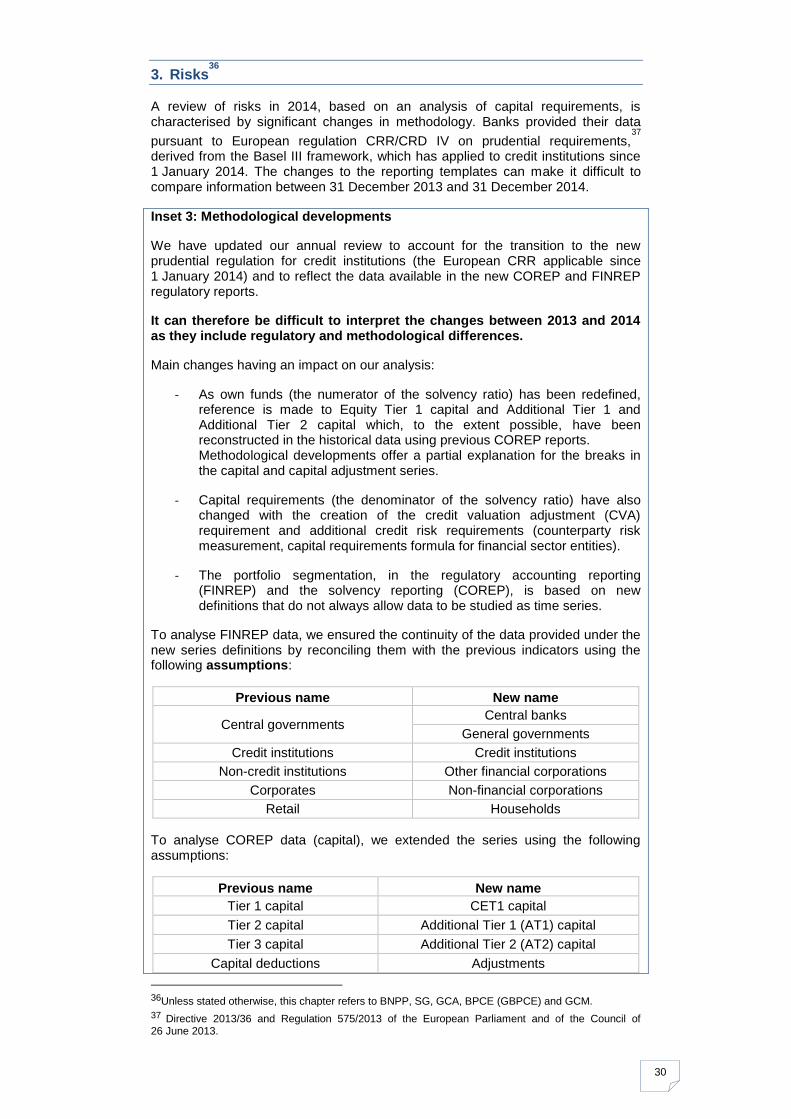
Inset 3: Methodological developments
We have updated our annual review to account for the transition to the new prudential regulation for credit institutions (the European CRR applicable since 1 January 2014) and to reflect the data available in the new COREP and FINREP regulatory reports.
It can therefore be difficult to interpret the changes between 2013 and 2014 as they include regulatory and methodological differences.
Main changes having an impact on our analysis:
- As own funds (the numerator of the solvency ratio) has been redefined, reference is made to Equity Tier 1 capital and Additional Tier 1 and Additional Tier 2 capital which, to the extent possible, have been reconstructed in the historical data using previous COREP reports. Methodological developments offer a partial explanation for the breaks in the capital and capital adjustment series.
- Capital requirements (the denominator of the solvency ratio) have also changed with the creation of the credit valuation adjustment (CVA) requirement and additional credit risk requirements (counterparty risk measurement, capital requirements formula for financial sector entities).
- The portfolio segmentation, in the regulatory accounting reporting (FINREP) and the solvency reporting (COREP), is based on new definitions that do not always allow data to be studied as time series.
To analyse FINREP data, we ensured the continuity of the data provided under the new series definitions by reconciling them with the previous indicators using the following assumptions:
Previous name New name
Central governments Central banks
General governments
Credit institutions Credit institutions
Non-credit institutions Other financial corporations
Corporates Non-financial corporations
Retail Households
To analyse COREP data (capital), we extended the series using the following assumptions:
Previous name New name
Tier 1 capital CET1 capital
Tier 2 capital Additional Tier 1 (AT1) capital
Tier 3 capital Additional Tier 2 (AT2) capital
Capital deductions Adjustments
36Unless stated otherwise, this chapter refers to BNPP, SG, GCA, BPCE (GBPCE) and GCM.
37
Directive 2013/36 and Regulation 575/2013 of the European Parliament and of the Council of 26 June 2013.
31
In light of the significant changes to the presentation of COREP data (credit risk), we have analysed the annual variations for aggregate data only and have created new groupings using the new portfolio segmentation (lists in Annex 2).
3.1. Capital requirements for credit risk up sharply A credit risk analysis concerns changes in capital requirements (a measurement used to account for the future risk of default) and the delinquencies identified, measured as past due loans. This risk is covered by loan provisioning.
3.1.1. Regulatory developments affected the credit risk structure at 31 December 2014
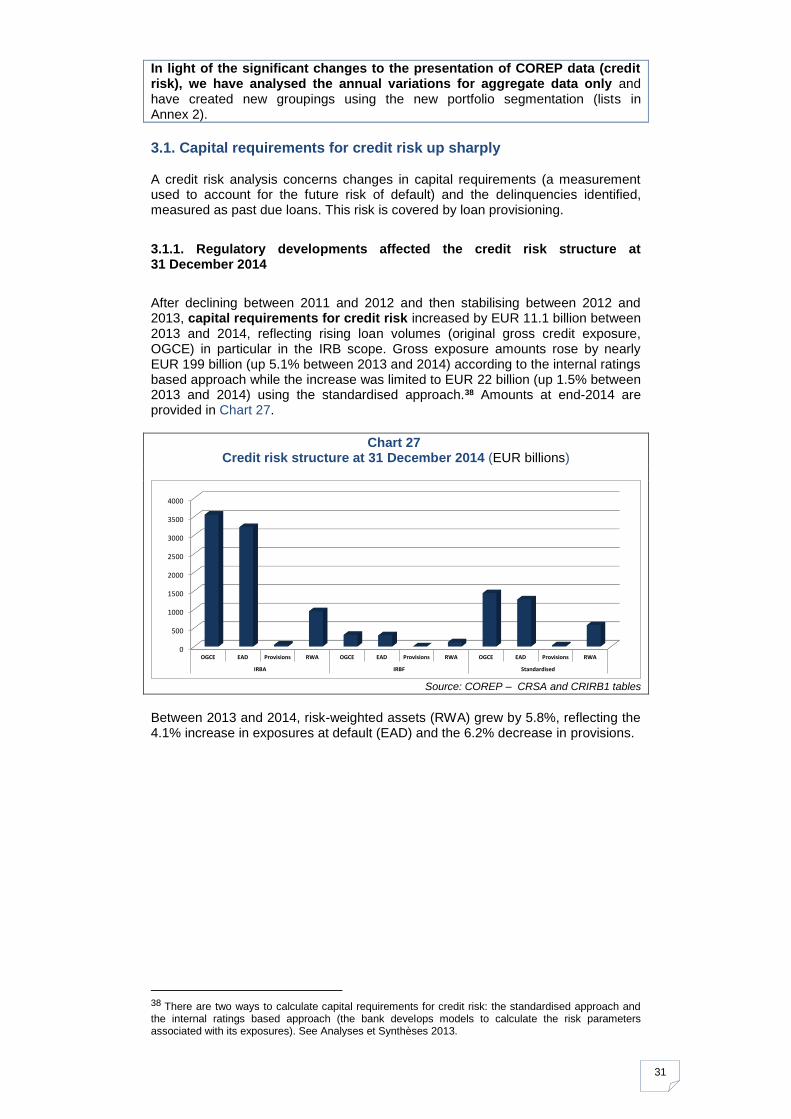
After declining between 2011 and 2012 and then stabilising between 2012 and 2013, capital requirements for credit risk increased by EUR 11.1 billion between 2013 and 2014, reflecting rising loan volumes (original gross credit exposure, OGCE) in particular in the IRB scope. Gross exposure amounts rose by nearly EUR 199 billion (up 5.1% between 2013 and 2014) according to the internal ratings based approach while the increase was limited to EUR 22 billion (up 1.5% between 2013 and 2014) using the standardised approach.38 Amounts at end-2014 are provided in Chart 27.
Chart 27 Credit risk structure at 31 December 2014 (EUR billions)
Source: COREP – CRSA and CRIRB1 tables
Between 2013 and 2014, risk-weighted assets (RWA) grew by 5.8%, reflecting the 4.1% increase in exposures at default (EAD) and the 6.2% decrease in provisions.
38 There are two ways to calculate capital requirements for credit risk: the standardised approach and the internal ratings based approach (the bank develops models to calculate the risk parameters associated with its exposures). See Analyses et Synthèses 2013.
0
500
1000
1500
2000
2500
3000
3500
4000
OGCE EAD Provisions RWA OGCE EAD Provisions RWA OGCE EAD Provisions RWA
IRBA IRBF Standardised
32
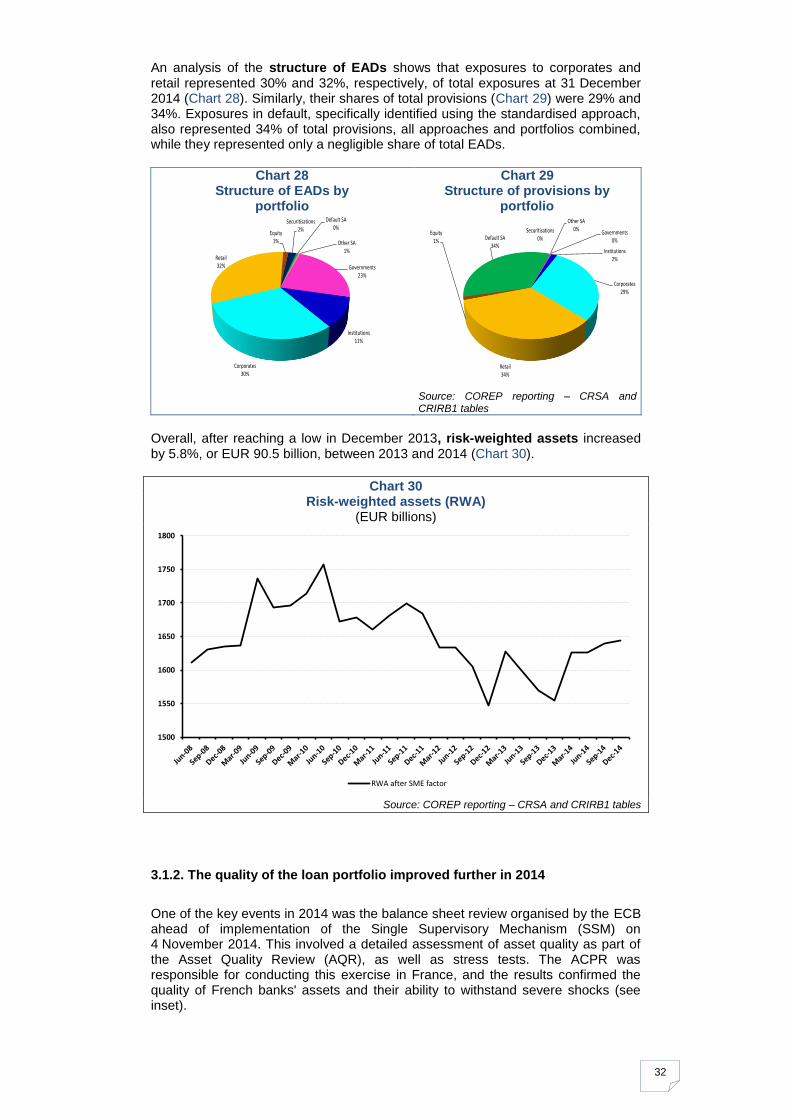
An analysis of the structure of EADs shows that exposures to corporates and retail represented 30% and 32%, respectively, of total exposures at 31 December 2014 (Chart 28). Similarly, their shares of total provisions (Chart 29) were 29% and 34%. Exposures in default, specifically identified using the standardised approach, also represented 34% of total provisions, all approaches and portfolios combined, while they represented only a negligible share of total EADs.
Chart 28 Structure of EADs by
portfolio
Chart 29 Structure of provisions by
portfolio
Source: COREP reporting – CRSA and CRIRB1 tables
Overall, after reaching a low in December 2013, risk-weighted assets increased by 5.8%, or EUR 90.5 billion, between 2013 and 2014 (Chart 30).
Chart 30 Risk-weighted assets (RWA)
(EUR billions)
Source: COREP reporting – CRSA and CRIRB1 tables
3.1.2. The quality of the loan portfolio improved further in 2014
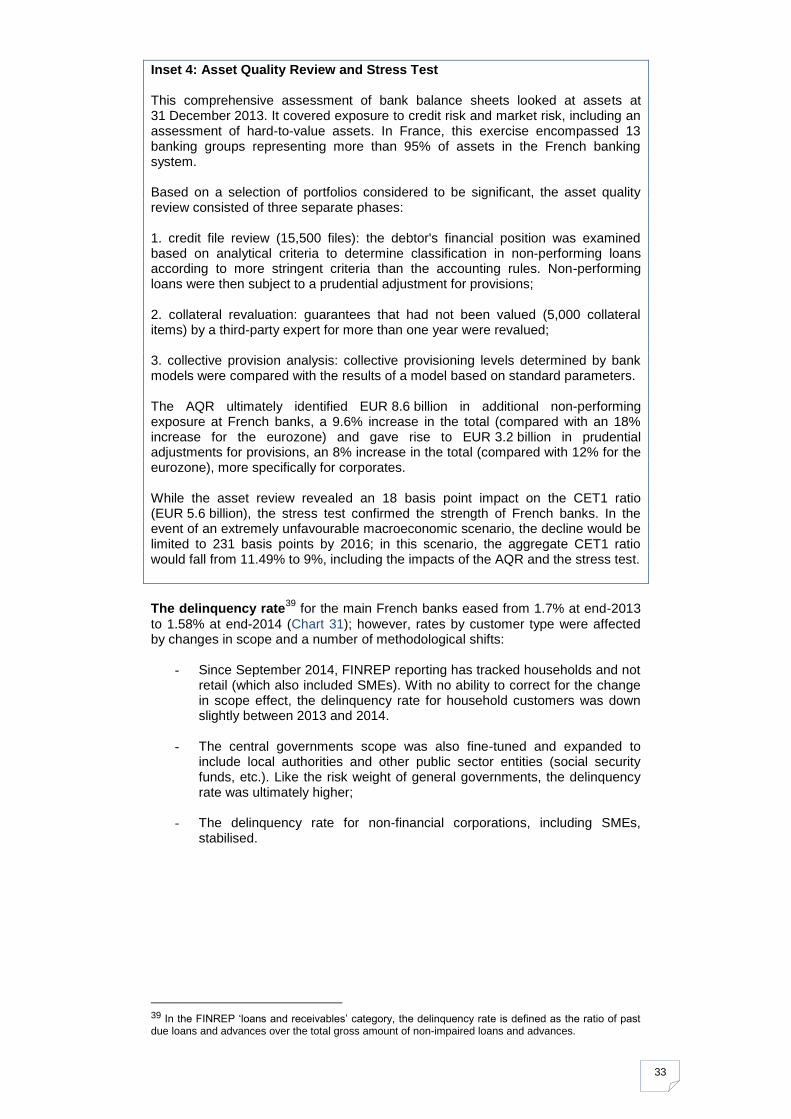
One of the key events in 2014 was the balance sheet review organised by the ECB ahead of implementation of the Single Supervisory Mechanism (SSM) on 4 November 2014. This involved a detailed assessment of asset quality as part of the Asset Quality Review (AQR), as well as stress tests. The ACPR was responsible for conducting this exercise in France, and the results confirmed the quality of French banks' assets and their ability to withstand severe shocks (see inset).
Governments23%
Institutions11%
Corporates30%
Retail32%
Equity1%
Securitisations2%
Default SA0%
Other SA1%
Governments0%
Institutions2%
Corporates29%
Retail34%
Equity1%
Securitisations0%Default SA
34%
Other SA0%
1500
1550
1600
1650
1700
1750
1800
RWA after SME factor
33
Inset 4: Asset Quality Review and Stress Test This comprehensive assessment of bank balance sheets looked at assets at 31 December 2013. It covered exposure to credit risk and market risk, including an assessment of hard-to-value assets. In France, this exercise encompassed 13 banking groups representing more than 95% of assets in the French banking system. Based on a selection of portfolios considered to be significant, the asset quality review consisted of three separate phases: 1. credit file review (15,500 files): the debtor's financial position was examined based on analytical criteria to determine classification in non-performing loans according to more stringent criteria than the accounting rules. Non-performing loans were then subject to a prudential adjustment for provisions; 2. collateral revaluation: guarantees that had not been valued (5,000 collateral items) by a third-party expert for more than one year were revalued; 3. collective provision analysis: collective provisioning levels determined by bank models were compared with the results of a model based on standard parameters. The AQR ultimately identified EUR 8.6 billion in additional non-performing exposure at French banks, a 9.6% increase in the total (compared with an 18% increase for the eurozone) and gave rise to EUR 3.2 billion in prudential adjustments for provisions, an 8% increase in the total (compared with 12% for the eurozone), more specifically for corporates. While the asset review revealed an 18 basis point impact on the CET1 ratio (EUR 5.6 billion), the stress test confirmed the strength of French banks. In the event of an extremely unfavourable macroeconomic scenario, the decline would be limited to 231 basis points by 2016; in this scenario, the aggregate CET1 ratio would fall from 11.49% to 9%, including the impacts of the AQR and the stress test.
The delinquency rate39
for the main French banks eased from 1.7% at end-2013
to 1.58% at end-2014 (Chart 31); however, rates by customer type were affected by changes in scope and a number of methodological shifts:
- Since September 2014, FINREP reporting has tracked households and not retail (which also included SMEs). With no ability to correct for the change in scope effect, the delinquency rate for household customers was down slightly between 2013 and 2014.
- The central governments scope was also fine-tuned and expanded to include local authorities and other public sector entities (social security funds, etc.). Like the risk weight of general governments, the delinquency rate was ultimately higher;
- The delinquency rate for non-financial corporations, including SMEs, stabilised.
39 In the FINREP ‘loans and receivables’ category, the delinquency rate is defined as the ratio of past due loans and advances over the total gross amount of non-impaired loans and advances.
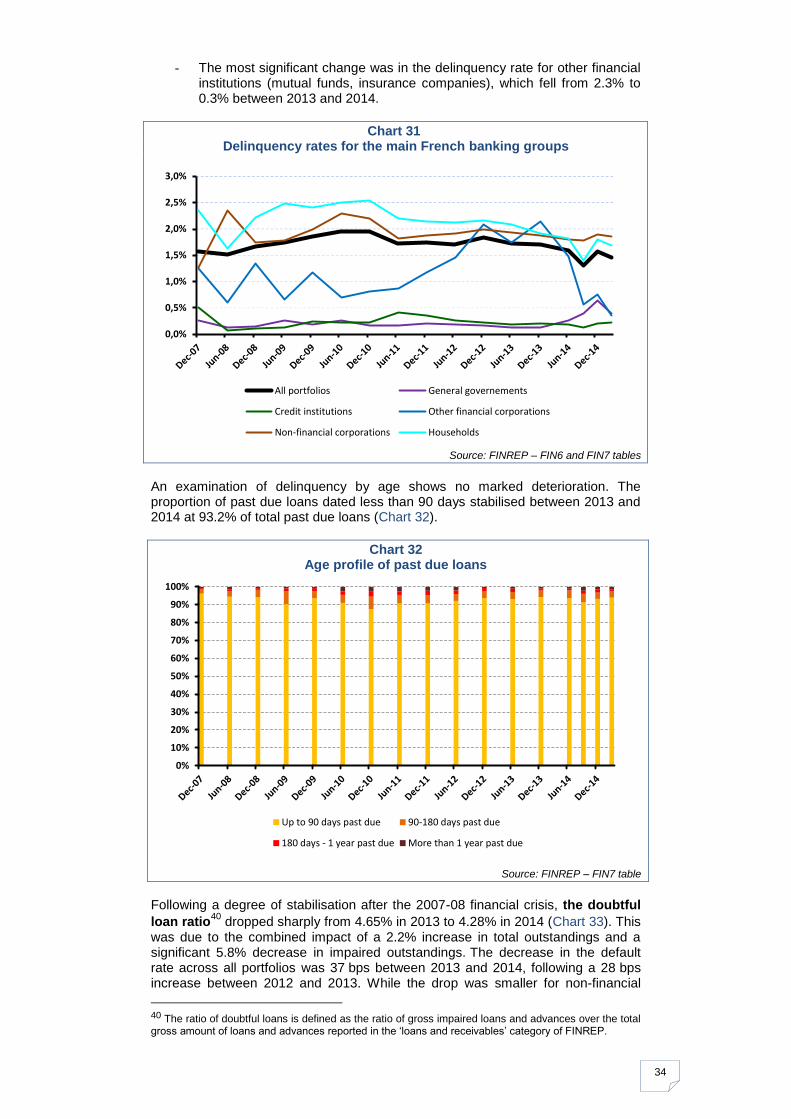
34
- The most significant change was in the delinquency rate for other financial institutions (mutual funds, insurance companies), which fell from 2.3% to 0.3% between 2013 and 2014.
Chart 31 Delinquency rates for the main French banking groups
Source: FINREP – FIN6 and FIN7 tables
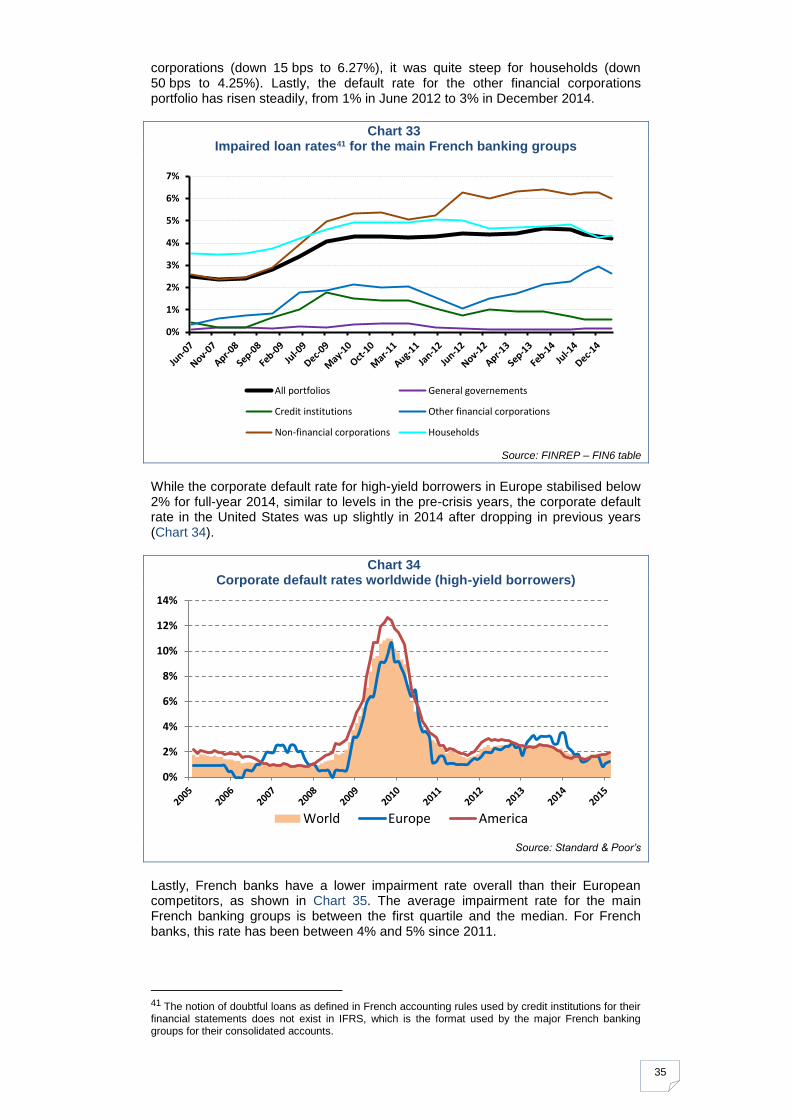
An examination of delinquency by age shows no marked deterioration. The proportion of past due loans dated less than 90 days stabilised between 2013 and 2014 at 93.2% of total past due loans (Chart 32).
Chart 32 Age profile of past due loans
Source: FINREP – FIN7 table
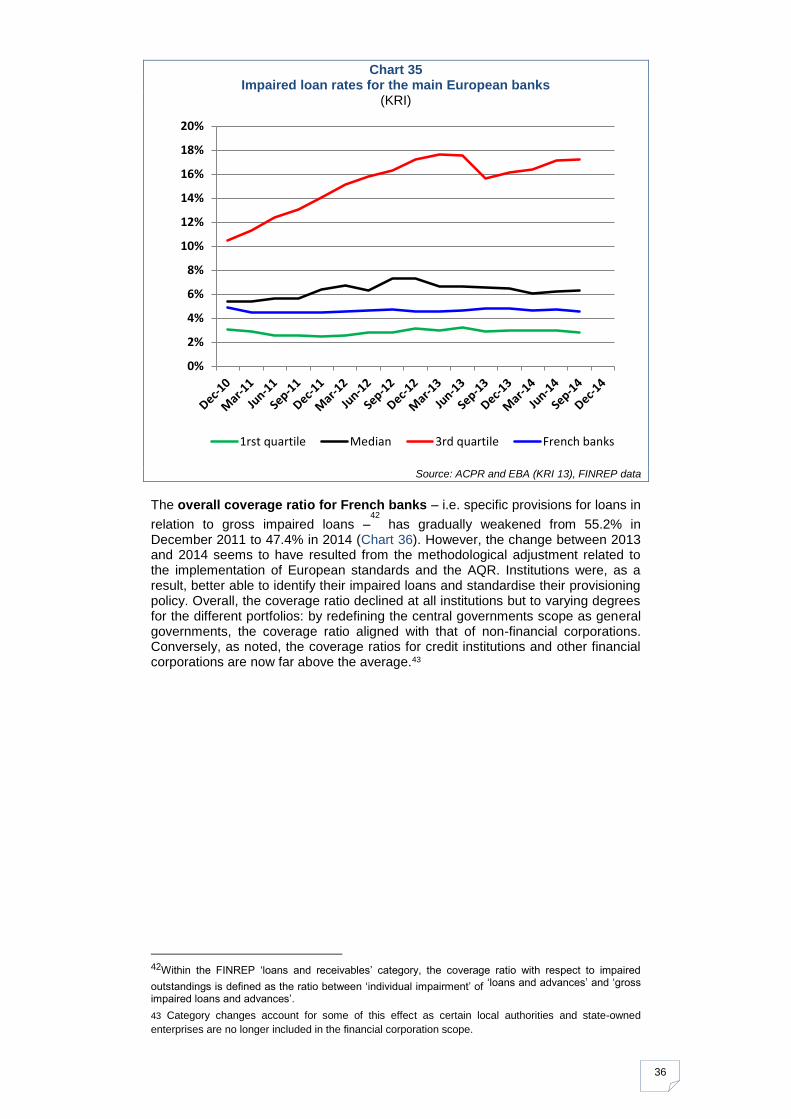
Following a degree of stabilisation after the 2007-08 financial crisis, the doubtful
loan ratio40
dropped sharply from 4.65% in 2013 to 4.28% in 2014 (Chart 33). This was due to the combined impact of a 2.2% increase in total outstandings and a significant 5.8% decrease in impaired outstandings. The decrease in the default rate across all portfolios was 37 bps between 2013 and 2014, following a 28 bps increase between 2012 and 2013. While the drop was smaller for non-financial
40 The ratio of doubtful loans is defined as the ratio of gross impaired loans and advances over the total gross amount of loans and advances reported in the ‘loans and receivables’ category of FINREP.
0,0%
0,5%
1,0%
1,5%
2,0%
2,5%
3,0%
All portfolios General governements
Credit institutions Other financial corporations
Non-financial corporations Households
0%
10%
20%
30%
40%
50%
60%
70%
80%
90%
100%
Up to 90 days past due 90-180 days past due
180 days - 1 year past due More than 1 year past due
35
corporations (down 15 bps to 6.27%), it was quite steep for households (down 50 bps to 4.25%). Lastly, the default rate for the other financial corporations portfolio has risen steadily, from 1% in June 2012 to 3% in December 2014.
Chart 33 Impaired loan rates41 for the main French banking groups
Source: FINREP – FIN6 table
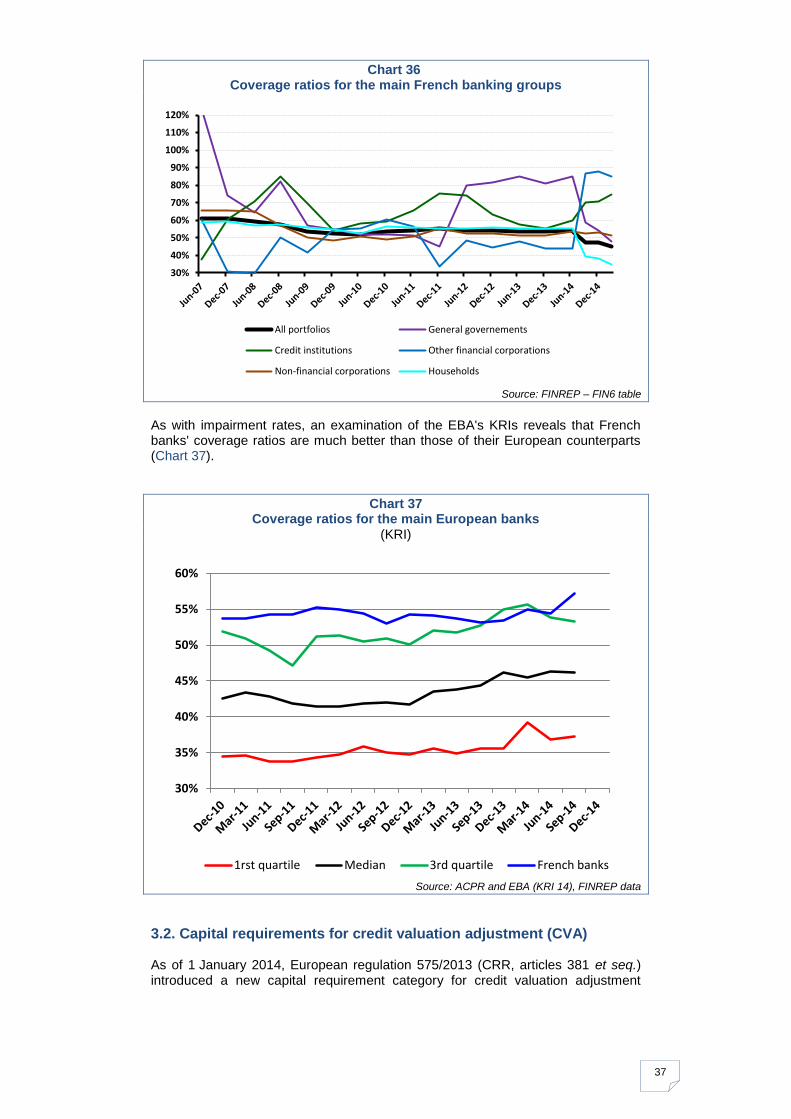
While the corporate default rate for high-yield borrowers in Europe stabilised below 2% for full-year 2014, similar to levels in the pre-crisis years, the corporate default rate in the United States was up slightly in 2014 after dropping in previous years (Chart 34).
Chart 34 Corporate default rates worldwide (high-yield borrowers)
Source: Standard & Poor’s
Lastly, French banks have a lower impairment rate overall than their European competitors, as shown in Chart 35. The average impairment rate for the main French banking groups is between the first quartile and the median. For French banks, this rate has been between 4% and 5% since 2011.
41 The notion of doubtful loans as defined in French accounting rules used by credit institutions for their financial statements does not exist in IFRS, which is the format used by the major French banking groups for their consolidated accounts.
0%
1%
2%
3%
4%
5%
6%
7%
All portfolios General governements
Credit institutions Other financial corporations
Non-financial corporations Households
0%
2%
4%
6%
8%
10%
12%
14%
World Europe America
36
Chart 35 Impaired loan rates for the main European banks
(KRI)
Source: ACPR and EBA (KRI 13), FINREP data
The overall coverage ratio for French banks – i.e. specific provisions for loans in
relation to gross impaired loans –42
has gradually weakened from 55.2% in December 2011 to 47.4% in 2014 (Chart 36). However, the change between 2013 and 2014 seems to have resulted from the methodological adjustment related to the implementation of European standards and the AQR. Institutions were, as a result, better able to identify their impaired loans and standardise their provisioning policy. Overall, the coverage ratio declined at all institutions but to varying degrees for the different portfolios: by redefining the central governments scope as general governments, the coverage ratio aligned with that of non-financial corporations. Conversely, as noted, the coverage ratios for credit institutions and other financial corporations are now far above the average.43
42Within the FINREP ‘loans and receivables’ category, the coverage ratio with respect to impaired
outstandings is defined as the ratio between ‘individual impairment’ of ‘loans and advances’ and ‘gross
impaired loans and advances’.
43 Category changes account for some of this effect as certain local authorities and state-owned
enterprises are no longer included in the financial corporation scope.
0%
2%
4%
6%
8%
10%
12%
14%
16%
18%
20%
1rst quartile Median 3rd quartile French banks
37
Chart 36 Coverage ratios for the main French banking groups
Source: FINREP – FIN6 table
As with impairment rates, an examination of the EBA's KRIs reveals that French banks' coverage ratios are much better than those of their European counterparts (Chart 37).
Chart 37 Coverage ratios for the main European banks
(KRI)
Source: ACPR and EBA (KRI 14), FINREP data
3.2. Capital requirements for credit valuation adjustment (CVA) As of 1 January 2014, European regulation 575/2013 (CRR, articles 381 et seq.) introduced a new capital requirement category for credit valuation adjustment
30%
40%
50%
60%
70%
80%
90%
100%
110%
120%
All portfolios General governements
Credit institutions Other financial corporations
Non-financial corporations Households
30%
35%
40%
45%
50%
55%
60%
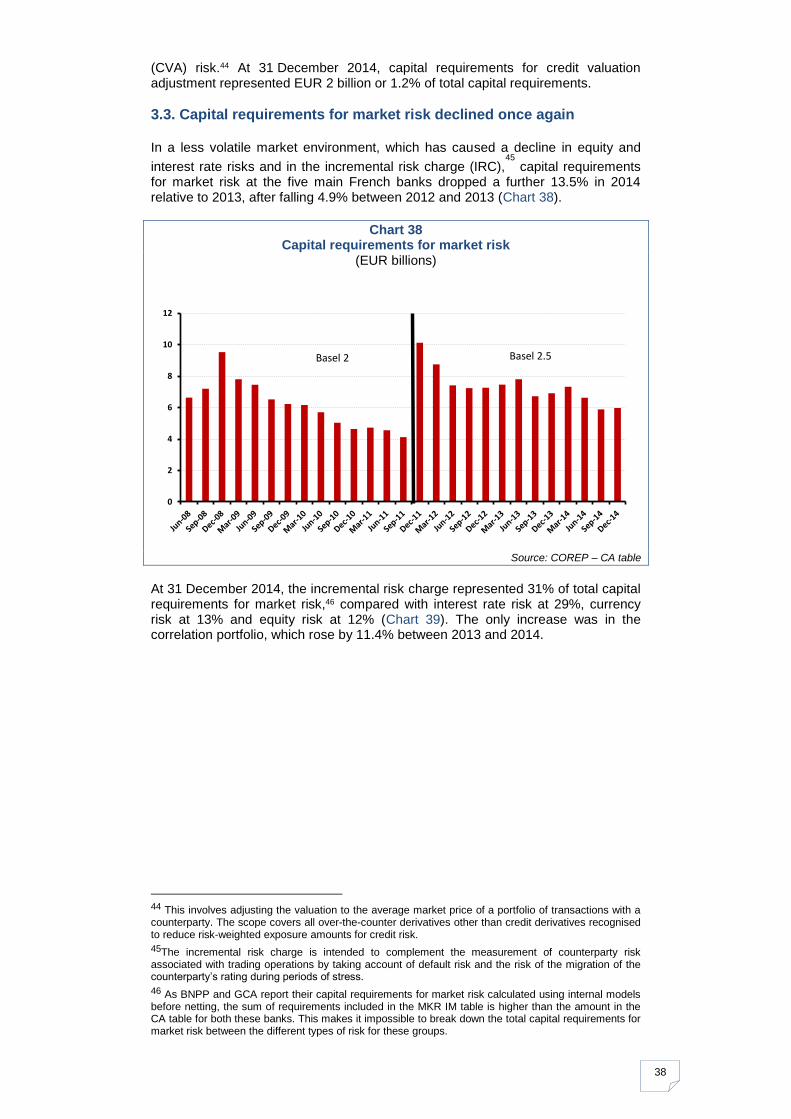
1rst quartile Median 3rd quartile French banks
38
(CVA) risk.44 At 31 December 2014, capital requirements for credit valuation adjustment represented EUR 2 billion or 1.2% of total capital requirements.
3.3. Capital requirements for market risk declined once again In a less volatile market environment, which has caused a decline in equity and
interest rate risks and in the incremental risk charge (IRC),45
capital requirements for market risk at the five main French banks dropped a further 13.5% in 2014 relative to 2013, after falling 4.9% between 2012 and 2013 (Chart 38).
Chart 38 Capital requirements for market risk
(EUR billions)
Source: COREP – CA table
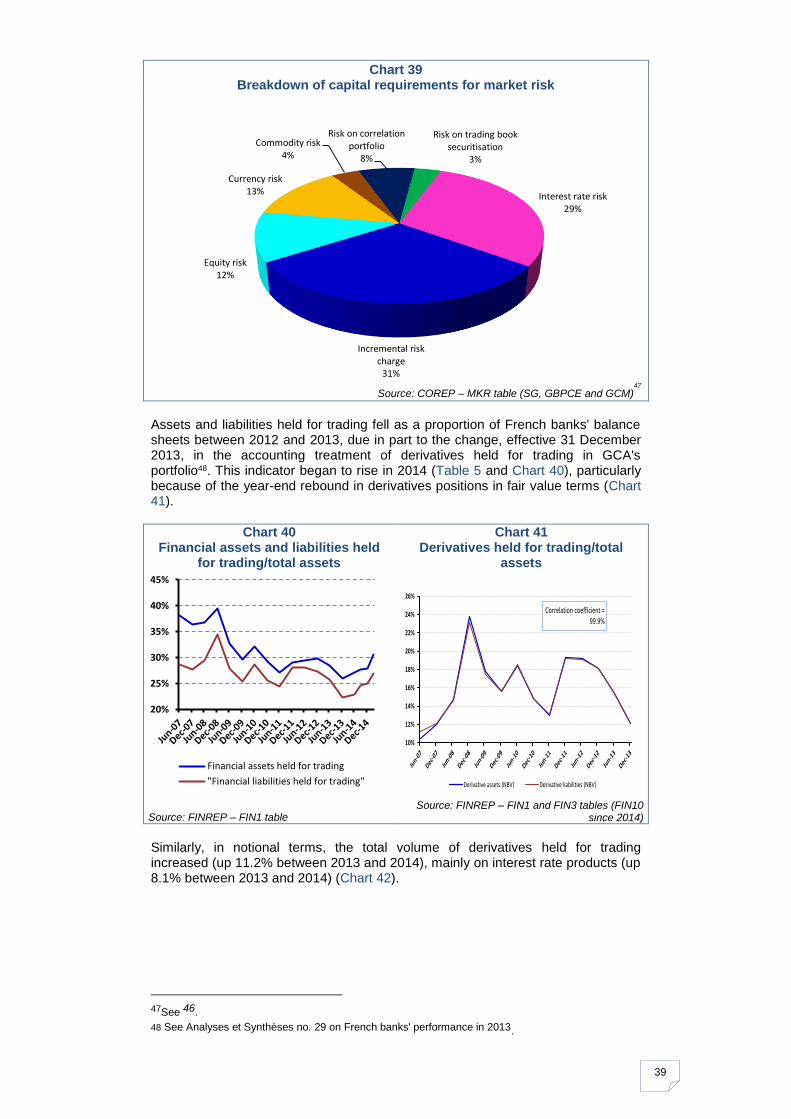
At 31 December 2014, the incremental risk charge represented 31% of total capital requirements for market risk,46 compared with interest rate risk at 29%, currency risk at 13% and equity risk at 12% (Chart 39). The only increase was in the correlation portfolio, which rose by 11.4% between 2013 and 2014.
44 This involves adjusting the valuation to the average market price of a portfolio of transactions with a counterparty. The scope covers all over-the-counter derivatives other than credit derivatives recognised to reduce risk-weighted exposure amounts for credit risk.
45The incremental risk charge is intended to complement the measurement of counterparty risk associated with trading operations by taking account of default risk and the risk of the migration of the counterparty’s rating during periods of stress.
46 As BNPP and GCA report their capital requirements for market risk calculated using internal models before netting, the sum of requirements included in the MKR IM table is higher than the amount in the CA table for both these banks. This makes it impossible to break down the total capital requirements for market risk between the different types of risk for these groups.
0
2
4
6
8
10
12
Basel 2.5Basel 2
39
Chart 39 Breakdown of capital requirements for market risk
Source: COREP – MKR table (SG, GBPCE and GCM)
47
Assets and liabilities held for trading fell as a proportion of French banks' balance sheets between 2012 and 2013, due in part to the change, effective 31 December 2013, in the accounting treatment of derivatives held for trading in GCA's portfolio48. This indicator began to rise in 2014 (Table 5 and Chart 40), particularly because of the year-end rebound in derivatives positions in fair value terms (Chart 41).
Chart 40 Financial assets and liabilities held
for trading/total assets
Source: FINREP – FIN1 table
Chart 41 Derivatives held for trading/total
assets
Source: FINREP – FIN1 and FIN3 tables (FIN10
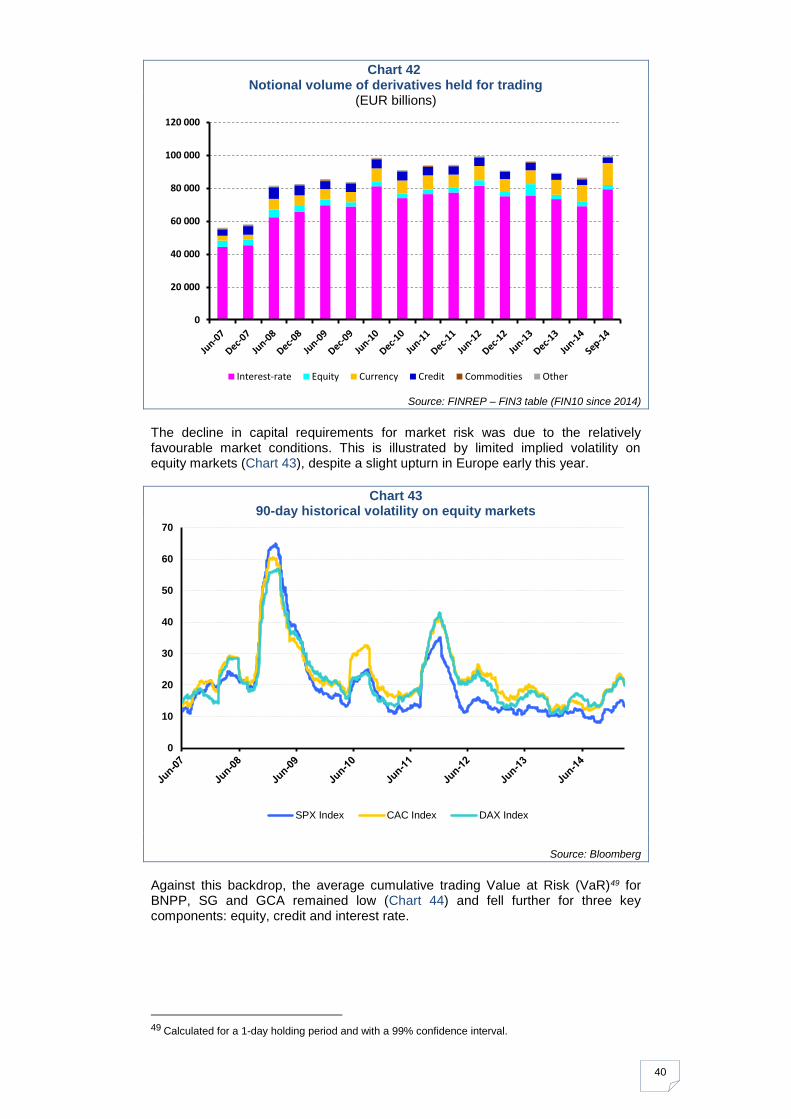
since 2014) Similarly, in notional terms, the total volume of derivatives held for trading increased (up 11.2% between 2013 and 2014), mainly on interest rate products (up 8.1% between 2013 and 2014) (Chart 42).
47See 46.
48 See Analyses et Synthèses no. 29 on French banks' performance in 2013.
Interest rate risk29%
Incremental risk charge
31%
Equity risk12%
Currency risk13%
Commodity risk4%
Risk on correlation portfolio
8%
Risk on trading book securitisation
3%
20%
25%
30%
35%
40%
45%
Financial assets held for trading
"Financial liabilities held for trading"
10%
12%
14%
16%
18%
20%
22%
24%
26%
Derivative assets (NBV) Derivative liabilities (NBV)
Correlation coefficient = 99.9%
40
Chart 42 Notional volume of derivatives held for trading
(EUR billions)
Source: FINREP – FIN3 table (FIN10 since 2014)
The decline in capital requirements for market risk was due to the relatively favourable market conditions. This is illustrated by limited implied volatility on equity markets (Chart 43), despite a slight upturn in Europe early this year.
Chart 43 90-day historical volatility on equity markets
Source: Bloomberg
Against this backdrop, the average cumulative trading Value at Risk (VaR)49 for BNPP, SG and GCA remained low (Chart 44) and fell further for three key components: equity, credit and interest rate.
49 Calculated for a 1-day holding period and with a 99% confidence interval.
0
20 000
40 000
60 000
80 000
100 000
120 000
Interest-rate Equity Currency Credit Commodities Other
0
10
20
30
40
50
60
70
SPX Index CAC Index DAX Index

41
Chart 44 Average quarterly cumulative VaR for BNPP, SG and GCA
(EUR millions)
Source: financial disclosures
Helpful market conditions enabled French bank groups to dispose of almost all the toxic or sensitive assets inherited from the subprime crisis (Table 8).
Table 8 French banks’ net exposures to toxic and sensitive assets
(EUR billions)
Source: financial disclosures (BNPP, SG, GCA, GBPCE)
-100
-50
0
50
100
150
200
Credit Interest rate
Equity Currency and other
Commodity Netting
Average quaterly VaR
2009 2010 2011 2012 2013 2014
TOXIC ASSETS
Monolines 3.0 1.8 2.5 1.3 0.4 0.4
CDPCs 1.2 1.2 1.8 0.3 0.0 0.0
Subprime CDOs 6.3 8.0 5.4 2.3 0.3 0.1
US ABS : 0.0 0.0 0.0 0.0 0.0 0.0
RMBS 7.4 5.3 4.0 1.8 0.1 0.1
CMBS 6.8 6.7 1.8 1.2 0.6 0.4
Total net exposure to toxic assets 24.7 23.0 15.4 6.9 1.4 1.0
SENSITIVE EXPOSURES
Other ABS/CDOs :
UK RMBS 3.7 3.1 2.5 1.8 1.3 1.3
Spanish RMBS 2.7 2.4 2.5 1.6 1.0 1.2
Non-US CMBS 4.8 4.4 3.0 2.1 1.0 0.6
Other CDOs and ABS 37.7 32.8 25.7 20.8 4.7 3.6
Total sensitive exposure (excluding LBOs) 48.9 42.7 33.7 26.4 8.0 6.7
42
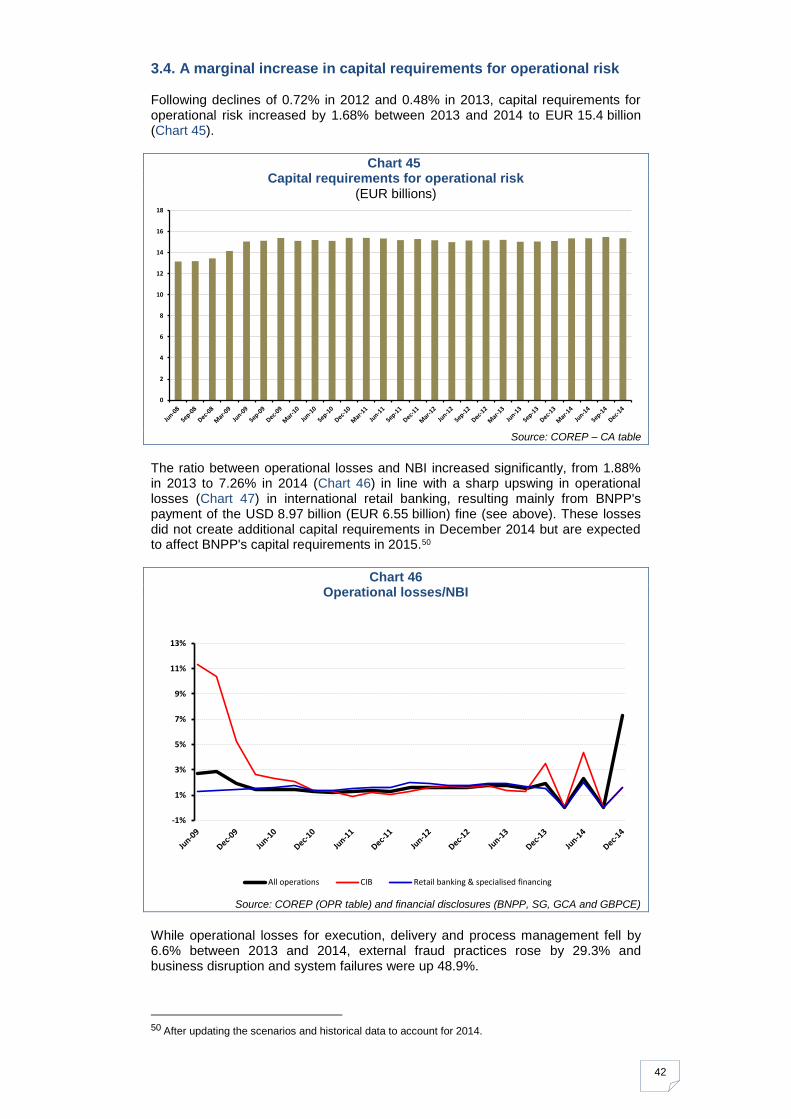
3.4. A marginal increase in capital requirements for operational risk Following declines of 0.72% in 2012 and 0.48% in 2013, capital requirements for operational risk increased by 1.68% between 2013 and 2014 to EUR 15.4 billion (Chart 45).
Chart 45 Capital requirements for operational risk
(EUR billions)
Source: COREP – CA table
The ratio between operational losses and NBI increased significantly, from 1.88% in 2013 to 7.26% in 2014 (Chart 46) in line with a sharp upswing in operational losses (Chart 47) in international retail banking, resulting mainly from BNPP's payment of the USD 8.97 billion (EUR 6.55 billion) fine (see above). These losses did not create additional capital requirements in December 2014 but are expected to affect BNPP's capital requirements in 2015.50
Chart 46 Operational losses/NBI
Source: COREP (OPR table) and financial disclosures (BNPP, SG, GCA and GBPCE)
While operational losses for execution, delivery and process management fell by 6.6% between 2013 and 2014, external fraud practices rose by 29.3% and business disruption and system failures were up 48.9%.
50 After updating the scenarios and historical data to account for 2014.
0
2
4
6
8
10
12
14
16
18
-1%
1%
3%
5%
7%
9%
11%
13%
All operations CIB Retail banking & specialised financing
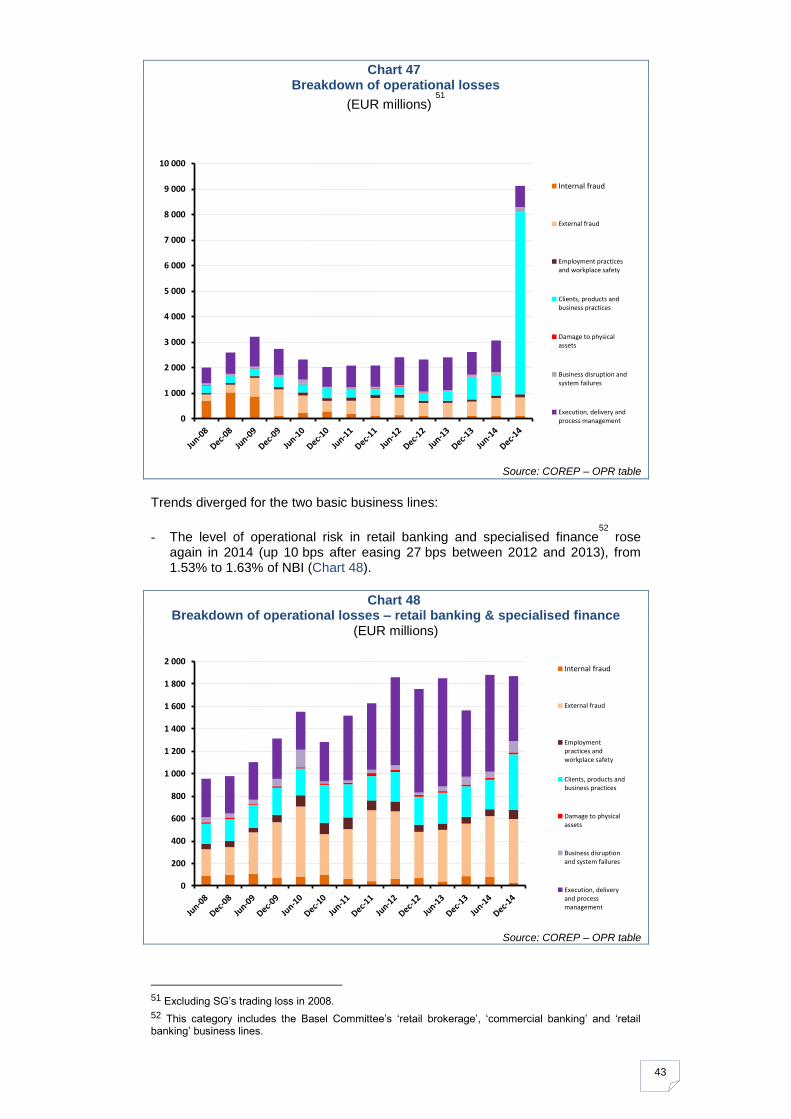
43
Chart 47 Breakdown of operational losses
(EUR millions) 51
Source: COREP – OPR table
Trends diverged for the two basic business lines:
- The level of operational risk in retail banking and specialised finance52
rose again in 2014 (up 10 bps after easing 27 bps between 2012 and 2013), from 1.53% to 1.63% of NBI (Chart 48).
Chart 48 Breakdown of operational losses – retail banking & specialised finance
(EUR millions)
Source: COREP – OPR table
51 Excluding SG’s trading loss in 2008.
52 This category includes the Basel Committee’s ‘retail brokerage’, ‘commercial banking’ and ‘retail banking’ business lines.
0
1 000
2 000
3 000
4 000
5 000
6 000
7 000
8 000
9 000
10 000
Internal fraud
External fraud
Employment practicesand workplace safety
Clients, products andbusiness practices
Damage to physicalassets
Business disruption andsystem failures
Execution, delivery andprocess management
0
200
400
600
800
1 000
1 200
1 400
1 600
1 800
2 000Internal fraud
External fraud
Employmentpractices andworkplace safety
Clients, products andbusiness practices
Damage to physicalassets
Business disruptionand system failures
Execution, deliveryand processmanagement
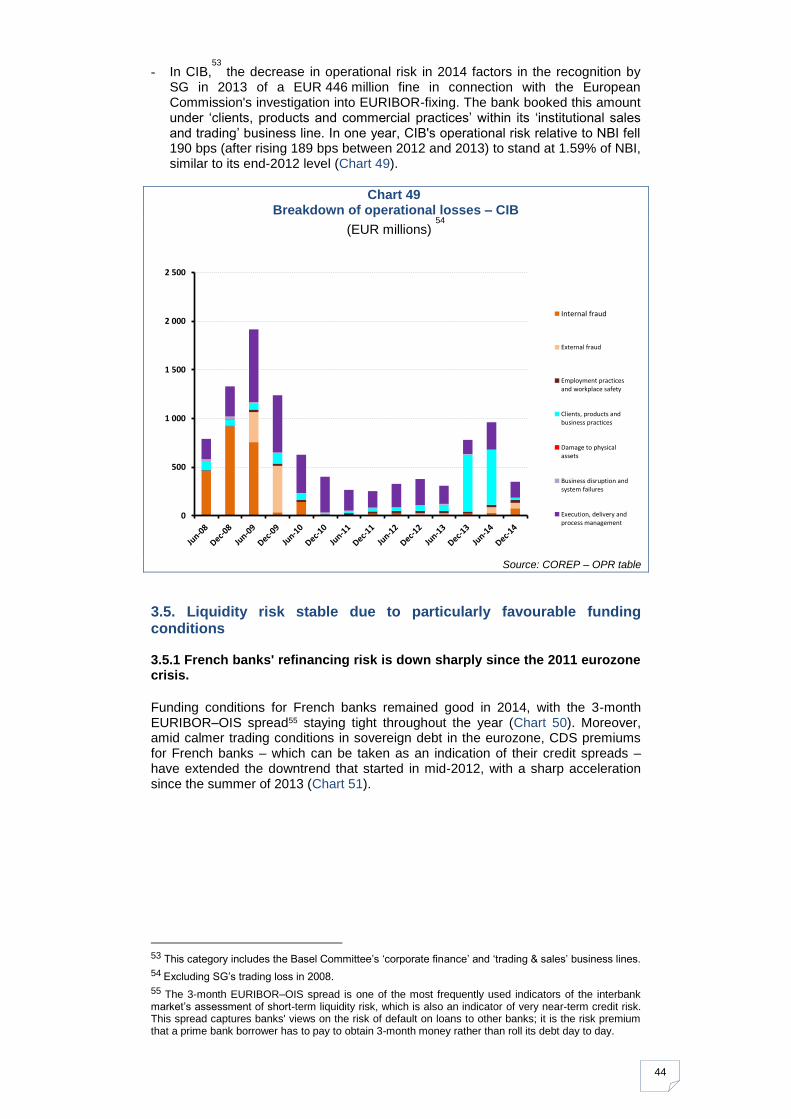
44
- In CIB,53
the decrease in operational risk in 2014 factors in the recognition by SG in 2013 of a EUR 446 million fine in connection with the European Commission's investigation into EURIBOR-fixing. The bank booked this amount under ‘clients, products and commercial practices’ within its ‘institutional sales and trading’ business line. In one year, CIB's operational risk relative to NBI fell 190 bps (after rising 189 bps between 2012 and 2013) to stand at 1.59% of NBI, similar to its end-2012 level (Chart 49).
Chart 49 Breakdown of operational losses – CIB
(EUR millions) 54
Source: COREP – OPR table
3.5. Liquidity risk stable due to particularly favourable funding conditions
3.5.1 French banks' refinancing risk is down sharply since the 2011 eurozone crisis.
Funding conditions for French banks remained good in 2014, with the 3-month EURIBOR–OIS spread55 staying tight throughout the year (Chart 50). Moreover, amid calmer trading conditions in sovereign debt in the eurozone, CDS premiums for French banks – which can be taken as an indication of their credit spreads – have extended the downtrend that started in mid-2012, with a sharp acceleration since the summer of 2013 (Chart 51).
53 This category includes the Basel Committee’s ‘corporate finance’ and ‘trading & sales’ business lines.
54 Excluding SG’s trading loss in 2008.
55 The 3-month EURIBOR–OIS spread is one of the most frequently used indicators of the interbank market’s assessment of short-term liquidity risk, which is also an indicator of very near-term credit risk. This spread captures banks' views on the risk of default on loans to other banks; it is the risk premium that a prime bank borrower has to pay to obtain 3-month money rather than roll its debt day to day.
0
500
1 000
1 500
2 000
2 500
Internal fraud
External fraud
Employment practicesand workplace safety
Clients, products andbusiness practices
Damage to physicalassets
Business disruption andsystem failures
Execution, delivery andprocess management

45
Chart 50 3-month EURIBOR–OIS spread on
the European interbank market
Chart 51 French bank CDS premiums – 5
years, senior debt
Source: Bloomberg, in bps
In a context of changing regulations on US money market funds,56 these funds' exposure to French banks was stable in 2014 with two peaks in July and October followed by a slight drop in the last two months of the year. Conversely, US money market funds' exposure to the United States rose significantly57 in the last month of the year.
Chart 52 Monthly change in US money market funds' exposure to French banks
(as a percentage of US money market funds' total assets)
Source: Fitch Ratings
NB: From “US Money Market Funds Quarterly 4Q14”
56 The main changes in US money market fund regulations are the strengthening of diversification rules to a maximum exposure of 5% per group, stress testing and tougher transparency rules.
57 This increase is particularly evident in US money market funds' exposure to the Federal Reserve Bank of New York, which increased from 3.8% of their total assets to 9% between end-November and end-December 2014.
0 bps
20 bps
40 bps
60 bps
80 bps
100 bps
120 bps
140 bps
160 bps
180 bps
200 bps
0
50
100
150
200
250
Dec
-12
Feb
-13
Ap
r-1
3
Jun
-13
Au
g-1
3
Oct
-13
Dec
-13
Feb
-14
Ap
r-1
4
Jun
-14
Au
g-1
4
Oct
-14
Dec
-14
BNPP SG
CASA Int'l banks average
0
1
2
3
4
5
6
GCA BNP BPCE Other
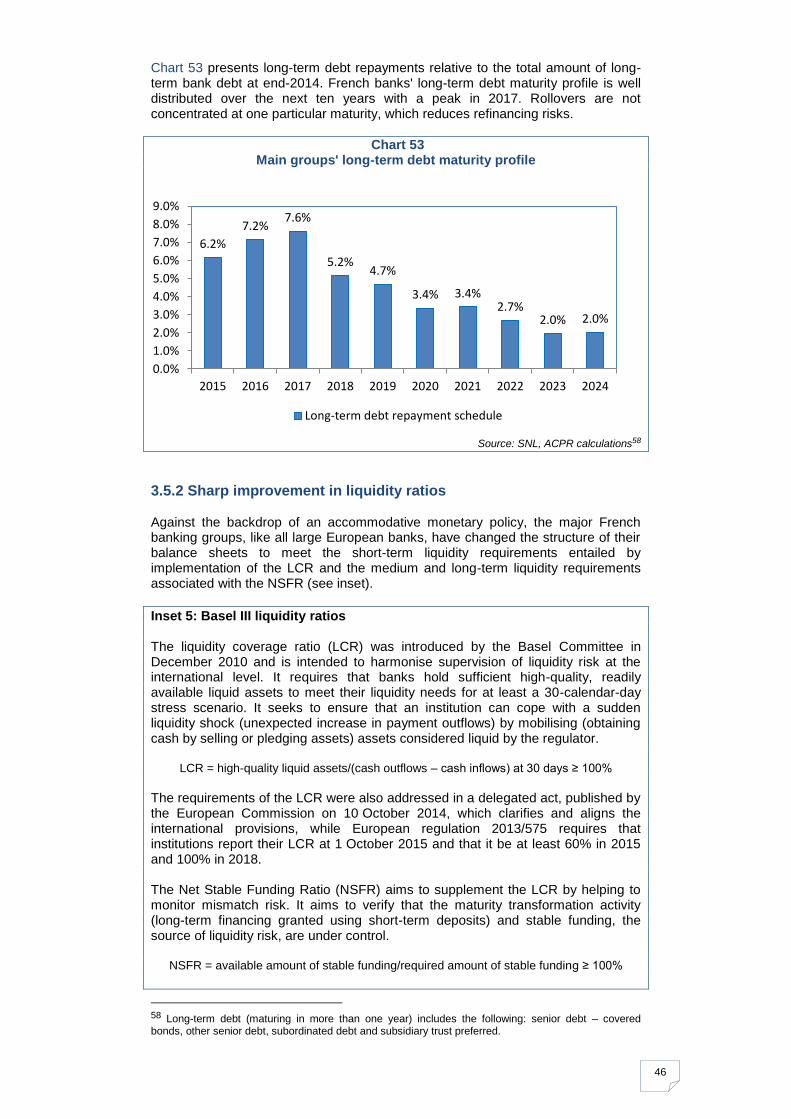
46
Chart 53 presents long-term debt repayments relative to the total amount of long-term bank debt at end-2014. French banks' long-term debt maturity profile is well distributed over the next ten years with a peak in 2017. Rollovers are not concentrated at one particular maturity, which reduces refinancing risks.
Chart 53 Main groups' long-term debt maturity profile
Source: SNL, ACPR calculations58
3.5.2 Sharp improvement in liquidity ratios Against the backdrop of an accommodative monetary policy, the major French banking groups, like all large European banks, have changed the structure of their balance sheets to meet the short-term liquidity requirements entailed by implementation of the LCR and the medium and long-term liquidity requirements associated with the NSFR (see inset).
Inset 5: Basel III liquidity ratios The liquidity coverage ratio (LCR) was introduced by the Basel Committee in December 2010 and is intended to harmonise supervision of liquidity risk at the international level. It requires that banks hold sufficient high-quality, readily available liquid assets to meet their liquidity needs for at least a 30-calendar-day stress scenario. It seeks to ensure that an institution can cope with a sudden liquidity shock (unexpected increase in payment outflows) by mobilising (obtaining cash by selling or pledging assets) assets considered liquid by the regulator.
LCR = high-quality liquid assets/(cash outflows – cash inflows) at 30 days ≥ 100%
The requirements of the LCR were also addressed in a delegated act, published by the European Commission on 10 October 2014, which clarifies and aligns the international provisions, while European regulation 2013/575 requires that institutions report their LCR at 1 October 2015 and that it be at least 60% in 2015 and 100% in 2018. The Net Stable Funding Ratio (NSFR) aims to supplement the LCR by helping to monitor mismatch risk. It aims to verify that the maturity transformation activity (long-term financing granted using short-term deposits) and stable funding, the source of liquidity risk, are under control.
NSFR = available amount of stable funding/required amount of stable funding ≥ 100%
58 Long-term debt (maturing in more than one year) includes the following: senior debt – covered bonds, other senior debt, subordinated debt and subsidiary trust preferred.
6.2%
7.2% 7.6%
5.2% 4.7%
3.4% 3.4% 2.7%
2.0% 2.0%
0.0%
1.0%
2.0%
3.0%
4.0%
5.0%
6.0%
7.0%
8.0%
9.0%
2015 2016 2017 2018 2019 2020 2021 2022 2023 2024
Long-term debt repayment schedule
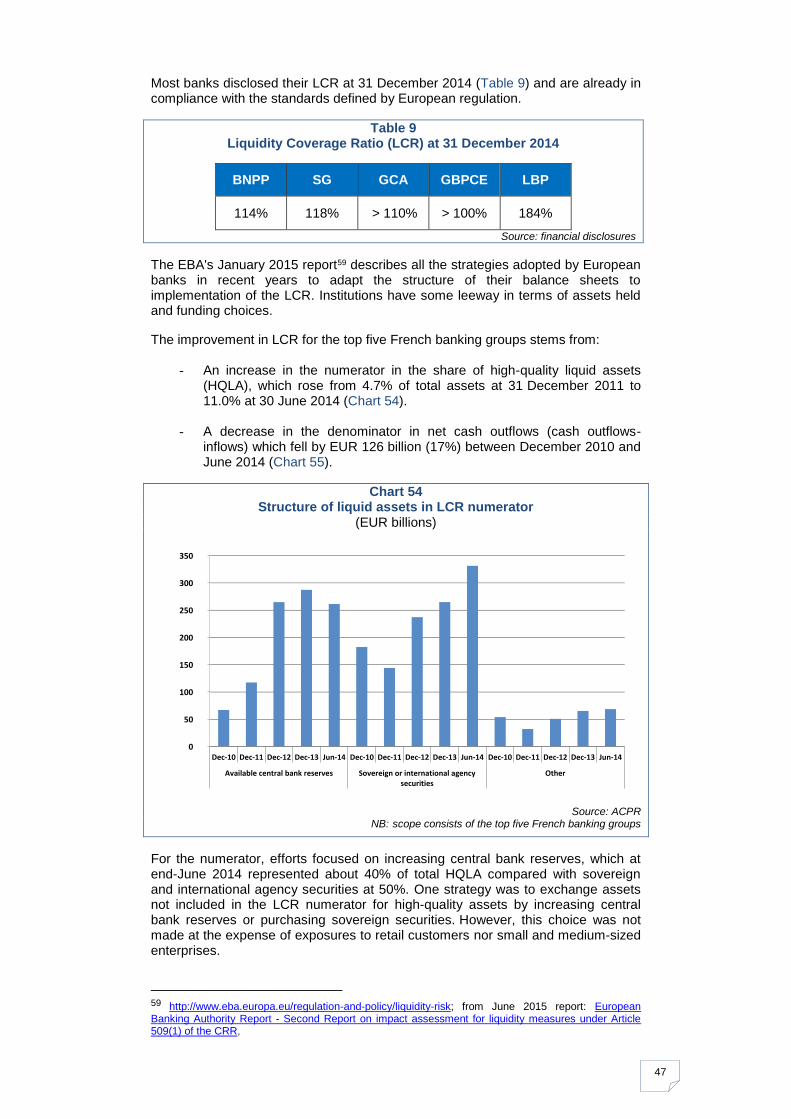
47
Most banks disclosed their LCR at 31 December 2014 (Table 9) and are already in compliance with the standards defined by European regulation.
Table 9 Liquidity Coverage Ratio (LCR) at 31 December 2014
BNPP SG GCA GBPCE LBP
114% 118% > 110% > 100% 184%
Source: financial disclosures
The EBA's January 2015 report59 describes all the strategies adopted by European banks in recent years to adapt the structure of their balance sheets to implementation of the LCR. Institutions have some leeway in terms of assets held and funding choices.
The improvement in LCR for the top five French banking groups stems from:
- An increase in the numerator in the share of high-quality liquid assets (HQLA), which rose from 4.7% of total assets at 31 December 2011 to 11.0% at 30 June 2014 (Chart 54).
- A decrease in the denominator in net cash outflows (cash outflows-
inflows) which fell by EUR 126 billion (17%) between December 2010 and June 2014 (Chart 55).
Chart 54 Structure of liquid assets in LCR numerator
(EUR billions)
Source: ACPR
NB: scope consists of the top five French banking groups
For the numerator, efforts focused on increasing central bank reserves, which at end-June 2014 represented about 40% of total HQLA compared with sovereign and international agency securities at 50%. One strategy was to exchange assets not included in the LCR numerator for high-quality assets by increasing central bank reserves or purchasing sovereign securities. However, this choice was not made at the expense of exposures to retail customers nor small and medium-sized enterprises.
59 http://www.eba.europa.eu/regulation-and-policy/liquidity-risk; from June 2015 report: European Banking Authority Report - Second Report on impact assessment for liquidity measures under Article 509(1) of the CRR,
0
50
100
150
200
250
300
350
Dec-10 Dec-11 Dec-12 Dec-13 Jun-14 Dec-10 Dec-11 Dec-12 Dec-13 Jun-14 Dec-10 Dec-11 Dec-12 Dec-13 Jun-14
Available central bank reserves Sovereign or international agencysecurities
Other
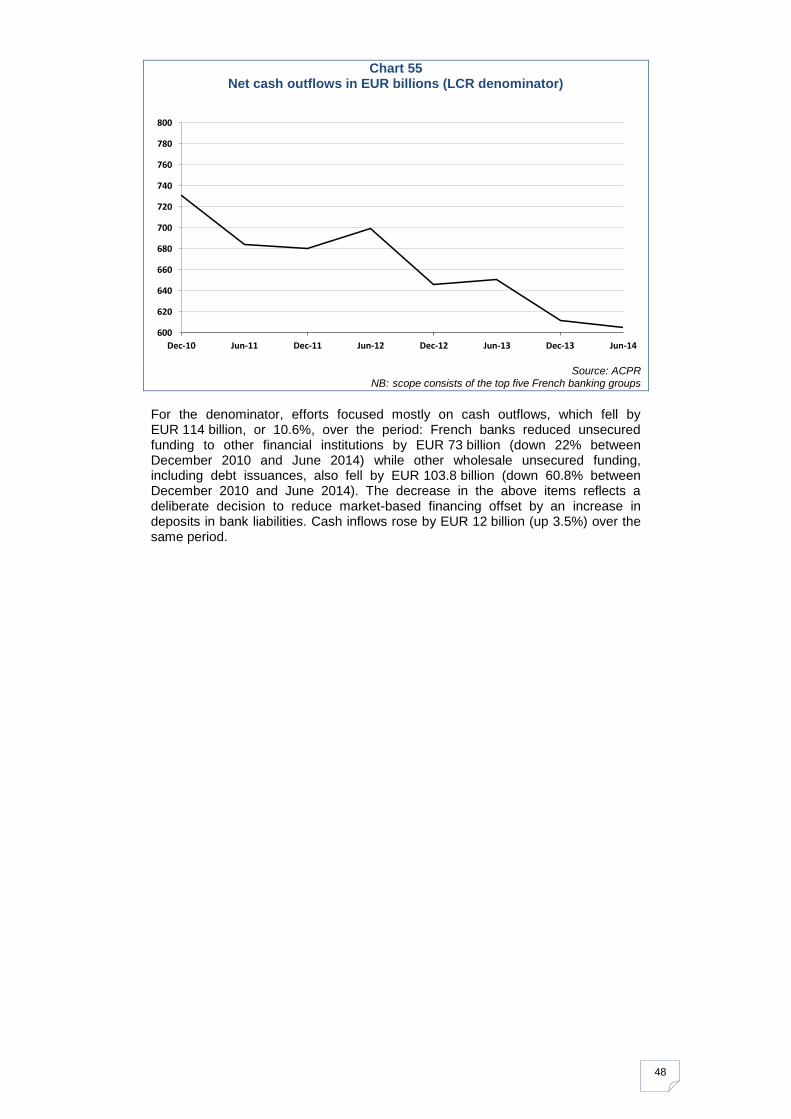
48
Chart 55 Net cash outflows in EUR billions (LCR denominator)
Source: ACPR
NB: scope consists of the top five French banking groups
For the denominator, efforts focused mostly on cash outflows, which fell by EUR 114 billion, or 10.6%, over the period: French banks reduced unsecured funding to other financial institutions by EUR 73 billion (down 22% between December 2010 and June 2014) while other wholesale unsecured funding, including debt issuances, also fell by EUR 103.8 billion (down 60.8% between December 2010 and June 2014). The decrease in the above items reflects a deliberate decision to reduce market-based financing offset by an increase in deposits in bank liabilities. Cash inflows rose by EUR 12 billion (up 3.5%) over the same period.
600
620
640
660
680
700
720
740
760
780
800
Dec-10 Jun-11 Dec-11 Jun-12 Dec-12 Jun-13 Dec-13 Jun-14
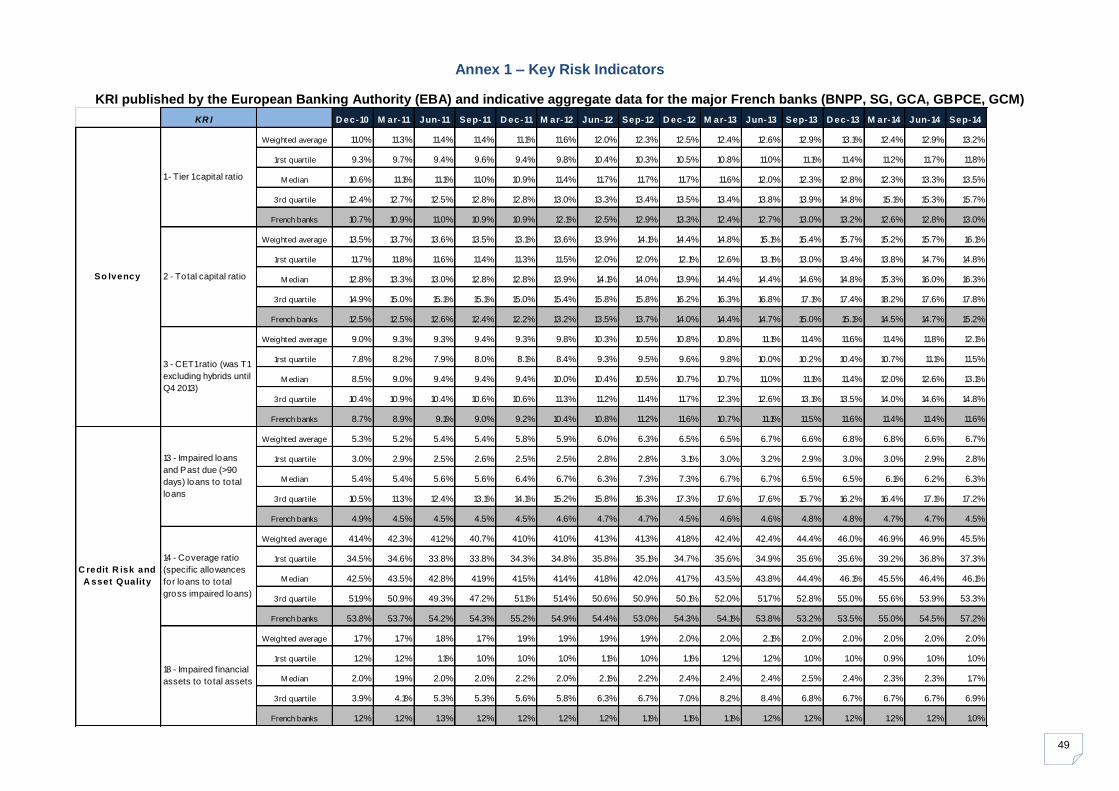
49
Annex 1 – Key Risk Indicators
KRI published by the European Banking Authority (EBA) and indicative aggregate data for the major French banks (BNPP, SG, GCA, GBPCE, GCM)
KR I D ec-10 M ar-11 Jun-11 Sep-11 D ec-11 M ar-12 Jun-12 Sep-12 D ec-12 M ar-13 Jun-13 Sep-13 D ec-13 M ar-14 Jun-14 Sep-14
Weighted average 11.0% 11.3% 11.4% 11.4% 11.1% 11.6% 12.0% 12.3% 12.5% 12.4% 12.6% 12.9% 13.1% 12.4% 12.9% 13.2%
1rst quart ile 9.3% 9.7% 9.4% 9.6% 9.4% 9.8% 10.4% 10.3% 10.5% 10.8% 11.0% 11.1% 11.4% 11.2% 11.7% 11.8%
M edian 10.6% 11.1% 11.1% 11.0% 10.9% 11.4% 11.7% 11.7% 11.7% 11.6% 12.0% 12.3% 12.8% 12.3% 13.3% 13.5%
3rd quart ile 12.4% 12.7% 12.5% 12.8% 12.8% 13.0% 13.3% 13.4% 13.5% 13.4% 13.8% 13.9% 14.8% 15.1% 15.3% 15.7%
French banks 10.7% 10.9% 11.0% 10.9% 10.9% 12.1% 12.5% 12.9% 13.3% 12.4% 12.7% 13.0% 13.2% 12.6% 12.8% 13.0%
Weighted average 13.5% 13.7% 13.6% 13.5% 13.1% 13.6% 13.9% 14.1% 14.4% 14.8% 15.1% 15.4% 15.7% 15.2% 15.7% 16.1%
1rst quart ile 11.7% 11.8% 11.6% 11.4% 11.3% 11.5% 12.0% 12.0% 12.1% 12.6% 13.1% 13.0% 13.4% 13.8% 14.7% 14.8%
M edian 12.8% 13.3% 13.0% 12.8% 12.8% 13.9% 14.1% 14.0% 13.9% 14.4% 14.4% 14.6% 14.8% 15.3% 16.0% 16.3%
3rd quart ile 14.9% 15.0% 15.1% 15.1% 15.0% 15.4% 15.8% 15.8% 16.2% 16.3% 16.8% 17.1% 17.4% 18.2% 17.6% 17.8%
French banks 12.5% 12.5% 12.6% 12.4% 12.2% 13.2% 13.5% 13.7% 14.0% 14.4% 14.7% 15.0% 15.1% 14.5% 14.7% 15.2%
Weighted average 9.0% 9.3% 9.3% 9.4% 9.3% 9.8% 10.3% 10.5% 10.8% 10.8% 11.1% 11.4% 11.6% 11.4% 11.8% 12.1%
1rst quart ile 7.8% 8.2% 7.9% 8.0% 8.1% 8.4% 9.3% 9.5% 9.6% 9.8% 10.0% 10.2% 10.4% 10.7% 11.1% 11.5%
M edian 8.5% 9.0% 9.4% 9.4% 9.4% 10.0% 10.4% 10.5% 10.7% 10.7% 11.0% 11.1% 11.4% 12.0% 12.6% 13.1%
3rd quart ile 10.4% 10.9% 10.4% 10.6% 10.6% 11.3% 11.2% 11.4% 11.7% 12.3% 12.6% 13.1% 13.5% 14.0% 14.6% 14.8%
French banks 8.7% 8.9% 9.1% 9.0% 9.2% 10.4% 10.8% 11.2% 11.6% 10.7% 11.1% 11.5% 11.6% 11.4% 11.4% 11.6%
Weighted average 5.3% 5.2% 5.4% 5.4% 5.8% 5.9% 6.0% 6.3% 6.5% 6.5% 6.7% 6.6% 6.8% 6.8% 6.6% 6.7%
1rst quart ile 3.0% 2.9% 2.5% 2.6% 2.5% 2.5% 2.8% 2.8% 3.1% 3.0% 3.2% 2.9% 3.0% 3.0% 2.9% 2.8%
M edian 5.4% 5.4% 5.6% 5.6% 6.4% 6.7% 6.3% 7.3% 7.3% 6.7% 6.7% 6.5% 6.5% 6.1% 6.2% 6.3%
3rd quart ile 10.5% 11.3% 12.4% 13.1% 14.1% 15.2% 15.8% 16.3% 17.3% 17.6% 17.6% 15.7% 16.2% 16.4% 17.1% 17.2%
French banks 4.9% 4.5% 4.5% 4.5% 4.5% 4.6% 4.7% 4.7% 4.5% 4.6% 4.6% 4.8% 4.8% 4.7% 4.7% 4.5%
Weighted average 41.4% 42.3% 41.2% 40.7% 41.0% 41.0% 41.3% 41.3% 41.8% 42.4% 42.4% 44.4% 46.0% 46.9% 46.9% 45.5%
1rst quart ile 34.5% 34.6% 33.8% 33.8% 34.3% 34.8% 35.8% 35.1% 34.7% 35.6% 34.9% 35.6% 35.6% 39.2% 36.8% 37.3%
M edian 42.5% 43.5% 42.8% 41.9% 41.5% 41.4% 41.8% 42.0% 41.7% 43.5% 43.8% 44.4% 46.1% 45.5% 46.4% 46.1%
3rd quart ile 51.9% 50.9% 49.3% 47.2% 51.1% 51.4% 50.6% 50.9% 50.1% 52.0% 51.7% 52.8% 55.0% 55.6% 53.9% 53.3%
French banks 53.8% 53.7% 54.2% 54.3% 55.2% 54.9% 54.4% 53.0% 54.3% 54.1% 53.8% 53.2% 53.5% 55.0% 54.5% 57.2%
Weighted average 1.7% 1.7% 1.8% 1.7% 1.9% 1.9% 1.9% 1.9% 2.0% 2.0% 2.1% 2.0% 2.0% 2.0% 2.0% 2.0%
1rst quart ile 1.2% 1.2% 1.1% 1.0% 1.0% 1.0% 1.1% 1.0% 1.1% 1.2% 1.2% 1.0% 1.0% 0.9% 1.0% 1.0%
M edian 2.0% 1.9% 2.0% 2.0% 2.2% 2.0% 2.1% 2.2% 2.4% 2.4% 2.4% 2.5% 2.4% 2.3% 2.3% 1.7%
3rd quart ile 3.9% 4.1% 5.3% 5.3% 5.6% 5.8% 6.3% 6.7% 7.0% 8.2% 8.4% 6.8% 6.7% 6.7% 6.7% 6.9%
French banks 1.2% 1.2% 1.3% 1.2% 1.2% 1.2% 1.2% 1.1% 1.1% 1.1% 1.2% 1.2% 1.2% 1.2% 1.2% 1.0%
So lvency
1 - Tier 1 capital ratio
2 - Total capital ratio
3 - CET1 ratio (was T1
excluding hybrids until
Q4 2013)
C redit R isk and
A sset Quality
13 - Impaired loans
and Past due (>90
days) loans to to tal
loans
14 - Coverage ratio
(specific allowances
for loans to to tal
gross impaired loans)
18 - Impaired financial
assets to to tal assets
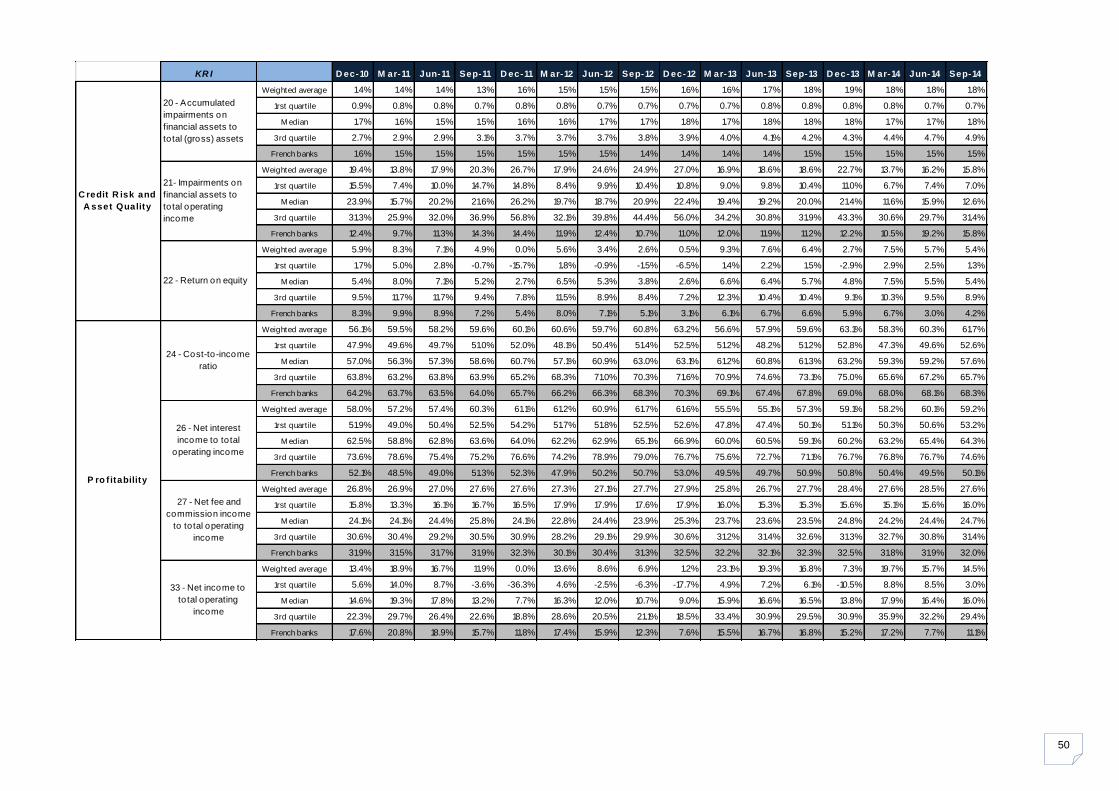
50
KR I D ec-10 M ar-11 Jun-11 Sep-11 D ec-11 M ar-12 Jun-12 Sep-12 D ec-12 M ar-13 Jun-13 Sep-13 D ec-13 M ar-14 Jun-14 Sep-14
Weighted average 1.4% 1.4% 1.4% 1.3% 1.6% 1.5% 1.5% 1.5% 1.6% 1.6% 1.7% 1.8% 1.9% 1.8% 1.8% 1.8%
1rst quart ile 0.9% 0.8% 0.8% 0.7% 0.8% 0.8% 0.7% 0.7% 0.7% 0.7% 0.8% 0.8% 0.8% 0.8% 0.7% 0.7%
M edian 1.7% 1.6% 1.5% 1.5% 1.6% 1.6% 1.7% 1.7% 1.8% 1.7% 1.8% 1.8% 1.8% 1.7% 1.7% 1.8%
3rd quart ile 2.7% 2.9% 2.9% 3.1% 3.7% 3.7% 3.7% 3.8% 3.9% 4.0% 4.1% 4.2% 4.3% 4.4% 4.7% 4.9%
French banks 1.6% 1.5% 1.5% 1.5% 1.5% 1.5% 1.5% 1.4% 1.4% 1.4% 1.4% 1.5% 1.5% 1.5% 1.5% 1.5%
Weighted average 19.4% 13.8% 17.9% 20.3% 26.7% 17.9% 24.6% 24.9% 27.0% 16.9% 18.6% 18.6% 22.7% 13.7% 16.2% 15.8%
1rst quart ile 15.5% 7.4% 10.0% 14.7% 14.8% 8.4% 9.9% 10.4% 10.8% 9.0% 9.8% 10.4% 11.0% 6.7% 7.4% 7.0%
M edian 23.9% 15.7% 20.2% 21.6% 26.2% 19.7% 18.7% 20.9% 22.4% 19.4% 19.2% 20.0% 21.4% 11.6% 15.9% 12.6%
3rd quart ile 31.3% 25.9% 32.0% 36.9% 56.8% 32.1% 39.8% 44.4% 56.0% 34.2% 30.8% 31.9% 43.3% 30.6% 29.7% 31.4%
French banks 12.4% 9.7% 11.3% 14.3% 14.4% 11.9% 12.4% 10.7% 11.0% 12.0% 11.9% 11.2% 12.2% 10.5% 19.2% 15.8%
Weighted average 5.9% 8.3% 7.1% 4.9% 0.0% 5.6% 3.4% 2.6% 0.5% 9.3% 7.6% 6.4% 2.7% 7.5% 5.7% 5.4%
1rst quart ile 1.7% 5.0% 2.8% -0.7% -15.7% 1.8% -0.9% -1.5% -6.5% 1.4% 2.2% 1.5% -2.9% 2.9% 2.5% 1.3%
M edian 5.4% 8.0% 7.1% 5.2% 2.7% 6.5% 5.3% 3.8% 2.6% 6.6% 6.4% 5.7% 4.8% 7.5% 5.5% 5.4%
3rd quart ile 9.5% 11.7% 11.7% 9.4% 7.8% 11.5% 8.9% 8.4% 7.2% 12.3% 10.4% 10.4% 9.1% 10.3% 9.5% 8.9%
French banks 8.3% 9.9% 8.9% 7.2% 5.4% 8.0% 7.1% 5.1% 3.1% 6.1% 6.7% 6.6% 5.9% 6.7% 3.0% 4.2%
Weighted average 56.1% 59.5% 58.2% 59.6% 60.1% 60.6% 59.7% 60.8% 63.2% 56.6% 57.9% 59.6% 63.1% 58.3% 60.3% 61.7%
1rst quart ile 47.9% 49.6% 49.7% 51.0% 52.0% 48.1% 50.4% 51.4% 52.5% 51.2% 48.2% 51.2% 52.8% 47.3% 49.6% 52.6%
M edian 57.0% 56.3% 57.3% 58.6% 60.7% 57.1% 60.9% 63.0% 63.1% 61.2% 60.8% 61.3% 63.2% 59.3% 59.2% 57.6%
3rd quart ile 63.8% 63.2% 63.8% 63.9% 65.2% 68.3% 71.0% 70.3% 71.6% 70.9% 74.6% 73.1% 75.0% 65.6% 67.2% 65.7%
French banks 64.2% 63.7% 63.5% 64.0% 65.7% 66.2% 66.3% 68.3% 70.3% 69.1% 67.4% 67.8% 69.0% 68.0% 68.1% 68.3%
Weighted average 58.0% 57.2% 57.4% 60.3% 61.1% 61.2% 60.9% 61.7% 61.6% 55.5% 55.1% 57.3% 59.1% 58.2% 60.1% 59.2%
1rst quart ile 51.9% 49.0% 50.4% 52.5% 54.2% 51.7% 51.8% 52.5% 52.6% 47.8% 47.4% 50.1% 51.1% 50.3% 50.6% 53.2%
M edian 62.5% 58.8% 62.8% 63.6% 64.0% 62.2% 62.9% 65.1% 66.9% 60.0% 60.5% 59.1% 60.2% 63.2% 65.4% 64.3%
3rd quart ile 73.6% 78.6% 75.4% 75.2% 76.6% 74.2% 78.9% 79.0% 76.7% 75.6% 72.7% 71.1% 76.7% 76.8% 76.7% 74.6%
French banks 52.1% 48.5% 49.0% 51.3% 52.3% 47.9% 50.2% 50.7% 53.0% 49.5% 49.7% 50.9% 50.8% 50.4% 49.5% 50.1%
Weighted average 26.8% 26.9% 27.0% 27.6% 27.6% 27.3% 27.1% 27.7% 27.9% 25.8% 26.7% 27.7% 28.4% 27.6% 28.5% 27.6%
1rst quart ile 15.8% 13.3% 16.1% 16.7% 16.5% 17.9% 17.9% 17.6% 17.9% 16.0% 15.3% 15.3% 15.6% 15.1% 15.6% 16.0%
M edian 24.1% 24.1% 24.4% 25.8% 24.1% 22.8% 24.4% 23.9% 25.3% 23.7% 23.6% 23.5% 24.8% 24.2% 24.4% 24.7%
3rd quart ile 30.6% 30.4% 29.2% 30.5% 30.9% 28.2% 29.1% 29.9% 30.6% 31.2% 31.4% 32.6% 31.3% 32.7% 30.8% 31.4%
French banks 31.9% 31.5% 31.7% 31.9% 32.3% 30.1% 30.4% 31.3% 32.5% 32.2% 32.1% 32.3% 32.5% 31.8% 31.9% 32.0%
Weighted average 13.4% 18.9% 16.7% 11.9% 0.0% 13.6% 8.6% 6.9% 1.2% 23.1% 19.3% 16.8% 7.3% 19.7% 15.7% 14.5%
1rst quart ile 5.6% 14.0% 8.7% -3.6% -36.3% 4.6% -2.5% -6.3% -17.7% 4.9% 7.2% 6.1% -10.5% 8.8% 8.5% 3.0%
M edian 14.6% 19.3% 17.8% 13.2% 7.7% 16.3% 12.0% 10.7% 9.0% 15.9% 16.6% 16.5% 13.8% 17.9% 16.4% 16.0%
3rd quart ile 22.3% 29.7% 26.4% 22.6% 18.8% 28.6% 20.5% 21.1% 18.5% 33.4% 30.9% 29.5% 30.9% 35.9% 32.2% 29.4%
French banks 17.6% 20.8% 18.9% 15.7% 11.8% 17.4% 15.9% 12.3% 7.6% 15.5% 16.7% 16.8% 15.2% 17.2% 7.7% 11.1%
C redit R isk and
A sset Quality
20 - Accumulated
impairments on
financial assets to
to tal (gross) assets
21 - Impairments on
financial assets to
to tal operating
income
22 - Return on equity
P ro f itability
24 - Cost-to-income
ratio
26 - Net interest
income to to tal
operating income
27 - Net fee and
commission income
to to tal operating
income
33 - Net income to
to tal operating
income
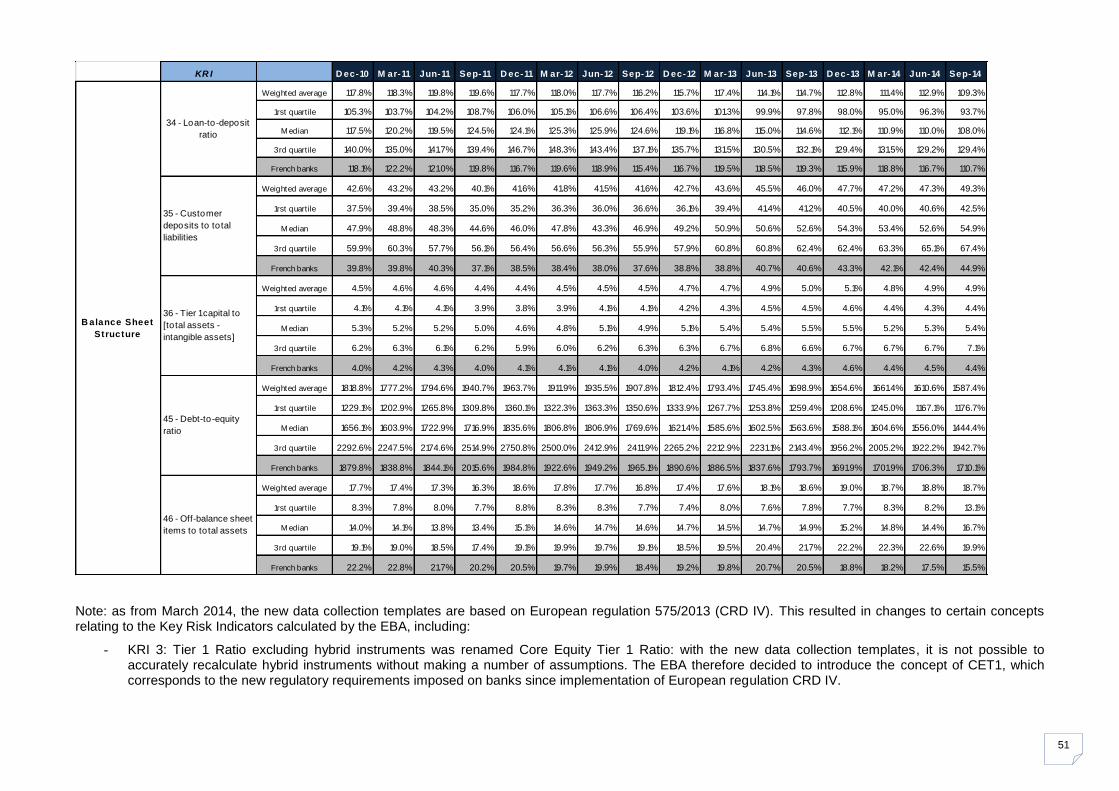
51
Note: as from March 2014, the new data collection templates are based on European regulation 575/2013 (CRD IV). This resulted in changes to certain concepts relating to the Key Risk Indicators calculated by the EBA, including:
- KRI 3: Tier 1 Ratio excluding hybrid instruments was renamed Core Equity Tier 1 Ratio: with the new data collection templates, it is not possible to accurately recalculate hybrid instruments without making a number of assumptions. The EBA therefore decided to introduce the concept of CET1, which corresponds to the new regulatory requirements imposed on banks since implementation of European regulation CRD IV.
KR I D ec-10 M ar-11 Jun-11 Sep-11 D ec-11 M ar-12 Jun-12 Sep-12 D ec-12 M ar-13 Jun-13 Sep-13 D ec-13 M ar-14 Jun-14 Sep-14
Weighted average 117.8% 118.3% 119.8% 119.6% 117.7% 118.0% 117.7% 116.2% 115.7% 117.4% 114.1% 114.7% 112.8% 111.4% 112.9% 109.3%
1rst quart ile 105.3% 103.7% 104.2% 108.7% 106.0% 105.1% 106.6% 106.4% 103.6% 101.3% 99.9% 97.8% 98.0% 95.0% 96.3% 93.7%
M edian 117.5% 120.2% 119.5% 124.5% 124.1% 125.3% 125.9% 124.6% 119.1% 116.8% 115.0% 114.6% 112.1% 110.9% 110.0% 108.0%
3rd quart ile 140.0% 135.0% 141.7% 139.4% 146.7% 148.3% 143.4% 137.1% 135.7% 131.5% 130.5% 132.1% 129.4% 131.5% 129.2% 129.4%
French banks 118.1% 122.2% 121.0% 119.8% 116.7% 119.6% 118.9% 115.4% 116.7% 119.5% 118.5% 119.3% 115.9% 118.8% 116.7% 110.7%
Weighted average 42.6% 43.2% 43.2% 40.1% 41.6% 41.8% 41.5% 41.6% 42.7% 43.6% 45.5% 46.0% 47.7% 47.2% 47.3% 49.3%
1rst quart ile 37.5% 39.4% 38.5% 35.0% 35.2% 36.3% 36.0% 36.6% 36.1% 39.4% 41.4% 41.2% 40.5% 40.0% 40.6% 42.5%
M edian 47.9% 48.8% 48.3% 44.6% 46.0% 47.8% 43.3% 46.9% 49.2% 50.9% 50.6% 52.6% 54.3% 53.4% 52.6% 54.9%
3rd quart ile 59.9% 60.3% 57.7% 56.1% 56.4% 56.6% 56.3% 55.9% 57.9% 60.8% 60.8% 62.4% 62.4% 63.3% 65.1% 67.4%
French banks 39.8% 39.8% 40.3% 37.1% 38.5% 38.4% 38.0% 37.6% 38.8% 38.8% 40.7% 40.6% 43.3% 42.1% 42.4% 44.9%
Weighted average 4.5% 4.6% 4.6% 4.4% 4.4% 4.5% 4.5% 4.5% 4.7% 4.7% 4.9% 5.0% 5.1% 4.8% 4.9% 4.9%
1rst quart ile 4.1% 4.1% 4.1% 3.9% 3.8% 3.9% 4.1% 4.1% 4.2% 4.3% 4.5% 4.5% 4.6% 4.4% 4.3% 4.4%
M edian 5.3% 5.2% 5.2% 5.0% 4.6% 4.8% 5.1% 4.9% 5.1% 5.4% 5.4% 5.5% 5.5% 5.2% 5.3% 5.4%
3rd quart ile 6.2% 6.3% 6.1% 6.2% 5.9% 6.0% 6.2% 6.3% 6.3% 6.7% 6.8% 6.6% 6.7% 6.7% 6.7% 7.1%
French banks 4.0% 4.2% 4.3% 4.0% 4.1% 4.1% 4.1% 4.0% 4.2% 4.1% 4.2% 4.3% 4.6% 4.4% 4.5% 4.4%
Weighted average 1818.8% 1777.2% 1794.6% 1940.7% 1963.7% 1911.9% 1935.5% 1907.8% 1812.4% 1793.4% 1745.4% 1698.9% 1654.6% 1661.4% 1610.6% 1587.4%
1rst quart ile 1229.1% 1202.9% 1265.8% 1309.8% 1360.1% 1322.3% 1363.3% 1350.6% 1333.9% 1267.7% 1253.8% 1259.4% 1208.6% 1245.0% 1167.1% 1176.7%
M edian 1656.1% 1603.9% 1722.9% 1716.9% 1835.6% 1806.8% 1806.9% 1769.6% 1621.4% 1585.6% 1602.5% 1563.6% 1588.1% 1604.6% 1556.0% 1444.4%
3rd quart ile 2292.6% 2247.5% 2174.6% 2514.9% 2750.8% 2500.0% 2412.9% 2411.9% 2265.2% 2212.9% 2231.1% 2143.4% 1956.2% 2005.2% 1922.2% 1942.7%
French banks 1879.8% 1838.8% 1844.1% 2015.6% 1984.8% 1922.6% 1949.2% 1965.1% 1890.6% 1886.5% 1837.6% 1793.7% 1691.9% 1701.9% 1706.3% 1710.1%
Weighted average 17.7% 17.4% 17.3% 16.3% 18.6% 17.8% 17.7% 16.8% 17.4% 17.6% 18.1% 18.6% 19.0% 18.7% 18.8% 18.7%
1rst quart ile 8.3% 7.8% 8.0% 7.7% 8.8% 8.3% 8.3% 7.7% 7.4% 8.0% 7.6% 7.8% 7.7% 8.3% 8.2% 13.1%
M edian 14.0% 14.1% 13.8% 13.4% 15.1% 14.6% 14.7% 14.6% 14.7% 14.5% 14.7% 14.9% 15.2% 14.8% 14.4% 16.7%
3rd quart ile 19.1% 19.0% 18.5% 17.4% 19.1% 19.9% 19.7% 19.1% 18.5% 19.5% 20.4% 21.7% 22.2% 22.3% 22.6% 19.9%
French banks 22.2% 22.8% 21.7% 20.2% 20.5% 19.7% 19.9% 18.4% 19.2% 19.8% 20.7% 20.5% 18.8% 18.2% 17.5% 15.5%
B alance Sheet
Structure
34 - Loan-to-deposit
ratio
35 - Customer
deposits to total
liabilities
36 - Tier 1 capital to
[to tal assets -
intangible assets]
45 - Debt-to-equity
ratio
46 - Off-balance sheet
items to total assets
52
- KRI 21, 26, 27 and 33: the EBA applies a consistent method to cancel out the effects of a numerator and denominator which can have either a negative or positive value, alternately or at the same time.
- KRI 46 - Off-balance sheet items to total assets: as a result of high volatility in the denominator (total assets) due to recognition of derivatives, the EBA decided to add these same derivatives to the numerator of the ratio.
- KRI 34 - Loan-to-deposit ratio: the EBA changed the ratio's scope in October 2013 and added deposits from credit institutions to the denominator to better reflect the concepts used in the numerator, which includes loans to credit institutions.
- Lastly, the sample changed between 2013 and 2014 to incorporate significant institutions, oversight of which was incorporated directly into the Single Supervisory Mechanism as from November 2014. Since December 2014, the sample of French banks has included the following: BNP Paribas SA, Crédit Agricole Group, Société Générale SA, GCM Group, BPCE Group, Banque Centrale de Compensation (LCH Clearnet), Banque PSA Finance, BPI (Banque Publique d'Investissement) France Financement, CRH (Caisse de Refinancement de l'Habitat), HSBC France, La Banque Postale, and RCI banque (Renault Crédit Industriel). However, to maintain consistency with past reporting dates, the charts in this document present the data for the usual five banking groups: BNP, SG, BPCE, GCA, GCM. A complete list can be found on the EBA's website at http://www.eba.europa.eu/-/eba-updates-its-risk-dashboard-for-eu-banking-sect-1
53
Annex 2 – Equivalence tables
Equivalences between COREP categories for credit risk and the segmentation used in the 2014 analysis.
New name
Standardised Approach Generic categories for the analysis
Central governments or central banks Governments
Regional governments or local authorities Governments
Public sector entities Governments
Multilateral Development Banks Governments
International Organisations Governments
Institutions Institutions
Corporates Corporates
Retail Retail
Secured by mortgages on immovable
property Other SA
Exposures in default Default SA
Items associated with particular high risk Other SA
Covered bonds Other SA
Claims on institutions and corporates with a
short-term credit assessment Other SA
Collective investment undertakings (CIU) Other SA
Equity Equity
Other items Other SA
Securitisation positions SA Securitisation
New name
Advanced approach (IRB) Generic categories for the analysis
Central governments and central banks Governments
Institutions Institutions
Corporates - SME Corporates
Corporates - Specialised Lending Corporates
Corporates - Other Corporates
Retail - Secured by real estate SME Retail
Retail - Secured by real estate non-SME Retail
Retail - Qualifying revolving Retail
Retail - Other SME Retail
Retail - Other non-SME Retail
Equity IRB Equity
Securitisation positions IRB Securitisation
Other non credit-obligation assets Other IRB

54
References Autorité de contrôle prudentiel et de résolution, Analyses et Synthèses No. 29 – French banks’ performance in 2013 Directive 2013/36 (CRD4) and Regulation 575/2013 (CRR) of the European Parliament and of the Council of 26 June 2013 European Banking Authority, Risk Assessment of the European Banking System, December 2014, European Banking Authority, Risk Dashboard Q4 2014 European Banking Authority Report - Second report on impact assessment for liquidity measures under Article 509(1) of the CRR
55
Tables and charts Tables Table 1 Intermediate operating totals ................................................................ 5 Table 2 Contributions to NBI from major business lines since 2010 ............... 17 Table 3 Main aggregates for retail banking and specialist finance ................. 19 Table 4 Main aggregates for CIB ..................................................................... 20 Table 5 Aggregate balance sheet for the five main French banking groups ... 23 Table 6 Full CRD4 Basel III CET1 ratio without phase-in ............................... 28 Table 7 Leverage ratios ................................................................................... 29 Table 8 French banks' net exposures to toxic and sensitive assets ............... 41 Table 9 Liquidity Coverage Ratio (LCR) at 31 December 2014 ...................... 47
Charts Chart 1 NBI/total assets..................................................................................... 6 Chart 2 Net interest margin/total assets ............................................................ 8 Chart 3 Net fees and commissions/total assets ................................................ 8 Chart 4 Net interest margin/NBI (KRI) ............................................................... 9 Chart 5 Net fees & commissions/NBI (KRI) ....................................................... 9 Chart 6 Cost-to-income ratios for major European banks ............................... 10 Chart 7 Cost of risk/total assets ...................................................................... 11 Chart 8 Cost of risk at selected international banks ........................................ 12 Chart 9 Cost of risk relative to NBI at selected international banks ................ 12 Chart 10 Net profit at selected international banks ........................................... 14 Chart 11 Return on assets................................................................................. 14 Chart 12 Return on assets at selected international banks ............................... 15 Chart 13 Return on equity ................................................................................. 15 Chart 14 Net banking income by business line ................................................. 16 Chart 15 Cost-to-income ratio by business line................................................. 17 Chart 16 Cost of risk by business line ............................................................... 18 Chart 17 Operating profit by business line ........................................................ 18 Chart 18 Breakdown of CIB NBI ........................................................................ 20 Chart 19 Insurance share of NBI for the six banks ........................................... 21 Chart 20 Insurance share of operating profit (excuding GBPCE in 2011 and
2012) ................................................................................................... 21 Chart 21 Loan-to-deposit ratios for the main European banks ......................... 24 Chart 22 Customer deposits as a share of tota liabilities for the main European
banks .................................................................................................. 25 Chart 23 The main European banks' Core Equity Tier 1* capital ratios ............ 26 Chart 24 Full CRR/CRD4/Basel III CET1 ratios at end-2014 ............................ 27 Chart 25 French banks' capital requirements .................................................... 28 Chart 26 Leverage ratio at 31 December 2014 ................................................. 29 Chart 27 Credit risk structure at 31 December 2014 ......................................... 31 Chart 28 Structure of EADs by portfolio ............................................................ 32 Chart 29 Structure of provisions by portfolio ..................................................... 32 Chart 30 Risk-weighted assets (RWA) .............................................................. 32 Chart 31 Delinquency rates for the main French banking groups ..................... 34 Chart 32 Age profile of past due loans .............................................................. 34 Chart 33 Impaired loan rates
1 for the main French banking groups ................. 35
Chart 34 Corporate default rates worldwide (high-yield borrowers) .................. 35 Chart 35 Impaired loan rates for the main European banks ............................. 36 Chart 36 Coverage ratios for the main French banking groups ........................ 37 Chart 37 Coverage ratios for the main European banks ................................... 37 Chart 38 Capital requirements for market risk................................................... 38 Chart 39 Breakdown of capital requirements for market risk ............................ 39 Chart 40 Financial assets and liabilities held for trading/total assets ................ 39 Chart 41 Derivatives held for trading/total assets ............................................. 39 Chart 42 Notional volume of derivatives held for training .................................. 40 Chart 43 90-day historical volatility on equity markets ...................................... 40 Chart 44 Average quarterly cumulative VaR for BNPP, SG and GCA .............. 41 Chart 45 Capital requirements for operational risk ............................................ 42 Chart 46 Operational losses/NBI ....................................................................... 42

56
Chart 47 Breakdown of operational losses........................................................ 43 Chart 48 Breakdown of operational losses – retail banking & specialist finance ..
............................................................................................................ 43 Chart 49 Breakdown of operational losses – CIB ............................................. 44 Chart 50 3-month EURIBOR-OIS spread on the European interbank market .. 45 Chart 51 French bank CDS premiums – 5 years, senior debt .......................... 45 Chart 52 Monthly change in US money market funds' exposure to French banks
............................................................................................................ 45 Chart 53 Main groups' long-term debt maturity profile ...................................... 46 Chart 54 Structure of liquid assets in LCR numerator ....................................... 47 Chart 55 Net cash outflows in EUR billions (LCR denominator) ....................... 48
57