Embed Size (px)
Citation preview
University of Michigan Law SchoolUniversity of Michigan Law School Scholarship Repository
Articles Faculty Scholarship
2008
Frequency and Predictors of False Conviction:Why We Know So Little, and New Data on CapitalCasesSamuel R. GrossUniversity of Michigan Law School, [email protected]
Barbara O'BrienMichigan State University College of Law
Available at: https://repository.law.umich.edu/articles/1592
Follow this and additional works at: https://repository.law.umich.edu/articles
Part of the Courts Commons, Criminal Law Commons, and the Law Enforcement andCorrections Commons
This Article is brought to you for free and open access by the Faculty Scholarship at University of Michigan Law School Scholarship Repository. It hasbeen accepted for inclusion in Articles by an authorized administrator of University of Michigan Law School Scholarship Repository. For moreinformation, please contact [email protected].
Recommended CitationGross, Samuel R. "Frequency and Predictors of False Conviction: Why We Know So Little, and New Data on Capital Cases." B.O'Brien, co-author. J. Empirical Legal Stud. 5, no. 4 (2008): 927-62.
Journal of Empirical Legal Studies
Volume 5, Issue 4, 927-962, December 2008
Frequency and Predictors of FalseConviction: Why We Know So Little,and New Data on Capital CasesSamuel R. Gross and Barbara O'Brien *
In the first part of this article, we address the problems inherent in studyingwrongful convictions: our pervasive ignorance and the extreme difficulty ofobtaining the data that we need to answer even basic questions. The mainreason that we know so little about false convictions is that, by definition,they are hidden from view. As a result, it is nearly impossible to gatherreliable data on the characteristics or even the frequency of false convic-tions. In addition, we have very limited data on criminal investigations andprosecutions in general, so even if we could somehow obtain data on cases
of wrongful conviction, we would have inadequate data on true convictionswith which to compare them. In the second part of the article, we dispelsome of that ignorance by considering data on false convictions in a smallbut important subset of criminal cases about which we have unusuallydetailed information: death sentences. From 1973 on, we know basic factsabout all defendants who were sentenced to death in the United States, andwe know which of them were exonerated. From these data we estimate thatthe frequency of wrongful death sentences in the United States is at least 2.3percent. In addition, we compare post-1973 capital exonerations in theUnited States to a random sample of cases of defendants who were sen-tenced in the same time period and ultimately executed. Based on these
*Address correspondence to Samuel R. Gross, Thomas & Mabel Long Professor of Law, 965
Legal Research, University of Michigan Law School, 625 S. State St., Ann Arbor, MI 48109-1215;email: [email protected]. O'Brien is Assistant Professor of Law, Michigan State UniversityCollege of Law.
The authors thank Phoebe Ellsworth, Brandon Garrett,James Greiner, Richard Lempert,J.J.Prescott, Michael Risinger, and Bruce Spencer for comments on earlier drafts, and JenniferLinzer and Rob Warden of the Center on Wrongful Convictions for help tracking down cases.Data collection and coding were done by several excellent research assistants at the Universityof Michigan Law School: Sosun Bac, Drey Cooley, Gina Cumbo,Jessica Ford, Martha Gove, andBenjamin Swoboda. The research for this study was supported by grants from the GideonProject of the Open Society Institute, the Russell Sage Foundation, and the Michigan StateUniversity College of Law.
© 2008, Copyright the AuthorsJournal compilation © 2008, Cornell Law School and Wiley Periodicals, Inc.

928 Gross and O'Brien
comparisons, we present a handful of findings on features of the investiga-tions of capital cases, and on background facts about capital defendants,that are modest predictors of false convictions.
The fundamental problem with false convictions is also one of their defining
features: they are hidden from view. In most cases false convictions are notmerely invisible but hard if not impossible to identify when we try. This has
to be true. We determine criminal guilt in stages: investigation by the police,
followed by public prosecution if there is sufficient evidence against anarrested suspect, leading to conviction by a plea of guilty, or dismissal of thecharges, or-in a small minority of cases-conviction or acquittal at trial.
This is hardly a perfect system but because there is no obvious way to do
better, we do not generally know when we are wrong. There are no answersat the back of the book.
The worst effect of the invisibility of wrongful convictions is the most
direct: for the most part, they are uncorrected. We do sometimes find newconvincing evidence that convicted defendants are innocent, but those who
are cleared have usually spent years in prison, and their ultimate release
seems to depend heavily on luck. A false conviction is a tragedy for the
innocent defendant and his family, whose lives may be destroyed.' It alsoundermines every purpose that criminal punishment is designed to serve.
Not only is it profoundly unjust, but we cannot deter or incapacitate the realcriminal-not to mention any attempt to rehabilitate him-if he is free while
someone else is locked up for his crimes.
An important secondary effect of the invisibility of false convictions is
that we know very little about them. We do not know how frequently defen-
dants are convicted of crimes they did not commit, or in what sorts of cases,or why it happens, or how best to prevent similar errors in the future.
This article addresses the problem of studying wrongful conviction. Inthe first section, we discuss the nature of the issue-the extent of ourignorance and the extreme difficulty of obtaining the data that are needed
to answer even basic questions. In the second section, we dispel a bit of that
ignorance by considering data on false convictions in a small but importantsubset of criminal cases about which we have unusually detailed information:
death sentences.
'Because men make up over 95 percent of the total, we generally refer to exonerated defendantsusing male pronouns.
Frequency and Predictors of False Conviction
I. OUR GENERAL IGNORANCE ABOUT
FALSE CONVICTIONS
A. How Frequent are False Convictions?
False convictions are accidents: a system we rely on daily goes wrong, withtragic results. Like other accidents, most false convictions are probably unin-
tended, although they may be preventable. Drivers frequently speed, and
sometimes drive drunk, but they rarely crash on purpose. Police officers andprosecutors sometimes do sloppy investigations, conceal or shade evidence,even lie, but we suspect that they rarely frame a defendant they believe to be
innocent.2 However, unlike most accidents, false convictions are invisible at
their inception. We know when a car crashes or a house burns to the ground,but if we know that the man on trial is innocent, we do not convict him in the
first place.
Worse (from a researcher's point of view), there is no systematicway to identify false convictions in retrospect. We may not know how many
of those who die at the age of 60 suffer from early Alzheimer's disease-
the symptoms may not be apparent-but a study of autopsies of patients
who die at that age will tell us. There is no general test that can beapplied after the fact to confirm or disprove the guilt of convicted criminal
defendants. We do know about those cases in which defendants who were
wrongfully convicted happen to be exonerated-usually years later-byDNA evidence, or by a confession from the real criminal, or other con-
vincing evidence of innocence that was unavailable at the trial, but
these exonerations, as far as we can tell, are uncommon, unpredictable,and unrepresentative of wrongful convictions in general. As a result, weknow very little about the characteristics or even the prevalence of false
convictions.
In the absence of actual data, researchers have tried to infer the rate of
false convictions from other information. Some have used statistical models
that build on the frequency of disagreements on verdicts between trial
judges and juries-as reflected in surveys of criminal trial judges-and esti-mate that up to 10 percent of criminal convictions injury trials are errone-
We do know about a substantial number of intentional frameups of innocent defendants. Seeinfra, pp. 933-34. We believe these cases represent a small minority of all wrongful convictionsbut, like most other generalizations on this topic, this is at best an informed guess.
930 Gross and O'Brien
ous.3 It is unclear, however, to what extent these models are able to estimate
the proportion of convicted defendants who are factually innocent, as
opposed to those who should not have been convicted under the law given
the evidence presented. Other researchers have surveyed officials who work
in the criminal justice system and report that the great majority believe that
wrongful convictions are rare,4 but that is just collective guess work.
The legal profession, as usual, is bolder. Recently, for example,Justice
Antonin Scalia wrote in a concurring Supreme Court opinion that U.S.
criminal convictions have an "error rate .027 percent-or, to put it another
way, a success rate of 99.973 percent."5 Eighty-three years earlier, Judge
Learned Hand made the same point in more quotable prose: "Our [crimi-
nal] procedure has always been haunted by the ghost of the innocent man
convicted. It is an unreal dream."6 These reassurances are based on an
implicit assumption that the comparatively few false convictions that come to
light are a reasonable proxy for all false convictions. As we will see, this
assumption is unsupported and almost certainly false.
B. What are the Causes and Predictors of False Convictions?
We cannot say much about the causes of false convictions in general
because we know so little about the occurrence of false convictions. For
example, it is entirely possible that most wrongful convictions-like 90
percent or more of all criminal convictions'-are based on negotiated
guilty pleas to comparatively light charges, and that the innocent defen-
3See, e.g.,Joseph L. Gastwirth & Michael D. Sinclair, Diagnostic Test Methodology in the Designand Analysis of Judge-Jury Agreement Studies, 39 Jurimetrics 59 (1998); Bruce D. Spencer,Estimating the Accuracy ofJury Verdicts, 4J. Empirical Legal Stud. 305 (2007);John Baldwin &Michael McConville, Jury Trials 41 (1979). See also Daniel Givelber, Meaningless Acquittals,Meaningful Convictions: Do We ReliablyAcquit the Innocent? 49 Rutgers L. Rev. 1317, 1336-47(1997), for a general discussion of the issue.
4See, e.g., C. Ronald Huff et al., Guilty Until Proven Innocent: Wrongful Conviction and PublicPolicy, 32 Crime & Delinq. 518, 522-23 (1986) (70 percent of criminal justice officials surveyedbelieved that false convictions occurred in fewer than 1 percent of cases).
5Kansas v. Marsh, 126 S. Ct. 2516, 2538 (2006) (Justice Scalia, concurring).
'United States v. Garsson, 291 F. 646, 649 (SDNY 1923).
7See, e.g., Sourcebook of Criminal Justice Statistics, available at http://vwww.albany.edu/ourcebook/pdf/t5462002.pdf (95 percent of state felony convictions in the United States in2002 were by guilty plea).
Frequency and Predictors of False Conviction
dants in those cases received little or no time in custody. If so, it may wellbe that a major cause of these comparatively low-level miscarriages ofjustice is the prospect of prolonged pretrial detention by innocent defen-dants who are unable to post bail. There is, however, little direct evidencefor this pattern.
The exonerations that we know about are overwhelmingly for convic-tions at trial.8 The great majority of exonerated defendants were tried andconvicted of murder or rape and sentenced to life imprisonment or death.9
These errors came to light as a result of protracted postconviction investiga-tions. It is hard to imagine anybody going through that sort of trouble toclear an innocent defendant who pled guilty to a misdemeanor, or even to afelony for which the defendant was immediately released.
We do know about a substantial number of exonerations of innocentdefendants who pled guilty and received comparatively light sentences in oneparticularly disturbing factual context. In the past decade, several systematicprograms of police perury have been uncovered, which ultimately led toexonerations of at least 135 innocent defendants who had been framed forillegal possession of drugs or guns in Los Angeles, ° Dallas," and Tulia,
'Of the 340 exonerated defendants in a 2005 study, only 20-less than 6 percent-had pledguilty, and all of them faced the death penalty or life imprisonment. Samuel R. Gross, KristinJacoby, Daniel J. Matheson, Nicholas Montgomery & Sujata Patil, Exonerations in the UnitedStates 1989 Through 2003, 95J. Crim. L. & Criminology 523, 536 n28 (2005) [hereinafter, Grosset al., Exonerations].
'Gross et al., Exonerations, supra note 8, at 535.
"The Los Angeles cases were discovered when a major scandal in the Rampart Division of theLos Angeles Police Department unraveled, beginning in September 1999. Ultimately, at least100 defendants were exonerated. For an in-depth look at the Rampart scandal, including linksto official reports and reviews and a summary of the scandal's aftermath, see PBS Frontline,L.A.P.D. Blues, available at http://www.pbs.org/wgbh/pages/frontline/shows/lapd/bare.html; see also Report of the Rampart Independent Review Panel (Nov. 16, 2000), available athttp://www.ci.la.ca.us/oig/rirprpt.pdf; Lou Cannon, One Bad Cop, N.Y. Times Magazine, Oct.1, 2000, at 32; Anna Gorman, For Some, it's Too Late to Overturn Convictions: Judges areRefusing to Review Cases Involving Tainted Officers if Inmate is No Longer in Custody, L.A.Times, May 19, 2002, at Metro I (nearly 150 convictions overturned); Stephen Yagman, BadaBing, L.A. City Hall Has a Rico Ring, L.A. Times, Apr. 25, 2001, at B9 (more than 110 convictionsoverturned).
"See Paul Duggan, "Sheetrock Scandal" Hits Dallas Police, Washington Post, Jan. 18, 2002, atA12; Mark McDonald, Dirty or Duped? Who's to Blame for the Fake-Drug Scandal RockingDallas Police? Virtually Everyone, Dallas Observer, May 2, 2002.
932 Gross and O'Brien
Texas. 2 These are not cases in which the wrong person was convicted for a real
crime, but ones where the police lied about crimes that had never happenedat all. Most of these innocent drug and gun defendants pled guilty and had
been released by the time they were exonerated two to four years later. These
cases do demonstrate that some innocent defendants who are not facing the
death penalty or very long terms of imprisonment will plead guilty in return
for greatly reduced sentences. Beyond that, it is impossible to draw lessons
from them about the (probably) much more common context of innocent
defendants who are falsely accused of crimes that actually did occur.
When a false conviction is discovered, it is usually easy to explain why it
happened. If anything, it is too easy to do so-after the fact. Eyewitnesses can
be wrong butjudges andjurors often believe them. Some suspects confess to
crimes they did not commit. Forensic scientists sometimes make critical
mistakes in analyzing blood, fingerprints, fibers, and other items of trace
evidence, and-like cops, jailhouse snitches, opportunistic criminals, and
(probably most common) other suspects-they sometimes deliberately lie
and send innocent defendants to jail or to death row. Any or all of these
could explain why a defendant was falsely convicted of rape or murder and
then exonerated by DNA, or by finding the real killer, 10 years later. In most
exonerations, at least one of these problems occurred.
The problem with these explanations is that they are post hoc and
frequently tautological. For most exonerations, the main evidence for the
occurrence of one or another of these factors is the exoneration itself. In a
typical case, we only know that a rape defendant's confession was false
because postconviction DNA evidence now proves that he is innocent. We
cannot use a factor to predict or prevent false convictions if that factor can
be identified only after we learn that a false conviction has occurred.
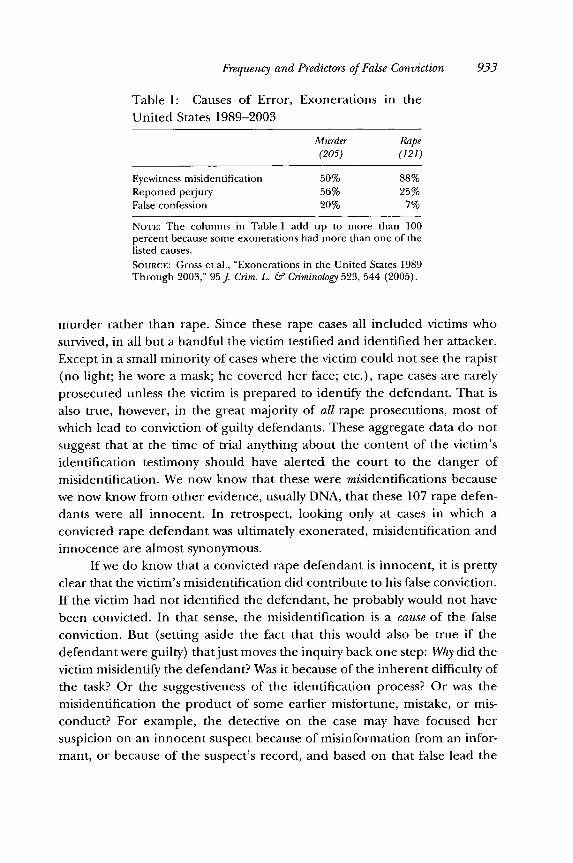
Consider Table 1 on the causes of the false rape and murder convic-
tions that resulted in exonerations in the United States from 1989 through
2003.13 Nearly 90 percent of the rape exonerations in these data, 107 out of121, included eyewitness misidentifications-but how could that be other-
wise? If the victim had been killed, the case would have been classified as
2See Laura Parker, Texas Scandal Throws Doubt on Anti-Drug Task Forces, USA Today, Mar.31, 2004, at 3A; Adam Liptak, $5 Million Settlement Ends Case of Tainted Texas Sting, N.Y.Times, Mar. 11, 2004, at A14; Polly Ross Hughes, Perry Pardons 35 in Tulia Sting, HoustonChronicle, Aug. 23, 2003, at Al.
'G3 ross et al., Exonerations, supra note 8, at 544.
Frequency and Predictors of False Conviction
Table 1: Causes of Error, Exonerations in the
United States 1989-2003
Murder Rape(205) (121)
Eyewitness misidentification 50% 88%Reported perjury 56% 25%False confession 20% 7%
NorE: The columns in Table 1 add up to more than 100percent because some exonerations had more than one of thelisted causes.SOURCE: Gross et al., "Exonerations in the United States 1989Through 2003," 95J Crim. L. & Criminology 523, 544 (2005).
murder rather than rape. Since these rape cases all included victims who
survived, in all but a handful the victim testified and identified her attacker.
Except in a small minority of cases where the victim could not see the rapist
(no light; he wore a mask; he covered her face; etc.), rape cases are rarely
prosecuted unless the victim is prepared to identify the defendant. That is
also true, however, in the great majority of all rape prosecutions, most of
which lead to conviction of guilty defendants. These aggregate data do not
suggest that at the time of trial anything about the content of the victim's
identification testimony should have alerted the court to the danger of
misidentification. We now know that these were misidentifications because
we now know from other evidence, usually DNA, that these 107 rape defen-
dants were all innocent. In retrospect, looking only at cases in which a
convicted rape defendant was ultimately exonerated, misidentification and
innocence are almost synonymous.
If we do know that a convicted rape defendant is innocent, it is pretty
clear that the victim's misidentification did contribute to his false conviction.
If the victim had not identified the defendant, he probably would not have
been convicted. In that sense, the misidentification is a cause of the false
conviction. But (setting aside the fact that this would also be true if the
defendant were guilty) thatjust moves the inquiry back one step: Why did the
victim misidentify the defendant? Was it because of the inherent difficulty of
the task? Or the suggestiveness of the identification process? Or was the
misidentification the product of some earlier misfortune, mistake, or mis-
conduct? For example, the detective on the case may have focused her
suspicion on an innocent suspect because of misinformation from an infor-
mant, or because of the suspect's record, and based on that false lead the
934 Gross and O'Brien
detective may have intentionally or unintentionally misled the victim intopicking the suspect from a lineup that included him and several foils.
What about the process that produced the misidentification? In theexample we just gave, the detective biased the victim's identification, even ifunintentionally. Many psychologists recommend that a lineup be conducted"blind"-that it be administered by an officer who does not know whichperson in the lineup is the suspect. 4 If that had been done-and if the foilswere properly chosen-the victim could not have been biased by the iden-tification process. Is not the lineup procedure that was used, with its obviousrisk of improper suggestion, a predictor of false convictions? Possibly, but thedata at our disposal do not shed light on that possibility one way or the other.
As best we can tell, few actual police lineups are conducted in therecommended "blind" manner. 5 In the absence of that protection, it isnearly impossible to say to what extent identification procedures bias theoutcomes. Worse, even if we knew that all misidentifications in rape casesthat led to exoneration were made in highly suggestive lineups, we could notsay with confidence that this practice is a predictor of false convictions. Forthat we would also need to know what was done in otherwise similar cases ofaccurate convictions, as well as in cases in which the defendants were notconvicted or were never charged at all. We do not have that information.What if, for example, the police always use the same biasing procedure in alllineups? We could still say, with the wisdom of hindsight, that a specificsuggestive lineup caused the misidentification that led to the false convictionof a particular defendant who was later exonerated by a DNA exclusion, butbefore the DNA evidence came in, we could not have used the occurrence ofa biased lineup to predict the defendant's innocence, since biased lineups(we have assumed) happen in all cases, guilty or innocent, across the board.
False confessions-another recurrent cause of wrongful convictions-are even more troublesome than eyewitness misidentifications. They are lesscommon among the exonerations summarized in Table 1, a total of 51compared to 219 misidentifications, and they occurred primarily in murdercases. The type of false statement involved-"I did it" rather than "That's the
4Gary L. Wells, Mark Small, Steven Penrod, Roy S. Malpass, Solomon M. Fulero & C.A.E.Brimacombe, Eyewitness Identification Procedures: Recommendations for Lineups and Photo-spreads, 22 L. & Hum. Behav. 603, 627 (1998).
5Gary L. Wells, Eyewitness Identification: Systematic Reforms, 2006 Wis. L. Rev. 615, 633-35(noting how few jurisdictions have implemented reforms applying psychological research onprotocols for unbiased lineups).
Frequency and Predictors of False Conviction
man"-is not the sort of thing most people say by mistake, or in court. Fewerthan a quarter of the exonerated defendants who falsely confessed went onto plead guilty (12/51); the rest recanted their confessions, usually claimingthat they had been coerced by the police. Since we now know that theseconfessions were false, these claims of coercion are plausible.
The type of coercion we are talking about does not generally violate thelaw as interpreted by U.S. courts. We tolerate interrogations that last formany hours, or even for days, with few breaks; that involve two or moreofficers who insist that there is no doubt that the suspect is guilty; in whichthe interrogating officers lie to the suspect and tell him over and over againthat there is other evidence that proves his guilt beyond doubt, and that hisonly hope is to admit his guilt while they are still willing to listen. 6 Legal ornot, this sort of interrogation is coercive, as that term is ordinarily used, andit produces a fair number of proven false confessions, especially from sus-pects who are young, mentally retarded, or mentally ill. 7
Most false confessions that we know about lead to-cause--false con-victions. As with identifications, it is easy to spot a false confession after thefact, once we know that the confessor is innocent. But, what about thecoercive process that produces false confessions? Is a coerced confession apredictor of false conviction? That is not clear at all.
Coerced confessions are often true. Frequently, they are confirmed bysubsequent evidence that corroborates information supplied for the firsttime in the confession: the location of a weapon or of stolen property, thename of a corroborating witness, and so forth. We have no better aggregatedata on the accuracy of confessions (coerced or not) than we do on thedetails of police-initiated eyewitness identification procedures. It is perfectlypossible, for all we know, that the overwhelming majority of coerced confes-sions are true. If so, the fact that a defendant confessed under pressure mightbe a predictor of guilt, even though coercive interrogations also lead to somefalse convictions. On the other hand, it is also possible that coercive inter-rogation techniques do little or nothing to secure accurate information thatwould not otherwise have been obtained, but merely increase the risk oferror. We do not know.
6See, e.g., People v. House, 566 N.E.2d 259 (Il1. 1990).
'7Steven A. Drizin & Richard A. Leo, The Problem of False Confessions in a Post-DNA World, 82N.C. L. Rev. 891, 945, 963-75, 1003-05 (2004); Gross et al., Exonerations, supra note 8, at544-46.
936 Gross and O'Brien
C. How Can We Study False Convictions?
In theory, the best way to tell if an investigative procedure causes falseconvictions would be to conduct an experiment. For example, we mightrandomly assign criminal investigations to two groups, use coercive interro-gations in only one of these groups, and compare the rates of false convic-
tions across those two sets of cases. This is a nonstarter. Researchers do nothave the authority to conduct such experiments on criminal cases, nor wouldit be ethical to do so. Even if it could be done, we would not know which ofthe resulting convictions are true and which false.
The next best option would be to collect data on representative sets ofcases in which the technique in question was used and was not used, andthen to compare the accuracy of the outcomes, controlling for as many other
influential variables as possible. This is a much less effective method foridentifying causal relationships than an experimental study, but in practiceit, too, is impossible. For most criminal cases we do not know enough about
the pretrial investigation to determine, for example, what sort of eyewitnessidentification procedures or interrogation techniques were employed.Worse, if we could learn which cases did and did not use suggestive lineups
or coercive interrogations (or even if we could somehow assign cases todifferent investigative conditions), we would not be able to assess the impactof these practices on the accuracy of the outcomes because, for the most
part, we cannot identify the cases in which wrongful convictions occur.An alternative would be to begin with a representative sample of all
criminal cases in some well-defined category and determine which of themproduced false convictions and which did not. Unlike the first two methods wementioned, this plan is possible-for rape prosecutions. Starting in 2001, theVirginia Department of Forensic Science discovered several hundred boxescontaining closed rape files from 1973 through 1988-before pretrial DNA
testing was done in that laboratory-many of which contain biological evi-
dence that was never tested for DNA. The state is planning to test those DNAsamples. 8 As far as we know, the group of cases that will be tested is reasonably
representative of all rapes from 1973 through 1988 for which biologicalevidence was sent to the Virginia Department of Forensic Science; as far as weknow, there is no reason to believe that the preservation of these biological
'8Michael D. Shear &Jamie Stockwell, DNA Tests Exonerate 2 Former Prisoners; Va. Governor
Orders Broad Case Review, Washington Post, Dec. 15, 2005, at Al; Frank Green, State's DNAProject is Slow Going, Richmond Times-Dispatch, Aug. 26, 2007.
Frequency and Predictors of False Conviction
samples was associated with any assessment of the defendant's guilt or inno-cence. This may become the first systematic study of false convictions ever, andmay provide uniquely valuable data on the frequency of false conviction-among rape cases in Virginia in the 1970s and 1980s. (So far, the state hasreleased the results of tests on a small preliminary sample, which found twopreviously unknown wrongful convictions out of 22 cases tested.' 9)
Other DNA archives, with biological evidence from old rape prosecu-tions, may be discovered in other jurisdictions. If systematic studies in Vir-ginia or elsewhere uncover a sufficient number of false convictions, we mightlearn a great deal about the causes as well as the frequency of erroneousconvictions for rape two to four decades ago. This would be a breakthrough,even though it would provide no direct data on the frequency or causes ofwrongful convictions for other crimes, or for current rape prosecutions, forthat matter, now that DNA testing has made it much easier to identify rapistsaccurately early in the investigation.
The remaining backup strategy is to start with groups of cases that aredefined by their outcomes: to compare known false convictions to knowncorrect convictions and see if suggestive lineups, coercive interrogations, andso forth are more common in one group than in the other. Every generali-zation that is made about false convictions is based on an explicit or implicitcomparison of this sort. This is a legitimate third-best research strategy, if itslimitations are recognized. In this context those limitations are formidable.2"
One difficulty in making generalizations about false convictions is thatthe ones we know about, exonerations, are clearly a small and unrepresen-tative sample of all false convictions. Setting aside mass exonerations based
"5 Samuel R. Gross, Convicting the Innocent, 4 Ann. Rev. Law Soc. Sci. (forthcoming 2008). Twofalse convictions out of 22 yield an error estimate of 9.1 percent, with a 95 percent confidenceinterval of 0 percent to 21.1 percent. The small number of exonerations on which this estimateis based warrants caution in interpreting the confidence interval.
' 5This method is essentially a variant of the case-control method of studying disease. seegenerallyJamesJ. Schlesselman, Case-Control Studies: Design, Conduct, Analysis (1982). In thiscontext, however, its purpose is different from the usual. We are not studying a pathology (formost case-control studies, disease; here, committing capital murder), but the process of classi-fying people with respect to that pathology. The analogy from medicine would be a case-controlstudy that examines not the occurrence of a disease but the frequency and causes of misdiagnosesof that disease. Because studies of false convictions examine a process of classification, they arevulnerable to mistakes based on the absence of information about categories of cases for whichthey have no data. Specifically, comparisons between exonerations and correct convictionsexclude cases in which guilty defendants were not convicted (or never charged) and cases inwhich innocent suspects were cleared at trial or before trial, or never charged at all. We discussthese issues below, at pp. 952-54.
938 Gross and O'Brien
on proof of police peijury about nonexistent crimes,2' almost all the exon-erations that have come to light since 1989 are for murder-where thelikelihood of postconviction investigation is highest-and for rape, whereuntested DNA evidence can sometimes provide definitive proof of inno-cence. 22 Rape and murder together constitute about 2 percent of felonyconvictions, and a much smaller proportion of all convictions.23 There arevery few exonerations among convictions for nonhomicidal crimes of vio-lence for which DNA evidence is of no value, for example, robbery. Thereare virtually no exonerations for the misdemeanors and nonviolent feloniesthat constitute the vast majority of all criminal convictions, and probablyinclude the majority of false criminal convictions as well.
If that were the only problem, we could simply narrow our focus. Itwould be valuable, for instance, to understand the processes that producefalse convictions just among rape cases, for which we have a substantialnumber of exonerations. Rape exonerations may not be representative of allfalse rape convictions, but comparisons between them and correct rapeconvictions would be a start, if it could be done. Of course, we cannot be surethat convicted rape defendants who have not been exonerated are in factguilty, but we could use a representative set of all rape convictions as a proxyfor correct rape convictions on the plausible assumption that this classificationwill be accurate in a sufficiently high proportion of the cases to provide auseful comparison to known false convictions. However, even with thesecompromises-focusing solely on rape, using rape exonerations as a proxyfor all false convictions, and using all rape convictions as a proxy for correctconvictions-the task is impossible. We simply do not know enough aboutthe histories of rape prosecutions and rape convictions in general.
We do know a fair amount about most rape exonerations because anexoneration is an unusual event that draws attention. Unfortunately, thatattention comes at the end of the case when the defendant is finally clearedand released. The average time from conviction to exoneration is about 10years.24 Looking back across that gap, it is often impossible to determine such
21See supra pp. 933-34.
"Gross et al., Exonerations, supra note 8, at 529, tbl. 1.
23See, e.g., Matthew R. Durose & Patrick A. Langan, Felony Sentences in State Courts, 2000,United States Department of'Justice, Bureau ofJustice Statistics (2003) at 2, tbl. 1.
24Gross et al., Exonerations, supra note 8, at 524.
Frequency and Predictors of False Conviction
things as how the pretrial identification was secured or why the defendantwas suspected in the first place. And that's the easy part. The other side of the
comparison is far worse.The rape exonerations that we know about come from across the entire
country. The U.S. criminal justice system is deeply fragmented. It includesnot only 50 separate states but more than 3,000 counties, most of which have
their own separate courts and prosecutors.25 It would be difficult, at best, to
assemble a representative national sample of rape convictions, and if
somehow we succeeded, we would know almost nothing about them. The
overwhelming majority of rape convictions are obtained by guilty pleas, andgenerate virtually no records that can be retrieved, even in theory: no trial
transcripts, no appeals, frequently no court hearings of any sort, in many
cases no description of the investigation at all beyond a single police report,
which (if it could be found) might include little factual information of anyvalue. The minority of convictions that are based on trial verdicts producemore detailed records-even so, with major gaps-but they are likely to be
highly unrepresentative of the mass of cases.2 6
This lack of data is especially troubling in rape cases, since DNA evi-
dence is useful only in those cases in which the defense claims that the
defendant is not the person who had sex with the victim. That claim is
generally plausible only when the rapist was a stranger to the victim, whichis true in only about a third of all rapes.2 7 (Otherwise, the defense-if there
is one-must be that the alleged victim consented to sex with the defendant
25See, e.g., Steven W. Perry, Prosecutors in State Courts, 2005, United States Department ofJustice, Bureau ofJustice Statistics (2006) at 2.
26Here, again, we have lots of reasons to believe that the small minority of cases that go to trialare systematically different from the majority that are settled by plea bargains, but no hard data.Among the likely differences: tried cases probably have on the whole weaker evidence of guiltthan plea-bargained cases because defendants have little incentive to go to trial when theevidence against them is overwhelming; tried cases probably include a lower proportion ofdefendants with serious criminal records because such defendants are at a disadvantage indefending themselves at trial and face worse consequences if convicted than those withoutrecords; tried cases probably include a higher proportion of heavily aggravated cases because inthose cases prosecutors are less likely to offer meaningful concessions in plea bargaining if theyare willing to bargain at all; and tried cases might include a higher proportion of innocentdefendants because innocent defendants may be reluctant or unwilling to plead guilty evenwhen it is in their self-interest to do so.
"See, e.g., Cathy Maston & Patsy Klaus, Bureau ofJustice Statistics, Criminal Victimization in theUnited States, 2002 Statistical Tables 42, tbl. 29 (2003).
940 Gross and O'Brien
or fabricated the events.) Rape prosecutions might include a higher.propor-tion of stranger rapes but, again, we do not know.
In short, it is easy to see why we know so little about false convictions.We are limited to those few unrepresentative cases that happen to come tolight, we have inadequate information about the underlying investigations inthose cases, and we cannot compare them to correct convictions because weknow even less about the investigations that lead to criminal convictions ingeneral.
D. What Do We Know About False Convictions?
We can make a few generalizations about false convictions. We havealready mentioned the clearest: we do not know how many false convictionsoccur, but it is clear that there are many more false convictions thanexonerations.
As we have mentioned, virtually all the individual exonerations weknow about are in rape and murder cases. It is easy to see why. For rape wehave a unique tool: previously untested DNA can sometimes prove inno-cence beyond doubt. In murder cases we have a unique incentive: becausethe consequences of conviction are so serious, innocent murder defendantsare more likely than other innocent defendants to have the benefit ofextensive postconviction investigations. We do not catch all false convictionsfor rape and murder; we probably do not even catch most of them. Forexample, a majority of postconviction innocence investigations in rape casesgo nowhere because no biological material can be found to use in DNAtesting." Nonetheless, we have found a substantial number of wrongful rapeand murder convictions.
But what about false convictions for other crimes, crimes for whichDNA is of no use and where the stakes are lower than for murder? Robberyis an important example. Like rape, robbery is a crime of violence that isoften committed by strangers, which makes misidentification of the criminala serious risk. In fact, robberies by strangers are several times more commonthan rapes by strangers, so there is every reason to expect that false convic-tions in robbery cases greatly outnumber those in rape cases. But 'withoutDNA to help them, virtually no innocent robbery defendants are exoner-
28See Michael D. Risinger, Conicting the Innocent: An Empirically Justified Factual Wrongful
Conviction Rate, 97J. Crim. & Criminology 701, 777.
Frequency and Predictors of False Conviction
ated.29 And, of course, we rarely even think about wrongful convictions formisdemeanors or nonviolent felonies.
As we mentioned, the major obstacle to useful comparisons between
exonerations and criminal convictions in general is our lack of systematic
information on the conduct of criminal investigations. We do, however, have
quite good information on some demographic traits of the defendants and
the victims, both for exonerations and for comparable criminal cases, and
some of the demographic comparisons we can make suggest factors thatincrease the risk of a wrongful conviction.
Rapes of white women by black men account for well under 10 percent
of all rapes in the United States, but half of all rape exonerations fall in that
category." This stark disparity suggests that prosecutions of interracial rapes
with black defendants are particularly error prone, perhaps because-asmany psychological studies show-white Americans are much more likely to
mistake one African-American stranger for another than to do so with
members of their own race:3
There are comparably strong data on the relationship between age and
false confessions. Steven Drizin and Richard Leo collected information on
2Gross et al., Exonerations, supra note 8, at 529-31. In addition to their greater frequency,
robberies by strangers may be more prone to error than rapes by strangers because the victims
are less likely to have had good opportunities to view the criminals. Id. (The case of AntonioBeaver, who was exonerated in St. Louis in March 2007 is the sort of exception that proves the
rule. Beavers was falsely convicted of first-degree robbery and spent more than 10 years in prison
before he was exonerated by DNA because in that particular robbery the criminal got into ascuffle with the victim and bled in the car he stole, which was later recovered. Heather Ratcliffe,
"This Feels Strange to Have My Freedom," Man Cleared by DNA is Freed, St. Louis Post-Dispatch, Mar. 30, 2007, at Al.)
"According to the Bureau of Justice Statistics' Criminal Victimization in the United States,1996-2002, Table 42 (available at http://www.ojp.usdoj.gov/bjs/abstract/cvusst.htm)-based
on the National Criminal Victimization Survey-black offenders accounted for an average ofapproximately 10 percent of all rapes and sexual assaults of white victims between 1996 and
2002. (The statistic fluctuates from year to year because for each year it is extrapolated from asample of 10 or fewer survey responses.) Another Bureau ofJustice Statistics study, based on the
National Incident-Based Reporting System, reports that in 88 percent of rapes, the victim and
the offender are of the same race, and that the victims of rape are approximately evenly divided
between whites and blacks. Bureau of Justice Statistics, Sex Offenses and Offenders 11 (Feb.1997), available at http://v.rainn.org/Linked%20files/soo.pdf. It follows that the propor-
tion of all rapes that have white victims and black offenders is about 5 to 6 percent.
1C.A. Meissner & J.C. Brigham, Thirty Years of Investigating Own-Race Bias in Memory for
Faces: A Meta-Analysis, 7 Psychol. Pub. Pol'y & L. 3 (2001).
942 Gross and O'Brien
125 proven false confessions, 44 of which led to false convictions; 81 percentof these false confessions were for murder. Of the suspects who falselyconfessed, 35 percent were under the age of 18.32 This is a large overrepre-sentation: fewer than 10 percent of all suspects arrested for murder arejuveniles.33 It suggests, as several researchers have argued,34 that youth is amajor risk factor for false confessions.
On the whole, however, we know little about false convictions. In thesection that follows we add a bit to our knowledge of that unknown continentby examining false convictions in a particularly well-documented class ofcases-death sentences.
II. DEATH PENALTY CASES
Since 1973, 128 U.S. criminal defendants who were sentenced to death havebeen exonerated.3 5 This is a startlingly high number, considering that deathsentences amount to less than one-tenth of 1 percent of prison sentences inthe United States.36 Most likely, this extraordinary number of capital exon-erations is caused in part by a higher underlying error rate among capitalconvictions and in part by a higher rate of detection of those errors afterconviction. It is well known that more resources are devoted to capitaldefense than to other cases, before and after conviction, but it is hard to
2Steven A. Drizin & Richard A. Leo, The Problem of False Confessions in a Post-DNA World, 82N.C. L. Rev. 891, 845, 847 (2004). See also Gross et al., Exonerations, supra note 8, at 544-46.
33See, e.g., Sourcebook of Criminal Justice Statistics 2003 354, 355, available at http://www.albany.edu/sourcebook/pdf/t47.pdf.
34Drizin & Leo, supra note 32, at 847; Gross et al., Exonerations, supra note 8, at 544-46.
' 5Death Penalty Information Center, Innocence: List of Those Freed from Death Row, availableat http://www.deathpenaltyinfo.org/article.php?scid=6&did=1 10.
36Approximately 8 million defendants were sentenced to one year or more in U.S. prisons from1977 through 2004. U.S. Department of Justice, Bureau of Justice Statistics, data available athttp://www.ojp.usdoj.gov/bjs/dtdata.htm#prisoners State Prison Adm 1988-04 & State & FedPrison Adm 1977-2000. The total from these sources is 8,083,645, but it does not include federalprison sentences for 1990-1992 or 2004. In that same period, 6,807 death sentences wereimposed (U.S. Department of Justice, Bureau of Justice Statistics, data available at http://www.ojp.usdoj.gov/bjs/abstract/cpO4.htm), which amounts to 0.085 percent of all prisonsentences.
Frequency and Predictors of False Conviction
believe that better review alone explains the capital exoneration rate.37 If
that were the whole story, it would mean, for example, that if we hadreviewed prison sentences with the same level of care that we devoted to
death sentences, there would have been approximately 87,000 non-death-
row exonerations from 1989 through 2003 rather than the 266 that were
reported in a comprehensive study in 2005.3
The extra care that is devoted to capital cases, both before and after
conviction, is a major asset for researchers. Death sentences, unlike the great
majority of criminal convictions in the United States, are almost all based on
trials; and even the handful of capital defendants who plead guilty are then
subject to trial-like sentencing hearings, usually before juries. All death
sentences are reviewed after conviction, and almost all are reviewed repeat-
edly. With rare exceptions, every capital sentence generates at least one
postconviction legal opinion that is published or available on the Internet; in
most there are two or more available opinions. In general, only a small
fraction of U.S. prisoners are represented by lawyers at any given time, but
most capital defendants have legal representation for all or most of the time
that they remain on death row. And, of course, everybody, from the first
officer on the scene to the Chief Justice of the United States, takes capital
37There are also strong theoretical reasons to expect a higher rate of false convictions in murder
cases generally, and capital murder cases in particular. See Samuel R. Gross, Lost Lives: Mis-
carriages ofJustice in Capital Cases, 61 Law & Contemp. Probs. 123 (1998). For example, it
appears that police and prosecutors identify and bring to trial murder suspects after difficultinvestigations that would not be pursued for less serious crimes. The main likely result is an
increase in the number of accurate convictions, but this practice is also likely to increase thenumber of false capital and noncapital murder convictions because it requires the authorities
pursue difficult cases, where the evidence is less than overwhelming and the risk of error is
substantial.
3 Gross et al., Exonerations, supra note 8, at 532. The number in the text is derived from thenumber of capital exonerations from 1989 through 2003 reported by Gross et al.-74-multiplied by the ratio of prison sentences to death sentences in note 36: 74 x (8,000,000/6,807) = 86,969. Gross et al. made a somewhat different comparison between the currentnumbers of death row defendants and other prisoners as of 2001 and estimated that givensimilar detection rates, the number of non-death-row exonerations in that period would havebeen "over 29,000." They noted, however, that "[t]his is a conservative estimate, since death-sentenced defendants spend more time in prison than the average inmate and therefore are aneven smaller proportion of the total population of defendants who are convicted of felonies andpass through prisons in any given time period." Id. at 532, n.21. The number we report here isbased on the correct comparison-death sentences to "the total population of defendants whoare convicted of felonies and pass through prisons in any given time period"-and, as expected,it is considerably higher than the previous estimate, by a factor of three.
944 Gross and O'Brien
cases more seriously than other criminal prosecutions-and knows that
everybody else will do so as well. The net effect is that capital cases are far
better documented than other criminal cases.
Because so much more is known about death sentences than other
convictions, we can use data on capital exonerations to estimate a lower
bound for the error rate in capital convictions. We can also use these data to
attempt to identify some predictors of such errors.
A. The Capital Exoneration Rate
In 1972, in Furman v. Georgia,39 the Supreme Court invalidated all existing
death penalty statutes. The "modern" use of the death penalty in the UnitedStates dates from the following year, 1973, when the first of the post-Furman
capital sentencing laws went into effect. Death sentences since 1973 are
tracked by the Bureau of Justice Statistics of the Department ofJustice. As aresult, we know that 7,534 people were sentenced to death from 1973
through 2004."o In the same period, 111 defendants were exonerated afterbeing sentenced to death for murder under a post-Furman capital sentencing
statutes, or 1.5 percent of all death sentences.4'
That figure-1.5 percent-is not the final word on exonerations for
the cohort of defendants who have been sentenced to death since 1973, let
alone a reasonable estimate of the rate of false capital convictions. As timepasses, some defendants in this group who have not yet been exonerated will
be; others who are innocent will never be identified. But it is a starting point
for estimating a lower bound for the rate of exoneration in capital cases.Of the 7,534 defendants sentenced to death between 1973 and 2004,
13 percent had been executed as of the end of 2004, 4 percent died of
suicide or natural causes, 41 percent were removed from death row becausetheir capital sentences or the underlying convictions were reversed by onemeans or another, and 42 percent remained on death row.4 2 These various
'Furman v. Georgia, 408 U.S. 238 (1972).
4 Tracy L. Snell: Capital Punishment, 2005, United States Department of Justice, Bureau ofJustice Statistics, NCJ 215083 (2006), at 14, appx. tbl. 2.
4 1These are the cases listed by the Death Penalty Information Center in its "List of Those Freedfrom Death Row," supra note 35, excluding those defendants who were convicted of pre-Funnanmurders, or who were on death row for crimes other than murder.
42Calculated from Snell, supra note 40, at 14, appx. tbl. 2.
Frequency and Predictors of False Conviction
groups are quite differently positioned with respect to the possibility ofexoneration.
Some of those capital defendants who remain on death row will beexonerated in years to come. For those who claim to be innocent, exonera-tion is always a theoretical possibility and sometimes an actual prospect. Thelist of defendants who have been released from death row includes severalwho came within days of execution. On the other hand, defendants who areremoved from death row but not exonerated-typically because their sen-tences are reduced to life imprisonment-no longer receive the extraordi-nary level of attention that is devoted to death row inmates. (This applies aswell to those who die on death row from suicide or natural causes.) If theyare in fact innocent, they are probably much less likely to be exonerated thanif they had remained on death row. In both categories, the count of exon-erations is incomplete, either because the intensive process of detection ofcapital errors is still underway, or because it was abandoned once the threatof execution was removed.43
Of the post-Furman death row inmates who were exonerated between1973 and 2004, 95 percent had been freed within 20 years of their conviction(106/111). Overall, 2,394 death sentences were pronounced in U.S. courtsfrom 1973 through 1984. By 2004, the process of identifying exonerationsfor these 20- to 30-year-old death sentences was largely complete. It resultedin 54 exonerations-almost exactly half of all capital defendants who wereexonerated through 2004-or an exoneration rate of 2.3 percent (54/2,394). Eighty-one percent of capital exonerations occurred within 15 yearsof sentencing (90/111). By the end of 2004 there had been 86 exonerationsamong the 3,792 capital defendants who had been sentenced to deaththrough 1989, at least 15 years earlier, also an exoneration rate of 2.3 percentTwo additional defendants who were sentenced to death before 1990 wereexonerated in 2005, butjudging from the pattern of previous cases, we haveprobably seen almost all the capital exonerations that we will see for defen-dants sentenced to death through 1989. In other words, a good estimate of
4 It might be possible to use the data at our disposal to estimate what the rate of capitalexonerations would be if all death sentences were subject for an indefinite period to the level ofscrutiny that applies to those facing the prospect of execution. Such an estimate would be asignificant step toward estimating the underlying rate of false convictions in capital cases. In thisarticle we undertake a simpler task: to calculate the actual rate of exoneration for deathsentences that are old enough so that the existing process of identifying errors has run itscourse.
946 Gross and O'Brien
the long-term post-Furman capital exonerations rate in the United States is2.3 percent.44
That figure-2.3 percent-is the actual proportion of exonerationsamong death sentences imposed in the United States between 1973 and1989. It may serve as an estimate of the proportion of all death sentencessince 1973 that will eventually result in exonerations, assuming the processesthat produce death sentences and exonerations have not greatly changedsince 1989.
We have estimated the rate of "exonerations," but our focus is wrongfulconvictions. As we use the term, "exoneration" is an official act-a pardon, adismissal, or an acquittal-declaring a defendant not guilty of a crime forwhich he or she had previously been convicted because new evidence ofinnocence that was not presented at trial required reconsideration of thecase. 5 This is in part a substantive definition. It requires new evidence ofinnocence, and we have excluded any case in which there was unexplainedphysical evidence of the defendant's guilt. But "exoneration" is primarily aprocedural concept. The key element is an official statement releasing thedefendant from any liability for the crime for which he was convicted.
Very likely, however, some defendants we count as "exonerated" did infact participate in the crimes for which they were convicted. In our estima-tion, the probability of innocence is high for all of these exonerateddefendants-for many, innocence is beyond dispute-and the number ofmisclassifications low enough to make these exonerations a useful proxy forinnocence. Moreover, for the purpose of estimating the proportion of inno-cent defendants sentenced to death, there are offsetting factors. "Exonera-tion" requires an official act that clears the defendant's record completely.The set of exonerations we analyze excludes several death-sentenced defen-dants who presented strong posttrial evidence of innocence and who wereeventually released after they pled guilty to second-degree murder or other
"This estimate yields a 95 percent confidence interval of 1.7-2.9 percent.
45Our definition of exoneration is the same as that in Gross et al., Exonerations, supra note 8,
at 524. As in Gross et al., we have excluded any case in which a dismissal or an acquittal appearsto have been based on a decision that while the defendant was not guilty of the charges in theoriginal conviction, he did play a role in the crime and may be guilty of some lesser crime thatis based on the same conduct. For our purposes, a defendant who is acquitted of murder onretrial, but convicted of involuntary manslaughter, has not been exonerated. We have alsoexcluded any case in which a dismissal was entered in the absence of strong evidence of factualinnocence, or in which---despite such evidence-there was unexplained physical evidence ofthe defendant's guilt.
Frequency and Predictors of False Conviction
noncapital charges as a result of negotiated compromises with prosecutors.46
It is likely that at least some of these "nonexonerated" defendants who werereleased from death row are actually innocent. And, of course, the set ofexonerated defendants does not include innocent defendants who wereexecuted, nor those who remain on death row, nor the undetected innocentdefendants among the thousands of defendants who have been removedfrom death row but remain in prison.
All things considered, we believe that 2.3 percent-the long-term rateof exoneration of death row inmates-is a conservative estimate of the rateof wrongful death sentences.
There is one other study of false conviction rates that is based in actualcase data, by Professor Michael Risinger, who examined death sentences inrape-murder cases from 1982 through 1989.17 Using DNA exonerations as hismeasure of innocence, Risinger calculates that at least 3.3 percent of defen-dants sentenced to death for rape-murder in that period were innocent,4 8
and he estimates that the true proportion might be about 5 percent.
B. Predicting False Capital Convictions
1. The Data Set: Executions and Capital Exonerations
As we mentioned, a major problem for studying false convictions is obtainingdata on appropriate comparison groups of nonfalse convictions. For capitalcases that is comparatively easy, for reasons already noted. On the otherhand, capital cases appear to be more error prone than other serious felonyconvictions, which means that a comparison group of capital cases mightinclude a higher proportion of undiscovered false convictions than we wouldexpect for other felony convictions. That is particularly true for capitaldefendants who were sentenced to death comparatively recently (who maynot yet have been exonerated), and for those who were removed from deathrow but not freed (who are unlikely to benefit from the special attention tocases that might lead to executions).
46See Death Penalty Information Center, Probable Innocence-Released from Prison, availableat http://ww.deathpenaltyinfo.org/article.php?scid=6&did=l I l#Released.
47Risinger, supra note 28, 778-90.
4 This estimate is based on 11 exonerations out of an estimated 319 capital rape-murders. Risingerallows for a 5 percent possibility of a false DNA exoneration by adjusting the numerator by half anexoneration, to 10.5. This estimate yields a 95 percent confidence interval of 1.3-5.3 percent.
948 Gross and O'Brien
In this section we compare 105 cases of capital defendants who weresentenced to death for murder under post-Furman statutes and exoneratedthrough 2003 to a random sample of 137 of the 885 executions that werecarried out in the same period. We use executions as our comparison groupfor two interrelated reasons.
First, as a group, the cases of executed defendants received a higherlevel of postconviction scrutiny than any other well-defined group of crimi-nal cases.49 With some exceptions, these are cases in which the multilayerprocess of capital review ran its course.5" As a result-while it is all butinevitable that at least some innocent defendants have been put to death inthe United States in the past 25 years-overall, the set of executions probablyincludes a substantially lower proportion of innocent capital defendantsthan those who remain on death row, or those who were removed but notexonerated.
Second, executions and exonerations are the two categories of capitalcases in which all possible proceedings on claims of innocence have beencompleted, one way or the other. For those who were put to death, the legalsystem concluded that there was no evidence of innocence sufficient to stopthe executions. For those who were exonerated, the system determinedthere was sufficient evidence of innocence to require that the defendants becleared and released. It is instructive to see if there are systematic differencesbetween these two groups.
4 Judging from anecdotal evidence, some of this scrutiny operates unobserved, under the radar.For example, one of the authors mentioned the subject of this research to a colleague, whoproceeded to describe a case he handled several years earlier as a Supreme Court clerk. The casewas one of many preexecution petitions for certiorari that the Supreme Court clerk reviewed,but on this one he was worried that the defendant might be innocent. He obtained the trialrecord, which only made him more anxious. To check hisjudgment, the clerk-who consideredhimself a liberal--gave the record to a conservative fellow clerk, who had the same reaction: thisdefendant might well be innocent. So they found a basis to recommend that the Court grantcertiorari (assume jurisdiction of the case) and remand it to the lower court for reconsiderationin light of some other Supreme Court case, and the Court followed their recommendation, amaneuver that would at a minimum add years to the lifespan of the litigation on the defendant'sdeath sentence and possibly sidetrack it permanently. We have no idea how often things like thishappen at the hands of clerks,judges, and prosecutors, up and down the line, but when they dothe effect is to keep some possibly innocent capital defendants from execution without directlyaddressing their guilt or innocence.
50Professor John Blume calculates that approximately 12 percent of those executed between1973 and 2003 waived at least some of their available appeals. John H. Blume, Killing theWilling: "Volunteers," Suicide and Competency, 103 Mich. L. Rev. 939, 1008-09 (2005).
Frequency and Predictors of False Conviction
2. Date and Place of the Crime, and Race of Defendant and Victim
The two sets of cases we compare are quite similar in the dates of both the
crimes and the convictions of the defendants. 51 They are not so closely
matched by location. Some states in this national sample had many
executions-especially Texas (37 percent of the total) and Virginia (7
percent)-but comparatively few exonerations (7 percent and 1 percent,
respectively), and some states had large numbers of exonerations-
especially Illinois (16 percent)-and few executions (1 percent).52
We also collected data on the race of the defendants and the victims in
these two sets of cases. Many post-Furman studies have found that African-American defendants who are convicted of killing white victims are more
likely to be sentenced to death than those convicted of killing minorityvictims,
especially African-American victims.53 We see no evidence that defendantswho are sentenced to death for killing white victims are also, in aggregate,
more likely to be innocent than those sentenced to death for killing minority
victims. The victims were white in comparable proportions in these two sets of
cases, 73 percent of the executions and 77 percent of the exonerations.54
On the other hand, nonwhite defendants are somewhat more common
among the exonerated than among the executed, 61 percent to 50 percent,55
a difference that is due entirely to a higher proportion of exonerations with
nonwhite defendants and white victims-40 percent compared to 27 percent
5"See the Appendix, Tables Al and A2.
5'2See the Appendix, Table A3.
53See David Baldus et al., Racial Discrimination and the Death Penalty in the Post-Furman Era:An Empirical and Legal Overview, with Recent Findings from Philadelphia, 83 Cornell L. Rev.1638 (1998); U.S. General Accounting Office, Death Penalty Sentencing: Research IndicatesPattern of Racial Disparities (1990); David Baldus et al., Equal Justice and the Death Penalty: ALegal and Empirical Analysis (1990); Samuel R. Gross & Robert Mauro, Death & Discrimina-tion, Racial Disparities in Capital Sentencing (1989).
54X2 (1, N= 225) = 0.32, p= 0.57. See the Appendix, Table A4. Data from the NAACP LegalDefense and Educational Fund show that 81 percent of all executions in this time period werefor white victim homicides, a proportion that is within a few percent of that for exonerations ofnonwhite capital defendants-as is the proportion for executions in our sample-but higherrather than lower. See the Appendix, Table A5.
55X2(1 , N= 242) = 1.37, p= .08. See the Appendix, Table A4.
950 Gross and O'Brien
for executions.56 It is possible that nonwhite defendants who are sentencedto death for killing white victims are more likely to be innocent than otherdeath-sentenced defendants, but the difference is comparatively small andwe are not confident that it reflects a genuine causal pattern.
3. The Limitations of These Data
Despite the advantages of comparing capital exonerations and executions,the inferences we can draw are severely limited in two respects. First, we haveonly imperfect information about the cases we consider. Second, the caseswe consider represent only two of several possible outcomes of capital pros-ecutions. As a result, apparent differences (or similarities) may be mislead-ing. A couple of comparisons will illustrate these limitations.
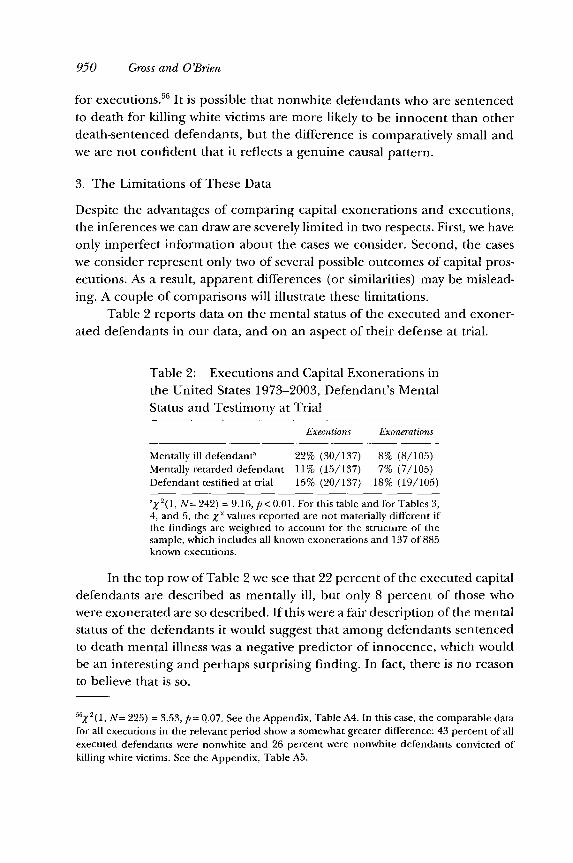
Table 2 reports data on the mental status of the executed and exoner-ated defendants in our data, and on an aspect of their defense at trial.
Table 2: Executions and Capital Exonerations inthe United States 1973-2003, Defendant's MentalStatus and Testimony at Trial
Executions Exonerations
Mentally ill defendanta 22% (30/137) 8% (8/105)Mentally retarded defendant 11% (15/137) 7% (7/105)Defendant testified at trial 15% (20/137) 18% (19/105)
a.2(1, N- 242) = 9.16, p < 0.01. For this table and for Tables 3,4, and 5, the X2 values reported are not materially different ifthe findings are weighted to account for the structure of thesample, which includes all known exonerations and 137 of 885known executions.
In the top row of Table 2 we see that 22 percent of the executed capitaldefendants are described as mentally ill, but only 8 percent of those whowere exonerated are so described. If this were a fair description of the mentalstatus of the defendants it would suggest that among defendants sentencedto death mental illness was a negative predictor of innocence, which wouldbe an interesting and perhaps surprising finding. In fact, there is no reasonto believe that is so.
6X2( 1, N= 225) = 3.53, p= 0.07. See the Appendix, Table A4. In this case, the comparable data
for all executions in the relevant period show a somewhat greater difference: 43 percent of allexecuted defendants were nonwhite and 26 percent were nonwhite defendants convicted ofkilling white victims. See the Appendix, Table A5.
Frequency and Predictors of False Conviction
We do not actually know which of these defendants are, or were,mentally ill, and which were not. That would require data from psychiatricexaminations of all the defendants, in both categories. As far as we know, suchdata do not exist; in any event we do not have them. Our data are limited tofacts that are mentioned in the records of the cases that are available frompublished sources or on the Internet. The count of defendants who are listedas "mentally ill" is actually a count of cases in which evidence of mental illnessis reported in the documents available to us. In some cases, reports of mentalillness may be inaccurate, but that is not the main problem. The real difficultyis that the production of these reports-accurate or inaccurate-is likely to bebiased in a manner that is associated with the outcome of the case.
In 1986, in Ford v. Wainwright,57 the Supreme Court held that theConstitution prohibits the execution of prisoners who are insane at thetime their death sentence is to be carried out. This was not a new rule. TheCourt noted that even before its decision, "no State in the Union permit-[ted] the execution of the insane."58 As a result, defense attorneys had astrong incentive throughout the period of our study to produce evidence ofmental illness, if available, for those prisoners who were approachingexecution, a group that includes all those who were in fact executed, butonly a fraction of those who were exonerated. That difference in incentivescould easily explain the pattern in our data. By contrast, mental retardationonly became a legal obstacle to execution in 2003 with Atkins v. Virginia,59
at the very end of the period we studied. Not surprisingly, as the second rowof Table 2 shows, reports of mental retardation are less common amongthese death-sentenced defendants than reports of mental illness, and whilethey are more common among the executions than the exonerations, thedifference is smaller than for reports of insanity (11 percent and 7 percent,respectively).
The bottom row of Table 2 illustrates a more fundamental problem.The reported data show that equivalent proportions of executed and exon-erated defendants testified at trial, 15 percent and 18 percent. Whether thedefendant testified is a major and readily observable feature of a capital trial.It is usually explicitly mentioned, one way or the other, in the opinions, news
57477 U.S. 399 (1986).
-SId. at 408.
59536 U.S. 304 (2003).
952 Gross and O'Brien
stories, and other documents describing these cases, and there is no reasonto believe that the availability of data on this variable is biased in any mannerthat reflects the outcome of the case. As a result, we are not greatly con-cerned about the completeness or the accuracy of our data on this item.
However, do these data mean that testimony by the defendant has novalue as predictor of innocence in a capital case? That probably depends onthe context. Among cases in which the defendants were sentenced to death,that appears to be true. That is what the data show, at least if executions area good proxy for all death sentences. But among the entire set of capitalcases that go to trial the picture might be entirely different. It is possible-probable-that innocent capital defendants are considerably more likelythan guilty ones to testify at trial. It may also be that innocent capitaldefendants who do testify at trial-perhaps all capital defendants who testifyat trial-are less likely to be convicted than those who do not or, if convicted,less likely to be sentenced to death. The net effect might be that innocentcapital defendants are more likely to testify than guilty ones, and as a resultmore likely to avoid death sentences, but that among those who are sen-tenced to death, equivalent proportions testified (which is all these datashow). If so, testimony by the defendant would be a predictor of innocenceat trial, but not a good predictor of exoneration for defendants who areconvicted and sentenced to death.
We report a handful of findings that are comparatively immune to theproblems we have discussed. We confine ourselves to reliable data that werenot generated by the process of capital litigation itself because they describebasic facts about the crime and the initial investigation. Several variablesemerge as likely predictors of false conviction in capital cases, but we cannotbegin to provide a general description of the process. that produces theseerrors.
4. Possible Predictors of False Capital Convictions
a. The Crime-Number of victims. Only a minority of capital murders involve
more than two killings, but they are, obviously, among the most aggravated.Nineteen percent of the executions in our sample are in this group, but only8 percent of the exonerations. This may be due to a difference in theavailable evidence: the more dead bodies, the easier it may be to identify thekiller or killers, which could lead to fewer errors at trial. On the other hand,part or all of the difference may simply reflect a higher likelihood that adeath-sentenced defendant who killed three or more victims will be
Frequency and Predictors of False Conviction
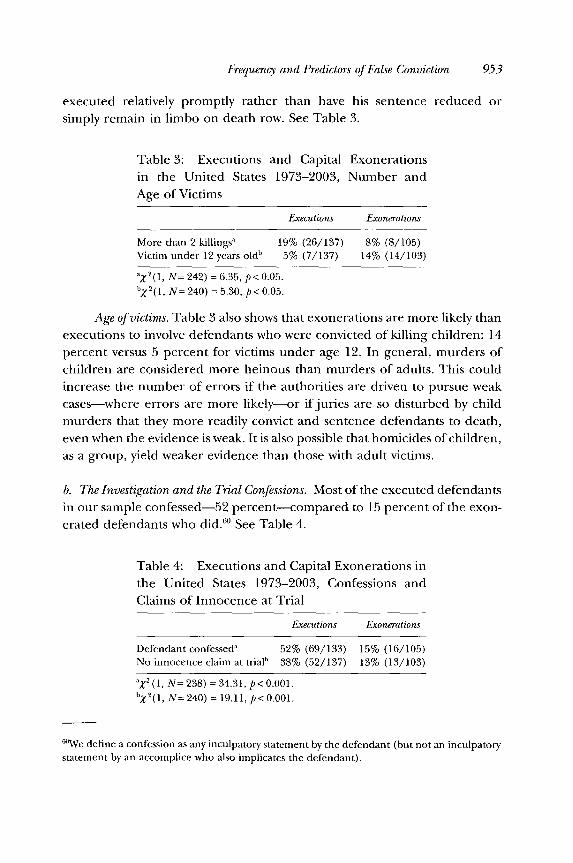
executed relatively promptly rather than have his sentence reduced orsimply remain in limbo on death row. See Table 3.
Table 3: Executions and Capital Exonerationsin the United States 1973-2003, Number andAge of Victims
Executions Exonerations
More than 2 killings' 19% (26/137) 8% (8/105)Victim under 12 years old' 5% (7/137) 14% (14/103)
a.2(1, N= 242) = 6.35, p < 0.05.bX
2(1, N= 240) = 5.30, p< 0.05.
Age of victims. Table 3 also shows that exonerations are more likely thanexecutions to involve defendants who were convicted of killing children: 14percent versus 5 percent for victims under age 12. In general, murders ofchildren are considered more heinous than murders of adults. This couldincrease the number of errors if the authorities are driven to pursue weakcases-where errors are more likely-or if juries are so disturbed by childmurders that they more readily convict and sentence defendants to death,even when the evidence is weak. It is also possible that homicides of children,as a group, yield weaker evidence than those with adult victims.
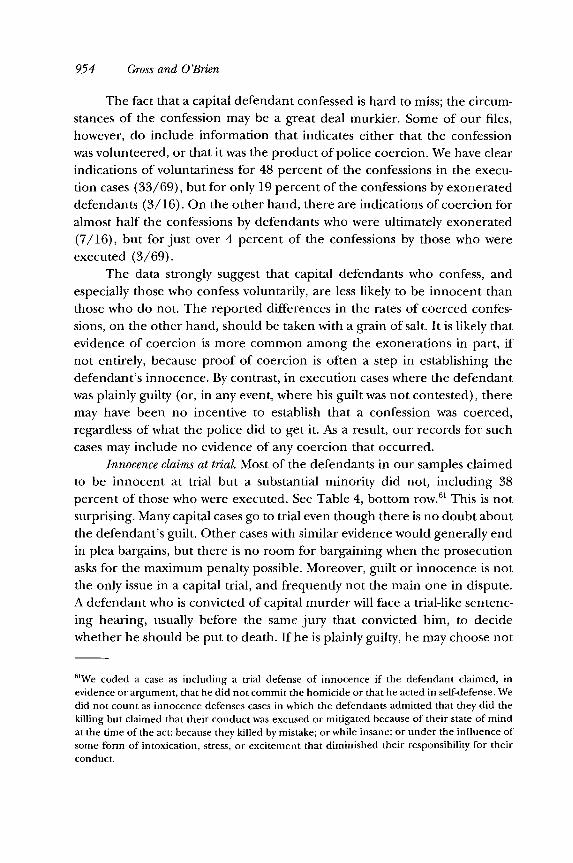
b. The Investigation and the Trial Confessions. Most of the executed defendantsin our sample confessed-52 percent-compared to 15 percent of the exon-erated defendants who did.6" See Table 4.
Table 4: Executions and Capital Exonerations inthe United States 1973-2003, Confessions andClaims of Innocence at Trial
Executions Exonerations
Defendant confessed 52% (69/133) 15% (16/105)No innocence claim at trial' 38% (52/137) 13% (13/103)
a.2 (1, N= 238) = 34.31, p< 0.001.
bX2
(1, N= 240) = 19.11, p< 0.001.
'We define a confession as any inculpatory statement by the defendant (but not an inculpatorystatement by an accomplice who also implicates the defendant).
954 Gross and O'Brien
The fact that a capital defendant confessed is hard to miss; the circum-stances of the confession may be a great deal murkier. Some of our files,however, do include information that indicates either that the confessionwas volunteered, or that it was the product of police coercion. We have clearindications of voluntariness for 48 percent of the confessions in the execu-tion cases (33/69), but for only 19 percent of the confessions by exonerateddefendants (3/16). On the other hand, there are indications of coercion foralmost half the confessions by defendants who were ultimately exonerated(7/16), but for just over 4 percent of the confessions by those who wereexecuted (3/69).
The data strongly suggest that capital defendants who confess, andespecially those who confess voluntarily, are less likely to be innocent thanthose who do not. The reported differences in the rates of coerced confes-sions, on the other hand, should be taken with a grain of salt. It is likely thatevidence of coercion is more common among the exonerations in part, ifnot entirely, because proof of coercion is often a step in establishing thedefendant's innocence. By contrast, in execution cases where the defendantwas plainly guilty (or, in any event, where his guilt was not contested), theremay have been no incentive to establish that a confession was coerced,regardless of what the police did to get it. As a result, our records for suchcases may include no evidence of any coercion that occurred.
Innocence claims at trial. Most of the defendants in our samples claimedto be innocent at trial but a substantial minority did not, including 38percent of those who were executed. See Table 4, bottom row61 This is notsurprising. Many capital cases go to trial even though there is no doubt aboutthe defendant's guilt. Other cases with similar evidence would generally endin plea bargains, but there is no room for bargaining when the prosecutionasks for the maximum penalty possible. Moreover, guilt or innocence is notthe only issue in a capital trial, and frequently not the main one in dispute.A defendant who is convicted of capital murder will face a trial-like sentenc-ing hearing, usually before the same jury that convicted him, to decidewhether he should be put to death. If he is plainly guilty, he may choose not
65We coded a case as including a trial defense of innocence if the defendant claimed, inevidence or argument, that he did not commit the homicide or that he acted in self-defense. Wedid not count as innocence defenses cases in which the defendants admitted that they did thekilling but claimed that their conduct was excused or mitigated because of their state of mindat the time of the act: because they killed by mistake; or while insane; or under the influence ofsome form of intoxication, stress, or excitement that diminished their responsibility for theirconduct.
Frequency and Predictors of False Conviction
to contest the inevitable finding of guilt to avoid the risk of alienating thatjury.
62
On the other hand, as with confessions, a far smaller proportion ofthe exonerated defendants failed to claim innocence at trial: 13 percent,about a third the rate for those who were executed. This is what one wouldexpect. Those who are innocent are more likely to insist on their inno-cence, and not just out of a sense of injustice. They are more likely to havecredible evidence of innocence to offer, and such evidence (if plausible)can be helpful at both phases of a capital trial. Rather than underminingthe defendant's position on penalty, it can persuade jurors to sentence thedefendant to life imprisonment rather than death even if it fails to per-suade them to acquit.6 3 Of course, as our exoneration cases illustrate, itdoes not always work. Some innocent defendants are both convicted andsentenced to death. What these data show is that among defendants who aresentenced to death, those who actively contested their guilt at trial are morelikely to be innocent than those who did not." All the same, it is noteworthythat a substantial minority of exonerated capital defendants did not activelydispute their guilt at trial.
6 See, e.g., Florida v. Nixon, 543 U.S. 175, 191 (2004) (citations omitted, brackets in original):"Attorneys representing capital defendants face daunting challenges in developing trial strate-gies, not least because the defendant's guilt is often clear. Prosecutors are more likely to seek thedeath penalty, and to refuse to accept a plea to a life sentence, when the evidence is overwhelm-ing and the crime heinous.... In such cases, 'avoiding execution [may be] the best and onlyrealistic result possible.' . . . Counsel therefore may reasonably decide to focus on the trial'spenalty phase, at which time counsel's mission is to persuade the trier that his client's life shouldbe spared. Unable to negotiate a guilty plea in exchange for a life sentence, defense counselmust strive at the guilt phase to avoid a counterproductive course."
6 Thus, for example, in a major study of decision making by capital sentencing juries, WilliamBowers and colleagues found that even after conviction, doubt about the defendant's guilt wasthe most influential factor in persuading juries to not sentence the defendant to death. J.Bowers et al., Jurors' Predispositions, Guilt-Trial Experience, and Premature Decision Making,83 Cornell L. Rev. 1476, 1534 (1998) ("By far, the strongest mitigating factor was lingeringdoubt, the one that read, 'Although the evidence was sufficient for a capital murder conviction,you had some lingering doubt that (the defendant) was the actual killer'.").
64Among the executed defendants, 49 percent of those who confessed claimed to be innocentat trial, compared to 80 percent of those who did not confess (X 2(1, N= 133) = 12.03, p < 0.001,corrected for continuity). Among the exonerated defendants in our sample this relationship isweaker and could be due to chance: 75 percent of those who confessed put on a defense ofinnocence at trial, compared to 90 percent of those who did not confess (X2 (1, N= 103) = 1.42,p= 0.2 3 , corrected for continuity). This difference is not surprising, since the confessions bythose who were later exonerated are now known to be false.
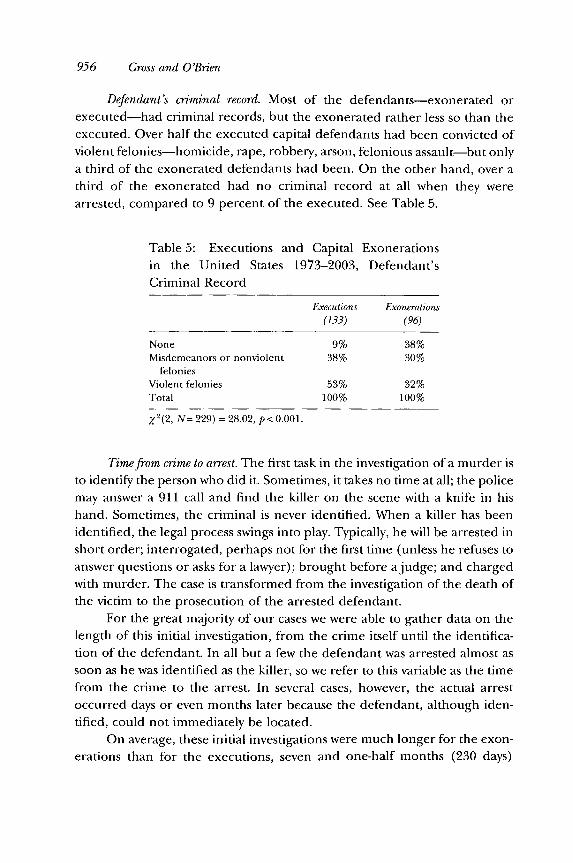
956 Gross and O'Brien
Defendant's criminal record. Most of the defendants-exonerated orexecuted-had criminal records, but the exonerated rather less so than theexecuted. Over half the executed capital defendants had been convicted of
violent felonies-homicide, rape, robbery, arson, felonious assault-but only
a third of the exonerated defendants had been. On the other hand, over athird of the exonerated had no criminal record at all when they were
arrested, compared to 9 percent of the executed. See Table 5.
Table 5: Executions and Capital Exonerations
in the United States 1973-2003, Defendant's
Criminal Record
Executions Exonerations(133) (96)
None 9% 38%Misdemeanors or nonviolent 38% 30%
feloniesViolent felonies 53% 32%Total 100% 100%
X2 (2, N= 229) = 28.02, p< 0.001.
Time from crime to arrest. The first task in the investigation of a murder isto identify the person who did it. Sometimes, it takes no time at all; the policemay answer a 911 call and find the killer on the scene with a knife in his
hand. Sometimes, the criminal is never identified. When a killer has beenidentified, the legal process swings into play. Typically, he will be arrested in
short order; interrogated, perhaps not for the first time (unless he refuses toanswer questions or asks for a lawyer); brought before a judge; and chargedwith murder. The case is transformed from the investigation of the death of
the victim to the prosecution of the arrested defendant.For the great majority of our cases we were able to gather data on the
length of this initial investigation, from the crime itself until the identifica-
tion of the defendant. In all but a few the defendant was arrested almost as
soon as he was identified as the killer, so we refer to this variable as the timefrom the crime to the arrest. In several cases, however, the actual arrest
occurred days or even months later because the defendant, although iden-
tified, could not immediately be located.On average, these initial investigations were much longer for the exon-
erations than for the executions, seven and one-half months (230 days)
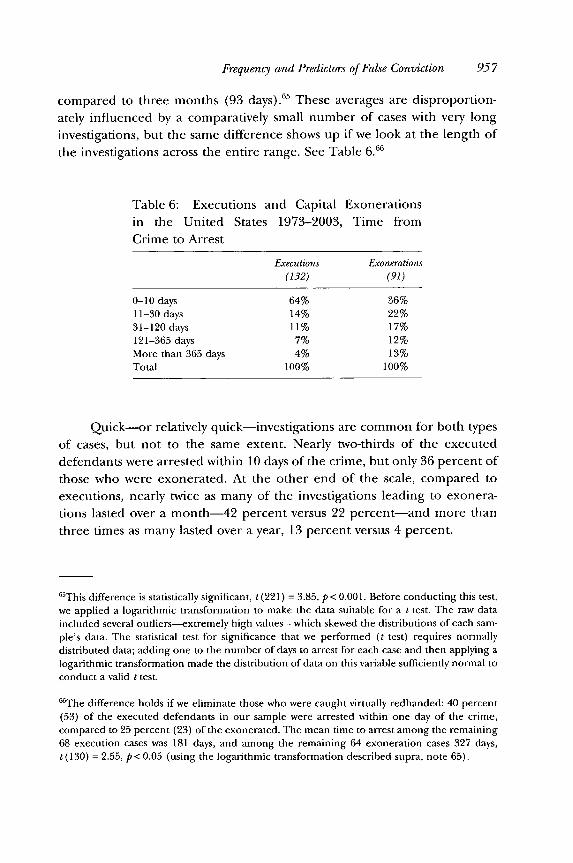
Frequency and Predictors of False Conviction
compared to three months (93 days).6 5 These averages are disproportion-
ately influenced by a comparatively small number of cases with very long
investigations, but the same difference shows up if we look at the length of
the investigations across the entire range. See Table 6.66
Table 6: Executions and Capital Exonerations
in the United States 1973-2003, Time from
Crime to Arrest
Executions Exonerations
(132) (91)
0-10 days 64% 36%11-30 days 14% 22%31-120 days 11% 17%121-365 days 7% 12%More than 365 days 4% 13%Total 100% 100%
Quick-or relatively quick-investigations are common for both types
of cases, but not to the same extent. Nearly two-thirds of the executed
defendants were arrested within 10 days of the crime, but only 36 percent of
those who were exonerated. At the other end of the scale, compared to
executions, nearly twice as many of the investigations leading to exonera-
tions lasted over a month-42 percent versus 22 percent-and more than
three times as many lasted over a year, 13 percent versus 4 percent.
65This difference is statistically significant, t (221) = 3.85, p < 0.001. Before conducting this test,
we applied a logarithmic transformation to make the data suitable for a t test. The raw dataincluded several outliers-extremely high values-which skewed the distributions of each sam-ple's data. The statistical test for significance that we performed (t test) requires normallydistributed data; adding one to the number of days to arrest for each case and then applying alogarithmic transformation made the distribution of data on this variable sufficiently normal toconduct a valid t test.
'The difference holds if we eliminate those who were caught virtually redhanded: 40 percent(53) of the executed defendants in our sample were arrested within one day of the crime,compared to 25 percent (23) of the exonerated. The mean time to arrest among the remaining68 execution cases was 181 days, and among the remaining 64 exoneration cases 327 days,t (130) = 2.55, p < 0.05 (using the logarithmic transformation described supra, note 65).
958 Gross and O'Brien
III. CONCLUSION: SOME EARLY FINDINGS
Our main message is gloomy. We do not know much about false convictions,and it will be difficult to learn more. Almost everything that we do know isbased on information about exonerations, and it is clear that exonerationsare highly unrepresentative of wrongful convictions in general. The mainthing we can safely conclude from exonerations is that there are many otherfalse convictions that we have not discovered. In addition, a couple of strongdemographic patterns appear to be reliable: black men accused of rapingwhite women face a greater risk of false conviction than other rape defen-dants; and young suspects, those under 18, are at greater risk of false con-fession than other suspects.
Since 1989, almost all the exonerations that we know about have been
in three categories: rape convictions because of postconviction DNA testing;murder convictions-and especially death sentences-which are sometimessubjected to detailed postconviction reinvestigation; and drug and gun pos-session convictions that were produced by concerted programs of policeperjury that later unraveled. At least two of these categories present possi-bilities for useful research on wrongful convictions.
Rape cases offer the most promising opportunity. The Virginia Depart-ment of Forensic Science is in the process of conducting DNA tests onhundreds of untested biological samples from closed rape files from the 1970s
and early 1980s.6 7 That project may provide the first data ever on the fre-quency and characteristics of false convictions in a reasonably representativesample of investigations of a particular crime. If other DNA archives are foundelsewhere, it may be possible to extend that research beyond Virginia.
We can also learn something about false convictions by carefully exam-ining data on death sentences, which are much better documented than
most other criminal cases, and for which it appears that a substantial pro-portion of all false convictions are discovered. We attempt to do that in thisarticle, and have a modest collection of findings to report.
First, we calculate that approximately 2.3 percent of death-sentenceddefendants in the United States are exonerated. The rate of wrongful con-victions among death sentences is almost certainly greater than 2.3 percent,but that figure is already far higher than the rate of exoneration for anyother category of criminal conviction. If defendants who were sentenced to
67See supra, note 18.
Frequency and Predictors of False Conviction
prison had been exonerated at the same rate as those who were sentenced todeath, there would have been nearly 87,000 non-death-row exonerations inthe United States from 1989 through 2003, rather than the 266 that wereactually reported.
Second, we compare capital exonerations to executions and attempt toidentify predictors of wrongful capital conviction. We recognize the limita-tions of these comparisons, both because we have incomplete and unevendata on the cases we consider, and because we have no data whatever onsuspects who were not charged with capital crimes, or capital defendants whowere not sentenced to death, or those who were sentenced to death but who,as of the end 2003, had neither been executed nor exonerated but remainedon death row or in prison under reduced sentences. Nonetheless, we founda few patterns worth reporting.
By comparison to executions, capital exonerations are less common for
defendants convicted of murdering more than two victims, and morecommon for those convicted of murdering children. These patterns couldreflect real differences in the quality of the evidence and the likelihood oferror based on the age and number of victims, or they could be artifacts of
other differences. For example, the comparatively lower exoneration rateamong multiple murder cases may simply mean that defendants who areconvicted of killing more than two victims are less likely than others to lingeron death row or have their death sentences reduced.
Capital exonerations appear to be more common among cases inwhich the investigation of the crime was unusually difficult, or wherecommon items of direct or circumstantial evidence of guilt were missing. Wesee this pattern for several items.
* Exonerated defendants were much less likely than executeddefendants to have serious criminal records. We might wellhave predicted the opposite: that the police would attach too
much weight to a suspect's violent history and pursue weak andsometimes false cases against plausible-seeming suspects who hadcommitted other crimes. That probably happens in some cases,but proceeding against a capital defendant with no criminalhistory appears to be a greater danger: such cases are much morecommon among exonerations than executions, 38 percent versus 9percent.
* Confessions are three-and-a-half times as common among theexecuted as the exonerated, 52 percent to 15 percent. This is no
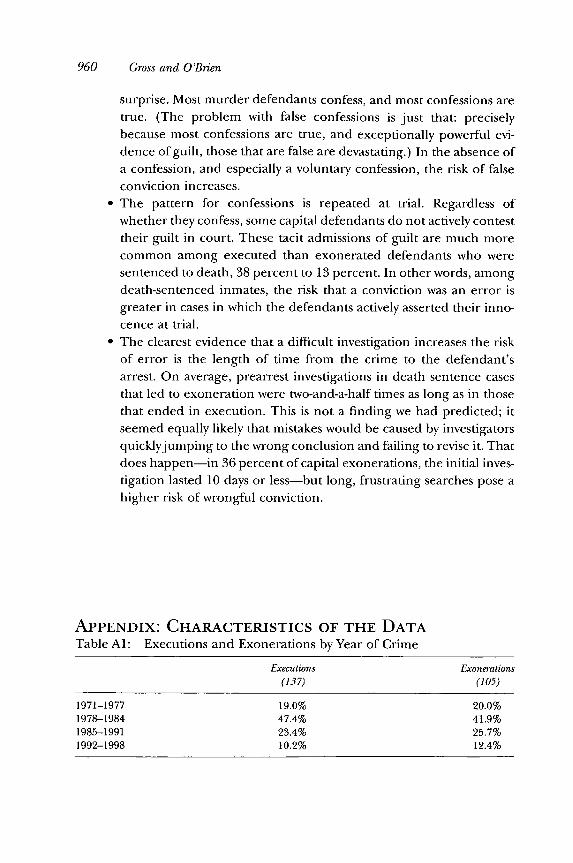
960 Gross and O'Brien
surprise. Most murder defendants confess, and most confessions aretrue. (The problem with false confessions is just that: preciselybecause most confessions are true, and exceptionally powerful evi-dence of guilt, those that are false are devastating.) In the absence ofa confession, and especially a voluntary confession, the risk of falseconviction increases.The pattern for confessions is repeated at trial. Regardless ofwhether they confess, some capital defendants do not actively contesttheir guilt in court. These tacit admissions of guilt are much morecommon among executed than exonerated defendants who weresentenced to death, 38 percent to 13 percent. In other words, amongdeath-sentenced inmates, the risk that a conviction was an error isgreater in cases in which the defendants actively asserted their inno-cence at trial.
" The clearest evidence that a difficult investigation increases the riskof error is the length of time from the crime to the defendant'sarrest. On average, prearrest investigations in death sentence casesthat led to exoneration were two-and-a-half times as long as in thosethat ended in execution. This is not a finding we had predicted; itseemed equally likely that mistakes would be caused by investigatorsquicklyjumping to the wrong conclusion and failing to revise it. Thatdoes happen-in 36 percent of capital exonerations, the initial inves-tigation lasted 10 days or less-but long, frustrating searches pose ahigher risk of wrongful conviction.
APPENDIX: CHARACTERISTICS OF THE DATATable AI: Executions and Exonerations by Year of Crime
Executions Exonerations
(137) (105)
1971-1977 19.0% 20.0%1978-1984 47.4% 41.9%1985-1991 23.4% 25.7%1992-1998 10.2% 12.4%
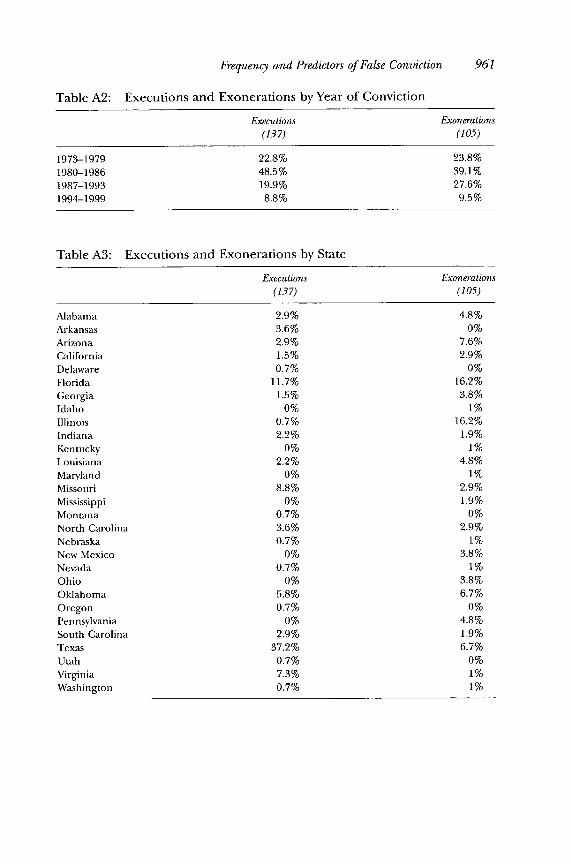
Frequency and Predictors of False Conviction 961
Table A2: Executions and Exonerations by Year of Conviction
Executions Exonerations
(137) (105)
1973-1979 22.8% 23.8%1980-1986 48.5% 39.1%
1987-1993 19.9% 27.6%1994-1999 8.8% 9.5%
Table A3: Executions and Exonerations by State
Executions Exonerations
(137) (105)
Alabama 2.9%Arkansas 3.6%Arizona 2.9%California 1.5%Delaware 0.7%Florida 11.7%Georgia 1.5%Idaho 0%Illinois 0.7%Indiana 2.2%Kentucky 0%Louisiana 2.2%Maryland 0%Missouri 8.8%Mississippi 0%Montana 0.7%North Carolina 3.6%Nebraska 0.7%New Mexico 0%Nevada 0.7%Ohio 0%Oklahoma 5.8%Oregon 0.7%Pennsylvania 0%South Carolina 2.9%Texas 37.2%
Utah 0.7%Virginia 7.3%Washington 0.7%
4.8%0%
7.6%2.9%
0%16.2%
3.8%1%
16.2%1.9%
1%4.8%
1%2.9%1.9%
0%2.9%
1%3.8%
1%3.8%6.7%
0%4.8%1.9%6.7%
0%1%1%
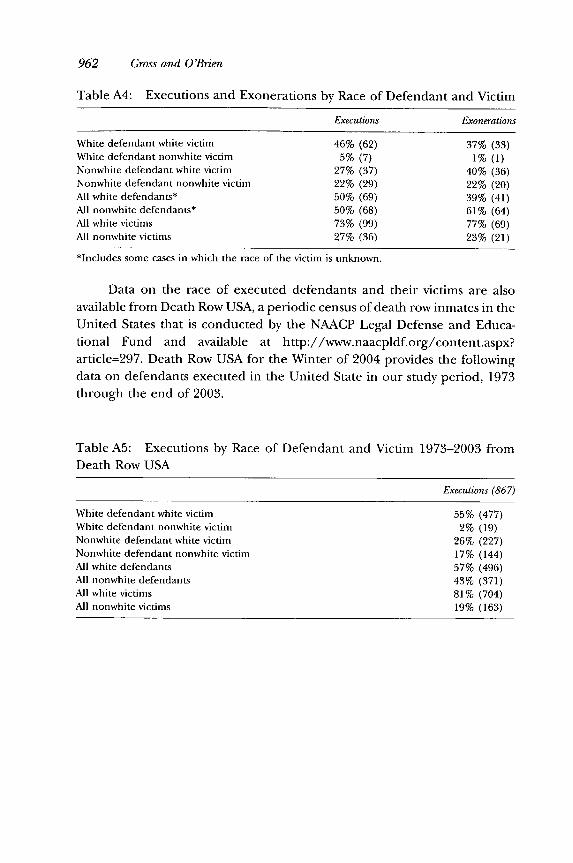
962 Gross and O'Brien
Table A4: Executions and Exonerations by Race of Defendant and Victim
Executions Exonerations
White defendant white victim 46% (62) 37% (33)
White defendant nonwhite victim 5% (7) 1% (1)Nonwhite defendant white victim 27% (37) 40% (36)Nonwhite defendant nonwhite victim 22% (29) 22% (20)
All white defendants* 50% (69) 39% (41)All nonwhite defendants* 50% (68) 61% (64)All white victims 73% (99) 77% (69)All nonwhite victims 27% (36) 23% (21)
*Includes some cases in which the race of the victim is unknown.
Data on the race of executed defendants and their victims are alsoavailable from Death Row USA, a periodic census of death row inmates in theUnited States that is conducted by the NAACP Legal Defense and Educa-
tional Fund and available at http://www.naacpldf.org/content.aspx?article=297. Death Row USA for the Winter of 2004 provides the following
data on defendants executed in the United State in our study period, 1973
through the end of 2003.
Table A5: Executions by Race of Defendant and Victim 1973-2003 fromDeath Row USA
Executions (867)
White defendant white victim 55% (477)
White defendant nonwhite victim 2% (19)Nonwhite defendant white victim 26% (227)Nonwhite defendant nonwhite victim 17% (144)All white defendants 57% (496)All nonwhite defendants 43% (371)All white victims 81% (704)All nonwhite victims 19% (163)