Embed Size (px)
Citation preview
7/29/2019 Frequency Distributions, Poisson
http://slidepdf.com/reader/full/frequency-distributions-poisson 1/7
Frequency distributions- Grouped data
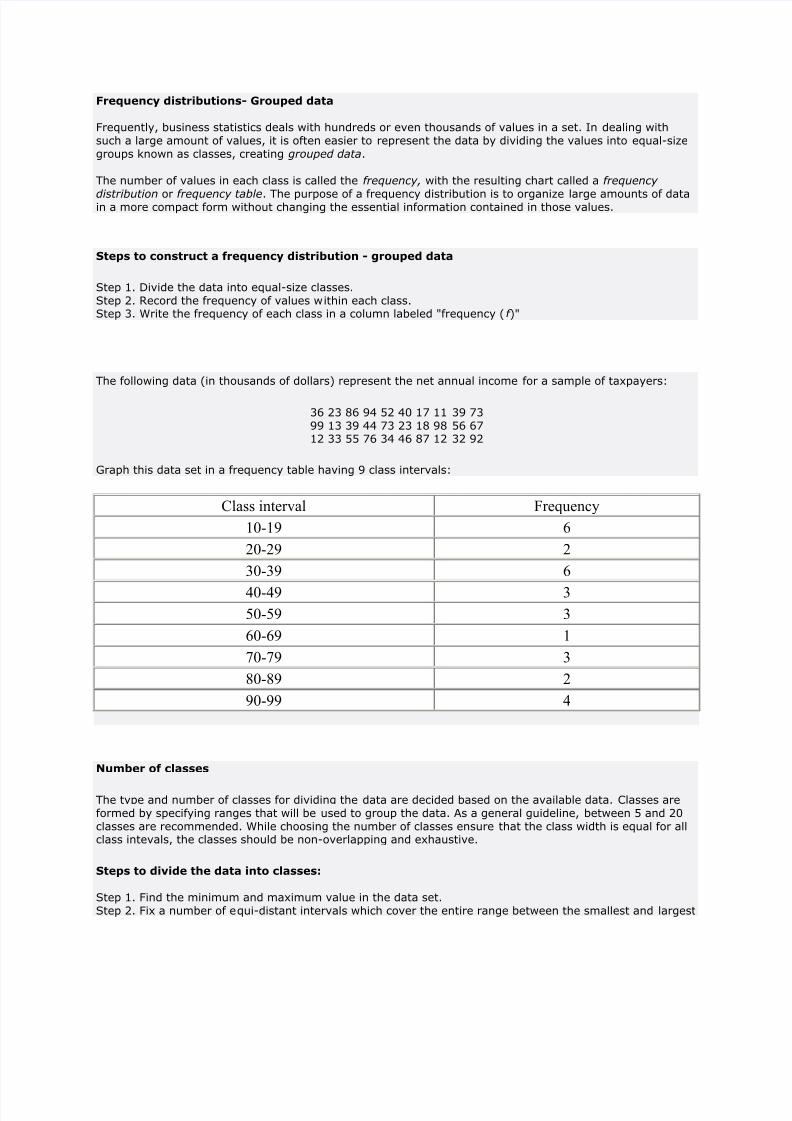
Frequently, business statistics deals with hundreds or even thousands of values in a set. In dealing withsuch a large amount of values, it is often easier to represent the data by dividing the values into equal-sizegroups known as classes, creating grouped data.
The number of values in each class is called the frequency, with the resulting chart called a frequency
distribution or frequency table. The purpose of a frequency distribution is to organize large amounts of datain a more compact form without changing the essential information contained in those values.
Steps to construct a frequency distribution - grouped data
Step 1. Divide the data into equal-size classes.Step 2. Record the frequency of values within each class.Step 3. Write the frequency of each class in a column labeled "frequency ( f )"
The following data (in thousands of dollars) represent the net annual income for a sample of taxpayers:
36 23 86 94 52 40 17 11 39 7399 13 39 44 73 23 18 98 56 6712 33 55 76 34 46 87 12 32 92
Graph this data set in a frequency table having 9 class intervals:
Class interval Frequency
10-19 6
20-29 2
30-39 6
40-49 3
50-59 3
60-69 1
70-79 3
80-89 2
90-99 4
Number of classes
The type and number of classes for dividing the data are decided based on the available data. Classes areformed by specifying ranges that will be used to group the data. As a general guideline, between 5 and 20classes are recommended. While choosing the number of classes ensure that the class width is equal for allclass intevals, the classes should be non-overlapping and exhaustive.
Steps to divide the data into classes:
Step 1. Find the minimum and maximum value in the data set.Step 2. Fix a number of equi-distant intervals which cover the entire range between the smallest and largest
7/29/2019 Frequency Distributions, Poisson
http://slidepdf.com/reader/full/frequency-distributions-poisson 2/7
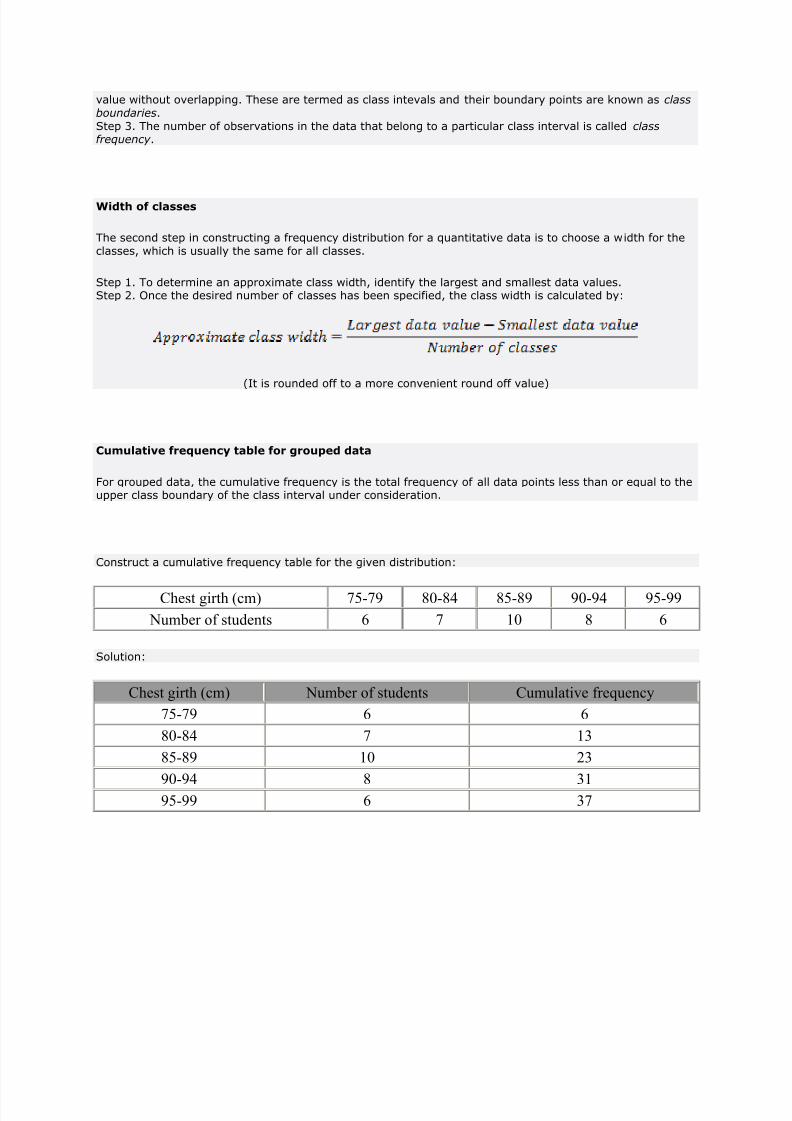
value without overlapping. These are termed as class intevals and their boundary points are known as classboundaries.Step 3. The number of observations in the data that belong to a particular class interval is called classfrequency .
Width of classes
The second step in constructing a frequency distribution for a quantitative data is to choose a width for theclasses, which is usually the same for all classes.
Step 1. To determine an approximate class width, identify the largest and smallest data values.Step 2. Once the desired number of classes has been specified, the class width is calculated by:
(It is rounded off to a more convenient round off value)
Cumulative frequency table for grouped data
For grouped data, the cumulative frequency is the total frequency of all data points less than or equal to theupper class boundary of the class interval under consideration.
Construct a cumulative frequency table for the given distribution:
Chest girth (cm) 75-79 80-84 85-89 90-94 95-99
Number of students 6 7 10 8 6
Solution:
Chest girth (cm) Number of students Cumulative frequency
75-79 6 6
80-84 7 13
85-89 10 23
90-94 8 3195-99 6 37
7/29/2019 Frequency Distributions, Poisson
http://slidepdf.com/reader/full/frequency-distributions-poisson 3/7
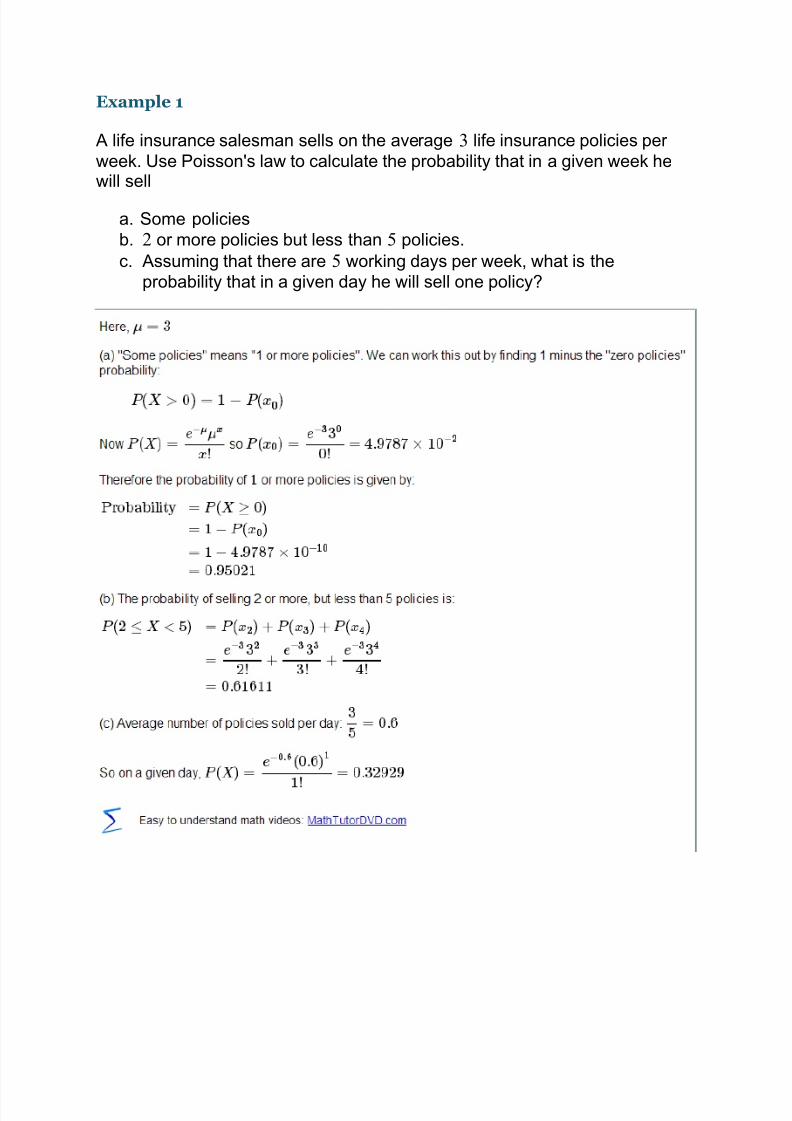
Example 1
A life insurance salesman sells on the average 3 life insurance policies per
week. Use Poisson's law to calculate the probability that in a given week hewill sell
a. Some policies
b. 2 or more policies but less than 5 policies.
c. Assuming that there are 5 working days per week, what is the
probability that in a given day he will sell one policy?
7/29/2019 Frequency Distributions, Poisson
http://slidepdf.com/reader/full/frequency-distributions-poisson 4/7
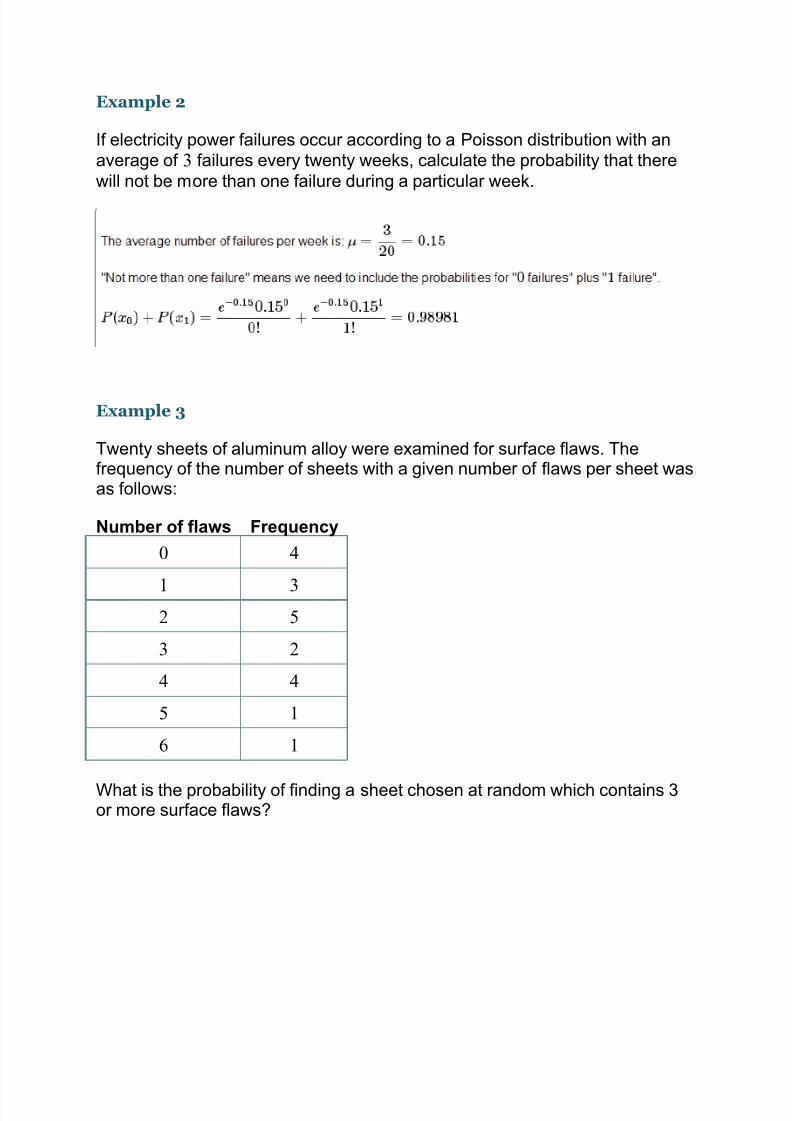
Example 2
If electricity power failures occur according to a Poisson distribution with an
average of 3 failures every twenty weeks, calculate the probability that there
will not be more than one failure during a particular week.
Example 3
Twenty sheets of aluminum alloy were examined for surface flaws. Thefrequency of the number of sheets with a given number of flaws per sheet wasas follows:
Number of flaws Frequency
0 4
1 3
2 5
3 2
4 4
5 1
6 1
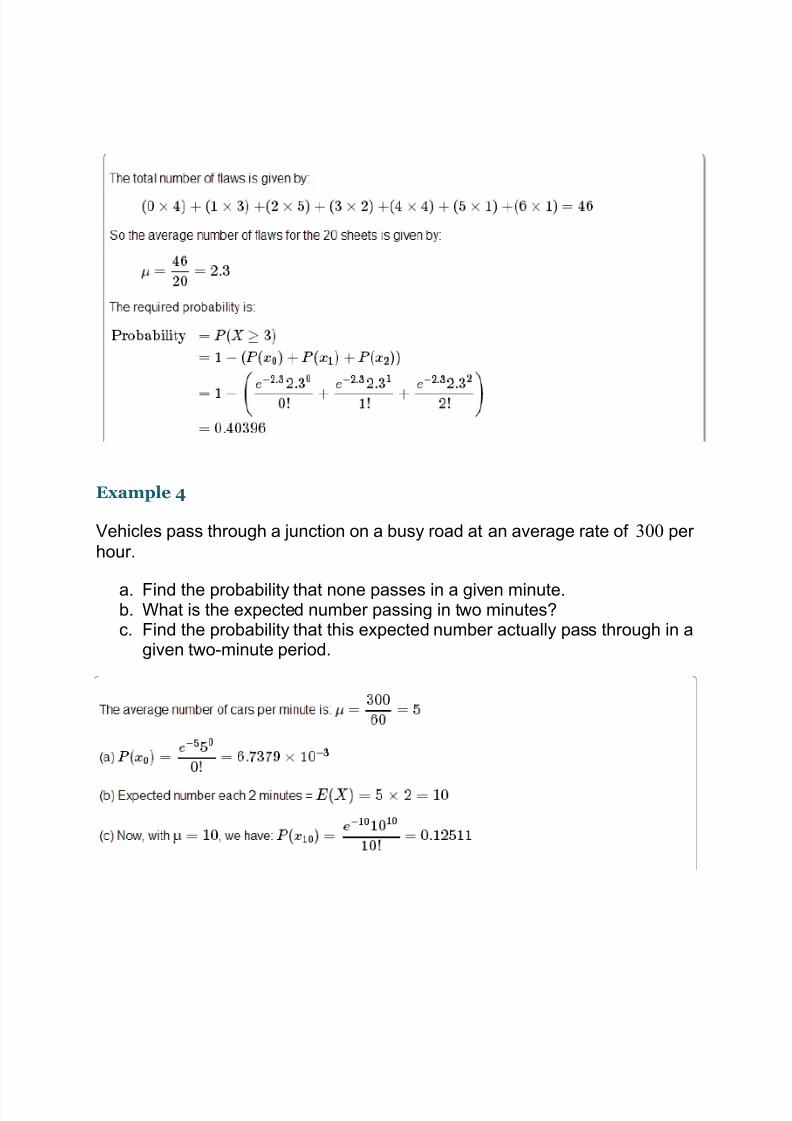
What is the probability of finding a sheet chosen at random which contains 3or more surface flaws?
7/29/2019 Frequency Distributions, Poisson
http://slidepdf.com/reader/full/frequency-distributions-poisson 5/7
Example 4
Vehicles pass through a junction on a busy road at an average rate of 300 per
hour.
a. Find the probability that none passes in a given minute.b. What is the expected number passing in two minutes?c. Find the probability that this expected number actually pass through in a
given two-minute period.
7/29/2019 Frequency Distributions, Poisson
http://slidepdf.com/reader/full/frequency-distributions-poisson 6/7
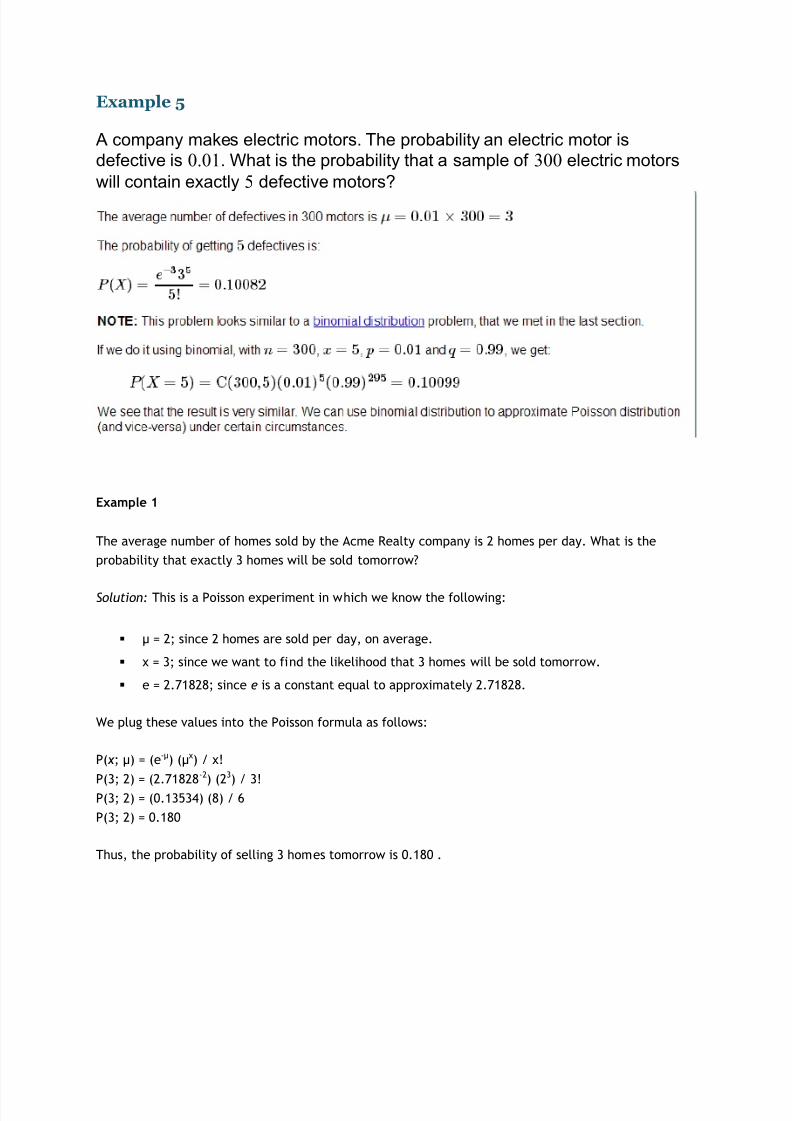
Example 5
A company makes electric motors. The probability an electric motor is
defective is 0.01. What is the probability that a sample of 300 electric motors
will contain exactly 5 defective motors?
Example 1
The average number of homes sold by the Acme Realty company is 2 homes per day. What is the
probability that exactly 3 homes will be sold tomorrow?
Solution: This is a Poisson experiment in which we know the following:
μ = 2; since 2 homes are sold per day, on average.
x = 3; since we want to find the likelihood that 3 homes will be sold tomorrow.
e = 2.71828; since e is a constant equal to approximately 2.71828.
We plug these values into the Poisson formula as follows:
P( x ; μ) = (e-μ) (μx) / x!
P(3; 2) = (2.71828
-2
) (2
3
) / 3!P(3; 2) = (0.13534) (8) / 6
P(3; 2) = 0.180
Thus, the probability of selling 3 homes tomorrow is 0.180 .
7/29/2019 Frequency Distributions, Poisson
http://slidepdf.com/reader/full/frequency-distributions-poisson 7/7
Example 1
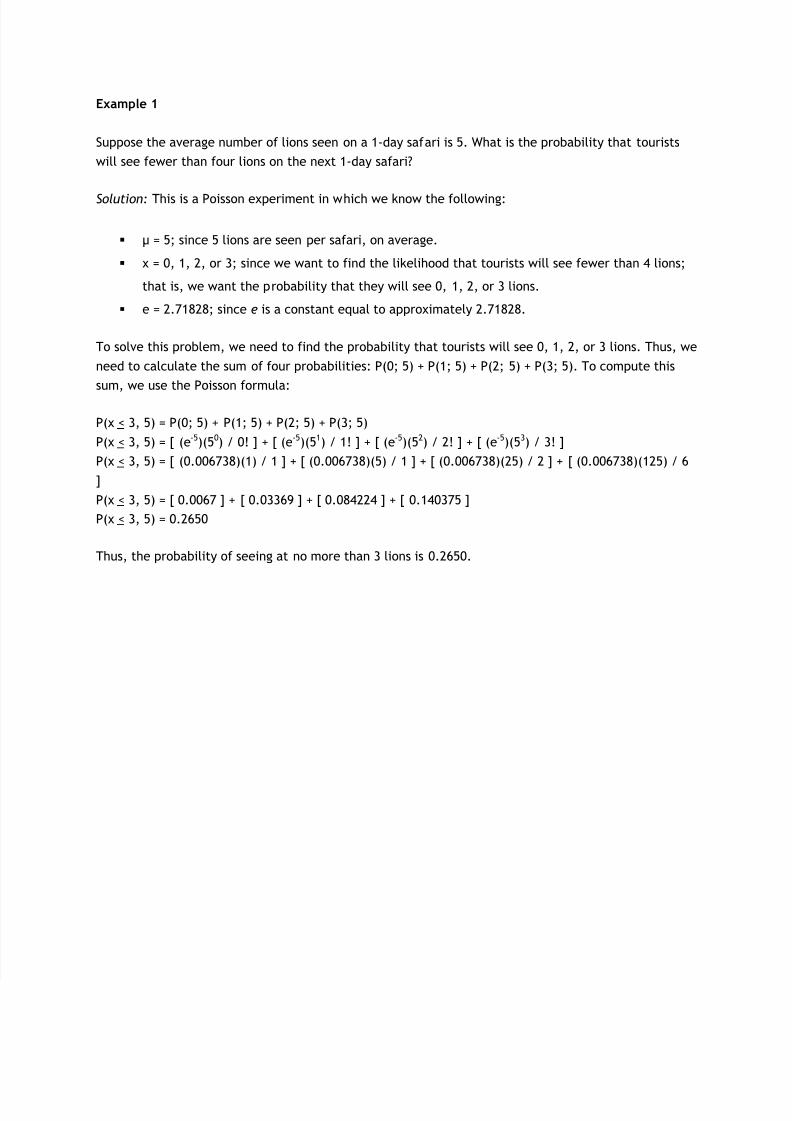
Suppose the average number of lions seen on a 1-day safari is 5. What is the probability that tourists
will see fewer than four lions on the next 1-day safari?
Solution: This is a Poisson experiment in which we know the following:
μ = 5; since 5 lions are seen per safari, on average.
x = 0, 1, 2, or 3; since we want to find the likelihood that tourists will see fewer than 4 lions;
that is, we want the probability that they will see 0, 1, 2, or 3 lions.
e = 2.71828; since e is a constant equal to approximately 2.71828.
To solve this problem, we need to find the probability that tourists will see 0, 1, 2, or 3 lions. Thus, we
need to calculate the sum of four probabilities: P(0; 5) + P(1; 5) + P(2; 5) + P(3; 5). To compute this
sum, we use the Poisson formula:
P(x < 3, 5) = P(0; 5) + P(1; 5) + P(2; 5) + P(3; 5)
P(x < 3, 5) = [ (e-5)(50) / 0! ] + [ (e-5)(51) / 1! ] + [ (e-5)(52) / 2! ] + [ (e-5)(53) / 3! ]
P(x < 3, 5) = [ (0.006738)(1) / 1 ] + [ (0.006738)(5) / 1 ] + [ (0.006738)(25) / 2 ] + [ (0.006738)(125) / 6
]
P(x < 3, 5) = [ 0.0067 ] + [ 0.03369 ] + [ 0.084224 ] + [ 0.140375 ]
P(x < 3, 5) = 0.2650
Thus, the probability of seeing at no more than 3 lions is 0.2650.