Embed Size (px)
Citation preview
Hindawi Publishing CorporationJournal of NanomaterialsVolume 2010, Article ID 261748, 10 pagesdoi:10.1155/2010/261748
Research Article
Frequency and Temperature Dependences of DielectricDispersion and Electrical Properties of PolyvinylideneFluoride/Expanded Graphite Composites
Yu Chao Li, Robert Kwok Yiu Li, and Sie Chin Tjong
Department of Physics and Materials Science, City University of Hong Kong, Kowloon Town, Hong Kong
Correspondence should be addressed to Sie Chin Tjong, [email protected]
Received 19 June 2009; Accepted 21 October 2009
Academic Editor: Gaurav Mago
Copyright © 2010 Yu Chao Li et al. This is an open access article distributed under the Creative Commons Attribution License,which permits unrestricted use, distribution, and reproduction in any medium, provided the original work is properly cited.
A conductive nanofiller, expanded graphite (EG), was introduced into polyvinylidene fluoride (PVDF) by direct melt blendingprocess. The electrical conductivity and dielectric properties of resulting PVDF/EG composites were investigated in a wide rangeof frequencies from 102 to 108 Hz. The dielectric dispersion and conductivity of the composite system exhibited a strong frequencydependence particularly in the vicinity of percolation threshold (Φc = 6 vol%). Moreover, the dielectric permittivity tended todecrease with increasing frequency while the conductivity displayed a reverse trend. A large permittivity was found in the compositehaving EG content nearΦc. Accordingly, percolation concept and biased random walk approach can be used to describe the carriertransport of percolating PVDF/EG system. The conductivity and permittivity of percolating PVDF/EG composites were observedto be temperature dependent.
1. Introduction
Conductive polymer composites reinforced with carbonblack (CB) microparticles have been used extensively inindustrial sectors as materials for antistatic and electro-magnetic shielding. Such polymer microcomposites gener-ally require a large filler concentration to achieve desiredelectrical properties. The additions of large filler content topolymers lead to poor processability and inferior mechanicalproperties. In contrast, polymer nanocomposites reinforcedwith expanded graphite (EG) platelets have shown substan-tial improvements in electrical conductivity and mechanicalproperty over microcomposites reinforced with CB [1].
Graphite is a carbonaceous material available commer-cially at relatively low cost. Its structure consists of carbonlayers in an alternating stacked sequence. These layersare bonded by weak van der Waals forces. Consequently,oxidizing agent such as sulfuric acid can be easily intercalatedinto graphite interlayers, forming the so-called graphiteintercalation compound (GIC). Expanded graphite (EG)with a high aspect ratio and excellent electrical conductivitycan be produced by exfoliating GIC through rapid heating
in a furnace or microwave environment. EG nanoplateletshave been successfully incorporated into polyamide-6,poly(methylmethacrylate), polystyrene and polyolefins toimprove their thermal stability, electrical and mechanicalperformances [2–4].
Polyvinylidene fluoride (PVDF) is a semi-crystallinethermoplastic having remarkable high piezoelectric coeffi-cient [5, 6], excellent thermal stability and chemical resis-tance compared with other polymers. Consequently, PVDFand its copolymers find widespread industrial applicationsin transducers, transistor and capacitors. Moreover, PVDFis an attractive polymer matrix for micro- and nanocom-posites with superior mechanical and electrical properties[7–11]. Very recently, Almasri et al. [11] investigated themicrostructure, electrical and thermomechanical behaviorsof solution cast PVDF composites reinforced with carbonnanotubes (CNTs). Their results show that the double-walledCNTs act as nucleation sites for PVDF polymer chains duringsolution processing. Electrical measurement revealed thatthe PVDF/CNT nanocomposites exhibit a low percolationthreshold. The low percolation filler concentration forelectrical conductivity is resulted from very high aspect ratio
2 Journal of Nanomaterials
Table 1: Physical properties of PVDF (Kynar 740).
Physical properties Value
Density 1.78 g/cm3
Melting flow rate 1.1 g/10 min (230◦C/5 kg load)
Melting point 168◦C
Electrical resistivity 2× 10¹⁴ ohm.cm
Dielectric constant 7.70 under 106 Hz
10.8 under 100 Hz
(above 1000) of CNTs [12, 13]. However, the high cost ofCNTs precludes their extensive application as nanofillers forpolymers. In contrast, graphite is naturally abundant andavailable at a relatively low cost. Graphite nanoplatelets alsoexhibit good electrical conductivity (∼104 S/cm), thus areideal nanofillers for conducting polymer nanocomposites.The aspect ratio of graphite nanoplatelets (∼250) is smallerthan that of CNTs, but conducting filler network can also beestablished in the polymer/EG nanocomposites. This impliesthat the polymer/EG nanocomposites only require low EGloadings to achieve high electrical conductivity [14]. Interms of economic consideration, it is more cost effective touse EG nanoplatelets to prepare PVDF/EG nanocomposites.However, little is known on the PVDF/EG nanocompositesas far as we know. Accordingly, we prepared PVDF/EGnanocomposites via melt blending and investigated theirelectrical behavior at various frequencies and temperaturesin details. The results are discussed and compared withexisting models. The fabrication, microstructure and ther-mal properties of PVDF/EG nanocomomposites have beenreported elsewhere [15].
2. Experimental
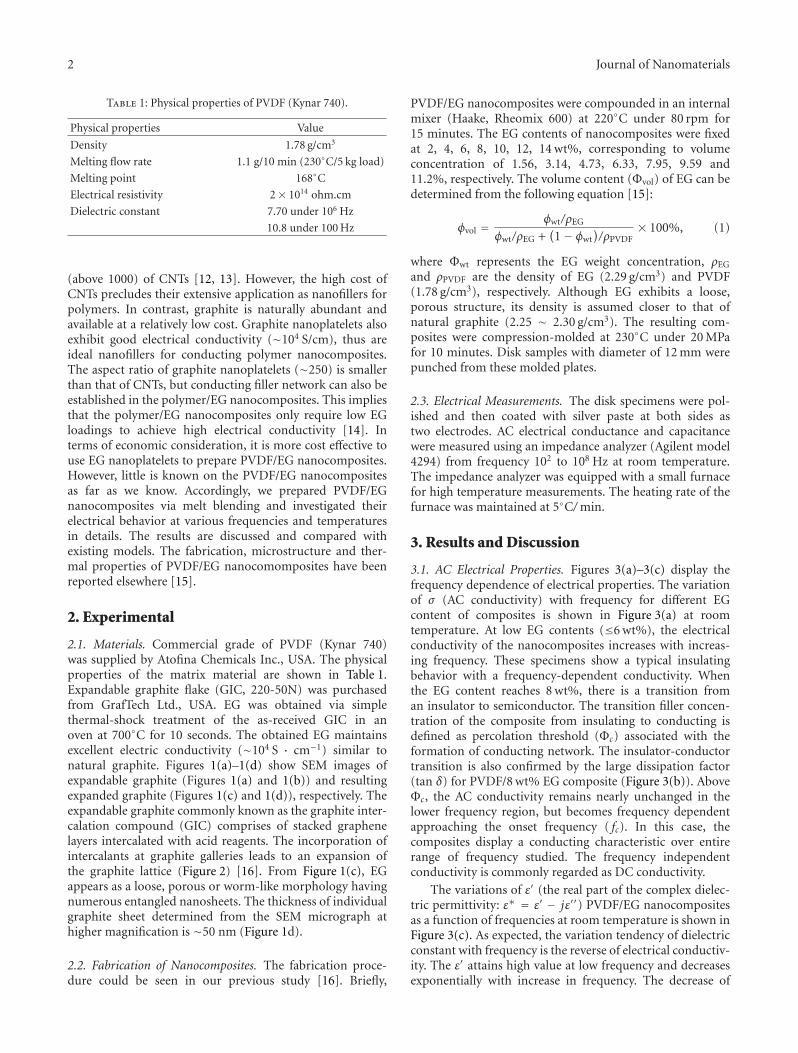
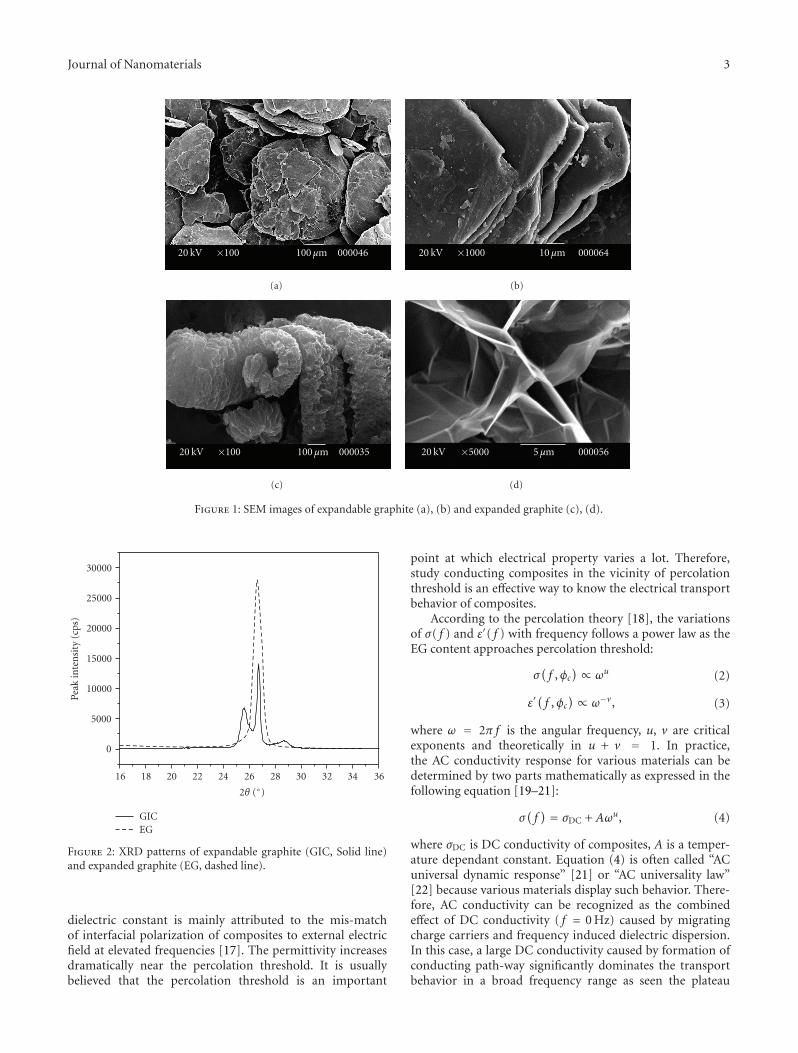
2.1. Materials. Commercial grade of PVDF (Kynar 740)was supplied by Atofina Chemicals Inc., USA. The physicalproperties of the matrix material are shown in Table 1.Expandable graphite flake (GIC, 220-50N) was purchasedfrom GrafTech Ltd., USA. EG was obtained via simplethermal-shock treatment of the as-received GIC in anoven at 700◦C for 10 seconds. The obtained EG maintainsexcellent electric conductivity (∼104 S · cm−1) similar tonatural graphite. Figures 1(a)–1(d) show SEM images ofexpandable graphite (Figures 1(a) and 1(b)) and resultingexpanded graphite (Figures 1(c) and 1(d)), respectively. Theexpandable graphite commonly known as the graphite inter-calation compound (GIC) comprises of stacked graphenelayers intercalated with acid reagents. The incorporation ofintercalants at graphite galleries leads to an expansion ofthe graphite lattice (Figure 2) [16]. From Figure 1(c), EGappears as a loose, porous or worm-like morphology havingnumerous entangled nanosheets. The thickness of individualgraphite sheet determined from the SEM micrograph athigher magnification is ∼50 nm (Figure 1d).
2.2. Fabrication of Nanocomposites. The fabrication proce-dure could be seen in our previous study [16]. Briefly,
PVDF/EG nanocomposites were compounded in an internalmixer (Haake, Rheomix 600) at 220◦C under 80 rpm for15 minutes. The EG contents of nanocomposites were fixedat 2, 4, 6, 8, 10, 12, 14 wt%, corresponding to volumeconcentration of 1.56, 3.14, 4.73, 6.33, 7.95, 9.59 and11.2%, respectively. The volume content (Φvol) of EG can bedetermined from the following equation [15]:
φvol =φwt/ρEG
φwt/ρEG +(1− φwt
)/ρPVDF
× 100%, (1)
where Φwt represents the EG weight concentration, ρEG
and ρPVDF are the density of EG (2.29 g/cm3) and PVDF(1.78 g/cm3), respectively. Although EG exhibits a loose,porous structure, its density is assumed closer to that ofnatural graphite (2.25 ∼ 2.30 g/cm3). The resulting com-posites were compression-molded at 230◦C under 20 MPafor 10 minutes. Disk samples with diameter of 12 mm werepunched from these molded plates.
2.3. Electrical Measurements. The disk specimens were pol-ished and then coated with silver paste at both sides astwo electrodes. AC electrical conductance and capacitancewere measured using an impedance analyzer (Agilent model4294) from frequency 102 to 108 Hz at room temperature.The impedance analyzer was equipped with a small furnacefor high temperature measurements. The heating rate of thefurnace was maintained at 5◦C/min.
3. Results and Discussion
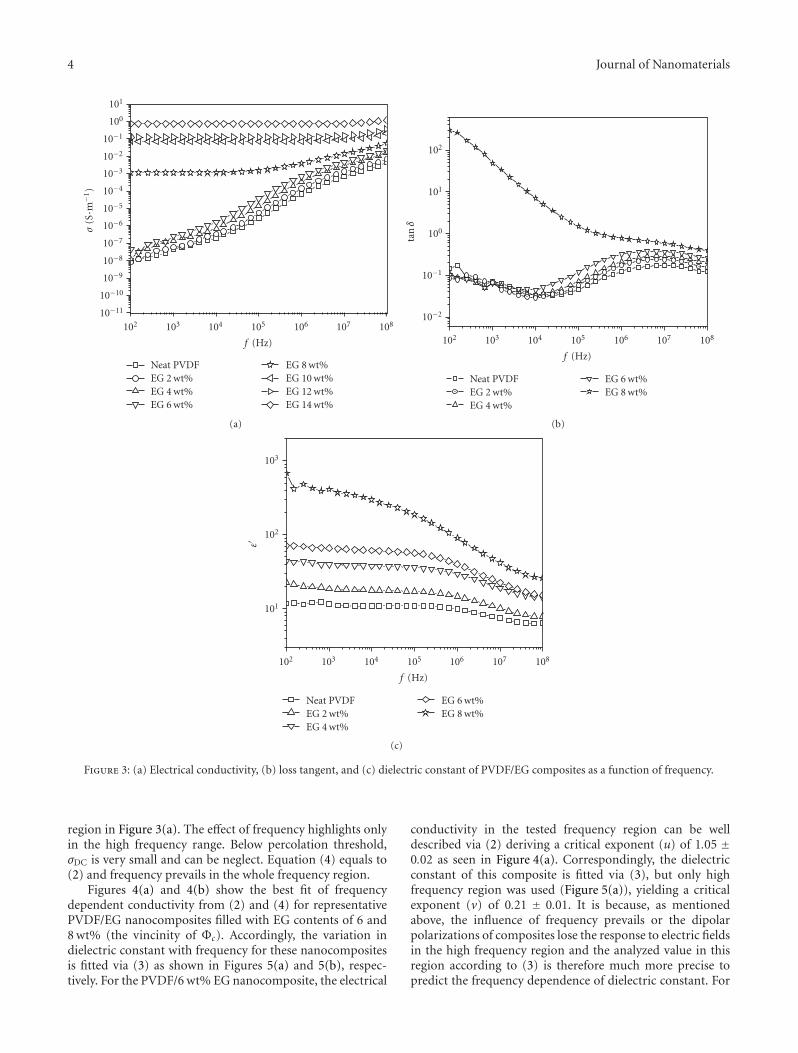
3.1. AC Electrical Properties. Figures 3(a)–3(c) display thefrequency dependence of electrical properties. The variationof σ (AC conductivity) with frequency for different EGcontent of composites is shown in Figure 3(a) at roomtemperature. At low EG contents (≤6 wt%), the electricalconductivity of the nanocomposites increases with increas-ing frequency. These specimens show a typical insulatingbehavior with a frequency-dependent conductivity. Whenthe EG content reaches 8 wt%, there is a transition froman insulator to semiconductor. The transition filler concen-tration of the composite from insulating to conducting isdefined as percolation threshold (Φc) associated with theformation of conducting network. The insulator-conductortransition is also confirmed by the large dissipation factor(tan δ) for PVDF/8 wt% EG composite (Figure 3(b)). AboveΦc, the AC conductivity remains nearly unchanged in thelower frequency region, but becomes frequency dependentapproaching the onset frequency ( fc). In this case, thecomposites display a conducting characteristic over entirerange of frequency studied. The frequency independentconductivity is commonly regarded as DC conductivity.
The variations of ε′ (the real part of the complex dielec-tric permittivity: ε∗ = ε′ − jε′′) PVDF/EG nanocompositesas a function of frequencies at room temperature is shown inFigure 3(c). As expected, the variation tendency of dielectricconstant with frequency is the reverse of electrical conductiv-ity. The ε′ attains high value at low frequency and decreasesexponentially with increase in frequency. The decrease of
Journal of Nanomaterials 3
20 kV ×100 100 μm 000046
(a)
20 kV ×1000 10 μm 000064
(b)
20 kV ×100 100 μm 000035
(c)
20 kV ×5000 5 μm 000056
(d)
Figure 1: SEM images of expandable graphite (a), (b) and expanded graphite (c), (d).
3634323028262422201816
2θ (◦)
GICEG
0
5000
10000
15000
20000
25000
30000
Peak
inte
nsi
ty(c
ps)
Figure 2: XRD patterns of expandable graphite (GIC, Solid line)and expanded graphite (EG, dashed line).
dielectric constant is mainly attributed to the mis-matchof interfacial polarization of composites to external electricfield at elevated frequencies [17]. The permittivity increasesdramatically near the percolation threshold. It is usuallybelieved that the percolation threshold is an important
point at which electrical property varies a lot. Therefore,study conducting composites in the vicinity of percolationthreshold is an effective way to know the electrical transportbehavior of composites.
According to the percolation theory [18], the variationsof σ( f ) and ε′( f ) with frequency follows a power law as theEG content approaches percolation threshold:
σ(f ,φc
)∝ ωu (2)
ε′(f ,φc
)∝ ω−v, (3)
where ω = 2π f is the angular frequency, u, v are criticalexponents and theoretically in u + v = 1. In practice,the AC conductivity response for various materials can bedetermined by two parts mathematically as expressed in thefollowing equation [19–21]:
σ(f) = σDC + Aωu, (4)
where σDC is DC conductivity of composites, A is a temper-ature dependant constant. Equation (4) is often called “ACuniversal dynamic response” [21] or “AC universality law”[22] because various materials display such behavior. There-fore, AC conductivity can be recognized as the combinedeffect of DC conductivity ( f = 0 Hz) caused by migratingcharge carriers and frequency induced dielectric dispersion.In this case, a large DC conductivity caused by formation ofconducting path-way significantly dominates the transportbehavior in a broad frequency range as seen the plateau
4 Journal of Nanomaterials
108107106105104103102
f (Hz)
Neat PVDFEG 2 wt%EG 4 wt%EG 6 wt%
EG 8 wt%EG 10 wt%EG 12 wt%EG 14 wt%
10−11
10−10
10−9
10−8
10−7
10−6
10−5
10−4
10−3
10−2
10−1
100
101
σ(S·m
−1)
(a)
108107106105104103102
f (Hz)
Neat PVDFEG 2 wt%EG 4 wt%
EG 6 wt%EG 8 wt%
10−2
10−1
100
101
102
tanδ
(b)
108107106105104103102
f (Hz)
Neat PVDFEG 2 wt%EG 4 wt%
EG 6 wt%EG 8 wt%
101
102
103
ε′
(c)
Figure 3: (a) Electrical conductivity, (b) loss tangent, and (c) dielectric constant of PVDF/EG composites as a function of frequency.
region in Figure 3(a). The effect of frequency highlights onlyin the high frequency range. Below percolation threshold,σDC is very small and can be neglect. Equation (4) equals to(2) and frequency prevails in the whole frequency region.
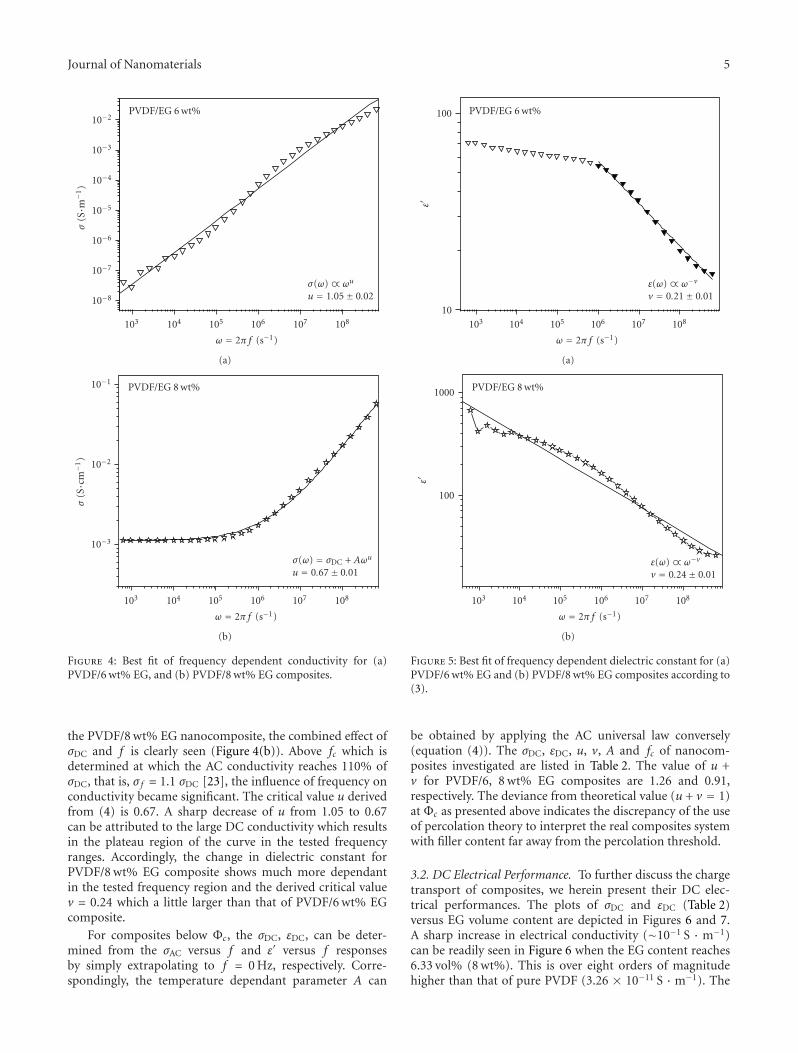
Figures 4(a) and 4(b) show the best fit of frequencydependent conductivity from (2) and (4) for representativePVDF/EG nanocomposites filled with EG contents of 6 and8 wt% (the vincinity of Φc). Accordingly, the variation indielectric constant with frequency for these nanocompositesis fitted via (3) as shown in Figures 5(a) and 5(b), respec-tively. For the PVDF/6 wt% EG nanocomposite, the electrical
conductivity in the tested frequency region can be welldescribed via (2) deriving a critical exponent (u) of 1.05 ±0.02 as seen in Figure 4(a). Correspondingly, the dielectricconstant of this composite is fitted via (3), but only highfrequency region was used (Figure 5(a)), yielding a criticalexponent (v) of 0.21 ± 0.01. It is because, as mentionedabove, the influence of frequency prevails or the dipolarpolarizations of composites lose the response to electric fieldsin the high frequency region and the analyzed value in thisregion according to (3) is therefore much more precise topredict the frequency dependence of dielectric constant. For
Journal of Nanomaterials 5
108107106105104103
ω = 2π f (s−1)
PVDF/EG 6 wt%
σ(ω) ∝ωu
u = 1.05± 0.0210−8
10−7
10−6
10−5
10−4
10−3
10−2
σ(S·m
−1)
(a)
108107106105104103
ω = 2π f (s−1)
PVDF/EG 8 wt%
σ(ω) = σDC + Aωu
u = 0.67± 0.01
10−3
10−2
10−1
σ(S·c
m−1
)
(b)
Figure 4: Best fit of frequency dependent conductivity for (a)PVDF/6 wt% EG, and (b) PVDF/8 wt% EG composites.
the PVDF/8 wt% EG nanocomposite, the combined effect ofσDC and f is clearly seen (Figure 4(b)). Above fc which isdetermined at which the AC conductivity reaches 110% ofσDC, that is, σ f = 1.1 σDC [23], the influence of frequency onconductivity became significant. The critical value u derivedfrom (4) is 0.67. A sharp decrease of u from 1.05 to 0.67can be attributed to the large DC conductivity which resultsin the plateau region of the curve in the tested frequencyranges. Accordingly, the change in dielectric constant forPVDF/8 wt% EG composite shows much more dependantin the tested frequency region and the derived critical valuev = 0.24 which a little larger than that of PVDF/6 wt% EGcomposite.
For composites below Φc, the σDC, εDC, can be deter-mined from the σAC versus f and ε′ versus f responsesby simply extrapolating to f = 0 Hz, respectively. Corre-spondingly, the temperature dependant parameter A can
108107106105104103
ω = 2π f (s−1)
PVDF/EG 6 wt%
ε(ω) ∝ω−v
v = 0.21± 0.0110
100
ε′
(a)
108107106105104103
ω = 2π f (s−1)
PVDF/EG 8 wt%
ε(ω) ∝ω−v
v = 0.24± 0.01
100
1000
ε′
(b)
Figure 5: Best fit of frequency dependent dielectric constant for (a)PVDF/6 wt% EG and (b) PVDF/8 wt% EG composites according to(3).
be obtained by applying the AC universal law conversely(equation (4)). The σDC, εDC, u, v, A and fc of nanocom-posites investigated are listed in Table 2. The value of u +v for PVDF/6, 8 wt% EG composites are 1.26 and 0.91,respectively. The deviance from theoretical value (u + v = 1)at Φc as presented above indicates the discrepancy of the useof percolation theory to interpret the real composites systemwith filler content far away from the percolation threshold.
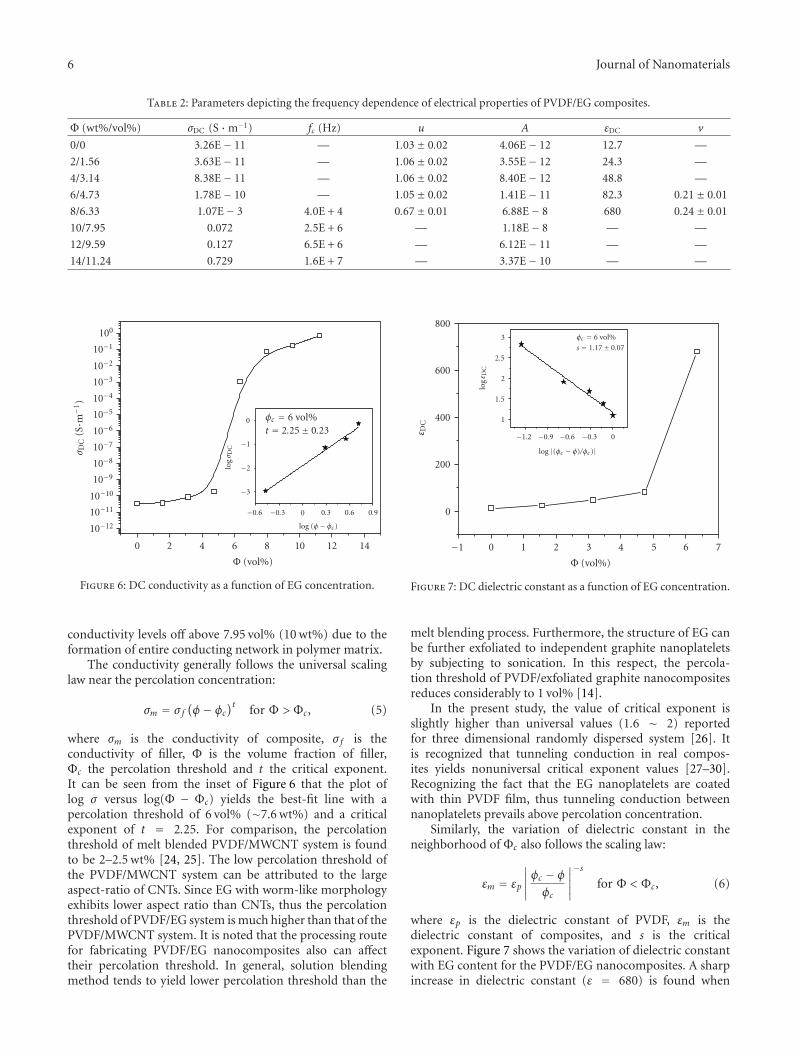
3.2. DC Electrical Performance. To further discuss the chargetransport of composites, we herein present their DC elec-trical performances. The plots of σDC and εDC (Table 2)versus EG volume content are depicted in Figures 6 and 7.A sharp increase in electrical conductivity (∼10−1 S · m−1)can be readily seen in Figure 6 when the EG content reaches6.33 vol% (8 wt%). This is over eight orders of magnitudehigher than that of pure PVDF (3.26 × 10⁻¹¹ S · m−1). The
6 Journal of Nanomaterials
Table 2: Parameters depicting the frequency dependence of electrical properties of PVDF/EG composites.
Φ (wt%/vol%) σDC (S ·m−1) fc (Hz) u A εDC v
0/0 3.26E− 11 — 1.03± 0.02 4.06E− 12 12.7 —
2/1.56 3.63E− 11 — 1.06± 0.02 3.55E− 12 24.3 —
4/3.14 8.38E− 11 — 1.06± 0.02 8.40E− 12 48.8 —
6/4.73 1.78E− 10 — 1.05± 0.02 1.41E− 11 82.3 0.21± 0.01
8/6.33 1.07E− 3 4.0E + 4 0.67± 0.01 6.88E− 8 680 0.24± 0.01
10/7.95 0.072 2.5E + 6 — 1.18E− 8 — —
12/9.59 0.127 6.5E + 6 — 6.12E− 11 — —
14/11.24 0.729 1.6E + 7 — 3.37E− 10 — —
14121086420
Φ (vol%)
φc = 6 vol%t = 2.25± 0.23
10−12
10−11
10−10
10−9
10−8
10−7
10−6
10−5
10−4
10−3
10−2
10−1
100
σ DC
(S·m
−1)
0.90.60.30−0.3−0.6
log (φ − φc)
−3
−2
−1
0
logσ D
C
Figure 6: DC conductivity as a function of EG concentration.
conductivity levels off above 7.95 vol% (10 wt%) due to theformation of entire conducting network in polymer matrix.
The conductivity generally follows the universal scalinglaw near the percolation concentration:
σm = σ f(φ − φc
)t for Φ > Φc, (5)
where σm is the conductivity of composite, σ f is theconductivity of filler, Φ is the volume fraction of filler,Φc the percolation threshold and t the critical exponent.It can be seen from the inset of Figure 6 that the plot oflog σ versus log(Φ − Φc) yields the best-fit line with apercolation threshold of 6 vol% (∼7.6 wt%) and a criticalexponent of t = 2.25. For comparison, the percolationthreshold of melt blended PVDF/MWCNT system is foundto be 2–2.5 wt% [24, 25]. The low percolation threshold ofthe PVDF/MWCNT system can be attributed to the largeaspect-ratio of CNTs. Since EG with worm-like morphologyexhibits lower aspect ratio than CNTs, thus the percolationthreshold of PVDF/EG system is much higher than that of thePVDF/MWCNT system. It is noted that the processing routefor fabricating PVDF/EG nanocomposites also can affecttheir percolation threshold. In general, solution blendingmethod tends to yield lower percolation threshold than the
76543210−1
Φ (vol%)
0
200
400
600
800
ε DC
−1.2 −0.9 −0.6 −0.3 0
log |(φc − φ)/φc)|
1
1.5
2
2.5
3
logε D
C
φc = 6 vol%
s = 1.17± 0.07
Figure 7: DC dielectric constant as a function of EG concentration.
melt blending process. Furthermore, the structure of EG canbe further exfoliated to independent graphite nanoplateletsby subjecting to sonication. In this respect, the percola-tion threshold of PVDF/exfoliated graphite nanocompositesreduces considerably to 1 vol% [14].
In the present study, the value of critical exponent isslightly higher than universal values (1.6 ∼ 2) reportedfor three dimensional randomly dispersed system [26]. Itis recognized that tunneling conduction in real compos-ites yields nonuniversal critical exponent values [27–30].Recognizing the fact that the EG nanoplatelets are coatedwith thin PVDF film, thus tunneling conduction betweennanoplatelets prevails above percolation concentration.
Similarly, the variation of dielectric constant in theneighborhood of Φc also follows the scaling law:
εm = εp
∣∣∣∣∣φc − φφc
∣∣∣∣∣
−sfor Φ < Φc, (6)
where εp is the dielectric constant of PVDF, εm is thedielectric constant of composites, and s is the criticalexponent. Figure 7 shows the variation of dielectric constantwith EG content for the PVDF/EG nanocomposites. A sharpincrease in dielectric constant (ε = 680) is found when
Journal of Nanomaterials 7
0776 20 kV ×600 10 μm WD15
EG
EG
(a)
3926 20 kV ×4000 1 μm WD12
EG
(b)
Figure 8: (a) Low and (b) large magnification SEM images ofPVDF/6 wt% EG composites.
EG content reaches 6.33 vol% (8 wt%). It is nearly 70 timeshigher than that of neat PVDF matrix. Linear regressionfit of experimental data using (6) yields a critical exponentof s = 1.17 and Φc of 6 vol% (inset of Figure (7)). Suchhigh dielectric constant at percolation concentration can beattributed to the minicapacitor effect. The minicapacitorsconsist of various graphite nanoplatelets separated by a thininsulating polymer matrix. This high dielectric behavior canbe utilized to create high charge-storage devices [31].
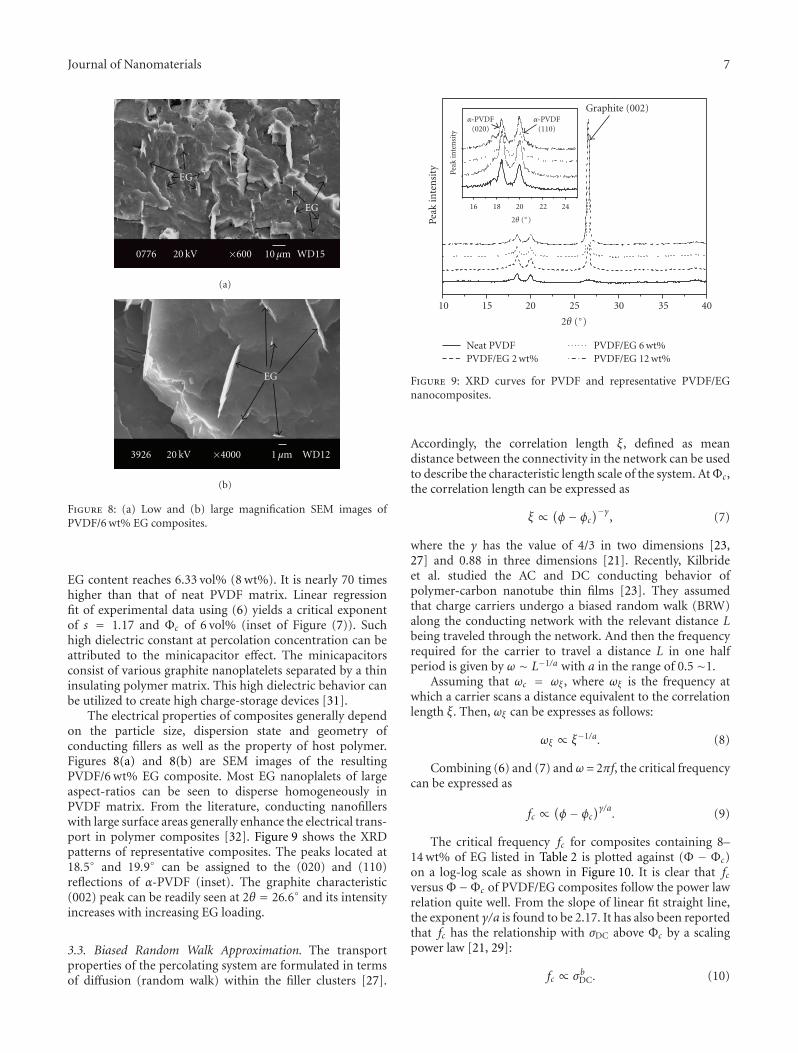
The electrical properties of composites generally dependon the particle size, dispersion state and geometry ofconducting fillers as well as the property of host polymer.Figures 8(a) and 8(b) are SEM images of the resultingPVDF/6 wt% EG composite. Most EG nanoplalets of largeaspect-ratios can be seen to disperse homogeneously inPVDF matrix. From the literature, conducting nanofillerswith large surface areas generally enhance the electrical trans-port in polymer composites [32]. Figure 9 shows the XRDpatterns of representative composites. The peaks located at18.5◦ and 19.9◦ can be assigned to the (020) and (110)reflections of α-PVDF (inset). The graphite characteristic(002) peak can be readily seen at 2θ = 26.6◦ and its intensityincreases with increasing EG loading.
3.3. Biased Random Walk Approximation. The transportproperties of the percolating system are formulated in termsof diffusion (random walk) within the filler clusters [27].
40353025201510
2θ (◦)
Peak
inte
nsi
ty
Graphite (002)
16 18 20 22 24
2θ (◦)
Peak
inte
nsi
ty
α-PVDF(020)
α-PVDF(110)
Neat PVDFPVDF/EG 2 wt%
PVDF/EG 6 wt%PVDF/EG 12 wt%
Figure 9: XRD curves for PVDF and representative PVDF/EGnanocomposites.
Accordingly, the correlation length ξ, defined as meandistance between the connectivity in the network can be usedto describe the characteristic length scale of the system. AtΦc,the correlation length can be expressed as
ξ ∝ (φ − φc
)−γ, (7)
where the γ has the value of 4/3 in two dimensions [23,27] and 0.88 in three dimensions [21]. Recently, Kilbrideet al. studied the AC and DC conducting behavior ofpolymer-carbon nanotube thin films [23]. They assumedthat charge carriers undergo a biased random walk (BRW)along the conducting network with the relevant distance Lbeing traveled through the network. And then the frequencyrequired for the carrier to travel a distance L in one halfperiod is given by ω ∼ L−1/a with a in the range of 0.5 ∼1.
Assuming that ωc = ωξ , where ωξ is the frequency atwhich a carrier scans a distance equivalent to the correlationlength ξ. Then, ωξ can be expresses as follows:
ωξ ∝ ξ−1/a. (8)
Combining (6) and (7) andω = 2πf, the critical frequencycan be expressed as
fc ∝(φ − φc
)γ/a. (9)
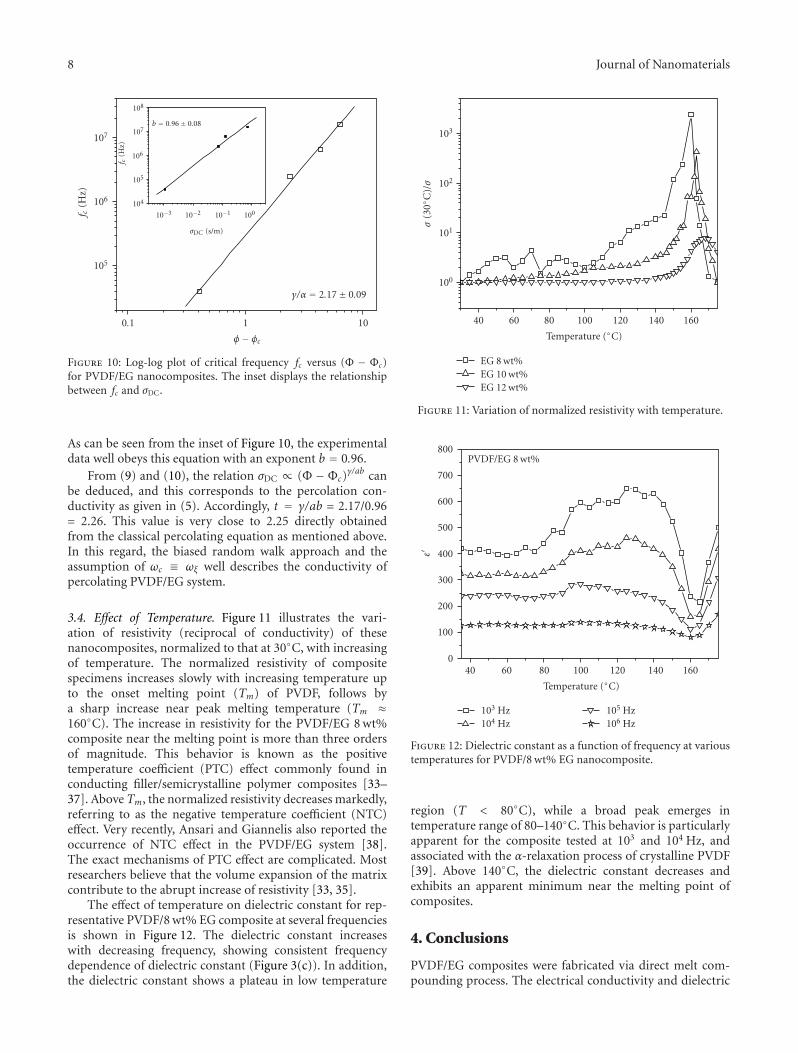
The critical frequency fc for composites containing 8–14 wt% of EG listed in Table 2 is plotted against (Φ − Φc)on a log-log scale as shown in Figure 10. It is clear that fcversus Φ−Φc of PVDF/EG composites follow the power lawrelation quite well. From the slope of linear fit straight line,the exponent γ/a is found to be 2.17. It has also been reportedthat fc has the relationship with σDC above Φc by a scalingpower law [21, 29]:
fc ∝ σbDC. (10)
8 Journal of Nanomaterials
1010.1
φ − φc
105
106
107
f c(H
z)
γ/α = 2.17± 0.09
10010−110−210−3
σDC (s/m)
104
105
106
107
108
f c(H
z)b = 0.96± 0.08
Figure 10: Log-log plot of critical frequency fc versus (Φ − Φc)for PVDF/EG nanocomposites. The inset displays the relationshipbetween fc and σDC.
As can be seen from the inset of Figure 10, the experimentaldata well obeys this equation with an exponent b = 0.96.
From (9) and (10), the relation σDC ∝ (Φ − Φc)γ/ab can
be deduced, and this corresponds to the percolation con-ductivity as given in (5). Accordingly, t = γ/ab = 2.17/0.96= 2.26. This value is very close to 2.25 directly obtainedfrom the classical percolating equation as mentioned above.In this regard, the biased random walk approach and theassumption of ωc ≡ ωξ well describes the conductivity ofpercolating PVDF/EG system.
3.4. Effect of Temperature. Figure 11 illustrates the vari-ation of resistivity (reciprocal of conductivity) of thesenanocomposites, normalized to that at 30◦C, with increasingof temperature. The normalized resistivity of compositespecimens increases slowly with increasing temperature upto the onset melting point (Tm) of PVDF, follows bya sharp increase near peak melting temperature (Tm ≈160◦C). The increase in resistivity for the PVDF/EG 8 wt%composite near the melting point is more than three ordersof magnitude. This behavior is known as the positivetemperature coefficient (PTC) effect commonly found inconducting filler/semicrystalline polymer composites [33–37]. Above Tm, the normalized resistivity decreases markedly,referring to as the negative temperature coefficient (NTC)effect. Very recently, Ansari and Giannelis also reported theoccurrence of NTC effect in the PVDF/EG system [38].The exact mechanisms of PTC effect are complicated. Mostresearchers believe that the volume expansion of the matrixcontribute to the abrupt increase of resistivity [33, 35].
The effect of temperature on dielectric constant for rep-resentative PVDF/8 wt% EG composite at several frequenciesis shown in Figure 12. The dielectric constant increaseswith decreasing frequency, showing consistent frequencydependence of dielectric constant (Figure 3(c)). In addition,the dielectric constant shows a plateau in low temperature
160140120100806040
Temperature (◦C)
EG 8 wt%EG 10 wt%EG 12 wt%
100
101
102
103
σ(3
0◦C
)/σ
Figure 11: Variation of normalized resistivity with temperature.
160140120100806040
Temperature (◦C)
103 Hz104 Hz
105 Hz106 Hz
PVDF/EG 8 wt%
0
100
200
300
400
500
600
700
800
ε′
Figure 12: Dielectric constant as a function of frequency at varioustemperatures for PVDF/8 wt% EG nanocomposite.
region (T < 80◦C), while a broad peak emerges intemperature range of 80–140◦C. This behavior is particularlyapparent for the composite tested at 103 and 104 Hz, andassociated with the α-relaxation process of crystalline PVDF[39]. Above 140◦C, the dielectric constant decreases andexhibits an apparent minimum near the melting point ofcomposites.
4. Conclusions
PVDF/EG composites were fabricated via direct melt com-pounding process. The electrical conductivity and dielectric
Journal of Nanomaterials 9
properties of PVDF/EG composites were measured in awide range of frequencies from 102 to 108 Hz at varioustemperatures. The results showed that the AC conductivity(σ) and dielectric constant (ε′) of the PVDF/EG compositesnear the percolation threshold were frequency dependentand obeyed the power law relations (σ ∝ ωu and ε′ ∝ω−v). The value of critical exponents u + v for PVDF/6 wt%EG and PVDF/8 wt% EG composites were determined tobe 1.26 and 0.91, respectively. The DC conductivity anddielectric constant extrapolated from AC results followedwith the percolation scaling law, yielding a percolationthreshold Φc = 6 vol% and critical exponents t = 2.25 ands = 1.17, respectively. The introduction of biased randomwalk approach well described the conductivity of percolatingPVDF/EG system. Finally, percolating PVDF/EG compositesdisplayed positive temperature coefficient effect near themelting point of composites. The dielectric constant showeda broad peak in temperature range of 80–140◦C whichdenoted as the α-relaxation process of crystalline PVDF.
References
[1] K. Kalaitzidou, H. Fukushima, and L. T. Drzal, “Mechanicalproperties and morphological characterization of exfoliatedgraphite-polypropylene nanocomposites,” Composites Part A,vol. 38, no. 7, pp. 1675–1682, 2007.
[2] F. M. Uhl, Q. Yao, H. Nakajima, E. Manias, and C. A. Wilkie,“Expandable graphite/polyamide-6 nanocomposites,” PolymerDegradation and Stability, vol. 89, no. 1, pp. 70–84, 2005.
[3] W. Zheng and S.-C. Wong, “Electrical conductivity and dielec-tric properties of PMMA/expanded graphite composites,”Composites Science and Technology, vol. 63, no. 2, pp. 225–235,2003.
[4] G. Chen, W. Weng, D. Wu, and C. Wu, “PMMA/graphitenanosheets composite and its conducting properties,” Euro-pean Polymer Journal, vol. 39, no. 12, pp. 2329–2335, 2003.
[5] P. Potschke, S. M. Dudkin, and I. Alig, “Dielectric spec-troscopy on melt processed polycarbonate—multiwalled car-bon nanotube composites,” Polymer, vol. 44, no. 17, pp. 5023–5030, 2003.
[6] Z. Ounaies, C. Park, K. E. Wise, E. J. Siochi, and J. S. Har-rison, “Electrical properties of single wall carbon nanotubereinforced polyimide composites,” Composites Science andTechnology, vol. 63, no. 11, pp. 1637–1646, 2003.
[7] A. Boudenne, L. Ibos, M. Fois, J. C. Majeste, and E. Gehin,“Electrical and thermal behavior of polypropylene filled withcopper particles,” Composites Part A, vol. 36, no. 11, pp. 1545–1554, 2005.
[8] J.-W. Kim, W.-J. Cho, and C.-S. Ha, “Morphology, crystallinestructure, and properties of poly(vinylidene fluoride)/silicahybrid composites,” Journal of Polymer Science, Part B, vol. 40,no. 1, pp. 19–30, 2002.
[9] M. Wang, J.-H. Shi, K. P. Pramoda, and S. H. Goh,“Microstructure, crystallization and dynamic mechanicalbehaviour of poly(vinylidene fluoride) composites containingpoly(methyl methacrylate)-grafted multiwalled carbon nan-otubes,” Nanotechnology, vol. 18, no. 23, Article ID 235701, 7pages, 2007.
[10] D. Shah, P. Maiti, E. Gunn, et al., “Dramatic enhancementsin toughness of polyvinylidene fluoride nanocompositesvia nanoclay-directed crystal structure and morphology,”Advanced Materials, vol. 16, no. 14, pp. 1173–1177, 2004.
[11] A. Almasri, Z. Ounaies, Y. S. Kim, and J. Grunlan, “Characteri-zation of solution-processed double-walled carbon nanotube/poly(vinylidene fluoride) nanocomposites,” MacromolecularMaterials and Engineering, vol. 293, no. 2, pp. 123–131,2008.
[12] S. C. Tjong, G. D. Liang, and S. P. Bao, “Electrical behavior ofpolypropylene/multiwalled carbon nanotube nanocompositeswith low percolation threshold,” Scripta Materialia, vol. 57, no.6, pp. 461–464, 2007.
[13] G. D. Liang and S. C. Tjong, “Electrical properties ofpercolative polystyrene/carbon nanofiber composites,” IEEETransactions on Dielectrics and Electrical Insulation, vol. 15, no.1, pp. 214–220, 2008.
[14] F. He, S. Lau, H. L. Chan, and J. Fan, “High dielectricpermittivity and low percolation threshold in nanocompositesbased on poly(vinylidene fluoride) and exfoliated graphitenanoplates,” Advanced Materials, vol. 21, no. 6, pp. 710–715,2009.
[15] Y. Li, R. K. Y. Li, and S. C. Tjong, “Fabrication and propertiesof PVDF/expanded graphite nanocomposites,” E-Polymers,no. 19, pp. 1–13, 2009.
[16] H. Quan, B.-Q. Zhang, Q. Zhao, R. K. K. Yuen, andR. K. Y. Li, “Facile preparation and thermal degradationstudies of graphite nanoplatelets (GNPs) filled thermoplasticpolyurethane (TPU) nanocomposites,” Composites Part A, vol.40, no. 9, pp. 1506–1513, 2009.
[17] J. Meyer, “Glass transition temperature as a guide to selectionof polymers suitable for PTC materials,” Polymer Engineeringand Science, vol. 13, no. 6, pp. 462–468, 1973.
[18] C.-W. Nan, “Physics of inhomogeneous inorganic materials,”Progress in Materials Science, vol. 37, no. 1, pp. 1–116, 1993.
[19] G. C. Psarras, E. Manolakaki, and G. M. Tsangaris, “Dielectricdispersion and ac conductivity in—Iron particles loaded—polymer composites,” Composites Part A, vol. 34, no. 12, pp.1187–1198, 2003.
[20] H. Bottger and V. V. Bryksin, Hopping Conduction in Solids,Akademie, Berlin, Germany, 1985.
[21] S. Barrau, P. Demont, A. Peigney, C. Laurent, and C.Lacabanne, “DC and AC conductivity of carbon nanotubes-polyepoxy composites,” Macromolecules, vol. 36, no. 14, pp.5187–5194, 2003.
[22] G. C. Psarras, “Hopping conductivity in polymer matrix-metal particles composites,” Composites Part A, vol. 37, no. 10,pp. 1545–1553, 2006.
[23] B. E. Kilbride, J. N. Coleman, J. Fraysse, et al., “Experimentalobservation of scaling laws for alternating current and directcurrent conductivity in polymer-carbon nanotube compositethin films,” Journal of Applied Physics, vol. 92, no. 7, pp. 4024–4030, 2002.
[24] Y. W. Nam, W. N. Kim, Y. H. Cho, et al., “Morphology andphysical properties of binary blend based on PVDF and multi-walled carbon nanotube,” Macromolecular Symposia, vol. 249-250, pp. 478–484, 2007.
[25] S. M. Hong and S. S. Hwang, “Physical properties of thinPVDF/MWNT (multi-walled carbon nanotube) compositefilms by melt blending,” Journal of Nanoscience and Nanotech-nology, vol. 8, no. 9, pp. 4860–4863, 2008.
[26] S. Kirkpatrick, “Percolation and conduction,” Reviews ofModern Physics, vol. 45, no. 4, pp. 574–588, 1973.
[27] D. Stauffer and A. Aharony, Introduction to Percolation Theory,Taylor & Francis, London, UK, 1994.
[28] I. Balberg, “Tunneling and nonuniversal conductivity incomposite materials,” Physical Review Letters, vol. 59, no. 12,pp. 1305–1308, 1987.
10 Journal of Nanomaterials
[29] J. C. Dyre and T. B. Schrøder, “Universality of AC conductionin disordered solids,” Reviews of Modern Physics, vol. 72, no. 3,pp. 873–892, 2000.
[30] J. R. Macdonald, “Impedance spectroscopy,” Annals of Biomed-ical Engineering, vol. 20, no. 3, pp. 289–305, 1992.
[31] L. Wang and Z.-M. Dang, “Carbon nanotube composites withhigh dielectric constant at low percolation threshold,” AppliedPhysics Letters, vol. 87, no. 4, Article ID 042903, 3 pages, 2005.
[32] J. K. Nelson and J. C. Fothergill, “Internal charge behaviour ofnanocomposites,” Nanotechnology, vol. 15, no. 5, pp. 586–595,2004.
[33] Y. Song, Y. Pan, Q. Zheng, and X.-S. Yi, “Electric self-heating behavior of graphite-filled high-density polyethylenecomposites,” Journal of Polymer Science, Part B, vol. 38, no. 13,pp. 1756–1763, 2000.
[34] H. Xie, P. Deng, L. Dong, and J. Sun, “LDPE/carbon blackconductive composites: influence of radiation crosslinking onPTC and NTC properties,” Journal of Applied Polymer Science,vol. 85, no. 13, pp. 2742–2749, 2002.
[35] J. Fournier, G. Boiteux, G. Seytre, and G. Marichy, “Positivetemperature coefficient effect in carbon black/epoxy polymercomposites,” Journal of Materials Science Letters, vol. 16, no.20, pp. 1677–1679, 1997.
[36] X. He, L. Wang, and X. Chen, “PTC effect in carbon black-filled ethylene-propylene-diene terpolymer systems,” Journalof Applied Polymer Science, vol. 80, no. 9, pp. 1571–1574, 2001.
[37] X. J. He, J. H. Du, Z. Ying, H. M. Cheng, and X. J. He,“Positive temperature coefficient effect in multiwalled car-bon nanotube/high-density polyethylene composites,” AppliedPhysics Letters, vol. 86, no. 6, Article ID 062112, 3 pages, 2005.
[38] S. Ansari and E. P. Giannelis, “Functionalized graphenesheet-poly(vinylidene fluoride) conductive nanocomposites,”Journal of Polymer Science, Part B, vol. 47, no. 9, pp. 888–897,2009.
[39] Z.-M. Dang, W.-T. Yan, and H.-P. Xu, “Novel high-dielectric-permittivity poly(vinylidene fluoride)/polypropylene blendcomposites: the influence of the poly(vinylidene fluoride)concentration and compatibilizer,” Journal of Applied PolymerScience, vol. 105, no. 6, pp. 3649–3655, 2007.

Submit your manuscripts athttp://www.hindawi.com
ScientificaHindawi Publishing Corporationhttp://www.hindawi.com Volume 2014
CorrosionInternational Journal of
Hindawi Publishing Corporationhttp://www.hindawi.com Volume 2014
Polymer ScienceInternational Journal of
Hindawi Publishing Corporationhttp://www.hindawi.com Volume 2014
Hindawi Publishing Corporationhttp://www.hindawi.com Volume 2014
CeramicsJournal of
Hindawi Publishing Corporationhttp://www.hindawi.com Volume 2014
CompositesJournal of
NanoparticlesJournal of
Hindawi Publishing Corporationhttp://www.hindawi.com Volume 2014
Hindawi Publishing Corporationhttp://www.hindawi.com Volume 2014
International Journal of
Biomaterials
Hindawi Publishing Corporationhttp://www.hindawi.com Volume 2014
NanoscienceJournal of
TextilesHindawi Publishing Corporation http://www.hindawi.com Volume 2014
Journal of
NanotechnologyHindawi Publishing Corporationhttp://www.hindawi.com Volume 2014
Journal of
CrystallographyJournal of
Hindawi Publishing Corporationhttp://www.hindawi.com Volume 2014
The Scientific World JournalHindawi Publishing Corporation http://www.hindawi.com Volume 2014
Hindawi Publishing Corporationhttp://www.hindawi.com Volume 2014
CoatingsJournal of
Advances in
Materials Science and EngineeringHindawi Publishing Corporationhttp://www.hindawi.com Volume 2014
Smart Materials Research
Hindawi Publishing Corporationhttp://www.hindawi.com Volume 2014
Hindawi Publishing Corporationhttp://www.hindawi.com Volume 2014
MetallurgyJournal of
Hindawi Publishing Corporationhttp://www.hindawi.com Volume 2014
BioMed Research International
MaterialsJournal of
Hindawi Publishing Corporationhttp://www.hindawi.com Volume 2014
Nano
materials
Hindawi Publishing Corporationhttp://www.hindawi.com Volume 2014
Journal ofNanomaterials


![RoleofReactionandFactorsofCarbonNanotubes ...downloads.hindawi.com/journals/jnm/2010/395191.pdf2 Journal of Nanomaterials nanoelectronics [14, 15], sensors [16, 17],andfieldemitters](https://img.pdfslide.net/doc/110x75/5fe84bc6ee4f8f272d4f11f5/roleofreactionandfactorsofcarbonnanotubes-2-journal-of-nanomaterials-nanoelectronics.jpg)


![DynamicsoftheGreenandRedUpconversionEmissionsin …downloads.hindawi.com/journals/jnm/2010/491982.pdfmicrointeraction strength parameter [11, 19]. For simplic-ity we represent this](https://img.pdfslide.net/doc/110x75/5ecfe7a3e6458b090b388a3c/dynamicsofthegreenandredupconversionemissionsin-microinteraction-strength-parameter.jpg)