Embed Size (px)
Citation preview

HEATHResourceCenter
FreshmenDisabilitiesA Biennial Statistical Profile
with
College2001
American Council on Education


byCathy Henderson
FreshmenDisabilitiesA Biennial Statistical Profile
with
College2001
College Freshmen with Disabilities: A BiennialStatistical Profile was prepared under CooperativeAgreement No. H326H980002, awarded to theAmerican Council on Education by the U.S.Department of Education. The contents do not necessarily reflect the views of the U.S.Government, nor does mention of products ororganizations imply endorsement by the U.S.Government.
Copyright © 2001American Council on Education
Single copies of this publication are available free ofcharge. Multiple copies are available for cost-recovery fees. Contact the HEATH Resource Centerfor additional information.
HEATH Resource Center
American Council on EducationOne Dupont Circle NWSuite 800Washington, DC 20036-1193(202) 939-9320 (V/TTY)(800) 544-3284 (V/TTY)E-mail: [email protected]

Table of ContentsIntroduction and Sources of Data . . . . . . . . . . . . . . . . . . . . . . . . . . . . . . . . . . . . . . . . . . . . . . . . . . . . . . . .1
Highlights of the 2000 Freshman Survey . . . . . . . . . . . . . . . . . . . . . . . . . . . . . . . . . . . . . . . . . . . . . . . . . .5
Personal and Family Background . . . . . . . . . . . . . . . . . . . . . . . . . . . . . . . . . . . . . . . . . . . . . . . . . . . . .8
High School Preparation and Matriculation to College . . . . . . . . . . . . . . . . . . . . . . . . . . . . . . . . . . . . .11
College and Career Expectations . . . . . . . . . . . . . . . . . . . . . . . . . . . . . . . . . . . . . . . . . . . . . . . . . . . .13
Self-Perceptions . . . . . . . . . . . . . . . . . . . . . . . . . . . . . . . . . . . . . . . . . . . . . . . . . . . . . . . . . . . . . . . .14
Opinions . . . . . . . . . . . . . . . . . . . . . . . . . . . . . . . . . . . . . . . . . . . . . . . . . . . . . . . . . . . . . . . . . . . . . .16
Differences by Gender Among Full-Time College Freshmen with Disabilities Attending Four-Year Institutions: 2000 . . . . . . . . . . . . . . . . . . . . . . . . . . . . . . . . . . . . . .19
Highlights of Full-Time College Freshmen Attending Four-Year Institutions,by Type of Disability: 2000 . . . . . . . . . . . . . . . . . . . . . . . . . . . . . . . . . . . . . . . . . . . . . . . . . . . . . . . . . . . .21
Learning Disability . . . . . . . . . . . . . . . . . . . . . . . . . . . . . . . . . . . . . . . . . . . . . . . . . . . . . . . . . . . . . . .21
Partially Sighted or Blind . . . . . . . . . . . . . . . . . . . . . . . . . . . . . . . . . . . . . . . . . . . . . . . . . . . . . . . . . .23
Health-Related Disability . . . . . . . . . . . . . . . . . . . . . . . . . . . . . . . . . . . . . . . . . . . . . . . . . . . . . . . . . .24
Hearing Impairment . . . . . . . . . . . . . . . . . . . . . . . . . . . . . . . . . . . . . . . . . . . . . . . . . . . . . . . . . . . . . .25
Orthopedic Impairment . . . . . . . . . . . . . . . . . . . . . . . . . . . . . . . . . . . . . . . . . . . . . . . . . . . . . . . . . . .25
Speech Impairment . . . . . . . . . . . . . . . . . . . . . . . . . . . . . . . . . . . . . . . . . . . . . . . . . . . . . . . . . . . . . .26
Summary: Recent Trends . . . . . . . . . . . . . . . . . . . . . . . . . . . . . . . . . . . . . . . . . . . . . . . . . . . . . . . . . . . . .27
Appendix . . . . . . . . . . . . . . . . . . . . . . . . . . . . . . . . . . . . . . . . . . . . . . . . . . . . . . . . . . . . . . . . . . . . . . . . . .29
Table A-1: Selected Characteristics of Full-Time College Freshmen Attending Four-Year Institutions,by Type of Disability: 2000 . . . . . . . . . . . . . . . . . . . . . . . . . . . . . . . . . . . . . . . . . . . . . . . . . . . . . . . . .30
Table A-2: Distribution of Full-Time College Freshmen Attending Four-Year Institutions,by Gender, Race/Ethnicity, and Disability Status: 2000 . . . . . . . . . . . . . . . . . . . . . . . . . . . . . . . . . . . . .32
Table A-3: Selected Characteristics of Full-Time College Freshmen Attending Four-Year Institutions,by Gender and Disability Status: 2000 . . . . . . . . . . . . . . . . . . . . . . . . . . . . . . . . . . . . . . . . . . . . . . . .33
Acknowledgments . . . . . . . . . . . . . . . . . . . . . . . . . . . . . . . . . . . . . . . . . . . . . . . . . . . . . . . . . . . . . . . . . .37
HEATH Resource Center Advisory Board and Staff . . . . . . . . . . . . . . . . . . . . . . . . . . . . . . . . . . . . . . . . . .39
ACE Board of Directors . . . . . . . . . . . . . . . . . . . . . . . . . . . . . . . . . . . . . . . . . . . . . . . . . . . . . . . . . . . . . . .41
List of TablesTable 1: Percentage of Full-Time College Freshmen Reporting Disabilities at Four-Year Institutions:Selected Years . . . . . . . . . . . . . . . . . . . . . . . . . . . . . . . . . . . . . . . . . . . . . . . . . . . . . . . . . . . . . . . . . . . . . . .4
Table 2: Types of Disabilities Reported by Full-Time College Freshmen Attending Four-Year Institutions, by Percentage: Selected Years . . . . . . . . . . . . . . . . . . . . . . . . . . . . . . . . . . . .7
Table 3: Types of Disabilities Reported by Full-Time College Freshmen Attending Four-Year Institutions,by Control of Institution: 2000 . . . . . . . . . . . . . . . . . . . . . . . . . . . . . . . . . . . . . . . . . . . . . . . . . . . . . . . . . . . .7
Table 4: Race/Ethnicity of Full-Time College Freshmen Attending Four-Year Institutions,by Disability Status: 2000 . . . . . . . . . . . . . . . . . . . . . . . . . . . . . . . . . . . . . . . . . . . . . . . . . . . . . . . . . . . . . . .9

Table 5: Major Reasons for Attending College, by Disability Status of Full-Time College Freshmen Attending Four-Year Institutions: 2000 . . . . . . . . . . . . . . . . . . . . . . . . . . . . . . . . . . . . . . . . . . . . . . . . . . . . . . . . . . . . .12
Table 6: Reasons Why Full-Time Freshmen Attending Four-Year Institutions Chose Particular Colleges,by Disability Status: 2000 . . . . . . . . . . . . . . . . . . . . . . . . . . . . . . . . . . . . . . . . . . . . . . . . . . . . . . . . . . . . . .12
Table 7: Sources of Financial Support of Full-Time Freshmen Attending Four-Year Institutions,by Disability Status: 2000 . . . . . . . . . . . . . . . . . . . . . . . . . . . . . . . . . . . . . . . . . . . . . . . . . . . . . . . . . . . . . .13
Table 8: Self-Perceptions of Full-Time College Freshmen Attending Four-Year Institutions,by Disability Status: 2000 . . . . . . . . . . . . . . . . . . . . . . . . . . . . . . . . . . . . . . . . . . . . . . . . . . . . . . . . . . . . . .15
Table 9: Use of Special Tutoring and Remedial Help by Full-Time College Freshmen Attending Four-Year Institutions, by Disability Status: 2000 . . . . . . . . . . . . . . . . . . . . . . . . . . . . . . . . . . . . . . . . . . . . . .16
Table 10: Life Objectives of Full-Time College Freshmen Attending Four-Year Institutions,by Disability Status: 2000 . . . . . . . . . . . . . . . . . . . . . . . . . . . . . . . . . . . . . . . . . . . . . . . . . . . . . . . . . . . . . .17
Table 11: Political Opinions/Orientation of Full-Time College Freshmen Attending Four-Year Institutions,by Disability Status: 2000 . . . . . . . . . . . . . . . . . . . . . . . . . . . . . . . . . . . . . . . . . . . . . . . . . . . . . . . . . . . . . .18
Table 12: Differences Between Female and Male Full-Time College Freshmen Attending Four-Year Institutions, by Type of Disability: 2000 . . . . . . . . . . . . . . . . . . . . . . . . . . . . . . . . . . . . . . . . . . . . .20
Table 13: Percentage of Full-Time College Freshmen with Multiple Disabilities Attending Four-Year Institutions, by Type of Disability: 2000 . . . . . . . . . . . . . . . . . . . . . . . . . . . . . . . . . . . . . . . . . . . . .22
List of FiguresFigure 1: Number of Full-Time College Freshmen with Disabilities Attending Four-Year Institutions:Selected Years . . . . . . . . . . . . . . . . . . . . . . . . . . . . . . . . . . . . . . . . . . . . . . . . . . . . . . . . . . . . . . . . . . . . . . .6
Figure 2: Full-Time College Freshmen with Disabilities Attending Four-Year Institutions,by Type of Disability and Type of Institution: 2000 . . . . . . . . . . . . . . . . . . . . . . . . . . . . . . . . . . . . . . . . . . . . . .8
Figure 3: Full-Time College Freshmen with Disabilities Attending Four-Year Institutions,by Race/Ethnicity: 2000 . . . . . . . . . . . . . . . . . . . . . . . . . . . . . . . . . . . . . . . . . . . . . . . . . . . . . . . . . . . . . . . .10
Figure 4: Difference Between Female and Male Full-Time College Freshmen Attending Four-Year Institutions,by Disability Status: 2000 . . . . . . . . . . . . . . . . . . . . . . . . . . . . . . . . . . . . . . . . . . . . . . . . . . . . . . . . . . . . . .10
Figure 5: Use of Special Tutoring and Remedial Help by Full-Time College Freshmen Attending Four-Year Institutions, by Disability Status: 2000 . . . . . . . . . . . . . . . . . . . . . . . . . . . . . . . . . . . . . . . . . . . . . .23

Introduction and Sourcesof Data
In a strong economy, high school graduates have many options.Some students use their secondary educational training to securean entry-level job with the possibility of advancement. Other gradu-ates enroll in vocational schools to acquire specific occupationaltraining. The community college system also offers a wide variety of
curricula for recent high school graduates as well as for adults who arestarting postsecondary education or returning to college.
Recent high school graduates who choose to enroll in four-year institu-tions face a variety of changes in their lives. Many students will be leavinghome and living in residence halls with a cross-section of students fromdiverse backgrounds. As time passes, these students will find that theyoften have a great deal in common. They are eager to take challengingcourses, to expand their social lives, and to become more independent.
In addition to these changes, some students face additional challenges:They have specific disabilities. About 6 percent of first-time, full-timefreshmen attending four-year institutions in fall 2000 self-reported a dis-ability. These students may need disability-related accommodations suchas notetakers, interpreters, readers, or other accommodations to ensurethat the academic program is accessible to them.
This report describes students who reported disabilities and who enrolledin fall 2000 as full-time freshmen at public and independent four-year col-leges and universities. Since 1966, a national survey of college studentshas been administered to a large sample of freshmen each year. This surveyis conducted by the Cooperative Institutional Research Program (CIRP) 1

2
and is cosponsored by the American Council on Education (ACE) and theGraduate School of Education and Information Studies of the University ofCalifornia at Los Angeles (UCLA). The purpose of this survey is to providea profile of first-time, full-time freshmen at the beginning of their collegeexperiences. Sometimes follow-up surveys are administered to some ofthese students to assess their progress through college or in their careers.
Typically, the survey sponsors administer the annual survey of freshmen inearly fall, gathering data on students’ personal background, high schoolexperiences, educational and career goals, and opinions. Administratorscollect survey responses from a stratified sample of accredited institutionsacross the United States; these samples are weighted to reflect the nationalcohort of freshmen for each specific year of the survey. For example, in fall2000, survey administrators tabulated questionnaires from 269,413 studentsat 434 baccalaureate colleges and universities. The responses were weightedto represent the national enrollment patterns of the total 1.1 million first-time, full-time freshmen attending four-year institutions in 2000.
In fall 2000, survey
administrators tabulated
questionnaires from
269,413 students at
434 baccalaureate
colleges and universities.
Note:Until fall 2000, survey administrators had collected data yearly from two- and four-year institutions;however, it has become increasingly difficult to tabulate survey responses from two-year colleges thatreflect the experiences of first-time, full-time freshmen. So many of these students are either (1) returningto college and therefore are not first-time students, or (2) enrolled part time. The fall 2000 CIRP surveywas the prototype of a redesign intended to focus on students attending only four-year institutions.
As a result, data from this 2001 publication—which presents data collected in fall 2000 from four-year institutions only—cannot be compared directly to data found in previous editions of this report.(Data from past reports reflected responses from students attending both four-year and two-year insti-tutions.) This 2001 edition of College Freshmen with Disabilities is the first report to reflect only thesurvey responses of first-time, full-time freshmen at four-year institutions.
Following the principles of responsible data analysis, this report is solely a data profile. Until afuture report contains only data generated from first-time, full-time freshmen at four-year institutionsonly, comparisons of findings cannot be made. Correspondingly, this data profile cannot, and does not,speculate on implications and/or recommendations that can be drawn from the data. Future implica-tions and/or recommendations can only be made once there are at least two similar data profiles thatcan be directly compared.
Readers of this 2001 edition of College Freshmen with Disabilities also should know that, for con-sistency, the author of this report uses language which directly mirrors that used in the CIRP survey.For example, this report refers to “special programs offered by the college” and “special tutoring andremedial services.” Due to the author’s desire for consistency, use of the word “special” within suchphrases directly reflects language used in the CIRP survey. “Special” does not imply any direct rela-tionship between the K–12 special education system and the parameters of providing accommodativeservices at the postsecondary level.

3
The survey results
revealed 66,197 freshmen
with disabilities—
this represents about
6 percent of all
first-time, full-time
students enrolled
during fall 2000
at four-year institutions.
The CIRP provided the HEATH Resource Center with a special set of tabu-lations based on fall 2000 freshman answers to the following question:
Do you have a disability? (Mark all that apply.)
■■ None
■■ Hearing
■■ Speech
■■ Orthopedic
■■ Learning disability
■■ Health-related
■■ Partially sighted or blind
■■ Other
Students who respond to the CIRP question self-report their disabilities inthe fall of their freshman year. The survey does not provide definitions ofthe disability categories listed. In addition, there is no information availableon how long the students have lived with their disability(ies) or whether thedisability(ies) have been formally diagnosed. When survey administratorsweighted the responses to reflect the national cohort of entering freshmenacross the United States, the survey results revealed 66,197 freshmen withdisabilities—this represents about 6 percent of all first-time, full-time studentsenrolled during fall 2000 at four-year institutions.
Section 504 of the Rehabilitation Act of 1973, which went into effect in1977, prohibits discrimination based on disability in all institutions thatreceive federal funds; this includes most colleges and universities. TheAmericans with Disabilities Act of 1990 reaffirmed the Rehabilitation Actand extended the protection of civil rights of people with disabilities toinclude public and private entities. Of students surveyed at four-year insti-tutions only, the proportion of freshmen reporting disabilities averaged 6 to 8 percent between 1988 and 2000 (see Table 1).
4
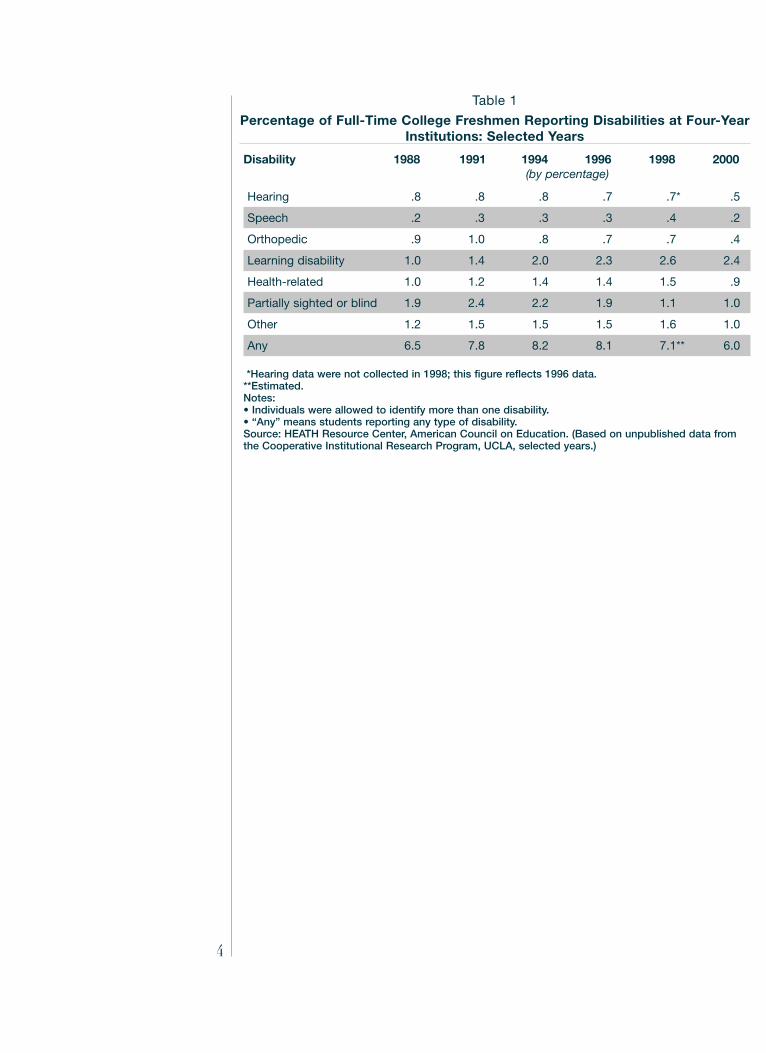
Table 1
Percentage of Full-Time College Freshmen Reporting Disabilities at Four-YearInstitutions: Selected Years
Disability 1988 1991 1994 1996 1998 2000(by percentage)
Hearing .8 .8 .8 .7 .7* .5
Speech .2 .3 .3 .3 .4 .2
Orthopedic .9 1.0 .8 .7 .7 .4
Learning disability 1.0 1.4 2.0 2.3 2.6 2.4
Health-related 1.0 1.2 1.4 1.4 1.5 .9
Partially sighted or blind 1.9 2.4 2.2 1.9 1.1 1.0
Other 1.2 1.5 1.5 1.5 1.6 1.0
Any 6.5 7.8 8.2 8.1 7.1** 6.0
*Hearing data were not collected in 1998; this figure reflects 1996 data.**Estimated.Notes: • Individuals were allowed to identify more than one disability.• “Any” means students reporting any type of disability.Source: HEATH Resource Center, American Council on Education. (Based on unpublished data fromthe Cooperative Institutional Research Program, UCLA, selected years.)
5
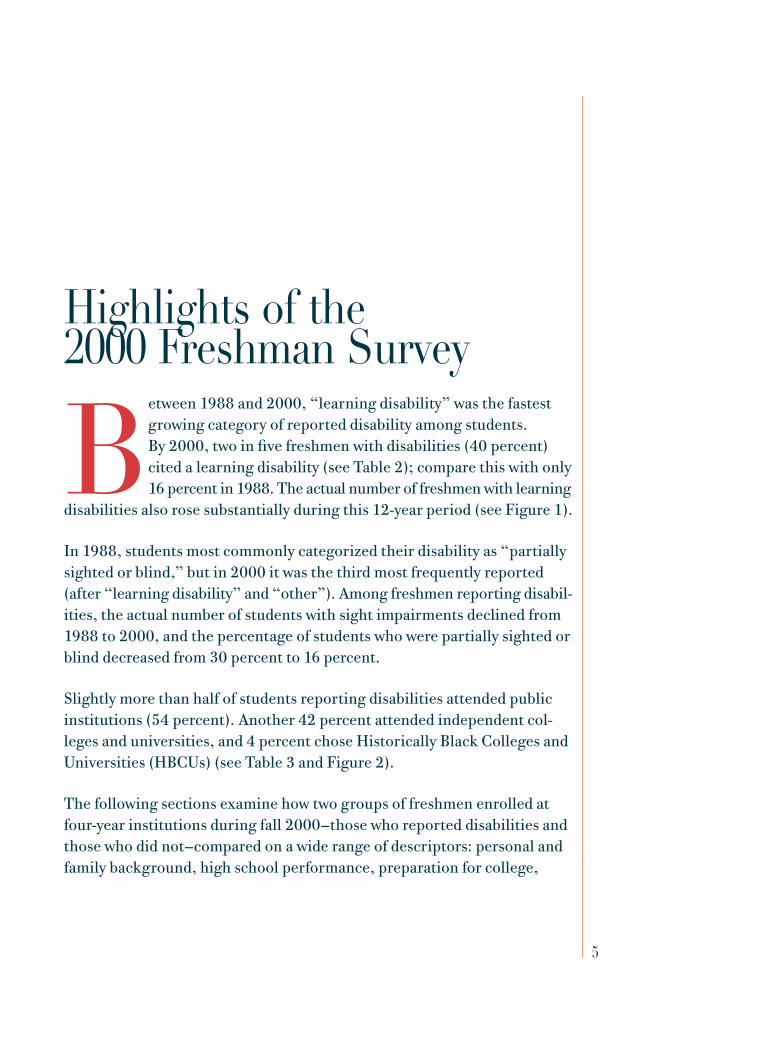
Highlights of the 2000 Freshman Survey
Between 1988 and 2000, “learning disability” was the fastestgrowing category of reported disability among students. By 2000, two in five freshmen with disabilities (40 percent)cited a learning disability (see Table 2); compare this with only 16 percent in 1988. The actual number of freshmen with learning
disabilities also rose substantially during this 12-year period (see Figure 1).
In 1988, students most commonly categorized their disability as “partiallysighted or blind,” but in 2000 it was the third most frequently reported(after “learning disability” and “other”). Among freshmen reporting disabil-ities, the actual number of students with sight impairments declined from1988 to 2000, and the percentage of students who were partially sighted orblind decreased from 30 percent to 16 percent.
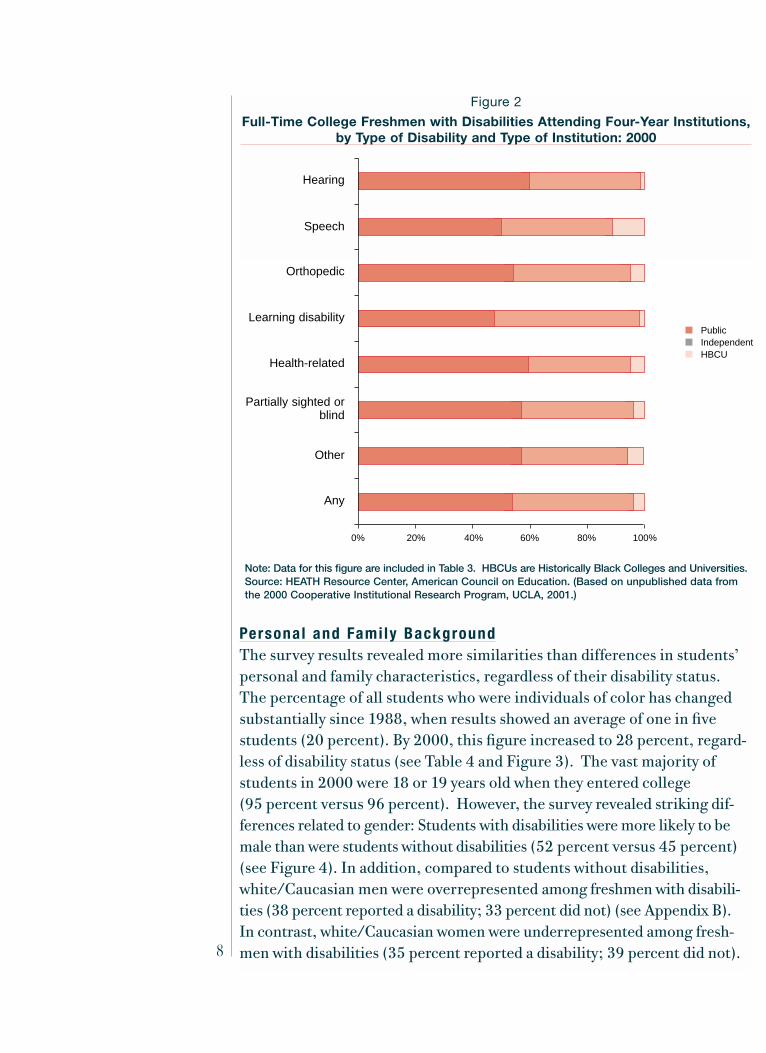
Slightly more than half of students reporting disabilities attended publicinstitutions (54 percent). Another 42 percent attended independent col-leges and universities, and 4 percent chose Historically Black Colleges andUniversities (HBCUs) (see Table 3 and Figure 2).
The following sections examine how two groups of freshmen enrolled atfour-year institutions during fall 2000—those who reported disabilities andthose who did not—compared on a wide range of descriptors: personal andfamily background, high school performance, preparation for college,

6
The actual number of
freshmen with learning
disabilities also rose
substantially during
this 12-year period
(see Figure 1).
educational and career expectations, self-perceptions, and opinions. Latersections compare women and men who have disabilities with students whohave specific types of disabilities as reported by freshmen.
Note: Hearing data were not collected in 1998; this figure reflects 1996 data.Source: HEATH Resource Center, American Council on Education. (Based on unpublished data fromthe Cooperative Institutional Research Program, UCLA, selected years.)
Figure 1
Number of Full-Time College Freshmen with Disabilities Attending Four-YearInstitutions: Selected Years
Hearing
Speech
Orthopedic
Learning disability
Health-related
Partially sighted or blind
Other
■ 1988■ 1991■ 1994■ 1996■ 1998■ 2000
0 5,000 10,000 15,000 20,000 25,000 30,000
For many characteristics, no substantial differences existed between students with and without dis-abilities; therefore, this report uses a single number, such as 8 percent, to describe both groups. Whendiscussing characteristics that did yield substantial differences, however, this report will present twopercentage comparisons, such as 19 percent versus 55 percent. In such a case, the first numberrefers to students with disabilities and the second number applies to students who have not self-reported any disabilities in 2000. Detailed statistics by type of disability appear in Appendix A.

7
Table 2
Types of Disabilities Reported by Full-Time College Freshmen Attending Four-Year Institutions, by Percentage: Selected Years
Disability 1988 1991 1994 1996 1998 2000(by percentage)
Hearing 11.7 10.5 9.3 8.5 8.5* 8.6
Speech 3.6 4.2 3.3 3.2 3.0 2.9
Orthopedic 13.2 12.2 9.7 9.0 8.1 7.1
Learning disability 16.1 17.6 24.5 28.3 34.3 40.4
Health-related 15.8 15.4 17.6 17.4 16.4 15.4
Partially sighted or blind 30.0 31.3 27.3 23.7 19.9 16.1
Other 19.1 18.9 17.7 18.6 17.8 16.9
*Hearing data were not collected in 1998; this figure reflects 1996 data.Notes: • Above data should be interpreted in the following way: For example, in 2000, 40.4 percent of
students with disabilities reported a learning disability.• Columns do not necessarily add to 100 percent because students could list more than one disability.Source: HEATH Resource Center, American Council on Education. (Based on unpublished data fromthe Cooperative Institutional Research Program, UCLA, selected years.)
Table 3
Types of Disabilities Reported by Full-Time College Freshmen AttendingFour-Year Institutions, by Control of Institution: 2000
Disability Public Independent HBCU* Total
Hearing 3,397 2,208 57 5,662
Speech 965 753 212 1,930
Orthopedic 2,537 1,927 235 4,699
Learning disability 12,835 13,369 535 26,739
Health-related 6,104 3,561 509 10,174
Partially sighted or blind 6,085 4,164 427 10,676
Other 6,365 4,131 670 11,166
Total reporting a disability 38,288 30,113 2,645 71,046
Percentage Distribution
Hearing 60 39 1 100
Speech 50 39 11 100
Orthopedic 54 41 5 100
Learning disability 48 50 2 100
Health-related 60 35 5 100
Partially sighted or blind 57 39 4 100
Other 57 37 6 100
Total reporting a disability 54 42 4 100
*Historically Black Colleges and UniversitiesNote: This table shows the distribution of 71,046 disabilities reported by 66,197 freshmen.Source: HEATH Resource Center, American Council on Education. (Based on unpublished data fromthe 2000 Cooperative Institutional Research Program, UCLA, 2001.)
Slightly more than half
of students reporting
disabilities attended public
institutions (54 percent).
Another 42 percent
attended independent
colleges and universities,
and 4 percent chose
Historically Black
Colleges and Universities.
8
Personal and Fami ly BackgroundThe survey results revealed more similarities than differences in students’personal and family characteristics, regardless of their disability status.The percentage of all students who were individuals of color has changedsubstantially since 1988, when results showed an average of one in five students (20 percent). By 2000, this figure increased to 28 percent, regard-less of disability status (see Table 4 and Figure 3). The vast majority of students in 2000 were 18 or 19 years old when they entered college (95 percent versus 96 percent). However, the survey revealed striking dif-ferences related to gender: Students with disabilities were more likely to bemale than were students without disabilities (52 percent versus 45 percent)(see Figure 4). In addition, compared to students without disabilities,white/Caucasian men were overrepresented among freshmen with disabili-ties (38 percent reported a disability; 33 percent did not) (see Appendix B).In contrast, white/Caucasian women were underrepresented among fresh-men with disabilities (35 percent reported a disability; 39 percent did not).
Figure 2
Full-Time College Freshmen with Disabilities Attending Four-Year Institutions,by Type of Disability and Type of Institution: 2000
Note: Data for this figure are included in Table 3. HBCUs are Historically Black Colleges and Universities.Source: HEATH Resource Center, American Council on Education. (Based on unpublished data fromthe 2000 Cooperative Institutional Research Program, UCLA, 2001.)
Hearing
Speech
Orthopedic
Learning disability
Health-related
Partially sighted or blind
Other
Any
■ Public■ Independent■ HBCU
0% 20% 40% 60% 80% 100%
9
Regardless of their disability status, nearly all students were U.S. citizens(97 percent versus 96 percent) and spoke English as their native language(95 percent versus 92 percent). At least seven in 10 students of each group(72 percent versus 73 percent) were living with both parents. About one infour students (24 percent versus 23 percent) was living with a divorced orseparated parent; a small proportion (4 percent) had parents who weredeceased.
The survey also revealed similar demographic characteristics between parents of students with disabilities and parents of other students. For eachgroup, about 94 percent of both parents had at least graduated from highschool, and about half had completed a college degree. Likewise, parents’careers were similar for students with and without disabilities. The fourmost frequently cited occupations for mothers were business managers (15 percent), full-time homemakers (11 percent), elementary educationteachers (11 percent versus 10 percent) and nurses (9 percent). Amongfathers, the three most prevalent types of employment included businessmanagers (31 percent versus 29 percent), engineers (8 percent), and skilledworkers (7 percent versus 8 percent).
Freshmen with disabilities were slightly more likely to come from higherincome families. The median family income of freshmen with disabilitieswas $66,794, compared to $64,500 for other students’ families.
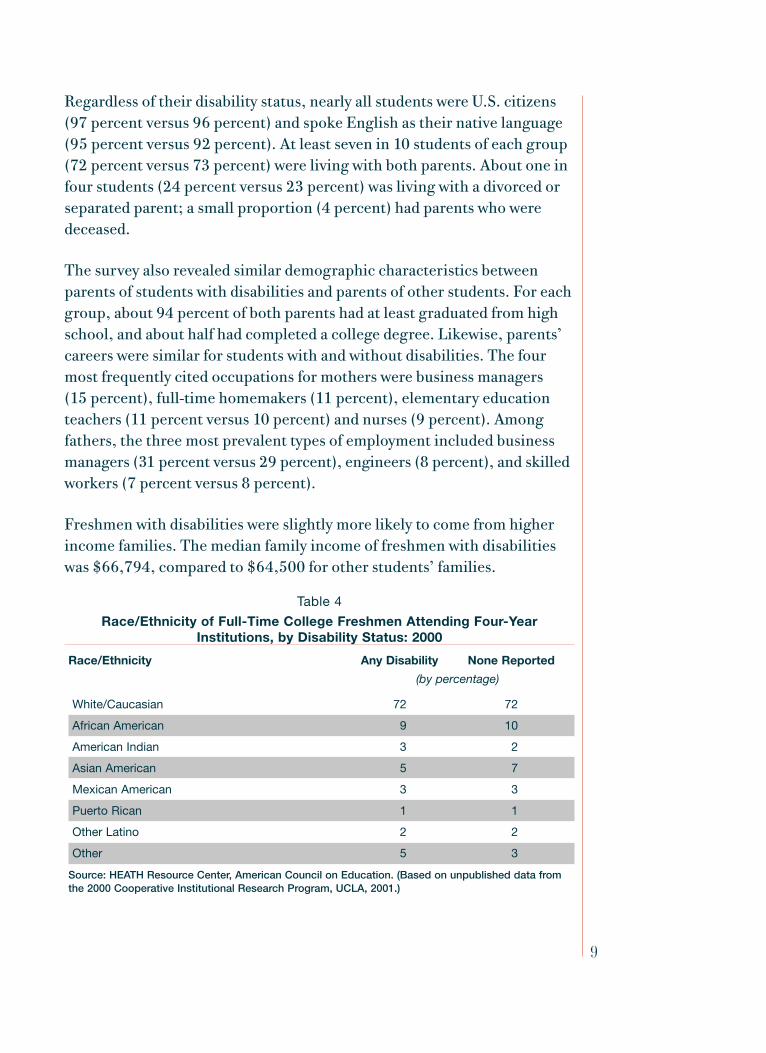
Table 4
Race/Ethnicity of Full-Time College Freshmen Attending Four-YearInstitutions, by Disability Status: 2000
Race/Ethnicity Any Disability None Reported
(by percentage)
White/Caucasian 72 72
African American 9 10
American Indian 3 2
Asian American 5 7
Mexican American 3 3
Puerto Rican 1 1
Other Latino 2 2
Other 5 3
Source: HEATH Resource Center, American Council on Education. (Based on unpublished data fromthe 2000 Cooperative Institutional Research Program, UCLA, 2001.)

Compared to students
without disabilities,
white/Caucasian men
were overrepresented
among freshmen with
disabilities (38 percent
reported a disability;
33 percent did not).
10
Note: Data for this figure are included in Appendix, Table A-1.Source: HEATH Resource Center, American Council on Education. (Based on unpublished data fromthe 2000 Cooperative Institutional Research Program, UCLA, 2001.)
Figure 3
Full-Time College Freshmen with Disabilities Attending Four-Year Institutions, by Race/Ethnicity: 2000
Orthopedic
Learning disability
Health-related
Partially sighted or blind
Other
Any
None
■ White/Caucasian■ African-American■ American Indian■ Asian American■ Mexican American■ Puerto Rican■ Other Latino■ Other
0% 10% 20% 30% 40% 50% 60% 70% 80% 90% 100%
Speech
Hearing
Figure 4
Difference Between Female and Male Full-Time College Freshmen AttendingFour-Year Institutions, by Disability Status: 2000
Note: Above data should be interpreted in the following way: For example, male students constituted52 percent of students reporting disabilities, but only 45 percent of students not reporting disabilities.Source: HEATH Resource Center, American Council on Education. (Based on unpublished data fromthe 2000 Cooperative Institutional Research Program, UCLA, 2001.)
■ Any Disability■ None Reported
48%
Women Men
55%52%
45%
60%
50%
40%
30%
20%
10%
0%

11
High School Preparat ion and Matr iculat ion to Col legeStudents with and without disabilities shared many common experiencesduring their high school years. Both groups typically spent four hours onhomework per week, and about three in four students had used a personalcomputer during the year prior to the time of the fall 2000 survey adminis-tration. Yet differences arose in the level of academic performance: A smallershare of students with disabilities than other students had earned “A” averages(30 percent versus 44 percent), and a larger proportion had earned “C” and“D” averages (12 percent versus 6 percent). In addition, students reportingdisabilities were more inclined to have asked their high school teachers foradvice (33 percent versus 23 percent). However, the survey results revealedno significant difference in the average amount of time spent working for pay,performing domestic chores, watching television, volunteering, or partici-pating in sports or student clubs.
Most students (98 percent), regardless of disability status, had graduatedfrom high school and enrolled in college during calendar year 2000. Aboutone in 10 students had attended college courses at another postsecondaryinstitution prior to enrolling as a full-time freshman. For both groups ofstudents, the vast majority (70 percent) were attending the college that hadbeen their first choice. When listing important factors that had influencedtheir decisions to attend college, students responded with similar answers.Table 5 lists the major reasons cited by both groups. However, two reasonsseemed more important to freshmen with disabilities than to freshmen whodid not report disabilities:■ The desire to improve reading/study skills (45 percent versus 41 percent).
■ The encouragement of a role model /mentor (18 percent versus 13 percent).
When asked specifically why they had chosen their particular colleges, bothgroups of students gave many similar responses, the top three being (1) thecollege’s solid academic reputation, (2) the fact that graduates traditionallygot good jobs, and (3) the size of the college (see Table 6). However, studentswith disabilities recognized that the size of the college and its special programswere more important to them than to their classmates without disabilities.
The survey revealed no important differences between the average distancefrom each of the group’s homes to their colleges. About half of each grouptraveled 100 miles or fewer to enroll. Students with disabilities were as likelyas their peers to be living on campus (81 percent versus 78 percent) or tobe living with parents, with relatives, or in a private apartment (19 percentversus 22 percent).
Freshmen with
disabilities received
fewer college-based
grants (28 percent)
than their peers who did
not report disabilities
(33 percent).
12
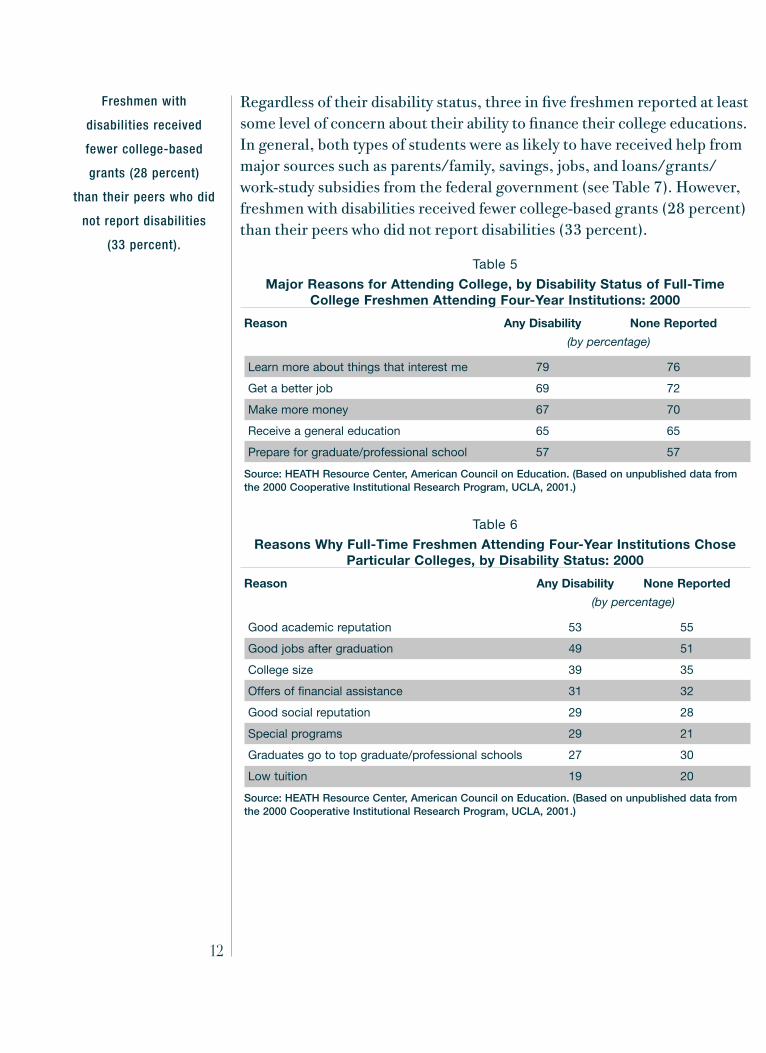
Regardless of their disability status, three in five freshmen reported at leastsome level of concern about their ability to finance their college educations.In general, both types of students were as likely to have received help frommajor sources such as parents/family, savings, jobs, and loans/grants/work-study subsidies from the federal government (see Table 7). However,freshmen with disabilities received fewer college-based grants (28 percent)than their peers who did not report disabilities (33 percent).
Table 5
Major Reasons for Attending College, by Disability Status of Full-TimeCollege Freshmen Attending Four-Year Institutions: 2000
Reason Any Disability None Reported
(by percentage)
Learn more about things that interest me 79 76
Get a better job 69 72
Make more money 67 70
Receive a general education 65 65
Prepare for graduate/professional school 57 57
Source: HEATH Resource Center, American Council on Education. (Based on unpublished data fromthe 2000 Cooperative Institutional Research Program, UCLA, 2001.)
Table 6
Reasons Why Full-Time Freshmen Attending Four-Year Institutions ChoseParticular Colleges, by Disability Status: 2000
Reason Any Disability None Reported
(by percentage)
Good academic reputation 53 55
Good jobs after graduation 49 51
College size 39 35
Offers of financial assistance 31 32
Good social reputation 29 28
Special programs 29 21
Graduates go to top graduate/professional schools 27 30
Low tuition 19 20
Source: HEATH Resource Center, American Council on Education. (Based on unpublished data fromthe 2000 Cooperative Institutional Research Program, UCLA, 2001.)

Table 7
Sources of Financial Support of Full-Time Freshmen Attending Four-YearInstitutions, by Disability Status: 2000
Source of Financial Support Any Disability None Reported
(by percentage)
Parents or family 81 83
Savings from summer work 46 49
Other savings 33 32
College grants 28 33
Stafford/Guaranteed Student Loan(s) 25 26
Part-time job on campus 25 26
Part-time job off campus 20 22
State scholarship or grant(s) 19 22
Pell grant(s) 16 17
College work-study subsidies 13 13
Private grants 12 12
Institutionally financed college loan(s) 11 12
Perkins loan(s) 9 10
Supplemental Educational Opportunity Grants 6 6
Source: HEATH Resource Center, American Council on Education. (Based on unpublished data fromthe 2000 Cooperative Institutional Research Program, UCLA, 2001.)
Col lege and Career Expectat ionsIn the survey, freshman respondents were asked to describe their educationaland career goals, including their major field of study while in college andtheir preferred occupation. The top field of study chosen by students with-out disabilities was business (17 percent). Students who did report disabili-ties listed business and arts/humanities as their top choices (15 percent foreach field). In general, more students with disabilities than other studentspredicted that they would need extra time to complete their degreerequirements (10 percent versus 6 percent).
The survey presented the freshmen with a list of more than 40 possibleoccupations. Regardless of disability status, the top four career occupationschosen were “business executive,” “engineer,” “elementary teacher/administrator,” and “computer programmer or analyst” (5 percent to 9 percent for each occupation).
13

Sel f-Percept ionsStudents who completed this questionnaire already had achieved one meas-ure of educational success: They had enrolled as first-time, full-time collegestudents. A certain level of intellectual competence and emotional maturitywas necessary for each student to have accomplished this important step;however, the successful completion of educational and career goals may betied to students’ perceptions about their strengths and weaknesses.
One series of questions asked the students to compare themselves withaverage persons of similar ages. At least 60 percent of the students, withand without disabilities, considered themselves to be “above average or inthe top 10 percent of all people” on the ability to be understanding ofothers and to possess leadership skills.
However, on most of these self-rated comparisons, a smaller share of studentswith disabilities than other students ranked themselves at this high level ofability. For example, a smaller share of freshmen with disabilities thanother students rated themselves as “above average or in the top 10 percentof people” on most measures of self-esteem, academic ability, and physicalhealth (see Table 8). However, on two ability measures—artistic and creative—a larger share of students who reported disabilities than students withoutdisabilities rated themselves high.
Students with disabilities predicted that they would use special tutoringand remedial services for specific subjects more often than other students(see Table 9). Also, higher proportions of students with disabilities hadused extra tutoring assistance in high school.
A smaller share of
freshmen with disabilities
than other students
rated themselves as
“above average or in the
top 10 percent of people”
on most measures of
self-esteem, academic
ability, and physical health.
14

Table 8
Self-Perceptions of Full-Time College Freshmen Attending Four-YearInstitutions, by Disability Status: 2000
Ability Any Disability None Reported
(by percentage)
Cooperativeness 69 73
Drive to achieve 67 71
Understanding of others 67 66
Creative ability 64 57
Leadership ability 61 61
Intellectual self-confidence 57 61
Academic ability 57 68
Self-understanding 56 57
Competitiveness 53 57
Social self-confidence 50 52
Spirituality 46 45
Physical health 46 57
Emotional health 44 55
Writing ability 42 46
Public speaking ability 40 37
Popularity 39 41
Mathematical ability 38 45
Artistic ability 35 29
Note: Students were asked to rate themselves as “above average or in the top 10 percent of people”on these measures of ability.Source: HEATH Resource Center, American Council on Education. (Based on unpublished data fromthe 2000 Cooperative Institutional Research Program, UCLA, 2001.)
15

Students with disabilities
predicted that they would
use special tutoring and
remedial services for
specific subjects more
often than other students.
16
Table 9
Use of Special Tutoring and Remedial Help by Full-Time College FreshmenAttending Four-Year Institutions, by Disability Status: 2000
Subject Any Disability None Reported
(by percentage)
Have Had Special Tutoring or Remedial Help in High School
English 15.8 5.1
Reading 13.7 4.5
Mathematics 24.4 12.0
Social studies 7.3 3.5
Science 10.4 4.7
Foreign language 10.9 4.8
Expect to Need Special Tutoring or Remedial Help in College
English 19.1 8.2
Reading 11.4 3.7
Mathematics 35.6 23.5
Social studies 7.4 3.0
Science 16.7 10.1
Foreign language 19.5 10.6
Note: Columns do not necessarily add to 100 percent because students can receive help in more thanone subject.Source: HEATH Resource Center, American Council on Education. (Based on unpublished data fromthe 2000 Cooperative Institutional Research Program, UCLA, 2001.)
OpinionsThese freshman surveys serve as annual barometers of the attitudes andpolitical opinions of college students. Similar proportions of those withand without disabilities agree on the importance of achieving life objectivessuch as raising a family, being successful, helping others, and obtainingrecognition from colleagues (see Table 10). However, freshmen with dis-abilities placed a higher priority than their peers on social concerns (suchas promoting racial understanding and being involved in environmentalclean-up efforts) and creative contributions (such as writing and the per-forming arts).

Generally, the results of the 2000 survey did not reveal important distinc-tions in the political opinions expressed by students based on disabilitystatus (see Table 11). For example, at least half of each group of studentsfelt that (1) the federal government could do more to control handguns, (2) colleges should prohibit racist and sexist speech on campus, and (3) abortion should be legal. In addition, both groups of freshmen charac-terized their political views similarly across the political spectrum; aboutone in two students, regardless of their disability status, classified them-selves as “middle-of-the-road.”
Table 10
Life Objectives of Full-Time College Freshmen Attending Four-YearInstitutions, by Disability Status: 2000
Life Objective Any Disability None Reported
(by percentage)
Raise a family 71 73
Be very well off financially 70 74
Help others in difficulty 64 62
Become an authority in one’s field 59 60
Obtain recognition from colleagues 52 51
Develop a philosophy of life 45 42
Be successful in one’s own business 40 39
Influence social values 40 37
Have administrative responsibility for the work of others 37 37
Promote racial understanding 35 30
Become a community leader 34 31
Keep up to date with political affairs 31 28
Participate in community action 26 22
Be involved in environmental clean-up efforts 21 17
Create artistic works 20 14
Write original works 20 14
Achieve recognition in a performing art 19 14
Source: HEATH Resource Center, American Council on Education. (Based on unpublished data fromthe 2000 Cooperative Institutional Research Program, UCLA, 2001.)
17

Generally, the results
of the 2000 survey did
not reveal important
distinctions in the
political opinions
expressed by students
based on disability status.
18
Table 11
Political Opinions/Orientation of Full-Time College Freshmen Attending Four-Year Institutions, by Disability Status: 2000
Any Disability None Reported
(by percentage)Political Opinion Reported
Federal government should do more to control handguns. 80 82
Colleges should prohibit racist/sexist speech on campus. 59 62
Abortion should be legal. 57 54
The wealthy should pay more taxes. 53 52
Affirmative action in college admissions should be abolished. 50 50
Political Orientation Reported
Far right 2 1
Conservative 18 19
Middle-of-the-road 49 52
Liberal 26 25
Far left 5 3
Source: HEATH Resource Center, American Council on Education. (Based on unpublished data fromthe 2000 Cooperative Institutional Research Program, UCLA, 2001.)

Differences by GenderAmong Full-Time CollegeFreshmen with DisabilitiesAttending Four-YearInstitutions: 2000
In response to many questions in the freshman survey, genderappeared to be a more significant characteristic of students thandisability status. For example, women with disabilities consideredthemselves more similar to women without disabilities than to menwith them. Specifically, women (regardless of their disability status)
were more likely than men to have the following characteristics in common(see Appendix C):
■ To come from a lower-income family.
■ To have a single parent.
■ To have earned excellent high school grades.
■ To have more interest in education, professional fields, and the socialsciences and less interest in engineering and business.
■ To have major concerns about financing their college educations.
However, among freshmen with disabilities, some important distinctionssurfaced between men and women. First, the types of disabilities reportedvaried (see Table 12). Women were more likely to report health-related disabilities, while men reported higher incidences of learning disabilities.
19

Among freshmen with
disabilities, fewer
women than men
thought that they ranked
high on measures of
emotional and
social skills.
20
In the process of choosing a college, more women than men (each with disabilities) based their choices on the academic reputation, size of the college,low tuition, proximity to home, religious affiliation/orientation, and avail-ability of special programs. Expectations also varied by gender. A higher proportion of women than men thought it was likely that they would get a jobto help offset college expenses, earn at least a “B” average, receive a bachelor’sdegree, volunteer for community service, seek personal counseling, and besatisfied with their college experiences.
On measures of competence, a smaller proportion of women than men,regardless of disability status, rated themselves above average on academicability, competitiveness, mathematical ability, and physical health. Amongfreshmen with disabilities, fewer women than men thought that they rankedhigh on measures of emotional and social skills. For example, women weremore likely to report that they often felt depressed or overwhelmed, andthey rated themselves lower than men on measures of popularity, self-confidence, and self-understanding.
Table 12
Differences Between Female and Male Full-Time College Freshmen AttendingFour-Year Institutions, by Type of Disability: 2000
Type of Disability Women Men
(by percentage)
Hearing 9.2 7.9
Speech 1.7 4.1
Orthopedic 7.9 6.4
Learning disability 37.4 43.2
Health-related 19.0 12.0
Partially sighted or blind 16.4 15.9
Other 16.2 17.5
Notes:• Above data should be interpreted in the following way: For example, 37.4 percent of women with
disabilities reported having a learning disability.• Columns do not necessarily add to 100 percent because students could report more than one dis-
ability.Source: HEATH Resource Center, American Council on Education. (Based on unpublished data fromthe 2000 Cooperative Institutional Research Program, UCLA, 2001.)

Highlights of Full-TimeCollege FreshmenAttending Four-YearInstitutions, by Type ofDisability: 2000
When each different type of disability is examined, distinc-tive differences emerge in the characteristics of thestudents who self-reported specific conditions. Forexample, students with certain disabilities were morelikely to report more than one condition (see Table 13).
College students with each type of disability, as well as those who teach,advise, or administer postsecondary support services for them, may beespecially interested in the following section.
Learning Disabi l i tyAmong freshmen with disabilities attending four-year institutions, thelargest group (two in five, or 40 percent) reported a learning disability; in1988, the comparable proportion was only 16 percent. In 2000, 45 percentof those reporting a learning disability were women and 19 percent werestudents of color. Compared to other freshmen with disabilities, studentswith learning disabilities were the most likely to:
■ Be from white/Caucasian families (81 percent versus 72 percent).
■ Be 19 or older (45 percent versus 37 percent).
21

Among students with
disabilities, those with
learning disabilities were
the least likely to have
been offered financial
assistance as an
incentive to enroll.
22
■ Be from families whose income exceeded $100,000 (42 percent versus30 percent).
■ Have parents who were college graduates (65 percent versus 55 percent).
■ Have earned “C” or “D” averages in high school (17 percent versus 12 percent).
■ Expect that they will need special tutoring or remedial work in English(28 percent versus 19 percent), reading (18 percent versus 11 percent),and mathematics (41 percent versus 36 percent) (see Figure 5).
■ Consider majoring in arts and sciences (20 percent versus 15 percent).(Note: They were the least likely to be interested in professional fields [4 percent versus 10 percent]).
■ Rank themselves lowest on math ability (31 percent versus 38 percent),intellectual self-confidence (51 percent versus 57 percent), academicability (42 percent versus 57 percent), and writing ability (34 percentversus 42 percent).
Table 13
Percentage of Full-Time College Freshmen with Multiple DisabilitiesAttending Four-Year Institutions, by Type of Disability: 2000
Partially Ortho- Learning Health- sighted
Disability Hearing Speech pedic disability related or blind Other
(by percentage)
Hearing 100.0 15.0 1.7 1.6 2.1 2.9 1.7
Speech 5.1 100.0 .9 1.0 .7 1.0 .9
Orthopedic 1.4 2.2 100.0 .8 3.8 1.6 2.0
Learning disability 7.5 13.4 4.4 100.0 5.0 2.9 6.4
Health-related 3.8 3.9 8.2 1.9 100.0 2.8 4.3
Partially sighted or blind 5.4 5.3 3.6 1.2 3.0 100.0 1.9
Other 3.3 5.1 4.7 2.7 4.8 2.0 100.0
Note: This table explains multiple disabilities reported by students. The primary disability is listedalong the top and the secondary disability is listed along the left side. Above data should be inter-preted in the following way: For example, 5.1 percent of students with a hearing impairment alsoreported a speech impairment. The number of students reporting each type of disability varied.Therefore, 15 percent of those students reporting a speech impairment also reported a hearing impair-ment. The 100 percent figures indicate the overlap of reporting a specific type of disability.Source: HEATH Resource Center, American Council on Education. (Based on unpublished data fromthe 2000 Cooperative Institutional Research Program, UCLA, 2001.)
Freshmen with learning disabilities particularly valued special programsoffered by colleges (35 percent versus 29 percent of peers without disabili-ties). Among students with disabilities, those with learning disabilitieswere the least likely to have been offered financial assistance as an incen-tive to enroll (23 percent versus 31 percent).

Part ia l ly S ighted or Bl indAbout one in six freshmen with disabilities (16 percent) at four-year institu-tions reported being partially sighted or blind. This figure is almost half ofthe 1988 proportion of 30 percent. In 2000, about half (49 percent) of thefreshmen who were partially sighted or blind were women, and 38 percentwere students of color.
23
Figure 5
Use of Special Tutoring and Remedial Help by Full-Time College FreshmenAttending Four-Year Institutions, by Disability Status: 2000
Note: Data for this figure are included in Appendix, Table A-1.Source: HEATH Resource Center, American Council on Education. (Based on unpublished data fromthe 2000 Cooperative Institutional Research Program, UCLA, 2001.)
Hearing
Speech
Orthopedic
Learning disability
Health-related
Partially sighted or blind
Other
Any
None
■ English■ Reading■ Mathematics■ Social Studies■ Science■ Foreign Language
0% 5% 10% 15% 20% 25% 30% 35% 40% 45%

The proportion of
freshmen with disabilities
who cite health-related
conditions has remained
relatively stable at
15 to 18 percent
since 1988.
Among students reporting disabilities, students who were partially sightedor blind were the most likely to:
■ Be 18 years or younger (71 percent versus 63 percent).
■ Have earned an “A” average in high school (43 percent versus 30 percent).
■ Have chosen the college because they had been offered financial assistance(38 percent versus 31 percent).
■ Have rated themselves above average on measures of academic ability(69 percent versus 57 percent) and mathematical ability (48 percentversus 38 percent).
Heal th-Related Disabi l i tyOf students at four-year institutions, 15 percent described their disabilityas “health-related.” These students may have conditions such as severeallergies, cystic fibrosis, cancer, lupus, or multiple sclerosis. The proportionof freshmen with disabilities who cite health-related conditions has remainedrelatively stable at 15 to 18 percent since 1988. In 2000, three in five studentsreporting a health-related disability (60 percent) were women, and aboutone in three (34 percent) was a student of color.
Compared to other students with disabilities, students who reportedhealth-related disabilities were the most likely to:
■ Be women (60 percent versus 48 percent).
■ Get a job to help pay for college expenses (45 percent versus 38 percent).
■ Have received aid from state scholarships and grants (27 percent versus19 percent).
■ Cite the good academic reputation of the college as a major reason forhaving chosen it (59 percent versus 53 percent).
■ Rank themselves highest on writing ability (49 percent versus 42 percent)and lowest on a comparison of physical health characteristics (30 percentversus 46 percent).
■ Predict that they will earn a bachelor’s degree (79 percent versus 72 percent).
■ Value helping others who are experiencing difficulty as an important lifeobjective (70 percent versus 64 percent).
24

Hear ing ImpairmentOf freshmen attending four-year institutions, 9 percent reported having a hearing impairment; this is lower than the 1988 figure of 12 percent. In 2000, 52 percent of these freshmen were women and 26 percent werepersons of color.
Generally, the characteristics of freshmen with hearing impairments paral-leled those of other students with disabilities. However, among studentswith disabilities, they were the most likely to:
■ Rank themselves highest on the characteristic called “drive to achieve”(72 percent versus 67 percent).
■ Have used savings from summer work to help offset college expenses (53 percent versus 46 percent).
Orthopedic ImpairmentIn 2000, 7 percent of the freshmen with disabilities at four-year institutionsreported having an orthopedic condition; this is almost half of the 1988figure of 13 percent. In 2000, fewer than half were women (46 percent),and 27 percent were persons of color.
Compared to their peers with other disabilities, freshmen with orthopedicdisabilities were the most likely to:
■ Have tutored other high school students (60 percent versus 51 percent).
■ Predict that they will earn at least a “B” average (60 percent versus 51 percent).
■ Have used a personal computer (83 percent versus 77 percent).
■ Participate in volunteer or community service work (31 percent versus25 percent).
■ Aspire to be a community leader (40 percent versus 34 percent) and anauthority in their chosen field (65 percent versus 59 percent).
■ Rank themselves the highest on leadership ability (68 percent versus 61 percent), public speaking ability (47 percent versus 40 percent), andintellectual self-confidence (63 percent versus 57 percent).
25

Speech ImpairmentIn 2000, relatively few freshmen with disabilities who enrolled at four-yearinstitutions (3 percent) reported that they had a speech impairment. Thisis similar to the 1988 proportion of 4 percent. Because the number of casesis small, caution should be used when comparing the characteristics ofthese freshmen with others who reported disabilities.
Compared to any other group of freshmen with disabilities, those withspeech impairments were the most likely to:
■ Be men (72 percent versus 52 percent).
■ Be students of color (48 percent versus 28 percent).
■ Be citizens of other countries (10 percent versus 3 percent).
■ Speak a language other than English (11 percent versus 5 percent).
■ List additional disabilities (see Table 13).
■ Be a first-generation college student (41 percent versus 30 percent).
■ Expect that they will need special tutoring or remedial work in socialstudies (15 percent versus 7 percent), science (21 percent versus 17 percent), and foreign language (29 percent versus 20 percent).
■ Have received aid from Pell Grants (24 percent versus 16 percent) andfederal loans (43 percent versus 33 percent).
■ Be enrolled at HBCUs (11 percent versus 4 percent).
26
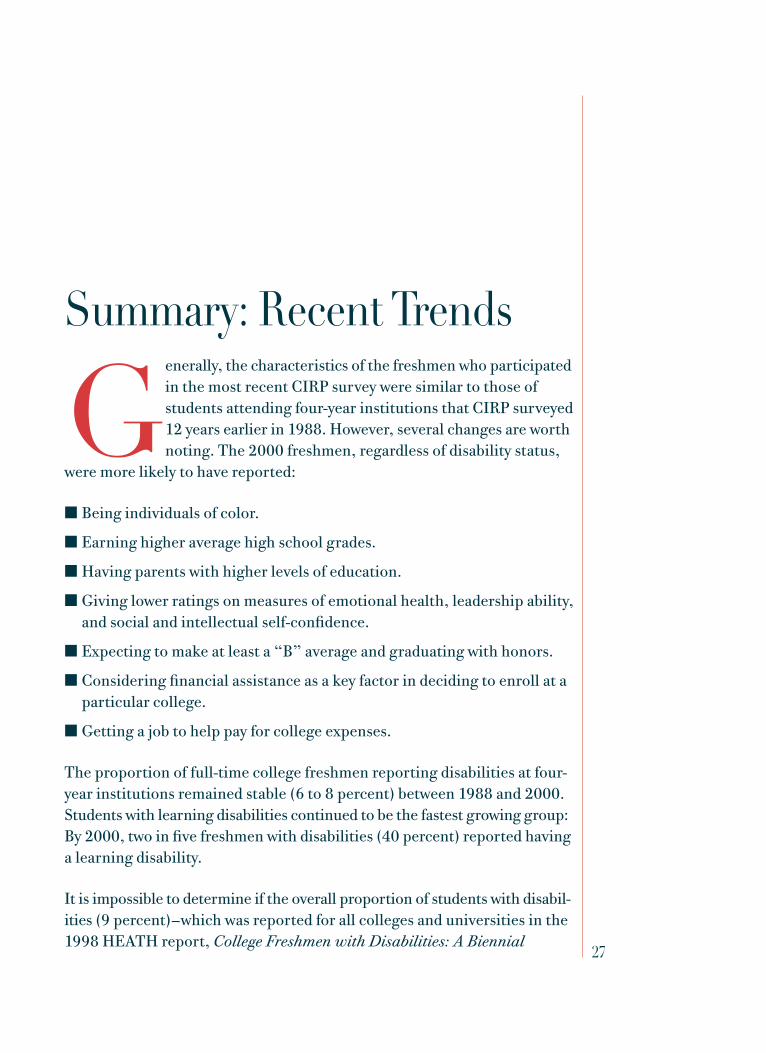
Summary: Recent Trends
Generally, the characteristics of the freshmen who participatedin the most recent CIRP survey were similar to those of students attending four-year institutions that CIRP surveyed12 years earlier in 1988. However, several changes are worthnoting. The 2000 freshmen, regardless of disability status,
were more likely to have reported:
■ Being individuals of color.
■ Earning higher average high school grades.
■ Having parents with higher levels of education.
■ Giving lower ratings on measures of emotional health, leadership ability,and social and intellectual self-confidence.
■ Expecting to make at least a “B” average and graduating with honors.
■ Considering financial assistance as a key factor in deciding to enroll at aparticular college.
■ Getting a job to help pay for college expenses.
The proportion of full-time college freshmen reporting disabilities at four-year institutions remained stable (6 to 8 percent) between 1988 and 2000.Students with learning disabilities continued to be the fastest growing group:By 2000, two in five freshmen with disabilities (40 percent) reported havinga learning disability.
It is impossible to determine if the overall proportion of students with disabil-ities (9 percent)—which was reported for all colleges and universities in the1998 HEATH report, College Freshmen with Disabilities: A Biennial
27

Statistical Profile—would have remained the same, fallen, or risen if the2000 CIRP survey had included the two-year sector. Until 1998, the pro-portion of students who enrolled in public two-year colleges had declinedsteadily, while the percentage choosing four-year colleges and universitieshad slowly increased. However, the 1998 figures suggested that a shift hadoccurred among all freshmen—regardless of disability status—toward moreenrollment in community colleges. It is unclear if these shifts would havecontinued in 2000 and how they would have affected the overall percent-ages of students with disabilities. The 2000 profile in this report does high-light the fact that students enrolled in baccalaureate colleges and universitiesare younger and more affluent than their counterparts at community andjunior colleges.
28
Appendix
29

Table A-1
Selected Characteristics of Full-Time College Freshmen Attending Four-Year Institutions, by Type ofDisability: 2000
PartiallyOrtho- Learning Health- sighted
Characteristic None Hearing Speech pedic disability related or blind Other Any
(by percentage)GENDER
Men 45 48 72 54 55 40 51 54 52
Women 55 52 28 46 45 60 49 46 48
Total 100 100 100 100 100 100 100 100 100
AGE
17 or younger 2 1 2 2 1 2 2 2 2
18 69 61 59 63 54 69 69 61 61
19 27 34 33 31 41 26 27 33 34
20 or older 2 4 6 4 4 3 2 4 3
Total 100 100 100 100 100 100 100 100 100
RACE/ETHNICITY
White/Caucasian 72 74 52 73 81 66 62 64 72
African American 10 7 21 9 6 14 10 11 9
American Indian 2 3 5 3 2 4 3 4 3
Asian American 7 5 9 4 2 4 11 6 5
Mexican American 3 3 4 2 2 4 5 3 3
Puerto Rican 1 2 3 1 1 1 1 2 1
Other Latino 2 2 2 3 2 2 2 2 2
Other 3 4 4 5 4 5 6 8 5
Total 100 100 100 100 100 100 100 100 100
ESTIMATED PARENTAL INCOME
Less than $20,000 9 12 17 10 7 11 14 15 10
$20,000–$49,999 26 28 26 28 18 30 29 28 25
$50,000–$74,999 25 24 21 24 20 22 23 19 21
$75,000 and above 40 36 36 38 55 37 34 38 44
Total 100 100 100 100 100 100 100 100 100
Median Income $64,500 $60,805 $56,874 $61,080 $84,375 $58,406 $57,070 $58,720 $66,794
30
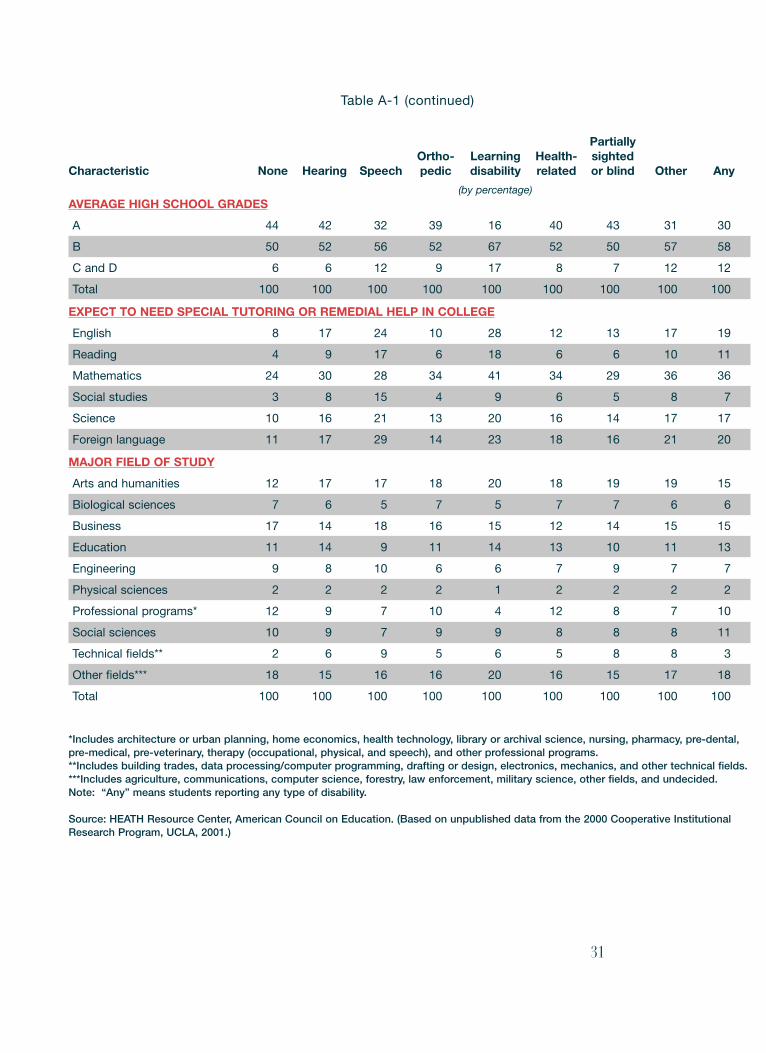
Table A-1 (continued)
PartiallyOrtho- Learning Health- sighted
Characteristic None Hearing Speech pedic disability related or blind Other Any
(by percentage)AVERAGE HIGH SCHOOL GRADES
A 44 42 32 39 16 40 43 31 30
B 50 52 56 52 67 52 50 57 58
C and D 6 6 12 9 17 8 7 12 12
Total 100 100 100 100 100 100 100 100 100
EXPECT TO NEED SPECIAL TUTORING OR REMEDIAL HELP IN COLLEGE
English 8 17 24 10 28 12 13 17 19
Reading 4 9 17 6 18 6 6 10 11
Mathematics 24 30 28 34 41 34 29 36 36
Social studies 3 8 15 4 9 6 5 8 7
Science 10 16 21 13 20 16 14 17 17
Foreign language 11 17 29 14 23 18 16 21 20
MAJOR FIELD OF STUDY
Arts and humanities 12 17 17 18 20 18 19 19 15
Biological sciences 7 6 5 7 5 7 7 6 6
Business 17 14 18 16 15 12 14 15 15
Education 11 14 9 11 14 13 10 11 13
Engineering 9 8 10 6 6 7 9 7 7
Physical sciences 2 2 2 2 1 2 2 2 2
Professional programs* 12 9 7 10 4 12 8 7 10
Social sciences 10 9 7 9 9 8 8 8 11
Technical fields** 2 6 9 5 6 5 8 8 3
Other fields*** 18 15 16 16 20 16 15 17 18
Total 100 100 100 100 100 100 100 100 100
*Includes architecture or urban planning, home economics, health technology, library or archival science, nursing, pharmacy, pre-dental,pre-medical, pre-veterinary, therapy (occupational, physical, and speech), and other professional programs.**Includes building trades, data processing/computer programming, drafting or design, electronics, mechanics, and other technical fields.***Includes agriculture, communications, computer science, forestry, law enforcement, military science, other fields, and undecided.Note: “Any” means students reporting any type of disability.
Source: HEATH Resource Center, American Council on Education. (Based on unpublished data from the 2000 Cooperative InstitutionalResearch Program, UCLA, 2001.)
31

Table A-2
Distribution of Full-Time College Freshmen Attending Four-Year Institutions, by Gender, Race/Ethnicity,and Disability Status: 2000
Any Disability None Reported
Characteristic Number Percent Number Percent
White/Caucasian men 25,051 37.8 338,125 32.7
White/Caucasian women 22,830 34.5 403,653 39.0
African-American men 2,875 4.3 41,280 4.0
African-American women 3,230 4.9 60,605 5.8
American Indian men 890 1.4 7,421 .7
American Indian women 1,023 1.5 10,292 1.0
Asian-American men 1,711 2.6 33,395 3.2
Asian-American women 1,407 2.1 37,735 3.6
Mexican-American men 992 1.5 15,770 1.5
Mexican-American women 895 1.4 21,726 2.1
Puerto Rican men 376 .6 4,174 .4
Puerto Rican women 384 .6 5,717 .6
Other Latino men 582 .9 8,813 .9
Other Latino women 735 1.1 13,150 1.3
Other men 1,745 2.6 14,842 1.4
Other women 1,471 2.2 18,868 1.8
Total 66,197 100.0 1,035,566 100.0
Source: HEATH Resource Center, American Council on Education. (Based on unpublished data from the 2000 Cooperative InstitutionalResearch Program, UCLA, 2001.)
32
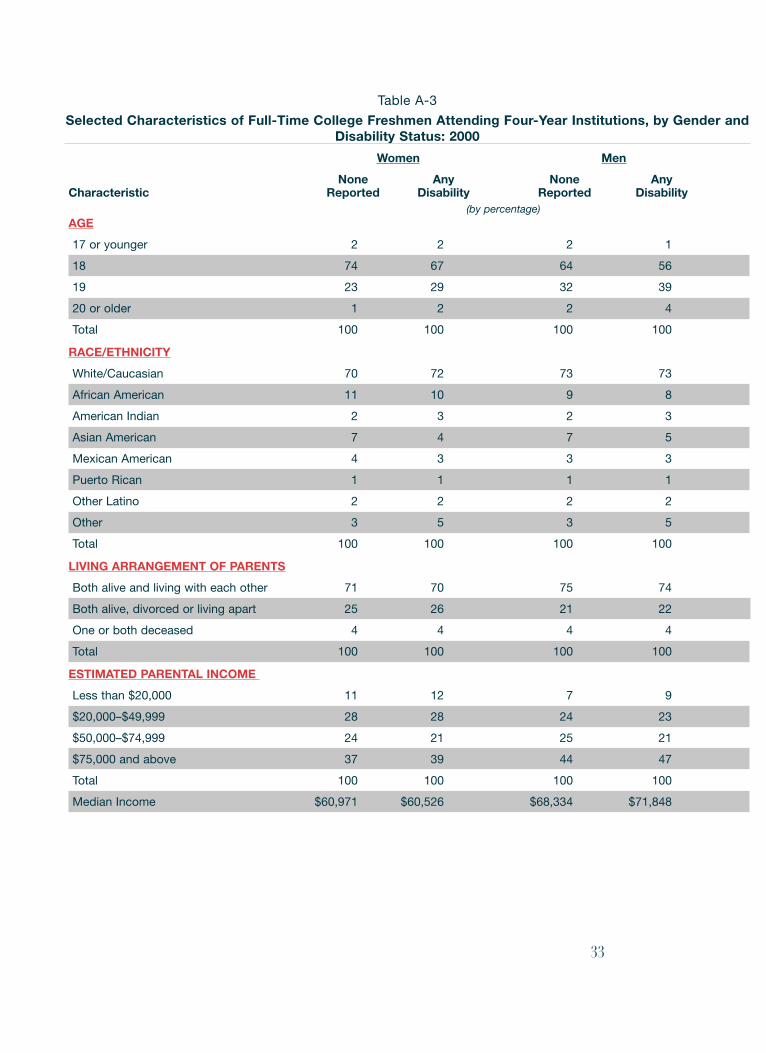
Table A-3
Selected Characteristics of Full-Time College Freshmen Attending Four-Year Institutions, by Gender andDisability Status: 2000
Women Men
None Any None AnyCharacteristic Reported Disability Reported Disability
(by percentage)AGE
17 or younger 2 2 2 1
18 74 67 64 56
19 23 29 32 39
20 or older 1 2 2 4
Total 100 100 100 100
RACE/ETHNICITY
White/Caucasian 70 72 73 73
African American 11 10 9 8
American Indian 2 3 2 3
Asian American 7 4 7 5
Mexican American 4 3 3 3
Puerto Rican 1 1 1 1
Other Latino 2 2 2 2
Other 3 5 3 5
Total 100 100 100 100
LIVING ARRANGEMENT OF PARENTS
Both alive and living with each other 71 70 75 74
Both alive, divorced or living apart 25 26 21 22
One or both deceased 4 4 4 4
Total 100 100 100 100
ESTIMATED PARENTAL INCOME
Less than $20,000 11 12 7 9
$20,000–$49,999 28 28 24 23
$50,000–$74,999 24 21 25 21
$75,000 and above 37 39 44 47
Total 100 100 100 100
Median Income $60,971 $60,526 $68,334 $71,848
33

Table A-3 (continued)Women Men
None Any None AnyCharacteristic Reported Disability Reported Disability
(by percentage)AVERAGE HIGH SCHOOL GRADES
A 48 34 38 26
B 48 57 53 59
C and D 4 9 9 15
Total 100 100 100 100
EXPECT TO NEED SPECIAL TUTORING OR REMEDIAL HELP IN COLLEGE*
English 7 17 9 21
Reading 3 10 4 13
Mathematics 27 41 19 31
Social studies 4 8 2 7
Science 12 20 7 4
Foreign language 10 20 11 19
MAJOR FIELD OF STUDY
Arts and humanities 15 17 15 14
Biological sciences 7 7 6 5
Business 14 10 21 19
Education 15 17 6 8
Engineering 3 2 16 12
Physical sciences 1 2 2 3
Professional programs** 13 13 5 7
Social sciences 10 15 4 7
Technical fields*** 3 1 10 4
Other fields**** 19 16 15 21
Total 100 100 100 100
34

Table A-3 (continued)Women Men
None Any None AnyCharacteristic Reported Disability Reported Disability
(by percentage)CONCERN ABOUT FINANCING COLLEGE EDUCATION
None 31 33 43 43
Some 55 50 47 44
Major 14 17 10 13
Total 100 100 100 100
*Percentages do not necessarily add to 100 percent because students can receive help in more than one subject.**Includes architecture or urban planning, home economics, health technology, library or archival science, nursing, pharmacy, pre-dental,pre-medical, pre-veterinary, therapy (occupational, physical, and speech), and other professional programs.***Includes building trades, data processing/computer programming, drafting or design, electronics, mechanics, and other technicalfields.****Includes agriculture, communications, computer science, forestry, law enforcement, military science, other fields, and undecided.
Source: HEATH Resource Center, American Council on Education. (Based on unpublished data from the 2000 Cooperative InstitutionalResearch Program, UCLA, 2001.)
35


37
AcknowledgmentsThe HEATH Resource Center pays special tribute to the individuals who generously gave their time and energy to the development of this publication.
This report was written by Cathy Henderson. John Gugerty, Debra Price-Ellingstad, Susan Quinby, and Marie Trottier helped fine-tune the contentand clarity of the material. ACE’s Division of External Affairs’ PublicationsStaff assisted Vickie Barr in the editing and production of this publication.

39
HEATH Resource CenterAdvisory BoardLynn BarnettAmerican Association of CommunityColleges
Sharman Davis BarrettPACER Center
Lydia S. BlockBlock Educational Consulting
Lynn BoyerNational Clearinghouse on Careers &Professions Related to Early Intervention &Education for Children with Disabilities
Robert BurnsCouncil of State Administrators of Vocational Rehabilitation
Norm CoombsProject EASI
Kathleen Furlong-NormanCenter for Psychiatric Rehabilitation
John GugertyCenter on Education and Work
Kathleen NadeauChesapeake Psychological Services of Maryland
Debra Price-EllingstadU.S. Department of Education
Andrea ReeveNational TRIO Clearinghouse
Suzanne RipleyNational Information Center for Childrenand Youth with Disabilities
Joyce SmithNational Association for College AdmissionCounseling
HEATH StaffVickie M. Barr, Director
Mario D. Payne, Assistant Director
Daniel B. Gardner, Publications Manager
Dottie Jones, Program Coordinator
Marcus Griffin, Mail Production Technician


ACE Board of DirectorsEXECUTIVE COMMITTEEJanet L. Holmgren,PresidentMills College, CAChair
Augustine P. Gallego,ChancellorSan Diego CommunityCollege District, CAVice Chair/Chair-elect
Michael F. Adams,PresidentUniversity of GeorgiaImmediate Past Chair
William E. Troutt,PresidentRhodes College, TNSecretary
Molly C. Broad, PresidentUniversity of North Carolina
David G. Carter, PresidentEastern Connecticut StateUniversity
Lawrence J. DeNardis,PresidentUniversity of New Haven, CT
Peggy Williams, PresidentIthaca College, NY
Stanley O. Ikenberry,PresidentAmerican Council onEducation
CLASS OF 2001
Michael F. Adams,PresidentUniversity of Georgia
Molly C. Broad, PresidentUniversity of NorthCarolina
David G. Carter, PresidentEastern Connecticut StateUniversity
E. Gordon Gee, ChancellorVanderbilt University, TN
Peter C. Ku, ChancellorSeattle Community CollegeDistrict, WA
Jerry Sue Thornton,PresidentCuyahoga CommunityCollege, OH
William E. Troutt,PresidentRhodes College, TN
J. William Wenrich,ChancellorDallas County CommunityCollege District, TX
CLASS OF 2002
Nancy S. Dye, PresidentOberlin College, OH
Wayne E. Giles, ChancellorMetropolitan CommunityColleges, MO
James A. Hefner, PresidentTennessee State University
Janet L. Holmgren,PresidentMills College, CA
Gladys Styles Johnston,ChancellorUniversity of Nebraska atKearney
William E. Kirwan,PresidentThe Ohio State University
Michael S. McPherson,PresidentMacalester College, MN
Peggy R. Williams,PresidentIthaca College, NY
41

42
CLASS OF 2003
Scott S. Cowen, PresidentTulane University, LA
Norman C. Francis,PresidentXavier University, LA
Augustine P. Gallego,ChancellorSan Diego CommunityCollege District, CA
Zelema M. Harris,PresidentParkland College, IL
Robert E. Hemenway,ChancellorUniversity of Kansas
M. Lee Pelton, PresidentWillamette University, OR
Steven B. Sample, PresidentUniversity of SouthernCalifornia
Marlene Springer,PresidentCollege of Staten Island, NY
ELECTED OFFICERS OF ASSOCIATIONS–EX OFFICIO FOR THREE-YEAR TERMSAmerican Association ofCommunity CollegesCarolyn Williams, PresidentBronx Community College,NY
American Association ofState Colleges & UniversitiesJulio S. Leon, PresidentMissouri Southern StateCollege
Association of AmericanColleges & UniversitiesThomas F. Flynn, PresidentMillikin University, IL
Association of AmericanUniversitiesFrancis L. Lawrence,PresidentRutgers, The StateUniversity of New Jersey
Association of CatholicColleges & UniversitiesThomas Scanlan, FSC,PresidentManhattan College, NY
Association of JesuitColleges & UniversitiesEdward Glynn, S.J.,PresidentJohn Carroll University, OH
Council of IndependentCollegesMargaret A. McKenna,PresidentLesley University, MA
National Association forEqual Opportunity inHigher EducationJohn T. Gibson, PresidentAlabama A&M University
National Association ofIndependent Colleges &UniversitiesLawrence J. DeNardis,PresidentUniversity of New Haven, CT
National Association ofState Universities & Land-Grant CollegesLattie F. Coor, PresidentArizona State University
ELECTED OFFICERS OF ASSOCIATIONS–EX OFFICIO FOR ONE-YEAR TERMSAmerican Association forHigher EducationLeo M. Lambert, PresidentElon University, NC
National Association ofStudent Financial AidAdministratorsDallas Martin, PresidentNational Association ofStudent Financial AidAdministrators, DC
Washington HigherEducation SecretariatJudith S. Eaton, PresidentCouncil for HigherEducation Accreditation, DC


HEATHResourceCenter
American Council on Education