Embed Size (px)
Citation preview
2008 - 2016
Mort Harris Recreation and Fitness CenterPart of athletics since 2010
Campus Labs Freshmen Quest Survey Data
KIN-LFA 2560 • Christy D. Nolan, Ed.D • Faculty

Freshman Quest Survey ResultsMort Harris Recreation and Fitness Center
Dem
ographics of the survey
2008* 2009
2010 2010
2011 2012
2013 2014
2015 2016
(Canoe) (H
ike)
Total Participants
37 81
63 16
57 42
33 40
39 39
Interviewees
1
2 1
1 8
0 0
0 0
0
Gender
M
48%
40%
52%
38%
42%
55%
36%
40%
40%
31%
F 52%
60%
48%
62%
58%
45%
64%
60%
60%
69%
Ethnicity A
sian 8%
8%
<5%
10.5%
15%
9%
13%
7.5%
7%
Af-A
m
24%
24%
10%
38%
12.3%
7%
9%
5%
17.5%
10%
Hisp.
5%
<5%
6%
<5%
<5%
<5%
5%
7%
Nat-A
m
<5%
<5%
N
on-Res
<5%
White
48%
60%
28%
31%
63.2%
60%
57%
77%
55%
66%
2 or m
ore
<5%
U
nknown
10%
6%
22%
25%
10.5%
16%
15%
5%
15%
<5%
Majors
ACT Scores
21.8
22.4 21.97
22.8 23.7
25.1 24.9
24.9 23.05
25.3
ACT Score Range
15-31
13-34 11-31
14-31 11-33
16-31 14-34
19-35 17-35
18-34
HS G
PA
3.24
3.28 3.1
3.27 3.45
3.14 3.39
3.39 3.39
3.53
Pre-Med,
Pre-Nursing, Undecided, Business
Pre-Med,
Pre-Nursing, Undecided, Business
Pre-Med, Pre-Nursing, General Engineering
Pre-Med,
Pre-Nursing, M
ortuary Science, M
isc.
Pre-Med,
Pre-Nursing, Psychology, M
isc.
Pre-Med,
Criminal
Justice, Pre-Nursing
Pre-Med,
Pre-Nursing, General Engineering
Pre-Med,
Pre-Nursing, M
usic, Business
Pre-Med,
Pre-Nursing, Undecided, M
usic
Pre-Med,
Pre-Nursing, Theater, M
usic
Content current as of 09/16*Learning Com
munity survey not adm
inistered

Freshman Quest Survey ResultsMort Harris Recreation and Fitness Center
45%
25%
20%
7%
1% 1%
2% 1%
The LC has helped me academically
The LC has helped me develop new friendships
Answer Total Counts Total RespondentsStrongly Agree 59 300Agree 136 300Neither Agree nor Disagree 76 300Disagree 21 300Strongly Disagree 5 300N/A 3 300
Answer Total Counts Total RespondentsStrongly Agree 150 300Agree 118 300Neither Agree nor Disagree 22 300Disagree 7 300Strongly Disagree 3 300N/A 0 300
50%29%
7%
Agree
KEY
Neither Agree No Disagree Strongly Disagree N/ADisagreeStrongly Agree

Freshman Quest Survey ResultsMort Harris Recreation and Fitness Center
45%
32%
18%
2% 1%
1%6% 2%
The LC supports my personal goals
The LC supports my potential professional interests
Answer Total Counts Total RespondentsStrongly Agree 98 300Agree 135 300Neither agree nor disagree 54 300Disagree 8 300Strongly Disagree 4 300N/A <1 300
Answer Total Counts Total RespondentsStrongly Agree 76 300Agree 117 300Neither agree nor disagree 80 300Disagree 18 300Strongly Disagree 6 300N/A 3 300
39%
26%
25%
Agree
KEY
Neither Agree No Disagree Strongly Disagree N/ADisagreeStrongly Agree

Freshman Quest Survey ResultsMort Harris Recreation and Fitness Center
55%36%
6% <1%2%
5% 2%
The LC encourages my participation in non-academic campus events
The course(s) and activities in my LC are linked to one another
Answer Total Counts Total RespondentsStrongly Agree 164 300Agree 109 300Neither agree nor disagree 19 300Disagree 5 300Strongly Disagree 1 300N/A 2 300
Answer Total Counts Total RespondentsStrongly Agree 55 209Agree 108 209Neither agree nor disagree 31 209Disagree 10 209Strongly Disagree 1 209N/A 4 209
52%
26%
15%
Agree
KEY
Neither Agree No Disagree Strongly Disagree N/ADisagreeStrongly Agree
Freshman Quest Survey ResultsMort Harris Recreation and Fitness Center
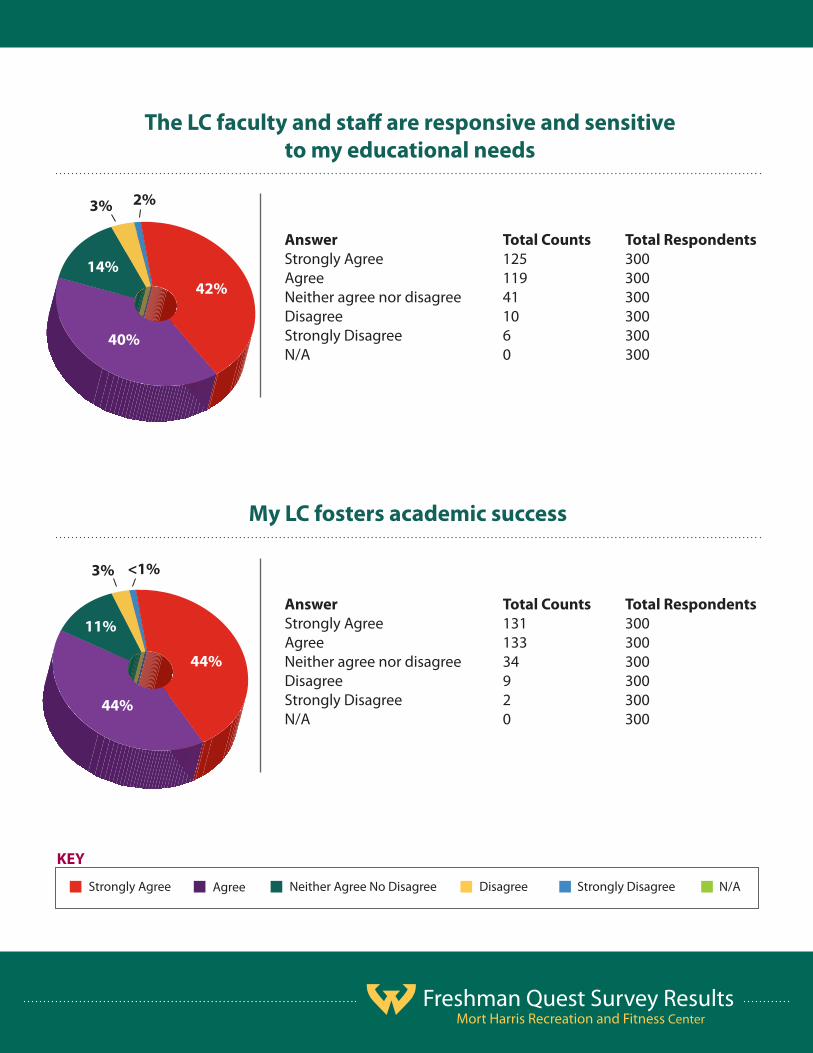
42%
40%
14%
The LC faculty and staff are responsive and sensitive to my educational needs
My LC fosters academic success
Answer Total Counts Total RespondentsStrongly Agree 125 300Agree 119 300Neither agree nor disagree 41 300Disagree 10 300Strongly Disagree 6 300N/A 0 300
Answer Total Counts Total RespondentsStrongly Agree 131 300Agree 133 300Neither agree nor disagree 34 300Disagree 9 300Strongly Disagree 2 300N/A 0 300
44%
44%
11%
3%
3%
2%
<1%
Agree
KEY
Neither Agree No Disagree Strongly Disagree N/ADisagreeStrongly Agree

Freshman Quest Survey ResultsMort Harris Recreation and Fitness Center
55%38%
4%2% <1%
6%
1%
My LC enhances connections between and among students
My LC has helped me transition to collegiate-level learning
Answer Total Counts Total RespondentsStrongly Agree 164 300Agree 115 300Neither agree nor disagree 12 300Disagree 7 300Strongly Disagree 2 300N/A 0 300
Answer Total Counts Total RespondentsStrongly Agree 112 300Agree 116 300Neither agree nor disagree 48 300Disagree 18 300Strongly Disagree 5 300N/A 1 300
39%
37%
16%
Agree
KEY
Neither Agree No Disagree Strongly Disagree N/ADisagreeStrongly Agree

Freshman Quest Survey ResultsMort Harris Recreation and Fitness Center
51%37%
8%3%
<1%<1%
10%
My overall experience with my LC at WSU is positive
I could contribute more than I have to the success of my LC
Answer Total Counts Total RespondentsStrongly Agree 154 300Agree 111 300Neither agree nor disagree 23 300Disagree 8 300Strongly Disagree 3 300N/A 1 300
Answer Total Counts Total RespondentsStrongly Agree 60 300Agree 123 300Neither agree nor disagree 84 300Disagree 30 300Strongly Disagree 2 300N/A 1 30041%
20%
28%
Agree
KEY
Neither Agree No Disagree Strongly Disagree N/ADisagreeStrongly Agree

Freshman Quest Survey ResultsMort Harris Recreation and Fitness Center
46%
43%
7%
2%8%
4%
1%
7%
I know where to go on campus to get my academic assistance
I would recommend my LC experience to a friend at the University
Answer Total Counts Total RespondentsStrongly Agree 126 300Agree 140 300Neither agree nor disagree 20 300Disagree 13 300Strongly Disagree 1 300N/A 0 300
Answer Total Counts Total RespondentsStrongly Agree 180 300Agree 76 300Neither agree nor disagree 23 300Disagree 7 300Strongly Disagree 4 300N/A 0 300
60%25%
Agree
KEY
Neither Agree No Disagree Strongly Disagree N/ADisagreeStrongly Agree

Freshman Quest Survey ResultsMort Harris Recreation and Fitness Center
Agree
KEY
62%28%
6%3%
7%
1%
I would recommend my LC experience to students at my former high school
Neither Agree No Disagree Strongly Disagree N/A
Too Short Just Right Too Long
DisagreeStrongly Agree
Answer Total Counts Total RespondentsStrongly Agree 185 300Agree 83 300Neither agree nor disagree 17 300Disagree 10 300Strongly Disagree 4 300N/A 1 300
How do you feel about the length of your Freshman Quest trip?
Total Counts Total RespondentsToo Short 49 238Just Right 173 238Too Long 16 238
73%
20%

Freshman Quest Survey ResultsMort Harris Recreation and Fitness Center
KEY
Did you make new friends on your Freshman Quest trips?
Yes No
Total Counts Total RespondentsYes 231 238No 7 238
97%
3%
Do you study with other students from your Freshman Quest trip?
Total Counts Total RespondentsYes 123 238No 115 238
52%48%

Freshman Quest Survey ResultsMort Harris Recreation and Fitness Center
KEY
Do you study or engage in social activities with students from other Freshman Quest trips?
Do you engage in social activities with students from your Freshman Quest trip?
Yes No
Total Counts Total RespondentsYes 131 238No 107 238
Total Counts Total RespondentsYes 180 238No 58 238
55%
76%
45%
24%

Freshman Quest Survey ResultsMort Harris Recreation and Fitness Center
KEY
Did the trip provide information that was not covered in the on-campus orientation?
(2013-2015 only)
Do you feel your writing ability has improved over the course of the first semester?
(2009-2011 only)
Yes No
Total Counts Total RespondentsYes 114 124No 10 124
Total Counts Total RespondentsYes 83 117No 34 117
91%
71%
9%
29%

Freshman Quest Survey ResultsMort Harris Recreation and Fitness Center
Completely
KEY
40%
42%
14%
2% 2%
Did you accomplish the goals you set for yourself on the trip? (2013-2015 only)
Considerably Not At AllNot Very MuchModerately
Answer Total Counts Total RespondentsCompletely 49 124Considerably 52 124Moderately 17 124Not Very Much 3 124Not At All 3 124
Do you have any regrets from this trip? (2013-2015 only)
Total Counts Total RespondentsYes 30 124No 94 124
24%
76%
KEY
Yes No

Freshman Quest Survey ResultsMort Harris Recreation and Fitness Center
A Great Deal
Excellent
KEY
KEY
30%
27%
67%
35%
23%
7%
4%
1% 1%
4%
Did the trip help prepare you for life in college? (2013-2015 only)
Considerably
Good
Not At All
Poor
Not Very Much
Fair
Moderately
Average
Answer Total Counts Total RespondentsA Great Deal 37 124Considerably 44 124Moderately 33 124Not Very Much 5 124Not At All 4 124
Overall, how would you rate LC Quest Trip? (2013-2015 only)
Total Counts Total RespondentsExcellent 83 124Good 29 124Average 9 124Fair 1 124Poor 2 124

Freshman Quest Survey ResultsMort Harris Recreation and Fitness Center
Yes Definitely Would
KEY
82%
11%
5% 2%
Would you recommend the rip to other incoming freshmen? (2013-2015 only)
Yes Probably Would No Probably Wouldn’t No Definitely Wouldn’t
Answer Total Counts Total RespondentsYes Definitely Would 102 124Yes Probably Would 14 124No Probably Wouldn’t 6 124No Definitely Wouldn’t 2 124

Freshman Quest Survey ResultsMort Harris Recreation and Fitness Center
11%
Freshmen Quest Summary Statistics(2008-2012 Cohorts)
GENERAL POPULATION
Ethnicity
GENERAL POPULATION WHITE
GENERAL POPULATION WHITE
Graduation Rate: 33.6%Graduation Rate (4 years): 13.47%Graduation Rate (6 years): 31.6%
Graduation Rate: 40.09%Graduation Rate (4 years): 16.3%Graduation Rate (6 years): 38%
GPA (all): 2.92GPA (non-graduates): 2.55GPA (graduates): 3.44
Total Population: 11,823
01 02 03 04 05 0
05 10 15 20 25 30 35
33.6%
13.47%
31.6%
0.00 .5 1.01 .5 2.02 .5 3.03 .5
38%
3.44 GPA
40.09%
2.92 GPA
16.3%
2.55 GPA
Freshman Quest Survey ResultsMort Harris Recreation and Fitness Center
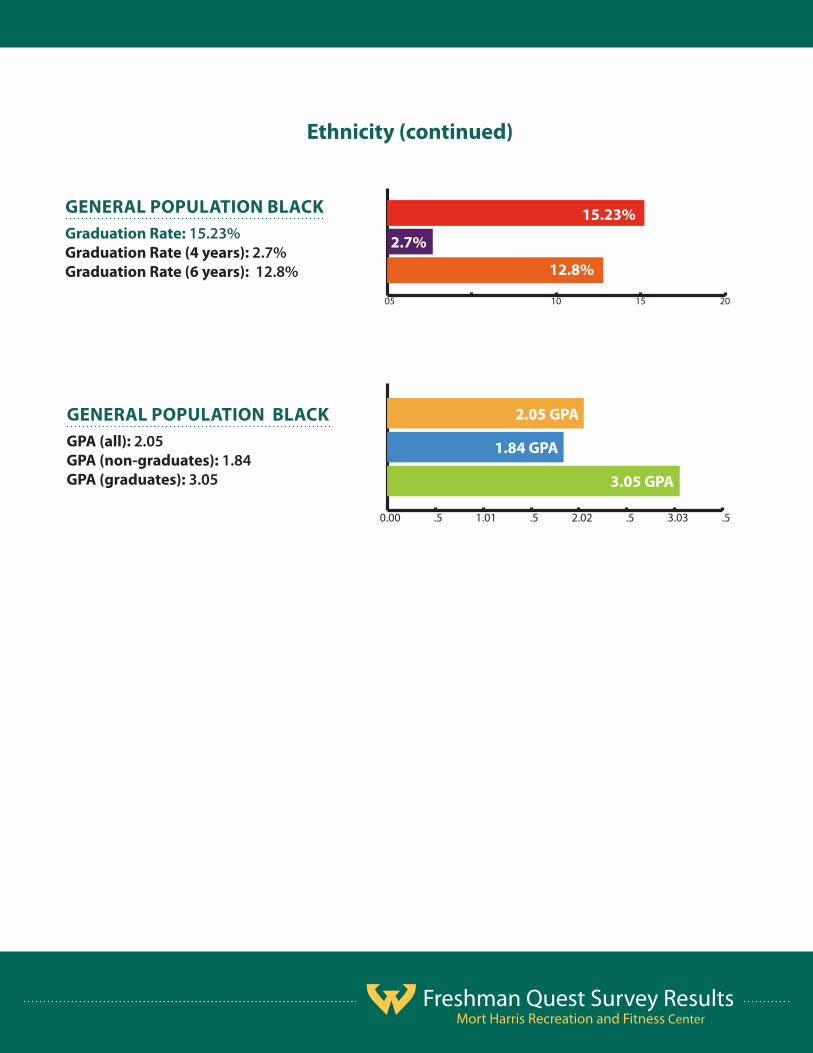
Ethnicity (continued)
GENERAL POPULATION BLACKGraduation Rate: 15.23%Graduation Rate (4 years): 2.7%Graduation Rate (6 years): 12.8%
05 10 15 20
12.8%
15.23%
2.7%
GENERAL POPULATION BLACKGPA (all): 2.05GPA (non-graduates): 1.84GPA (graduates): 3.05
0.00 .5 1.01 .5 2.02 .5 3.03 .5
2.05 GPA
1.84 GPA
3.05 GPA

0.00 .5 1.01 .5 2.02 .5 3.03 .5
01 02 03 04 05 0
Freshman Quest Survey ResultsMort Harris Recreation and Fitness Center
FRESHMEN QUEST POPULATION
Total Population: 272
11%
Ethnicity
FRESHMEN QUEST POPULATION WHITE
FRESHMEN QUEST POPULATION WHITE
Graduation Rate: 41.5%Graduation Rate (4 years): 28.67%Graduation Rate (6 years): 39.3%
Graduation Rate: 48.5%Graduation Rate (4 years): 20%Graduation Rate (6 years): 46.1%
GPA (all): 2.88GPA (non-graduates): 2.37GPA (graduates): 3.39
41.5%
28.67%
39.3%
2.88 GPA
2.37 GPA
3.39 GPA
01 02 03 04 05 0
46.1%
20%
48.5%

0.00 .5 1.01 .5 2.02 .5 3.03 .5
Freshman Quest Survey ResultsMort Harris Recreation and Fitness Center
Ethnicity (continued)
Graduation Rate: 12.96%Graduation Rate (4 years): 2%Graduation Rate (6 years): 13%
GPA (all): 2.17GPA (non-graduates): 2.01GPA (graduates): 3.20
2.17 GPA
2.01 GPA
3.20 GPA
0369 12 15
12.96%
13%
2%
FRESHMEN QUEST POPULATION BLACK
FRESHMEN QUEST POPULATION BLACK

Freshman Quest Survey ResultsMort Harris Recreation and Fitness Center
General Population vs. Freshmen Quest Population Graduation Rate Comparison
General Population: 13.47%Freshmen Quest Population: 28.67%
General Population (White): 16.3%Freshmen Quest Population (White): 20%
General Population (Black): 2.7%Freshmen Quest Population (Black): 2%
41.5%
4-YEAR GRADUATION RATE
4-YEAR GRADUATION RATE BY ETHNICITY
05 10 15 20
16.3%
20%
0.00 .5 1.01 .5 2.02 .5 3.0
2.7%
2%
05 10 15 20 25 30
13.47%
28.67%

Freshman Quest Survey ResultsMort Harris Recreation and Fitness Center
General Population vs. Freshmen Quest Population Graduation Rate Comparison
01 02 03 04 05 0
General Population: 31.6%Freshmen Quest Population: 39.3%
General Population (White): 38%Freshmen Quest Population (White): 46.1%
General Population (Black): 12.8%Freshmen Quest Population (Black): 13%
31.6%
39.3%
41.5%
6-YEAR GRADUATION RATE
6-YEAR GRADUATION RATE BY ETHNICITY
01 02 03 04 05 0
38%
46.1%
0369 12 15
12.8%
13%

Freshman Quest Survey ResultsMort Harris Recreation and Fitness Center
General Population vs. Freshmen Quest PopulationGPA Comparison
General Population (white): 2.92Freshmen Quest Population (white): 2.88
General Population (White): 2.55Freshmen Quest Population (White): 2.37
General Population (White): 3.44Freshmen Quest Population (White): 3.39
0.00 .5 1.01 .5 2.02 .5 3.0
0.00 .5 1.01 .5 2.02 .5
General Population (Black): 1.84Freshmen Quest Population (Black): 2.01
General Population (Black): 3.05Freshmen Quest Population (Black): 3.20
General Population (Black): 2.05Freshmen Quest Population (Black): 2.17
2.92 GPA
2.88 GPA
GPA (ALL)
GPA (NON-GRADUATES)
GPA (GRADUATES)
0.00 .5 1.01 .5 2.02 .5 3.0
2.55 GPA
2.37 GPA
1.84 GPA
2.01 GPA
0.00 .5 1.01 .5 2.02 .5
0.00 .5 1.01 .5 2.02 .5 3.03 .5
0.00 .5 1.01 .5 2.02 .5 3.03 .5
2.05 GPA
3.44 GPA
3.39 GPA
3.05 GPA
3.20 GPA
2.17 GPA

Freshman Quest Survey ResultsMort Harris Recreation and Fitness Center
SIDE BY SIDE COMPARISON4 YEAR
48.5%0
5
10
15
20
25
30
13.47% 28.67% 16.3% 20%
2.7% 2%
General Population Grad Rate: 13.47%Freshmen Quest Population Grad Rate: 28.67%
General Population Grad Rate (white): 16.3%Fresman Quest Population Grad Rate (white): 20%
General Population Grad Rate (black): 2.7%Freshman Quest Population Rate (black): 2%

0
10
20
30
40
50
Freshman Quest Survey ResultsMort Harris Recreation and Fitness Center
SIDE BY SIDE COMPARISON6 YEAR
31.6% 39.3% 38% 46.1%
12.8% 13%
General Population Grad Rate: 31.6%Freshmen Quest Population Grad Rate: 39.3%
General Population Grad Rate (white): 38%Fresman Quest Population Grad Rate (white): 46.1%
General Population Grad Rate (black): 12.8%Freshman Quest Population Rate (black): 13%

Mort Harris Recreation and Fitness Center Christy Nolan, Director of Campus Recreation
(313) [email protected]
rfc.wayne.edu/freshman-quests
Content current as of 10/16