Embed Size (px)
DESCRIPTION
Freshwater and Salinity. Ray Schmitt Department of Physical Oceanography WHOI [email protected] OceanObs ‘09. 86%. 78%. 96%. 4%. .001%. Global Ocean Evap - Precip. Ocean and atmosphere compensate in meridional water transport, - PowerPoint PPT Presentation
Citation preview
Freshwater and Salinity
Ray SchmittDepartment of Physical Oceanography
OceanObs ‘09
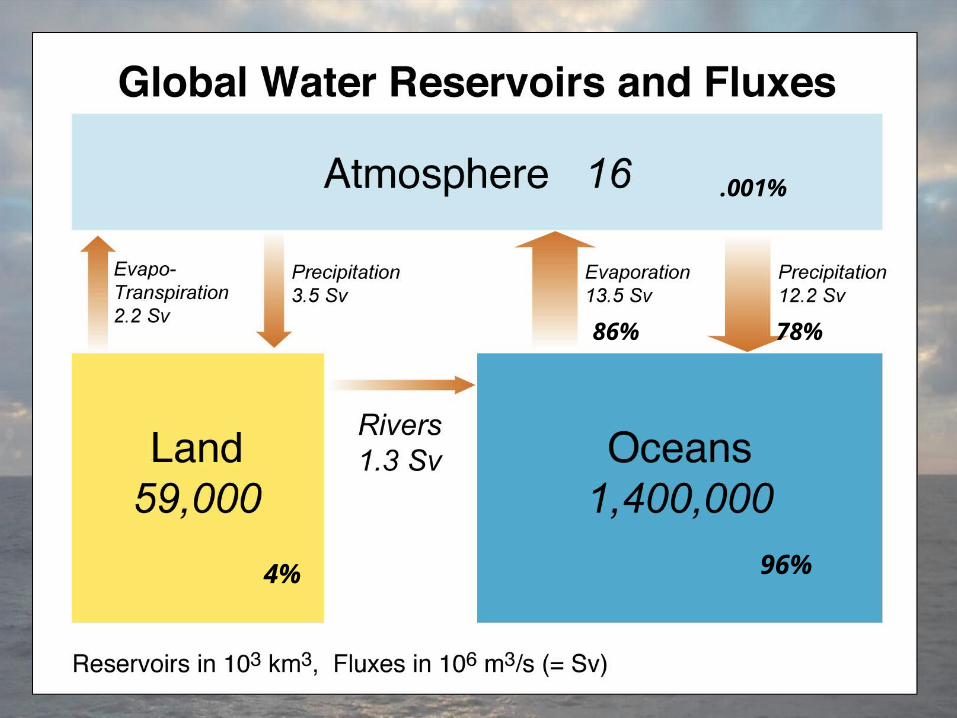
.001%
86% 78%
4% 96%
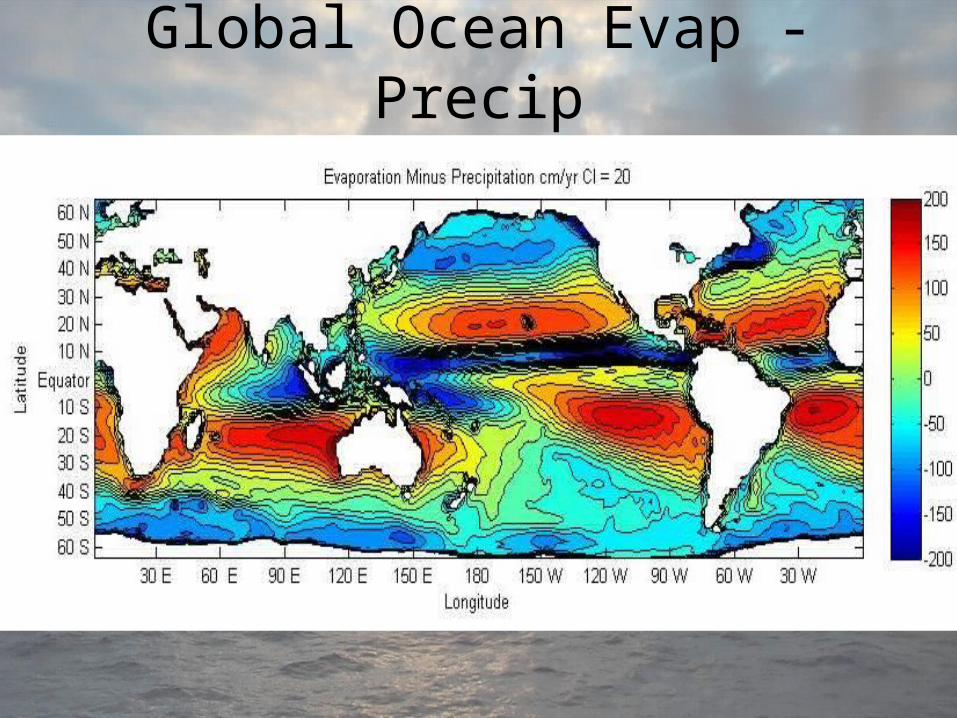
Global Ocean Evap - Precip
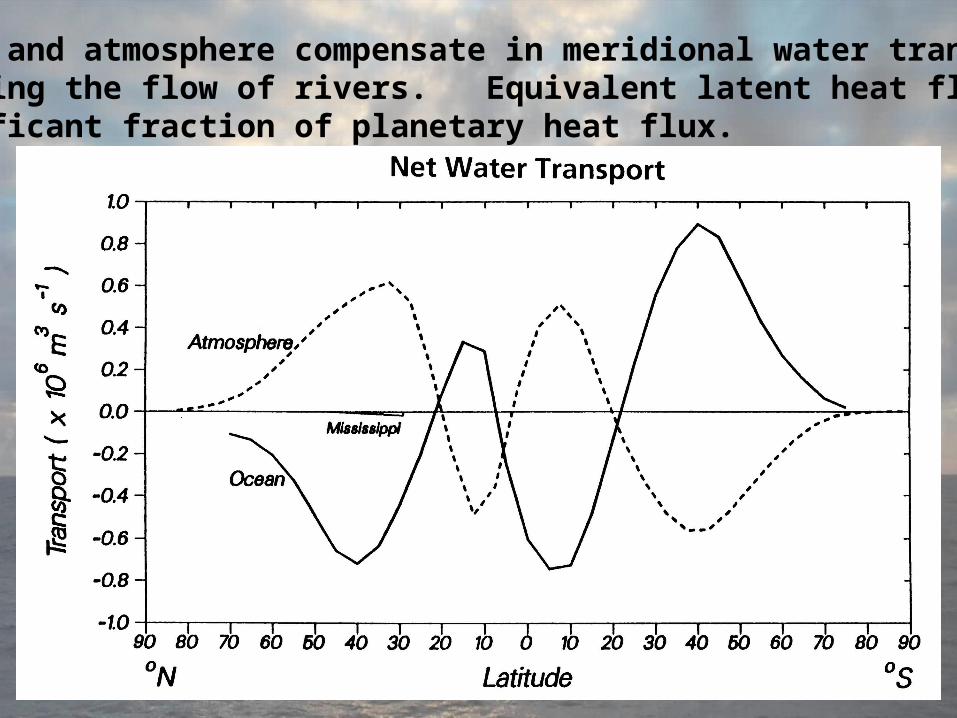
Ocean and atmosphere compensate in meridional water transport,dwarfing the flow of rivers. Equivalent latent heat flux is significant fraction of planetary heat flux.
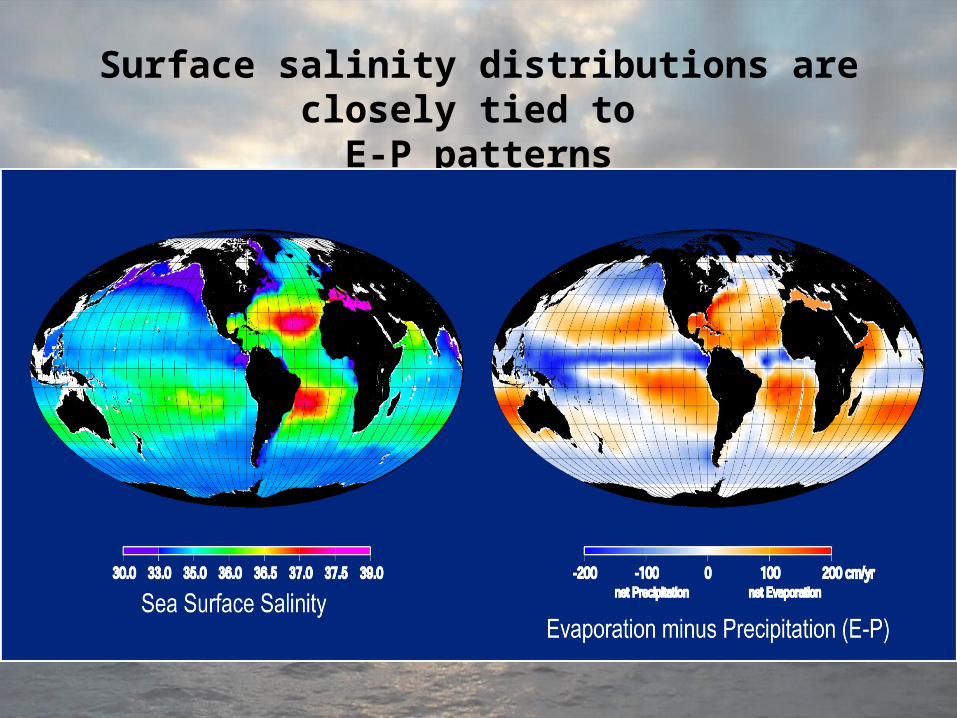
Surface salinity distributions are closely tied to E-P patterns
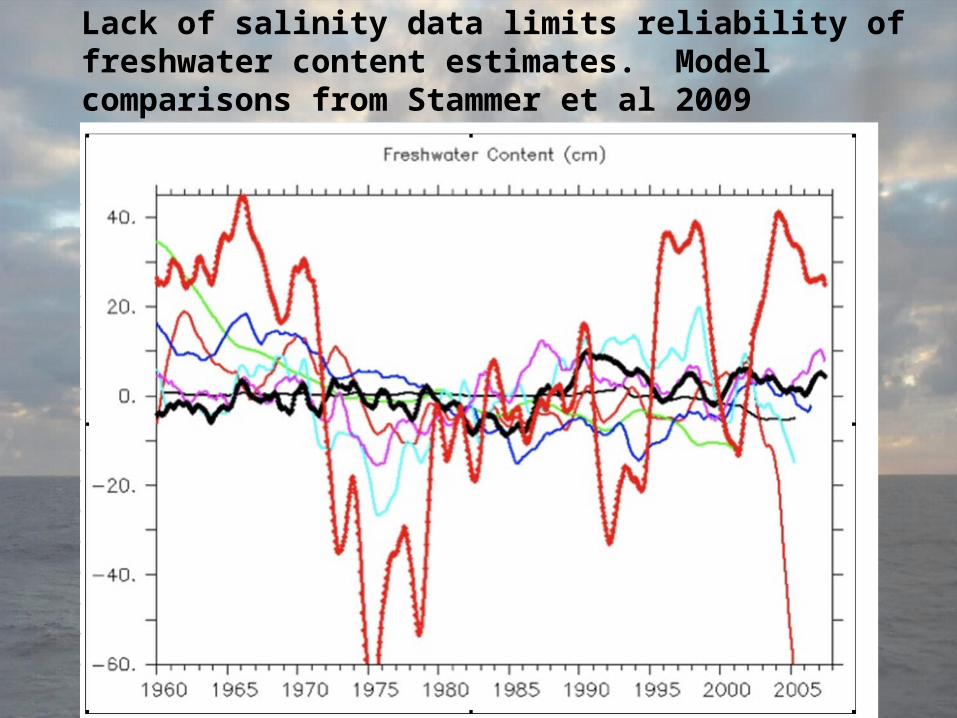
Lack of salinity data limits reliability of freshwater content estimates. Model comparisons from Stammer et al 2009
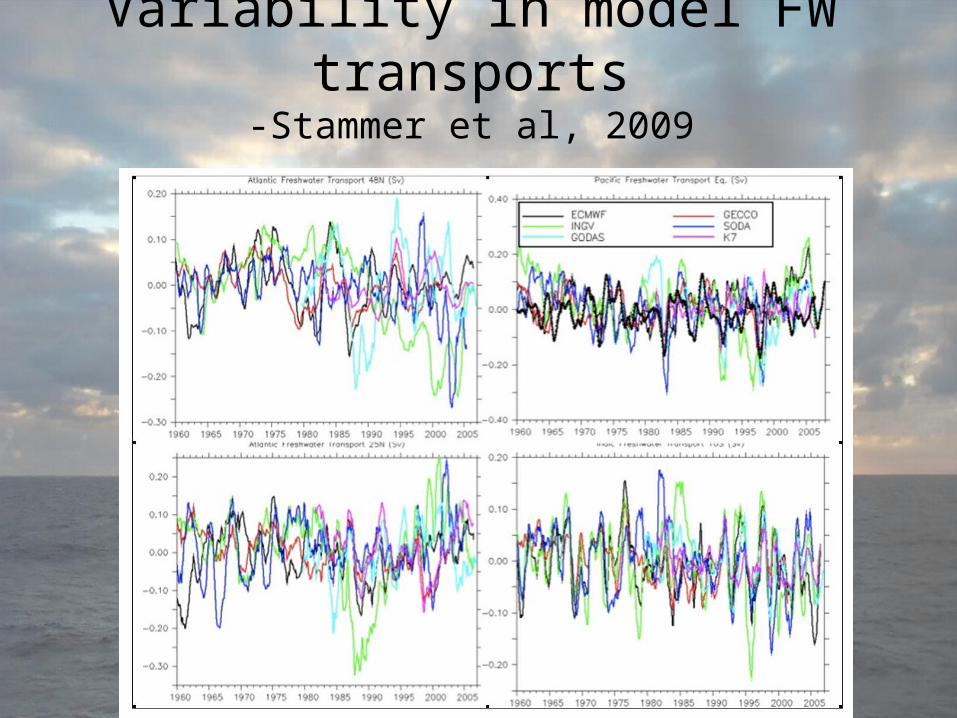
Variability in model FW transports-Stammer et al, 2009
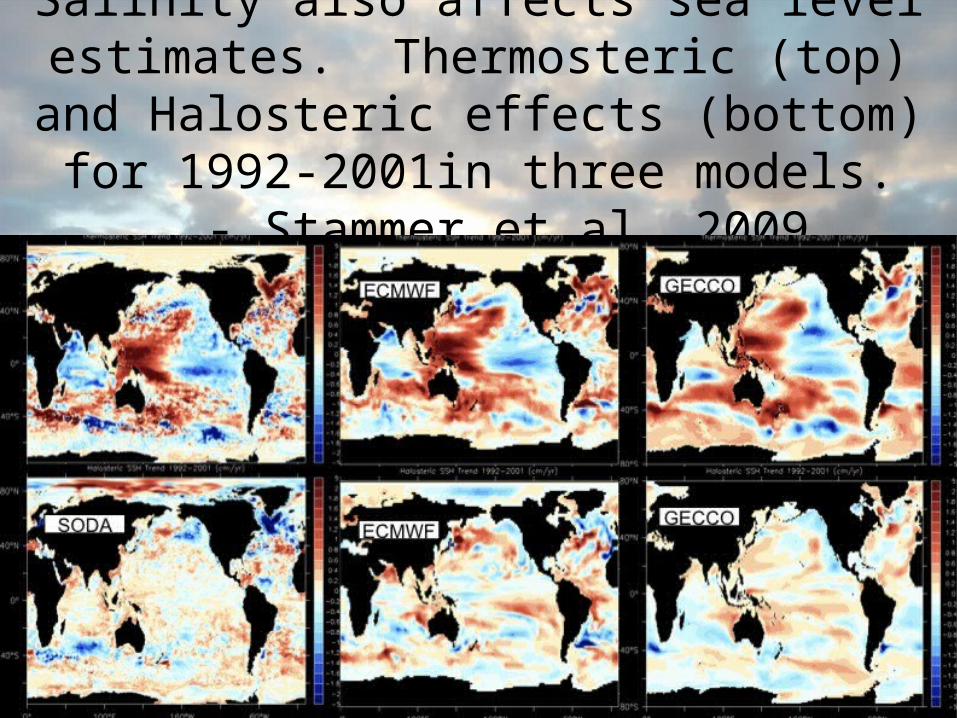
Salinity also affects sea level estimates. Thermosteric (top) and Halosteric effects (bottom) for 1992-2001in three models.
- Stammer et al, 2009
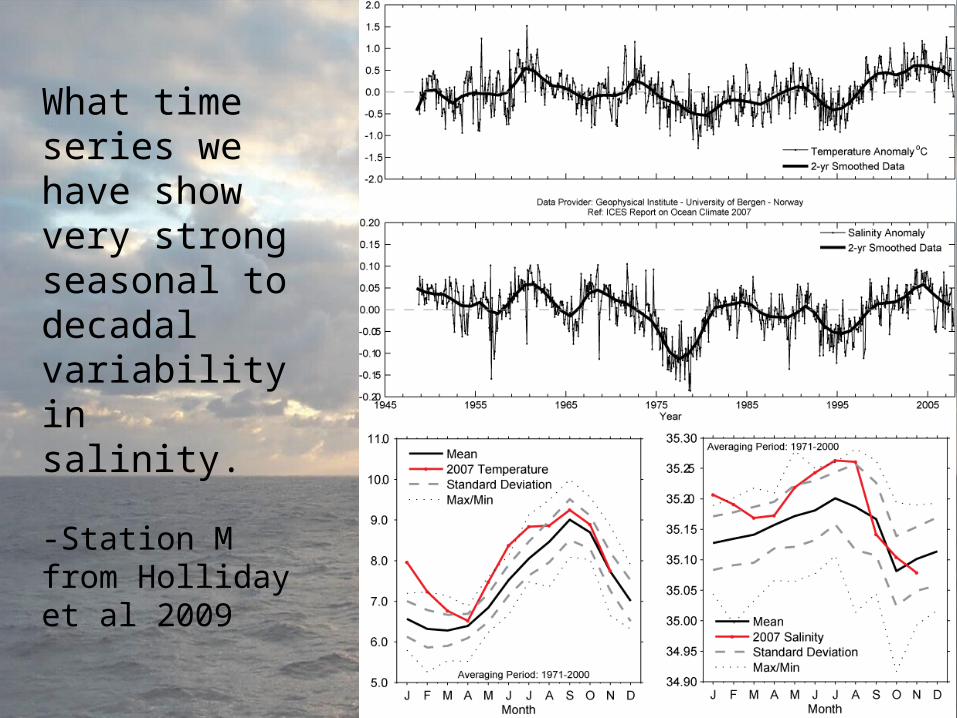
What time series we have show very strong seasonal to decadal variability in salinity.
-Station M from Holliday et al 2009
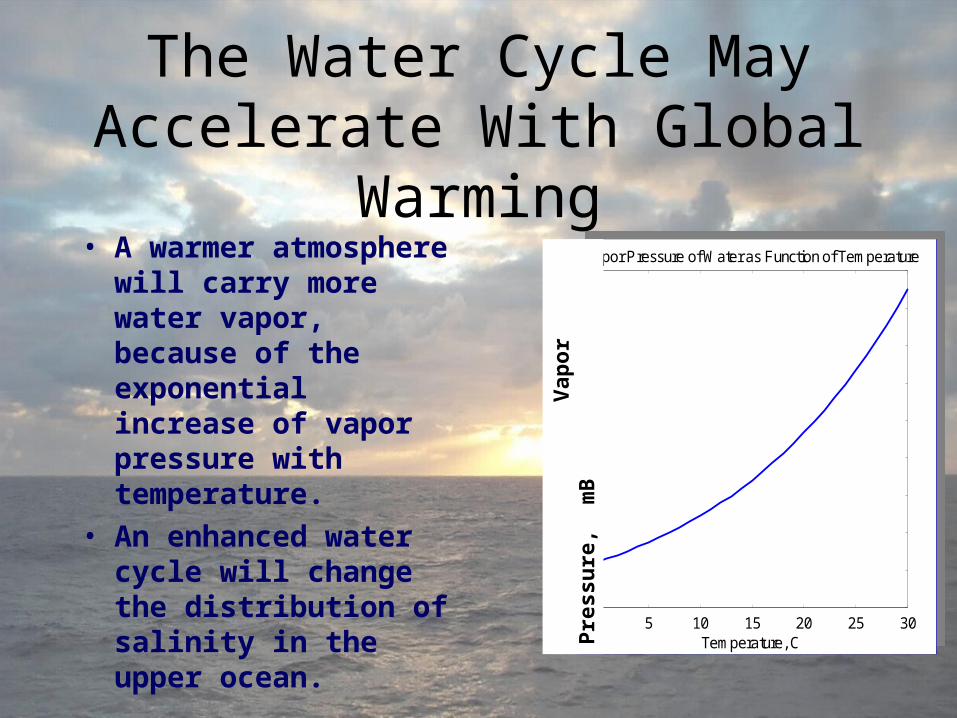
The Water Cycle May Accelerate With Global Warming
• A warmer atmosphere will carry more water vapor, because of the exponential increase of vapor pressure with temperature.
• An enhanced water cycle will change the distribution of salinity in the upper ocean. 0 5 10 15 20 25 30
0
5
10
15
20
25
30
35
40
45
Vap
or P
ress
ure
of W
ater
, m
B
Vapor Pressure of Water as Function of Temperature
Temperature, C0 5 10 15 20 25 30
0
5
10
15
20
25
30
35
40
45
Vap
or P
ress
ure
of W
ater
, m
B
Vapor Pressure of Water as Function of Temperature
Temperature, C
Vap
or P
ress
ure
, m
B

Evaporation Trends in 4 Climatologies
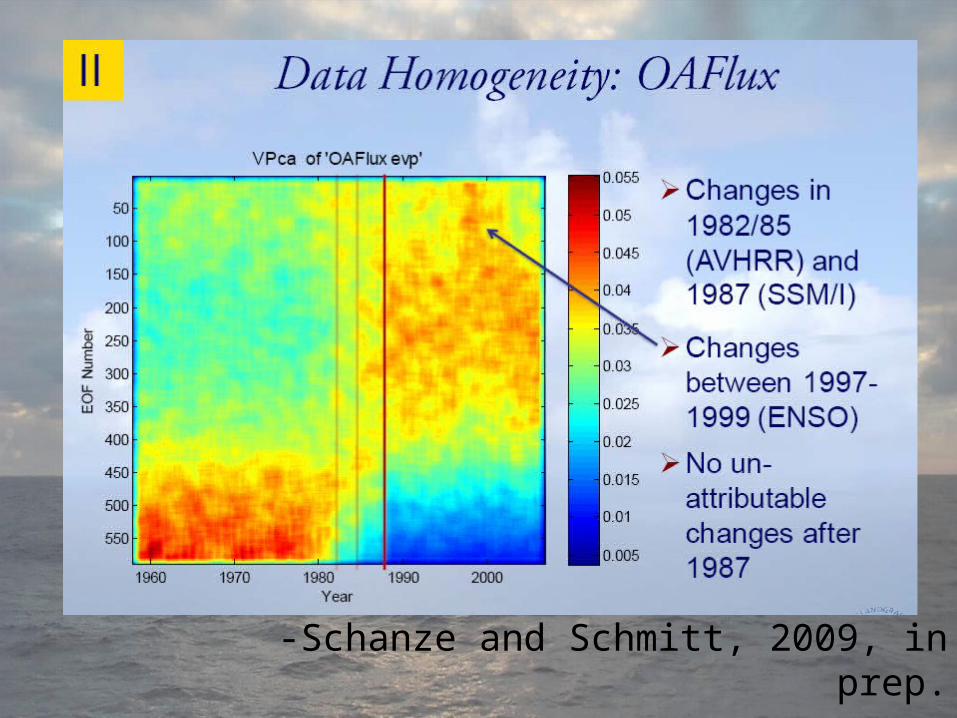
-Schanze and Schmitt, 2009, in prep.
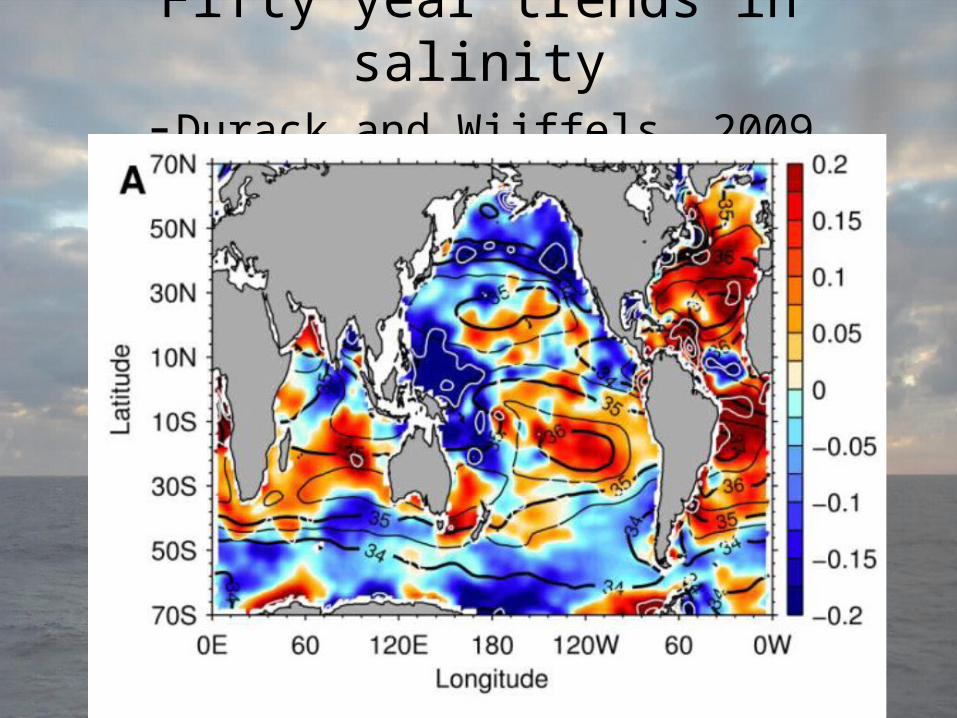
Fifty year trends in salinity-Durack and Wijffels, 2009
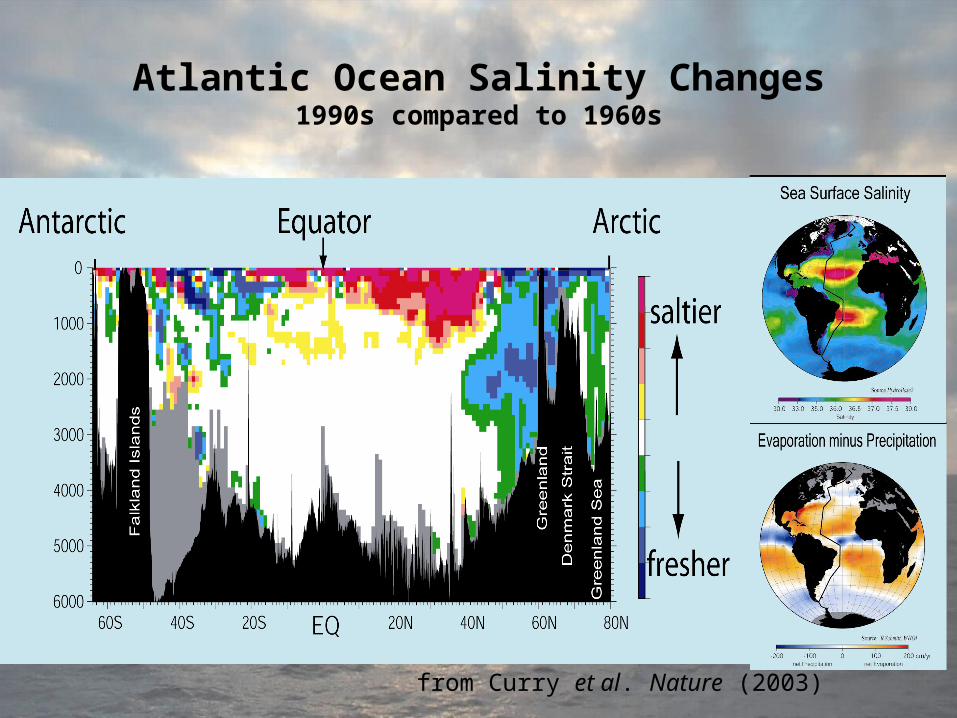
Atlantic Ocean Salinity Changes1990s compared to 1960s
from Curry et al. Nature (2003)
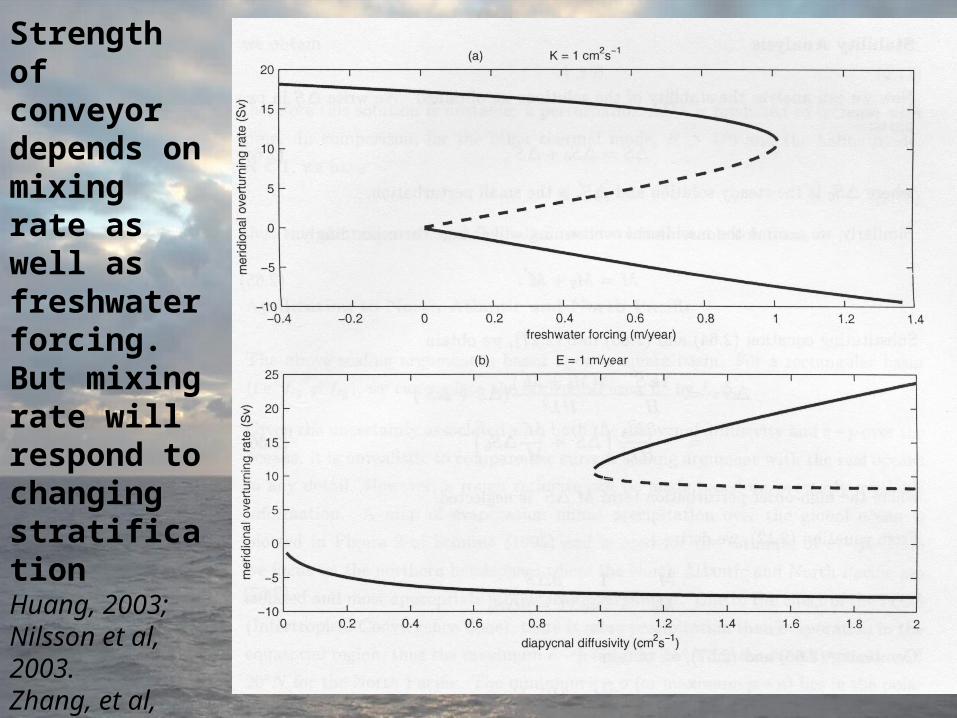
Strength of conveyor depends on mixing rate as well as freshwater forcing. But mixing rate will respond to changing stratificationHuang, 2003; Nilsson et al, 2003.Zhang, et al, 1999
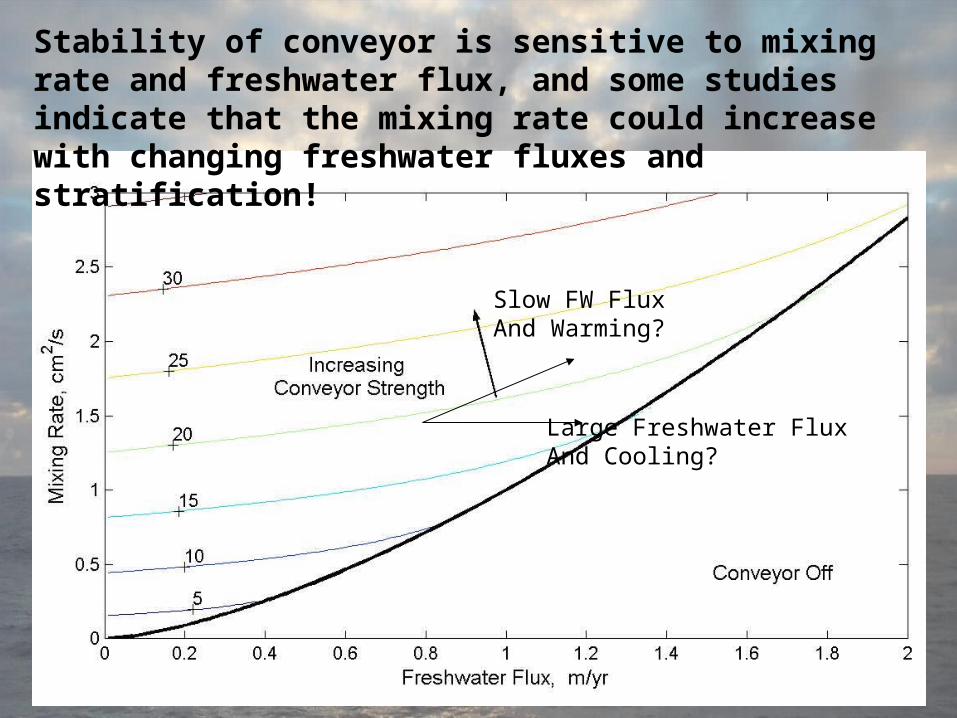
Stability of conveyor is sensitive to mixing rate and freshwater flux, and some studies indicate that the mixing rate could increase with changing freshwater fluxes and stratification!
Large Freshwater Flux And Cooling?
Slow FW Flux And Warming?
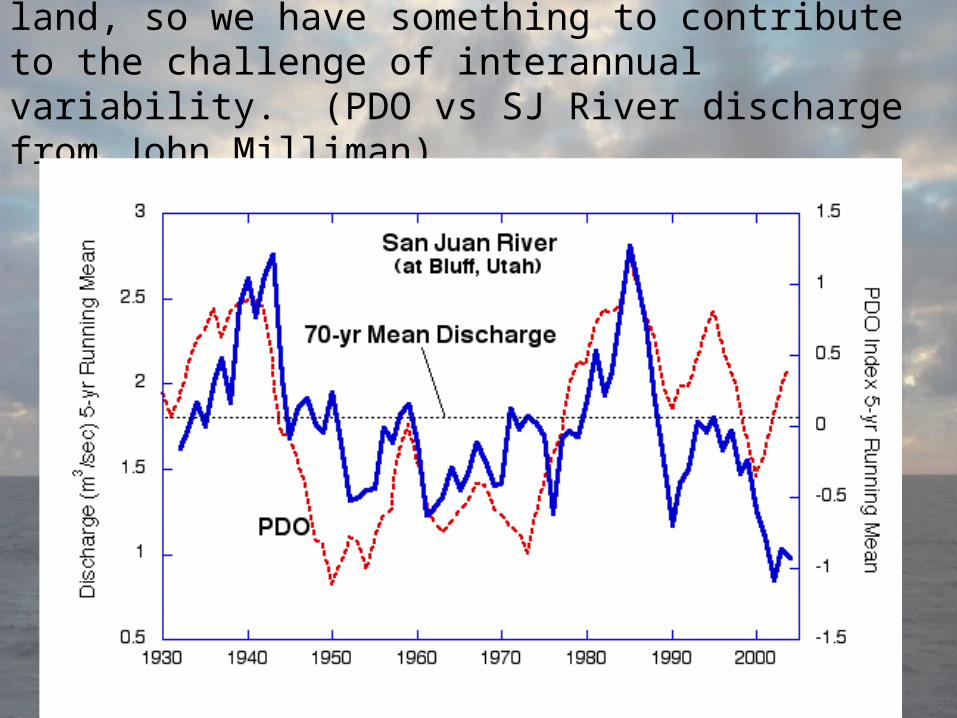
SST has predictive power for precip. on land, so we have something to contribute to the challenge of interannual variability. (PDO vs SJ River discharge from John Milliman)

Salinity is an indicator of the water cycle and impacts sea level, mixing, dynamics, the MOC, etc:How can we do a better job on salinity observations?
• SSS on ARGO (currently stop profiling at 5 m)
• SSS on drifters
• Expand thermosalinographs on VOS
• Satellites (SMOS, Aquarius)
• Deep ocean profiling
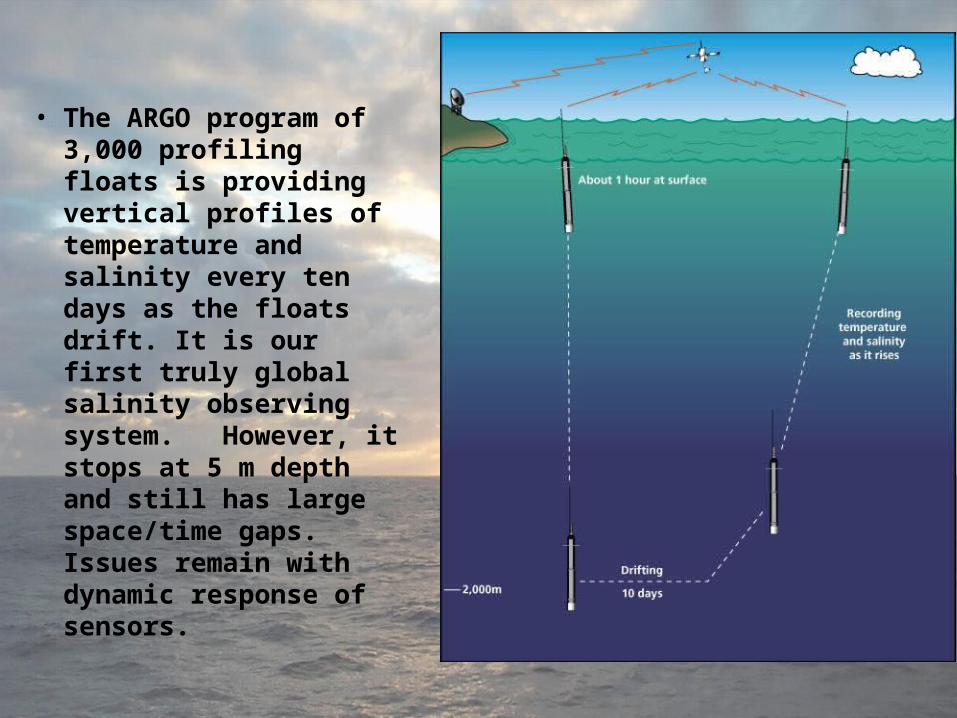
• The ARGO program of 3,000 profiling floats is providing vertical profiles of temperature and salinity every ten days as the floats drift. It is our first truly global salinity observing system. However, it stops at 5 m depth and still has large space/time gaps. Issues remain with dynamic response of sensors.
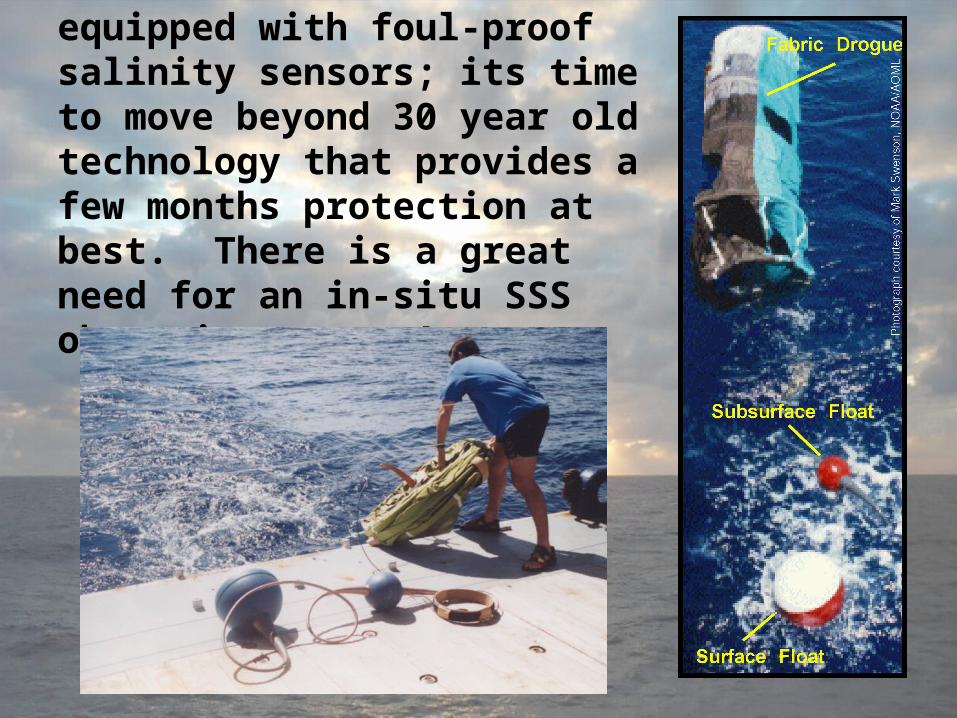
Surface drifters can be equipped with foul-proof salinity sensors; its time to move beyond 30 year old technology that provides a few months protection at best. There is a great need for an in-situ SSS observing system!
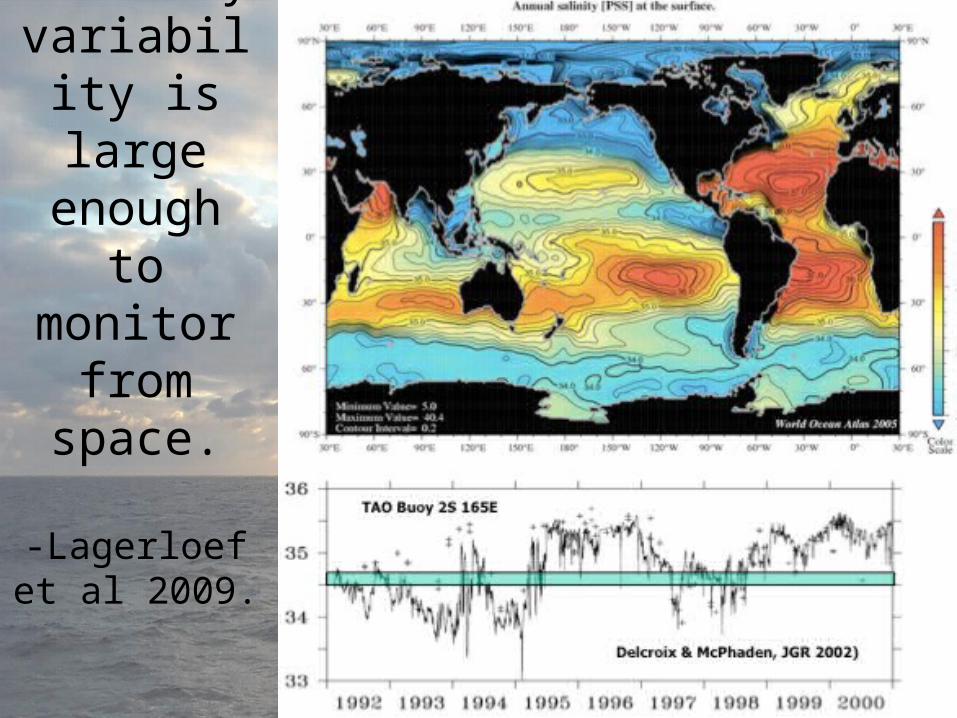
Salinity variability is large enough to monitor from space.
-Lagerloef et al 2009.
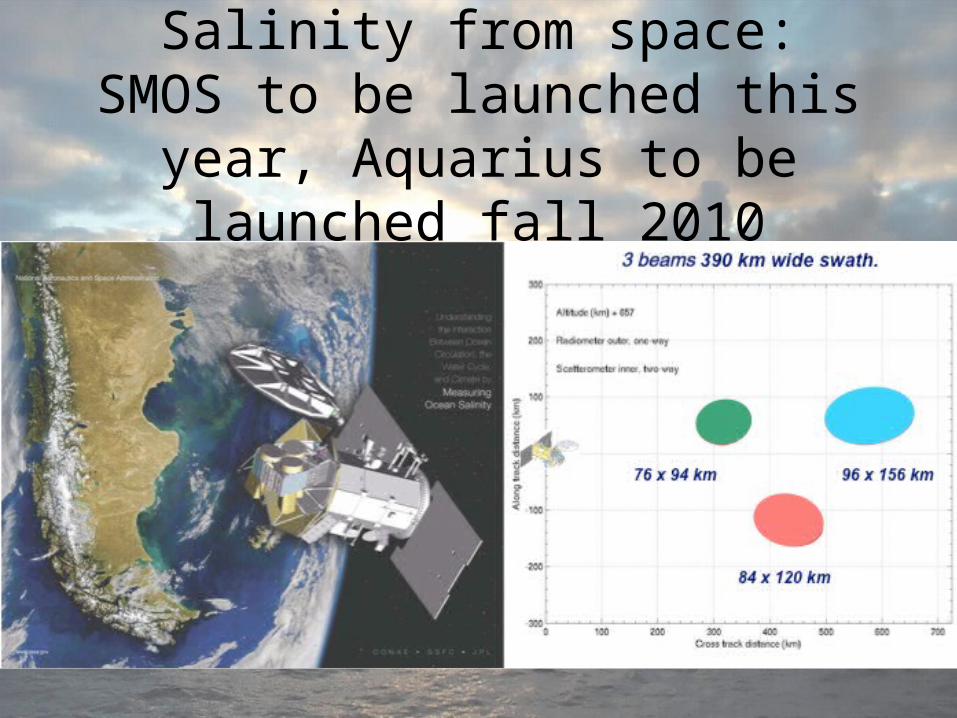
Salinity from space: SMOS to be launched this year, Aquarius to be
launched fall 2010
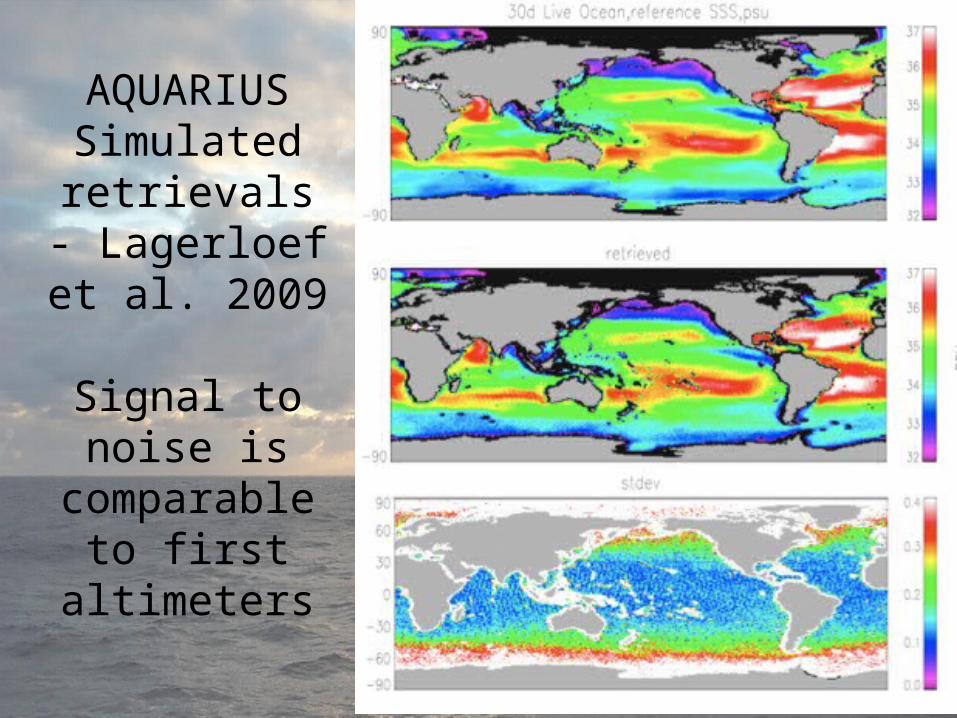
AQUARIUS Simulated retrievals
- Lagerloef et al. 2009
Signal to noise is comparable to first altimeters
Recent ICSU “Visioning” exercise on most important climate change
questions:
• The question “How will the water cycle evolve in response to global warming?” was voted the second most important climate change issue.
• Since the oceans contain most of the water, provide most of the evaporation and experience most of the precipitation, and SST is a useful predictor of rainfall on land, oceanographers should own this issue!
Freshwater and Salinity Summary:
• Changes in the water cycle are of tremendous consequence for society (droughts, floods).
• Most of the water cycle occurs over the oceans.
• Changes in the water cycle have impact on salinity and seawater density, and thus modulate oceanic mixing, heat storage, sea level and the MOC.
• Strong inter-annual to decadal variability in salinity can be seen, and present observing systems cannot distinguish this variability from that due to warming induced trends.
• These salinity signals are due largely to changes in evaporation and precipitation over the ocean; river discharges and glacial melt play only a minor role.
• An improved upper-ocean salinity data set could be assimilated into models and used as an additional constraint on estimates of the water cycle.
• New observing capabilities for salinity must be realized and utilized to monitor this key element of the climate system. This requires investment in new technology, broad deployment and careful quality control. (AQUARIUS, ARGO, SSS from Drifters, Thermosalinographs on the VOS)
• Process studies are also necessary.
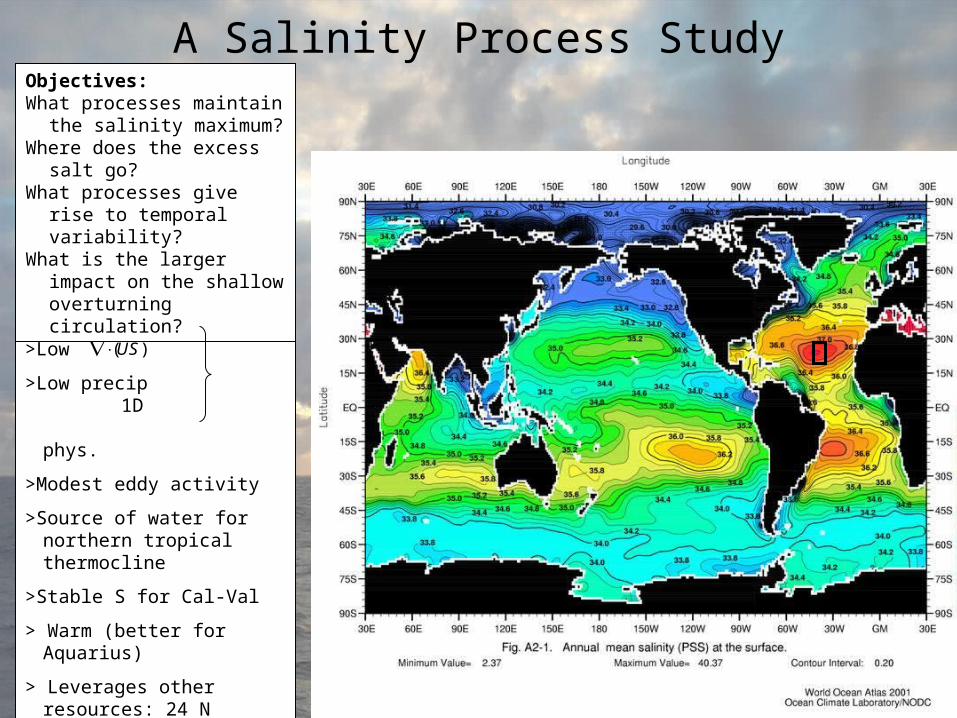
A Salinity Process Study
Location advantages:
>Low
>Low precip 1D phys.
>Modest eddy activity
>Source of water for northern tropical thermocline
>Stable S for Cal-Val
> Warm (better for Aquarius)
> Leverages other resources: 24 N section, Pirata Array, ESTOC time series (Canary Islands)
> Logistically tractable
)( SU
Objectives:What processes maintain the
salinity maximum?Where does the excess salt
go?What processes give rise to
temporal variability?What is the larger impact on
the shallow overturning circulation?

A “Cage” Experiment
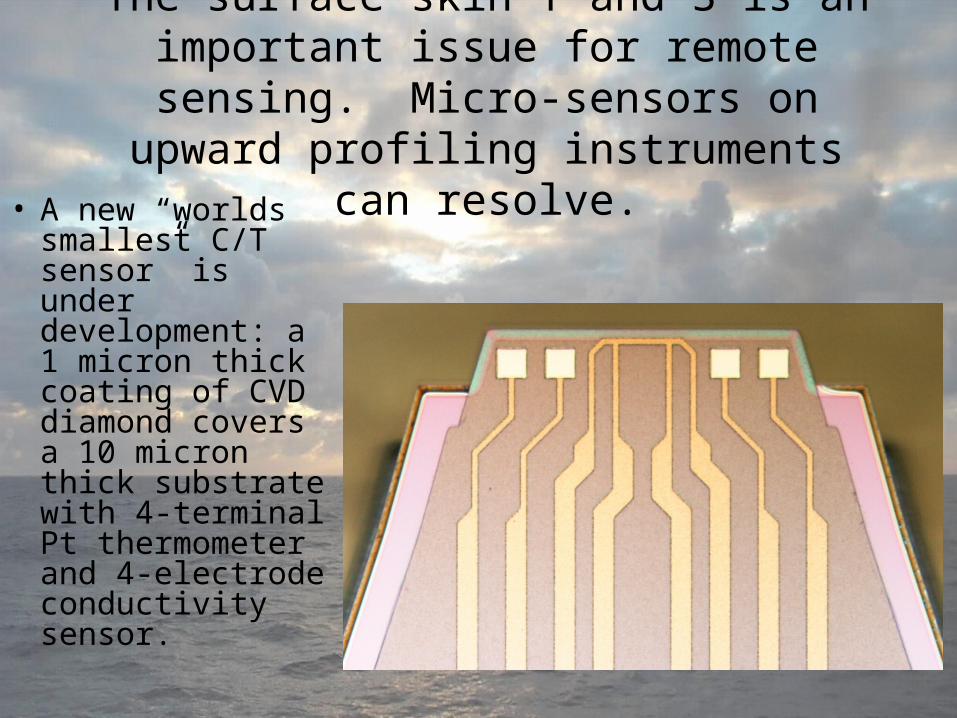
The surface skin T and S is an important issue for remote sensing. Micro-sensors on upward
profiling instruments can resolve.• A new “worlds
smallest C/T sensor” is under development: a 1 micron thick coating of CVD diamond covers a 10 micron thick substrate with 4-terminal Pt thermometer and 4-electrode conductivity sensor.
Though 30 year old technology has served us well, we must invest in new salinity sensing technology
(As I have been saying since OOSDP ~15 years ago)
• Long-term fouling resistant cells, with lifetimes of years not months.
• Micro T/C for surface skin and microstructure and mixing measurements
• Refractive index approaches using modern fiber-optics
Links:
Process Study described at:
• www.ldeo.columbia.edu/~agordon/reports
Aquarius SAC-D Meeting (21-23 October) at:• http://www.conae.gov.ar/AQ_SAC-D_5thScienceMeet/indexe.html