Embed Size (px)
Citation preview
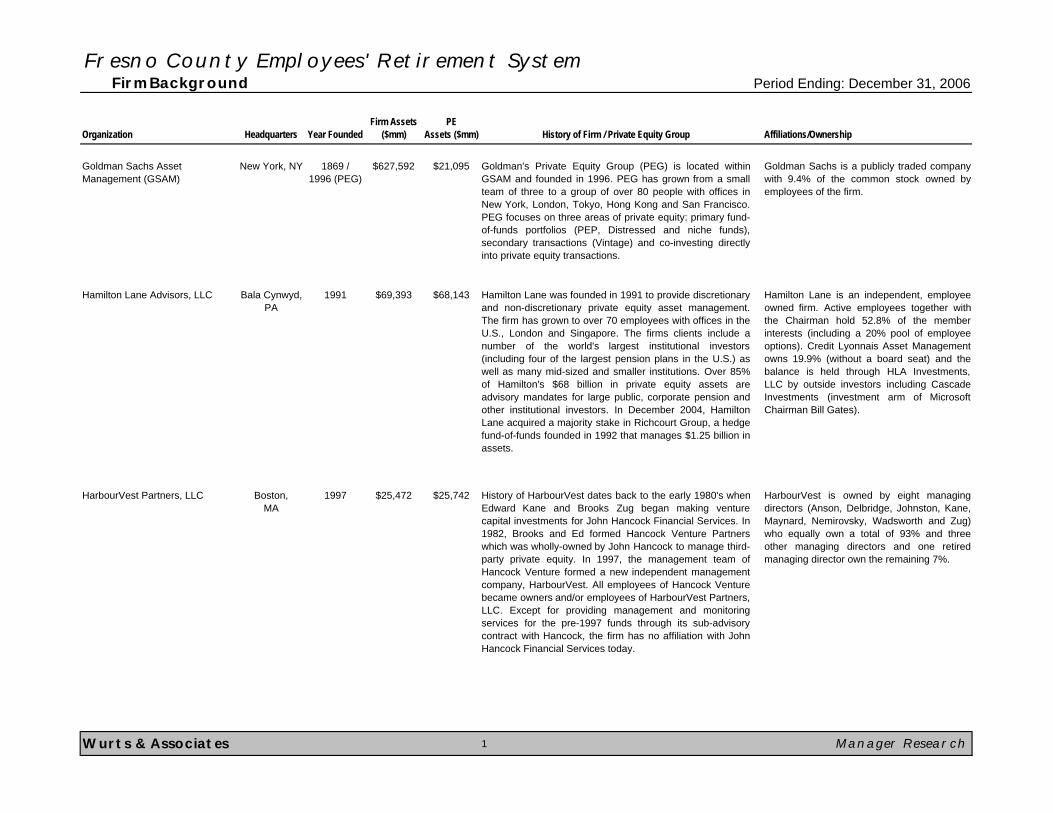
Fresno County Employees' Retirement System Firm Background Period Ending: December 31, 2006
Organization Headquarters Year FoundedFirm Assets
($mm)PE
Assets ($mm) History of Firm / Private Equity Group Affiliations/Ownership
Goldman Sachs Asset Management (GSAM)
New York, NY 1869 /1996 (PEG)
$627,592 $21,095 Goldman's Private Equity Group (PEG) is located withinGSAM and founded in 1996. PEG has grown from a smallteam of three to a group of over 80 people with offices inNew York, London, Tokyo, Hong Kong and San Francisco.PEG focuses on three areas of private equity: primary fund-of-funds portfolios (PEP, Distressed and niche funds),secondary transactions (Vintage) and co-investing directlyinto private equity transactions.
Goldman Sachs is a publicly traded companywith 9.4% of the common stock owned byemployees of the firm.
Hamilton Lane Advisors, LLC Bala Cynwyd, PA
1991 $69,393 $68,143 Hamilton Lane was founded in 1991 to provide discretionaryand non-discretionary private equity asset management.The firm has grown to over 70 employees with offices in theU.S., London and Singapore. The firms clients include anumber of the world's largest institutional investors(including four of the largest pension plans in the U.S.) aswell as many mid-sized and smaller institutions. Over 85%of Hamilton's $68 billion in private equity assets areadvisory mandates for large public, corporate pension andother institutional investors. In December 2004, HamiltonLane acquired a majority stake in Richcourt Group, a hedgefund-of-funds founded in 1992 that manages $1.25 billion inassets.
Hamilton Lane is an independent, employeeowned firm. Active employees together withthe Chairman hold 52.8% of the memberinterests (including a 20% pool of employeeoptions). Credit Lyonnais Asset Managementowns 19.9% (without a board seat) and thebalance is held through HLA Investments,LLC by outside investors including CascadeInvestments (investment arm of MicrosoftChairman Bill Gates).
HarbourVest Partners, LLC Boston, MA
1997 $25,472 $25,742 History of HarbourVest dates back to the early 1980's whenEdward Kane and Brooks Zug began making venturecapital investments for John Hancock Financial Services. In1982, Brooks and Ed formed Hancock Venture Partnerswhich was wholly-owned by John Hancock to manage third-party private equity. In 1997, the management team ofHancock Venture formed a new independent managementcompany, HarbourVest. All employees of Hancock Venturebecame owners and/or employees of HarbourVest Partners,LLC. Except for providing management and monitoringservices for the pre-1997 funds through its sub-advisorycontract with Hancock, the firm has no affiliation with JohnHancock Financial Services today.
HarbourVest is owned by eight managingdirectors (Anson, Delbridge, Johnston, Kane,Maynard, Nemirovsky, Wadsworth and Zug)who equally own a total of 93% and threeother managing directors and one retiredmanaging director own the remaining 7%.
Wurts & Associates 1 Manager Research
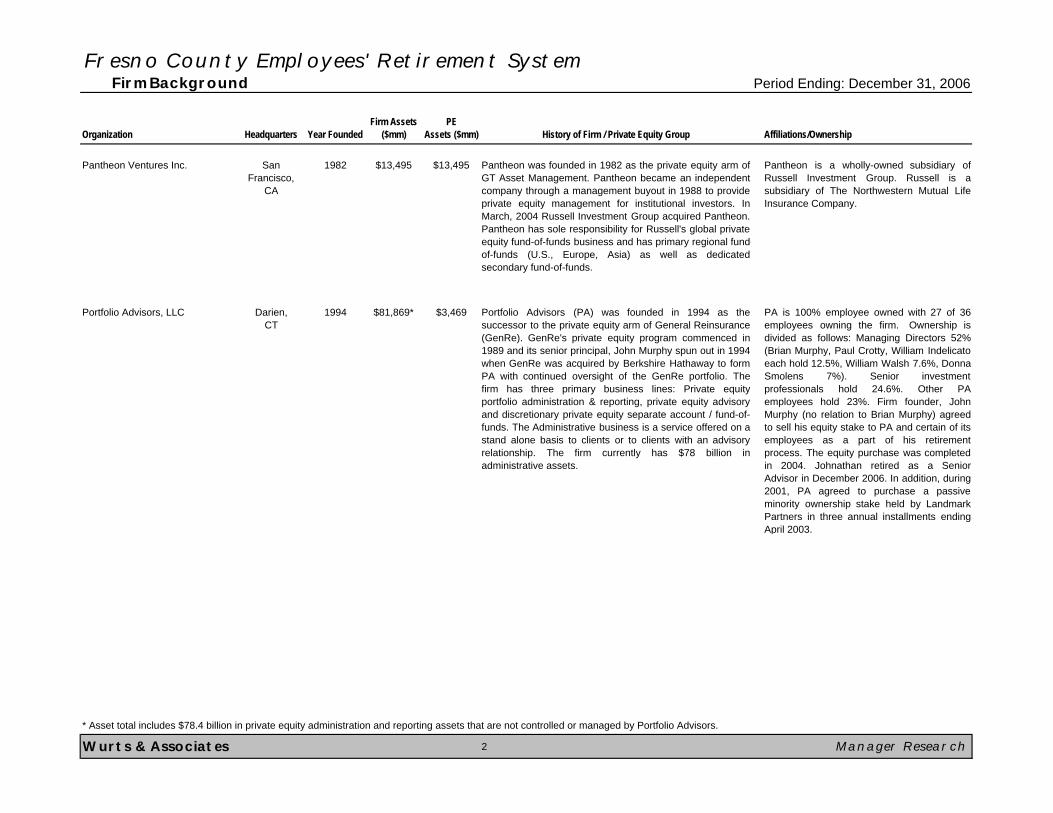
Fresno County Employees' Retirement System Firm Background Period Ending: December 31, 2006
Organization Headquarters Year FoundedFirm Assets
($mm)PE
Assets ($mm) History of Firm / Private Equity Group Affiliations/Ownership
Pantheon Ventures Inc. San Francisco,
CA
1982 $13,495 $13,495 Pantheon was founded in 1982 as the private equity arm ofGT Asset Management. Pantheon became an independentcompany through a management buyout in 1988 to provideprivate equity management for institutional investors. InMarch, 2004 Russell Investment Group acquired Pantheon.Pantheon has sole responsibility for Russell's global privateequity fund-of-funds business and has primary regional fund-of-funds (U.S., Europe, Asia) as well as dedicatedsecondary fund-of-funds.
Pantheon is a wholly-owned subsidiary ofRussell Investment Group. Russell is asubsidiary of The Northwestern Mutual LifeInsurance Company.
Portfolio Advisors, LLC Darien, CT
1994 $81,869* $3,469 Portfolio Advisors (PA) was founded in 1994 as thesuccessor to the private equity arm of General Reinsurance(GenRe). GenRe's private equity program commenced in1989 and its senior principal, John Murphy spun out in 1994when GenRe was acquired by Berkshire Hathaway to formPA with continued oversight of the GenRe portfolio. Thefirm has three primary business lines: Private equityportfolio administration & reporting, private equity advisoryand discretionary private equity separate account / fund-of-funds. The Administrative business is a service offered on astand alone basis to clients or to clients with an advisoryrelationship. The firm currently has $78 billion inadministrative assets.
PA is 100% employee owned with 27 of 36employees owning the firm. Ownership isdivided as follows: Managing Directors 52%(Brian Murphy, Paul Crotty, William Indelicatoeach hold 12.5%, William Walsh 7.6%, DonnaSmolens 7%). Senior investmentprofessionals hold 24.6%. Other PAemployees hold 23%. Firm founder, JohnMurphy (no relation to Brian Murphy) agreedto sell his equity stake to PA and certain of itsemployees as a part of his retirementprocess. The equity purchase was completedin 2004. Johnathan retired as a SeniorAdvisor in December 2006. In addition, during2001, PA agreed to purchase a passiveminority ownership stake held by LandmarkPartners in three annual installments endingApril 2003.
Wurts & Associates 2 Manager Research
* Asset total includes $78.4 billion in private equity administration and reporting assets that are not controlled or managed by Portfolio Advisors.
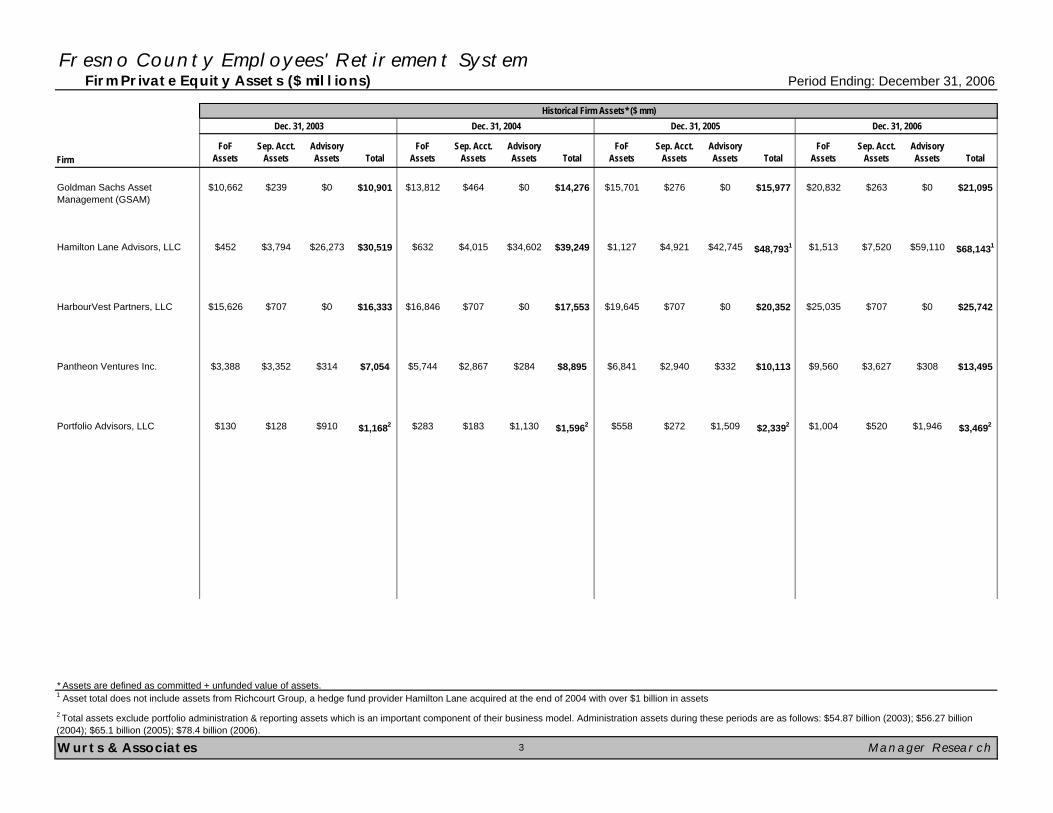
Fresno County Employees' Retirement System Firm Private Equity Assets ($ millions) Period Ending: December 31, 2006
FirmFoF
AssetsSep. Acct.
AssetsAdvisory Assets Total
FoF Assets
Sep. Acct. Assets
Advisory Assets Total
FoF Assets
Sep. Acct. Assets
Advisory Assets Total
FoF Assets
Sep. Acct. Assets
Advisory Assets Total
Goldman Sachs Asset Management (GSAM)
$10,662 $239 $0 $10,901 $13,812 $464 $0 $14,276 $15,701 $276 $0 $15,977 $20,832 $263 $0 $21,095
Hamilton Lane Advisors, LLC $452 $3,794 $26,273 $30,519 $632 $4,015 $34,602 $39,249 $1,127 $4,921 $42,745 $48,7931 $1,513 $7,520 $59,110 $68,1431
HarbourVest Partners, LLC $15,626 $707 $0 $16,333 $16,846 $707 $0 $17,553 $19,645 $707 $0 $20,352 $25,035 $707 $0 $25,742
Pantheon Ventures Inc. $3,388 $3,352 $314 $7,054 $5,744 $2,867 $284 $8,895 $6,841 $2,940 $332 $10,113 $9,560 $3,627 $308 $13,495
Portfolio Advisors, LLC $130 $128 $910 $1,1682 $283 $183 $1,130 $1,5962 $558 $272 $1,509 $2,3392 $1,004 $520 $1,946 $3,4692
Wurts & Associates Manager Research
Historical Firm Assets* ($ mm)Dec. 31, 2003 Dec. 31, 2004 Dec. 31, 2005 Dec. 31, 2006
* Assets are defined as committed + unfunded value of assets. 1 Asset total does not include assets from Richcourt Group, a hedge fund provider Hamilton Lane acquired at the end of 2004 with over $1 billion in assets
3
2 Total assets exclude portfolio administration & reporting assets which is an important component of their business model. Administration assets during these periods are as follows: $54.87 billion (2003); $56.27 billion (2004); $65.1 billion (2005); $78.4 billion (2006).
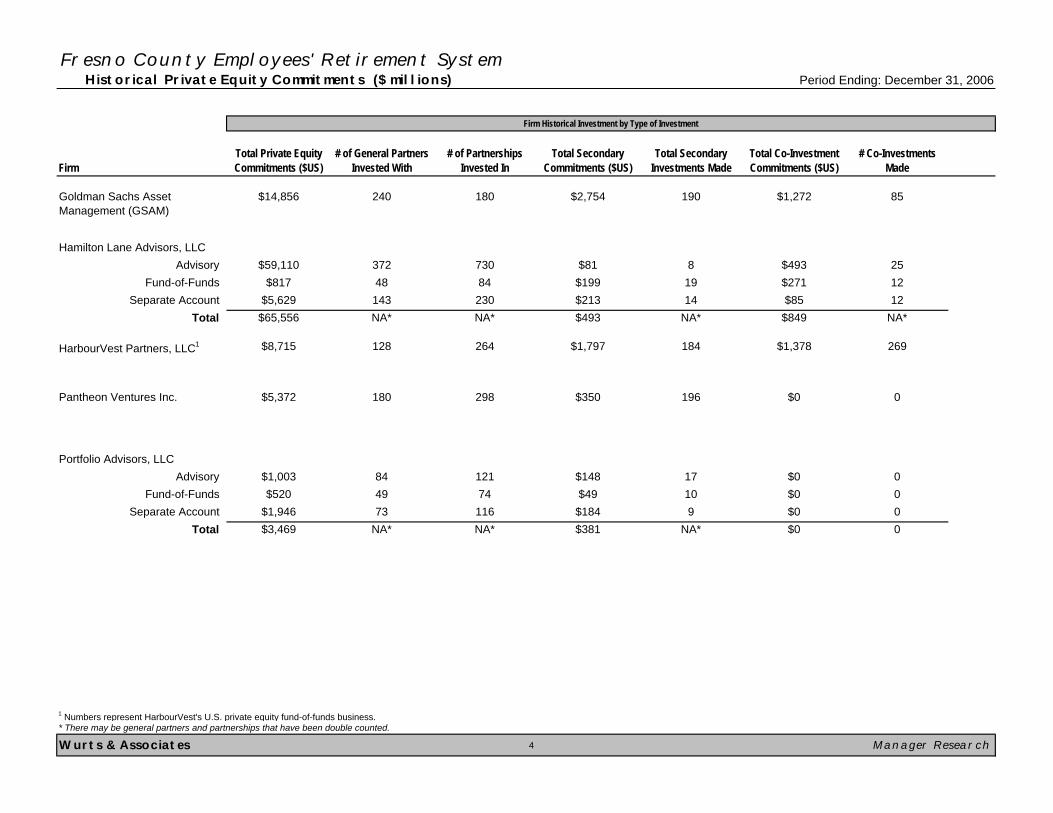
Fresno County Employees' Retirement System Historical Private Equity Commitments ($ millions) Period Ending: December 31, 2006
Firm
Goldman Sachs Asset Management (GSAM)
Hamilton Lane Advisors, LLCAdvisory
Fund-of-FundsSeparate Account
Total
HarbourVest Partners, LLC1
Pantheon Ventures Inc.
Portfolio Advisors, LLCAdvisory
Fund-of-FundsSeparate Account
Total
Wurts & Associates 4 Manager Research
12NA*
$85$849
819
$81 2512
$493$271
$65,556
37248143NA*
$59,110$817
$5,629
* There may be general partners and partnerships that have been double counted.
1 Numbers represent HarbourVest's U.S. private equity fund-of-funds business.
NA* $0 0$3,469 NA* NA*
0$010$4909 $0
$381$184
121 $148 17 0$0
11674
73084230NA*
298
$1,378
$0
Firm Historical Investment by Type of Investment
85
269
0
$1,272190
184
196$350
14NA*
180
264
$2,754
$1,797
$199$213$493
128
180
73
8449
$8,715
$5,372
$1,946
$1,003$520
Total Co-Investment Commitments ($US)
# Co-Investments Made
# of General Partners Invested With
$14,856 240
Total Secondary Commitments ($US)
Total Private Equity Commitments ($US)
Total Secondary Investments Made
# of Partnerships Invested In
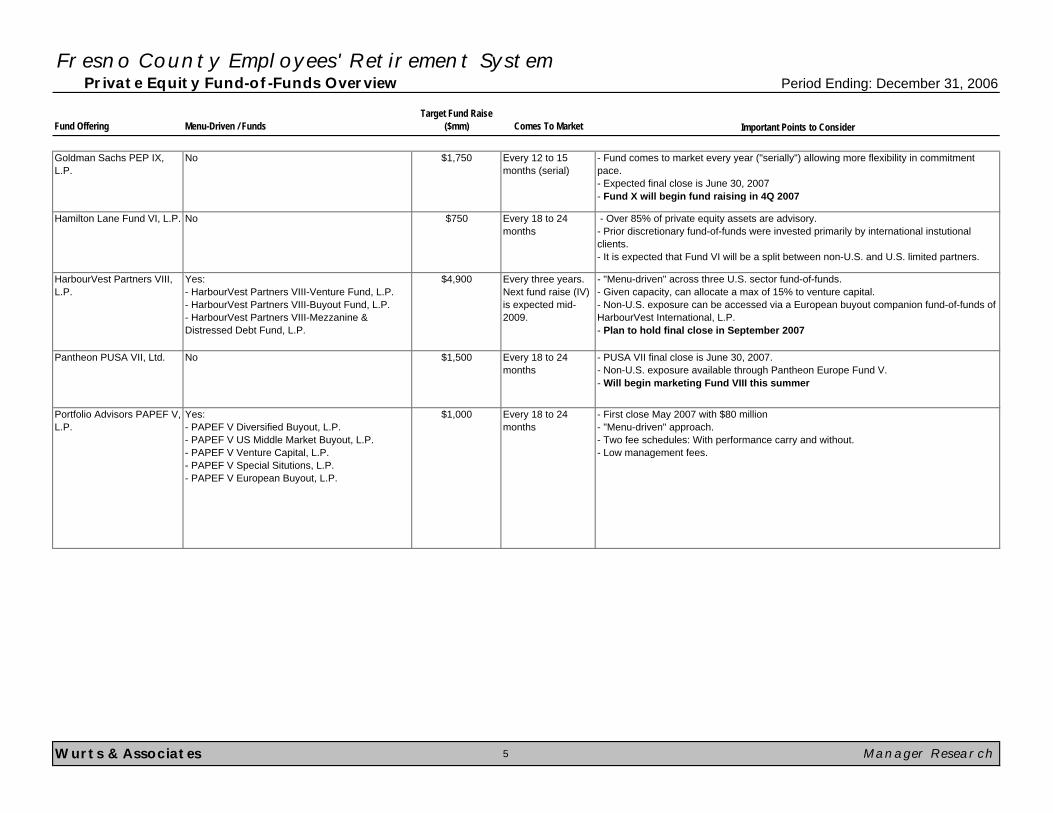
Fresno County Employees' Retirement System Private Equity Fund-of-Funds Overview Period Ending: December 31, 2006
Fund Offering Menu-Driven / FundsTarget Fund Raise
($mm) Comes To Market
Goldman Sachs PEP IX, L.P.
No $1,750 Every 12 to 15 months (serial)
Hamilton Lane Fund VI, L.P. No $750 Every 18 to 24 months
HarbourVest Partners VIII, L.P.
Yes:- HarbourVest Partners VIII-Venture Fund, L.P.- HarbourVest Partners VIII-Buyout Fund, L.P.- HarbourVest Partners VIII-Mezzanine & Distressed Debt Fund, L.P.
$4,900 Every three years. Next fund raise (IV) is expected mid-2009.
Pantheon PUSA VII, Ltd. No $1,500 Every 18 to 24 months
Portfolio Advisors PAPEF V, L.P.
Yes:- PAPEF V Diversified Buyout, L.P.- PAPEF V US Middle Market Buyout, L.P.- PAPEF V Venture Capital, L.P.- PAPEF V Special Situtions, L.P.- PAPEF V European Buyout, L.P.
$1,000 Every 18 to 24 months
Wurts & Associates 5 Manager Research
- First close May 2007 with $80 million- "Menu-driven" approach.- Two fee schedules: With performance carry and without.- Low management fees.
Important Points to Consider
- Fund comes to market every year ("serially") allowing more flexibility in commitment pace. - Expected final close is June 30, 2007- Fund X will begin fund raising in 4Q 2007
- "Menu-driven" across three U.S. sector fund-of-funds. - Given capacity, can allocate a max of 15% to venture capital. - Non-U.S. exposure can be accessed via a European buyout companion fund-of-funds of HarbourVest International, L.P.- Plan to hold final close in September 2007
- PUSA VII final close is June 30, 2007. - Non-U.S. exposure available through Pantheon Europe Fund V.- Will begin marketing Fund VIII this summer
- Over 85% of private equity assets are advisory.- Prior discretionary fund-of-funds were invested primarily by international instutional clients.- It is expected that Fund VI will be a split between non-U.S. and U.S. limited partners.
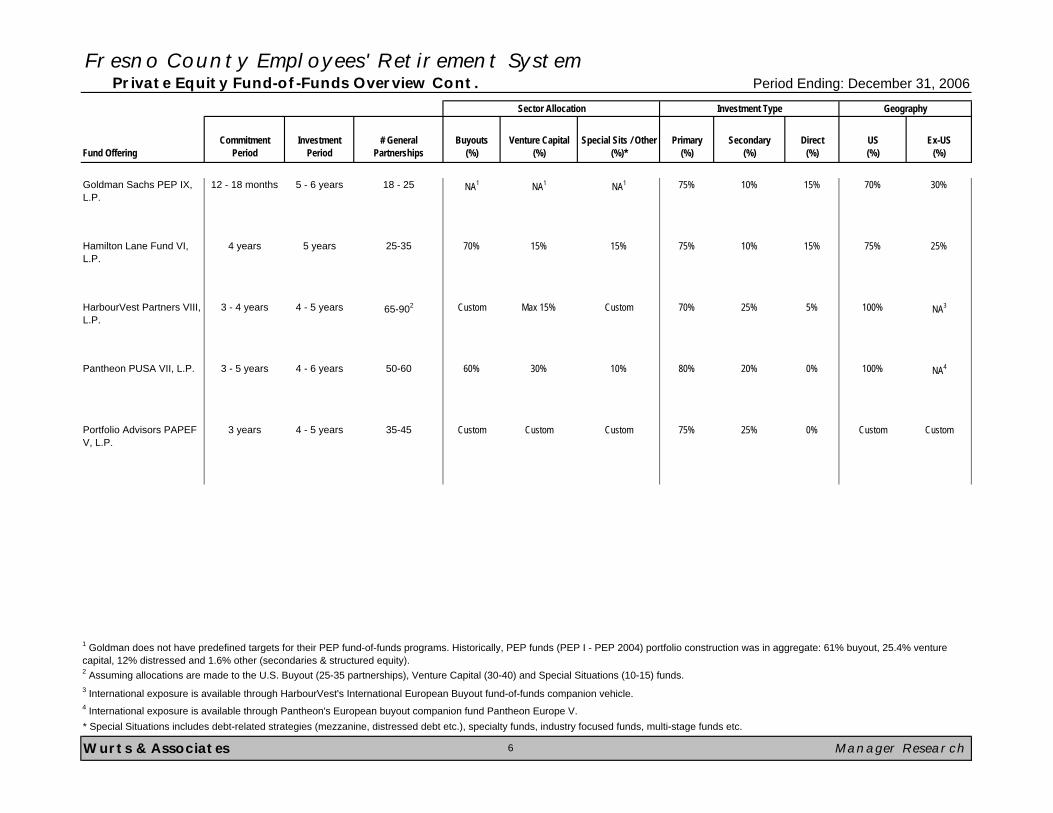
Fresno County Employees' Retirement System Private Equity Fund-of-Funds Overview Cont. Period Ending: December 31, 2006
Fund OfferingCommitment
PeriodInvestment
Period# General
PartnershipsBuyouts
(%)Venture Capital
(%)Special Sits / Other
(%)*Primary
(%)Secondary
(%)Direct
(%)US (%)
Ex-US (%)
Goldman Sachs PEP IX, L.P.
12 - 18 months 5 - 6 years 18 - 25 NA1 NA1 NA1 75% 10% 15% 70% 30%
Hamilton Lane Fund VI, L.P.
4 years 5 years 25-35 70% 15% 15% 75% 10% 15% 75% 25%
HarbourVest Partners VIII, L.P.
3 - 4 years 4 - 5 years 65-902 Custom Max 15% Custom 70% 25% 5% 100% NA3
Pantheon PUSA VII, L.P. 3 - 5 years 4 - 6 years 50-60 60% 30% 10% 80% 20% 0% 100% NA4
Portfolio Advisors PAPEF V, L.P.
3 years 4 - 5 years 35-45 Custom Custom Custom 75% 25% 0% Custom Custom
Wurts & Associates Manager Research
1 Goldman does not have predefined targets for their PEP fund-of-funds programs. Historically, PEP funds (PEP I - PEP 2004) portfolio construction was in aggregate: 61% buyout, 25.4% venture capital, 12% distressed and 1.6% other (secondaries & structured equity).2 Assuming allocations are made to the U.S. Buyout (25-35 partnerships), Venture Capital (30-40) and Special Situations (10-15) funds.
* Special Situations includes debt-related strategies (mezzanine, distressed debt etc.), specialty funds, industry focused funds, multi-stage funds etc.
4 International exposure is available through Pantheon's European buyout companion fund Pantheon Europe V.
6
Sector Allocation Investment Type Geography
3 International exposure is available through HarbourVest's International European Buyout fund-of-funds companion vehicle.
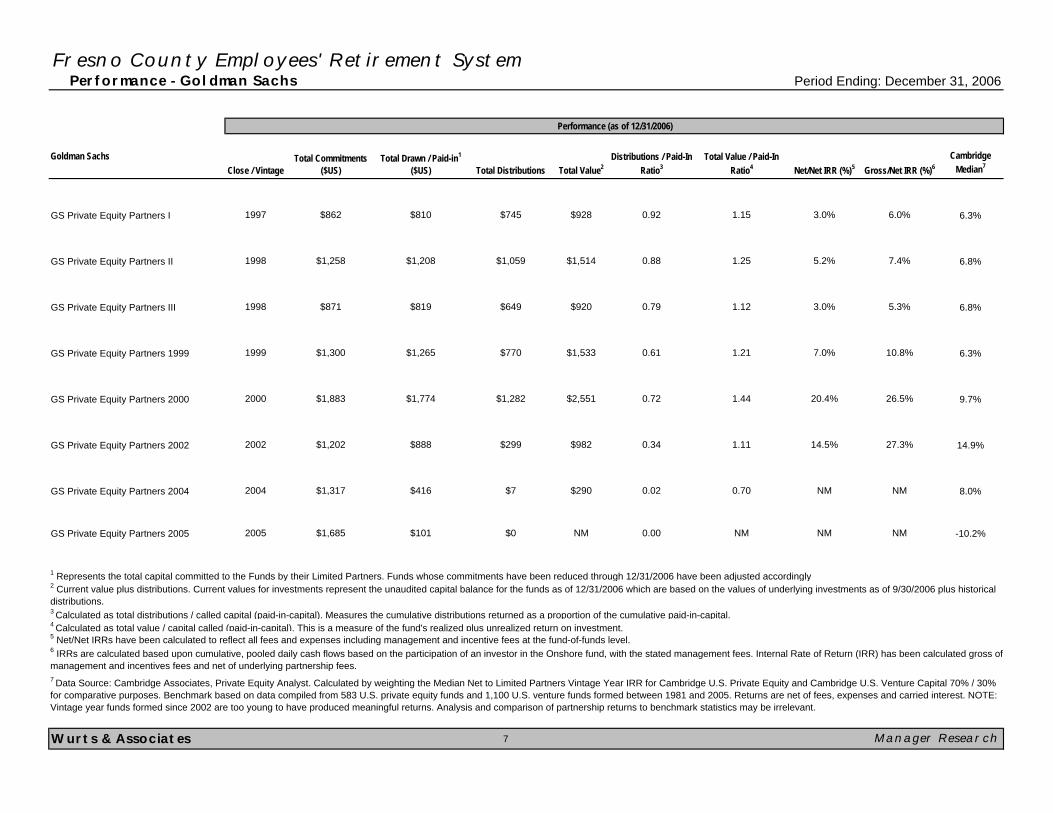
Fresno County Employees' Retirement System Performance - Goldman Sachs Period Ending: December 31, 2006
Goldman Sachs Cambridge Median7
GS Private Equity Partners I 6.3%
GS Private Equity Partners II 6.8%
GS Private Equity Partners III 6.8%
GS Private Equity Partners 1999 6.3%
GS Private Equity Partners 2000 9.7%
GS Private Equity Partners 2002 14.9%
GS Private Equity Partners 2004 8.0%
GS Private Equity Partners 2005 -10.2%
Wurts & Associates 7
7.4%
3.0%
NM
20.4% 26.5%
14.5% 27.3%
5.3%
7.0% 10.8%
Net/Net IRR (%)5 Gross/Net IRR (%)6
3.0% 6.0%
Total DistributionsClose / Vintage Total Value2Distributions / Paid-In
Ratio3Total Value / Paid-In
Ratio4
1997 $862 $810 $745 $928 0.92 1.15
Total Commitments ($US)
Total Drawn / Paid-in1
($US)
1998
1998
$1,258
$871
$1,300
$1,883
$888
$416
$1,202
$1,317
1999
2000
2002
2004
$299
$7
$1,208
$819
$1,059
$649
$770
$1,282
$1,265
$1,774
0.02
$1,514
$920
$1,533
$2,551
0.79
0.61
0.72
0.34$982
$290
0.88 5.2%
1.11
0.70
1.25
1.12
1.21
1.44
NM
$0 NM
Performance (as of 12/31/2006)
Manager Research
1 Represents the total capital committed to the Funds by their Limited Partners. Funds whose commitments have been reduced through 12/31/2006 have been adjusted accordingly.
4 Calculated as total value / capital called (paid-in-capital). This is a measure of the fund's realized plus unrealized return on investment.5 Net/Net IRRs have been calculated to reflect all fees and expenses including management and incentive fees at the fund-of-funds level. 6 IRRs are calculated based upon cumulative, pooled daily cash flows based on the participation of an investor in the Onshore fund, with the stated management fees. Internal Rate of Return (IRR) has been calculated gross of management and incentives fees and net of underlying partnership fees. 7 Data Source: Cambridge Associates, Private Equity Analyst. Calculated by weighting the Median Net to Limited Partners Vintage Year IRR for Cambridge U.S. Private Equity and Cambridge U.S. Venture Capital 70% / 30% for comparative purposes. Benchmark based on data compiled from 583 U.S. private equity funds and 1,100 U.S. venture funds formed between 1981 and 2005. Returns are net of fees, expenses and carried interest. NOTE: Vintage year funds formed since 2002 are too young to have produced meaningful returns. Analysis and comparison of partnership returns to benchmark statistics may be irrelevant.
0.00 NM NM NM
3 Calculated as total distributions / called capital (paid-in-capital). Measures the cumulative distributions returned as a proportion of the cumulative paid-in-capital.
2 Current value plus distributions. Current values for investments represent the unaudited capital balance for the funds as of 12/31/2006 which are based on the values of underlying investments as of 9/30/2006 plus historical distributions.
2005 $1,685 $101
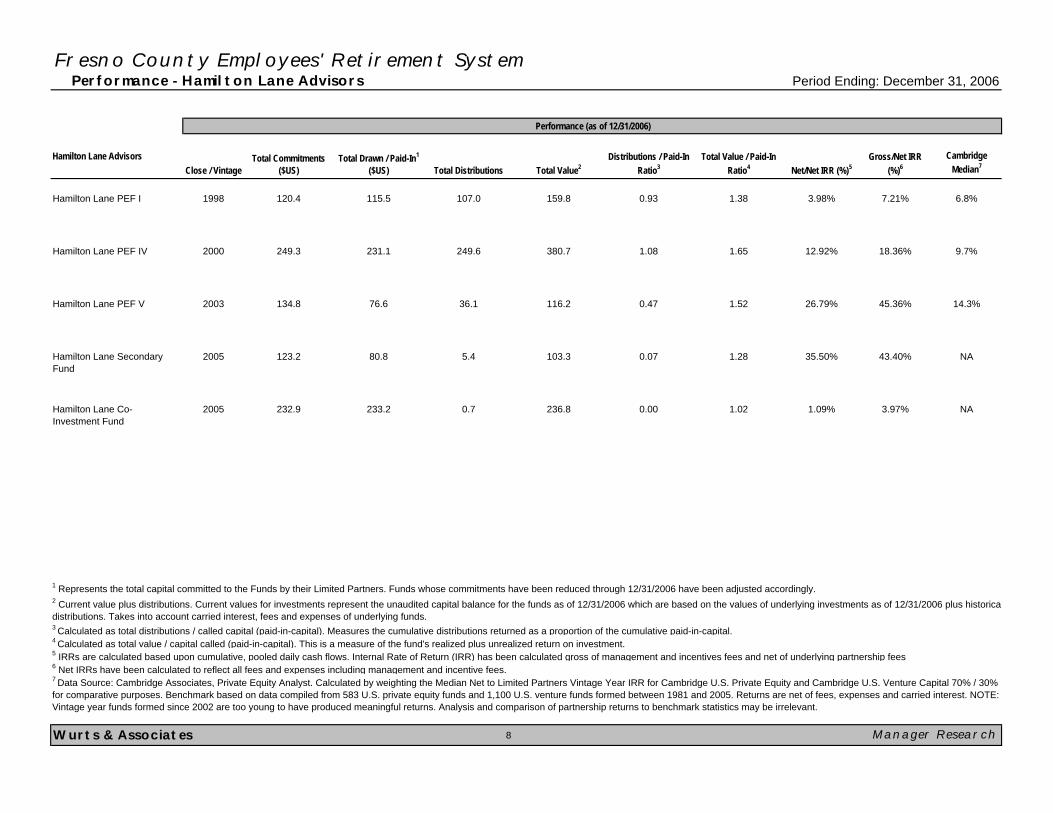
Fresno County Employees' Retirement System Performance - Hamilton Lane Advisors Period Ending: December 31, 2006
Hamilton Lane Advisors Cambridge Median7
Hamilton Lane PEF I 6.8%
Hamilton Lane PEF IV 9.7%
Hamilton Lane PEF V 14.3%
Hamilton Lane Secondary Fund
NA
Hamilton Lane Co-Investment Fund
NA
Wurts & Associates 8
2 Current value plus distributions. Current values for investments represent the unaudited capital balance for the funds as of 12/31/2006 which are based on the values of underlying investments as of 12/31/2006 plus historicadistributions. Takes into account carried interest, fees and expenses of underlying funds.
Performance (as of 12/31/2006)
Manager Research
1 Represents the total capital committed to the Funds by their Limited Partners. Funds whose commitments have been reduced through 12/31/2006 have been adjusted accordingly.
3 Calculated as total distributions / called capital (paid-in-capital). Measures the cumulative distributions returned as a proportion of the cumulative paid-in-capital.4 Calculated as total value / capital called (paid-in-capital). This is a measure of the fund's realized plus unrealized return on investment.5 IRRs are calculated based upon cumulative, pooled daily cash flows. Internal Rate of Return (IRR) has been calculated gross of management and incentives fees and net of underlying partnership fees6 Net IRRs have been calculated to reflect all fees and expenses including management and incentive fees. 7 Data Source: Cambridge Associates, Private Equity Analyst. Calculated by weighting the Median Net to Limited Partners Vintage Year IRR for Cambridge U.S. Private Equity and Cambridge U.S. Venture Capital 70% / 30% for comparative purposes. Benchmark based on data compiled from 583 U.S. private equity funds and 1,100 U.S. venture funds formed between 1981 and 2005. Returns are net of fees, expenses and carried interest. NOTE: Vintage year funds formed since 2002 are too young to have produced meaningful returns. Analysis and comparison of partnership returns to benchmark statistics may be irrelevant.
18.36%
26.79% 45.36%
35.50% 43.40%
Net/Net IRR (%)5Gross/Net IRR
(%)6
3.98% 7.21%
Total DistributionsClose / Vintage Total Value2Distributions / Paid-In
Ratio3Total Value / Paid-In
Ratio4
1998 120.4 115.5 107.0 159.8 0.93 1.38
Total Commitments ($US)
Total Drawn / Paid-In1
($US)
233.2
231.1
76.6
2000
2003
249.3
134.8
5.4
1.08
2005
2005
249.6
36.1
0.7
123.2
232.9
80.8
236.8
0.07
0.00
380.7
116.2 0.47
12.92%1.65
1.52
1.09% 3.97%
1.28
1.02
103.3
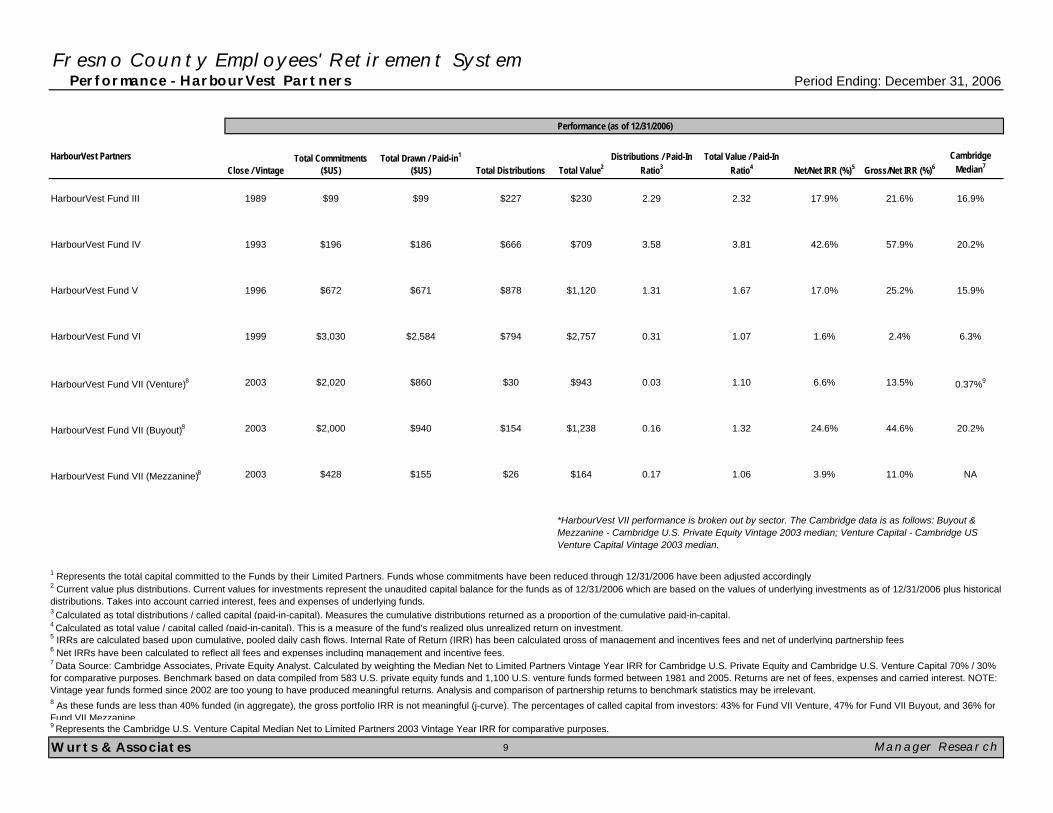
Fresno County Employees' Retirement System Performance - HarbourVest Partners Period Ending: December 31, 2006
HarbourVest Partners Cambridge Median7
HarbourVest Fund III 16.9%
HarbourVest Fund IV 20.2%
HarbourVest Fund V 15.9%
HarbourVest Fund VI 6.3%
HarbourVest Fund VII (Venture)8 0.37%9
HarbourVest Fund VII (Buyout)8 20.2%
HarbourVest Fund VII (Mezzanine)8 NA
Wurts & Associates 9
9 Represents the Cambridge U.S. Venture Capital Median Net to Limited Partners 2003 Vintage Year IRR for comparative purposes.
*HarbourVest VII performance is broken out by sector. The Cambridge data is as follows: Buyout & Mezzanine - Cambridge U.S. Private Equity Vintage 2003 median; Venture Capital - Cambridge US Venture Capital Vintage 2003 median.
3 Calculated as total distributions / called capital (paid-in-capital). Measures the cumulative distributions returned as a proportion of the cumulative paid-in-capital.
2 Current value plus distributions. Current values for investments represent the unaudited capital balance for the funds as of 12/31/2006 which are based on the values of underlying investments as of 12/31/2006 plus historical distributions. Takes into account carried interest, fees and expenses of underlying funds.
8 As these funds are less than 40% funded (in aggregate), the gross portfolio IRR is not meaningful (j-curve). The percentages of called capital from investors: 43% for Fund VII Venture, 47% for Fund VII Buyout, and 36% for Fund VII Mezzanine.
Performance (as of 12/31/2006)
Manager Research
1 Represents the total capital committed to the Funds by their Limited Partners. Funds whose commitments have been reduced through 12/31/2006 have been adjusted accordingly.
4 Calculated as total value / capital called (paid-in-capital). This is a measure of the fund's realized plus unrealized return on investment.5 IRRs are calculated based upon cumulative, pooled daily cash flows. Internal Rate of Return (IRR) has been calculated gross of management and incentives fees and net of underlying partnership fees6 Net IRRs have been calculated to reflect all fees and expenses including management and incentive fees. 7 Data Source: Cambridge Associates, Private Equity Analyst. Calculated by weighting the Median Net to Limited Partners Vintage Year IRR for Cambridge U.S. Private Equity and Cambridge U.S. Venture Capital 70% / 30% for comparative purposes. Benchmark based on data compiled from 583 U.S. private equity funds and 1,100 U.S. venture funds formed between 1981 and 2005. Returns are net of fees, expenses and carried interest. NOTE: Vintage year funds formed since 2002 are too young to have produced meaningful returns. Analysis and comparison of partnership returns to benchmark statistics may be irrelevant.
$164
3.58 42.6%
1.32
1.06
3.81
1.67
1.07
1.10
3.9%0.17
$709
$1,120
$2,757
$943
1.31
0.31
0.03
0.16$1,238$154
$26
$186
$671
$666
$878
$794
$30
$2,584
$860
1999
2003
2003
2003
$3,030
$2,020
$940
$155
$2,000
$428
1993
1996
$196
$672
$230 2.29 2.32
Total Commitments ($US)
Total Drawn / Paid-in1
($US)
1989 $99 $99 $227
Net/Net IRR (%)5 Gross/Net IRR (%)6
17.9% 21.6%
Total DistributionsClose / Vintage Total Value2Distributions / Paid-In
Ratio3Total Value / Paid-In
Ratio4
57.9%
17.0%
11.0%
6.6% 13.5%
24.6% 44.6%
25.2%
1.6% 2.4%
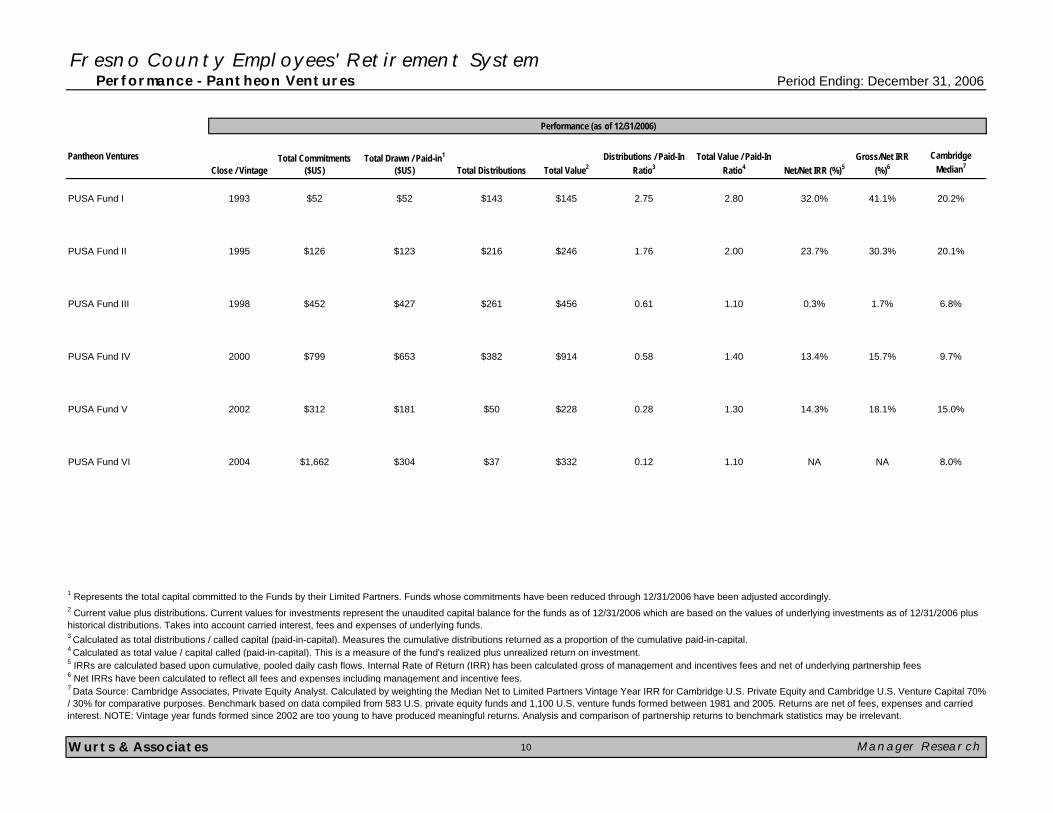
Fresno County Employees' Retirement System Performance - Pantheon Ventures Period Ending: December 31, 2006
Pantheon Ventures Cambridge Median7
PUSA Fund I 20.2%
PUSA Fund II 20.1%
PUSA Fund III 6.8%
PUSA Fund IV 9.7%
PUSA Fund V 15.0%
PUSA Fund VI 8.0%
Wurts & Associates 10
Performance (as of 12/31/2006)
Manager Research
1 Represents the total capital committed to the Funds by their Limited Partners. Funds whose commitments have been reduced through 12/31/2006 have been adjusted accordingly. 2 Current value plus distributions. Current values for investments represent the unaudited capital balance for the funds as of 12/31/2006 which are based on the values of underlying investments as of 12/31/2006 plus historical distributions. Takes into account carried interest, fees and expenses of underlying funds. 3 Calculated as total distributions / called capital (paid-in-capital). Measures the cumulative distributions returned as a proportion of the cumulative paid-in-capital.4 Calculated as total value / capital called (paid-in-capital). This is a measure of the fund's realized plus unrealized return on investment.5 IRRs are calculated based upon cumulative, pooled daily cash flows. Internal Rate of Return (IRR) has been calculated gross of management and incentives fees and net of underlying partnership fees6 Net IRRs have been calculated to reflect all fees and expenses including management and incentive fees. 7 Data Source: Cambridge Associates, Private Equity Analyst. Calculated by weighting the Median Net to Limited Partners Vintage Year IRR for Cambridge U.S. Private Equity and Cambridge U.S. Venture Capital 70% / 30% for comparative purposes. Benchmark based on data compiled from 583 U.S. private equity funds and 1,100 U.S. venture funds formed between 1981 and 2005. Returns are net of fees, expenses and carried interest. NOTE: Vintage year funds formed since 2002 are too young to have produced meaningful returns. Analysis and comparison of partnership returns to benchmark statistics may be irrelevant.
30.3%
0.3% 1.7%
13.4% 15.7%
Net/Net IRR (%)5Gross/Net IRR
(%)6
32.0% 41.1%
Total DistributionsClose / Vintage Total Value2Distributions / Paid-In
Ratio3Total Value / Paid-In
Ratio4
1993 $52 $52 $143 $145 2.75 2.80
Total Commitments ($US)
Total Drawn / Paid-in1
($US)
1995
1998
2000
2002
$304
$126
$452
$799
$312
2004 $1,662 $37
$123
$427
$216
$261
$382
$50
$653
$181
$246
$456
$914
$228
0.61
0.58
0.28
0.12$332
14.3% 18.1%
NA NA
1.76 23.7%
1.10
2.00
1.10
1.40
1.30
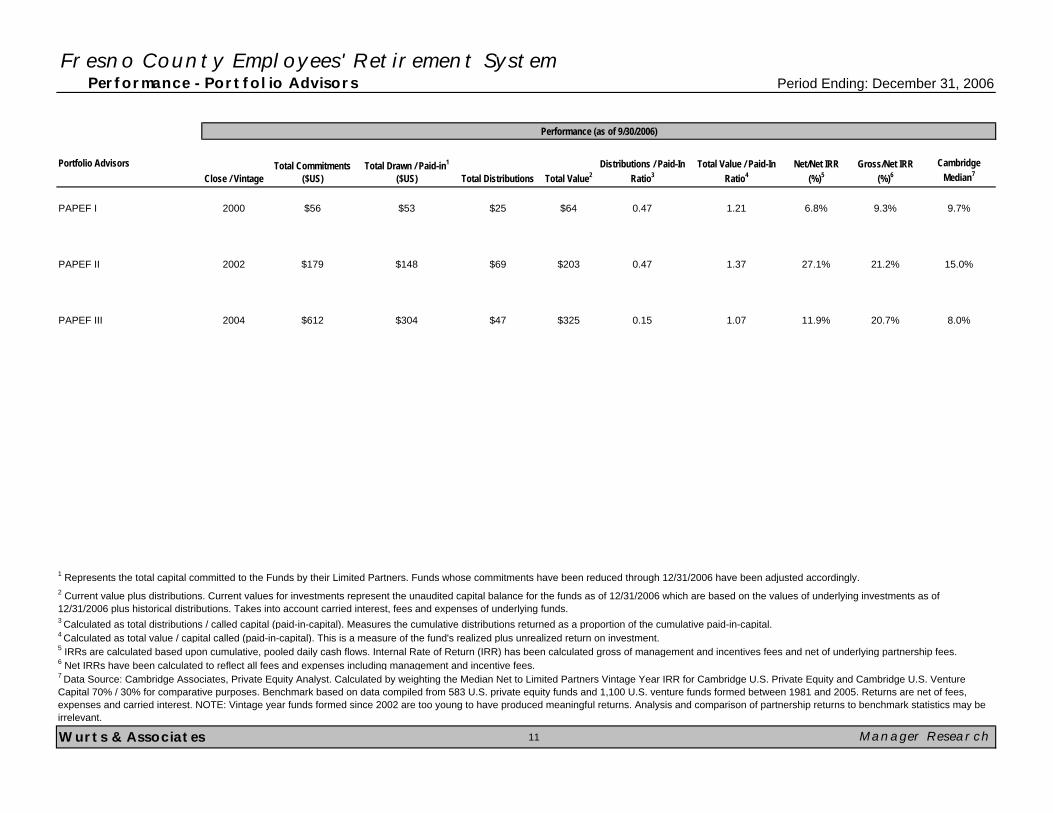
Fresno County Employees' Retirement System Performance - Portfolio Advisors Period Ending: December 31, 2006
Portfolio Advisors Cambridge Median7
PAPEF I 9.7%
PAPEF II 15.0%
PAPEF III 8.0%
Wurts & Associates 11
Performance (as of 9/30/2006)
Manager Research
1 Represents the total capital committed to the Funds by their Limited Partners. Funds whose commitments have been reduced through 12/31/2006 have been adjusted accordingly.
3 Calculated as total distributions / called capital (paid-in-capital). Measures the cumulative distributions returned as a proportion of the cumulative paid-in-capital. 4 Calculated as total value / capital called (paid-in-capital). This is a measure of the fund's realized plus unrealized return on investment.
0.47 27.1%1.37
1.07
$203
$325
21.2%
5 IRRs are calculated based upon cumulative, pooled daily cash flows. Internal Rate of Return (IRR) has been calculated gross of management and incentives fees and net of underlying partnership fees.
2 Current value plus distributions. Current values for investments represent the unaudited capital balance for the funds as of 12/31/2006 which are based on the values of underlying investments as of 12/31/2006 plus historical distributions. Takes into account carried interest, fees and expenses of underlying funds.
0.15 11.9% 20.7%
6 Net IRRs have been calculated to reflect all fees and expenses including management and incentive fees. 7 Data Source: Cambridge Associates, Private Equity Analyst. Calculated by weighting the Median Net to Limited Partners Vintage Year IRR for Cambridge U.S. Private Equity and Cambridge U.S. Venture Capital 70% / 30% for comparative purposes. Benchmark based on data compiled from 583 U.S. private equity funds and 1,100 U.S. venture funds formed between 1981 and 2005. Returns are net of fees, expenses and carried interest. NOTE: Vintage year funds formed since 2002 are too young to have produced meaningful returns. Analysis and comparison of partnership returns to benchmark statistics may be irrelevant.
$148
$304
$69
$47
2002
2004
$179
$612
$64 0.47 1.21
Total Commitments ($US)
Total Drawn / Paid-in1
($US)
2000 $56 $53 $25
Net/Net IRR (%)5
Gross/Net IRR (%)6
6.8% 9.3%
Total DistributionsClose / Vintage Total Value2Distributions / Paid-In
Ratio3Total Value / Paid-In
Ratio4
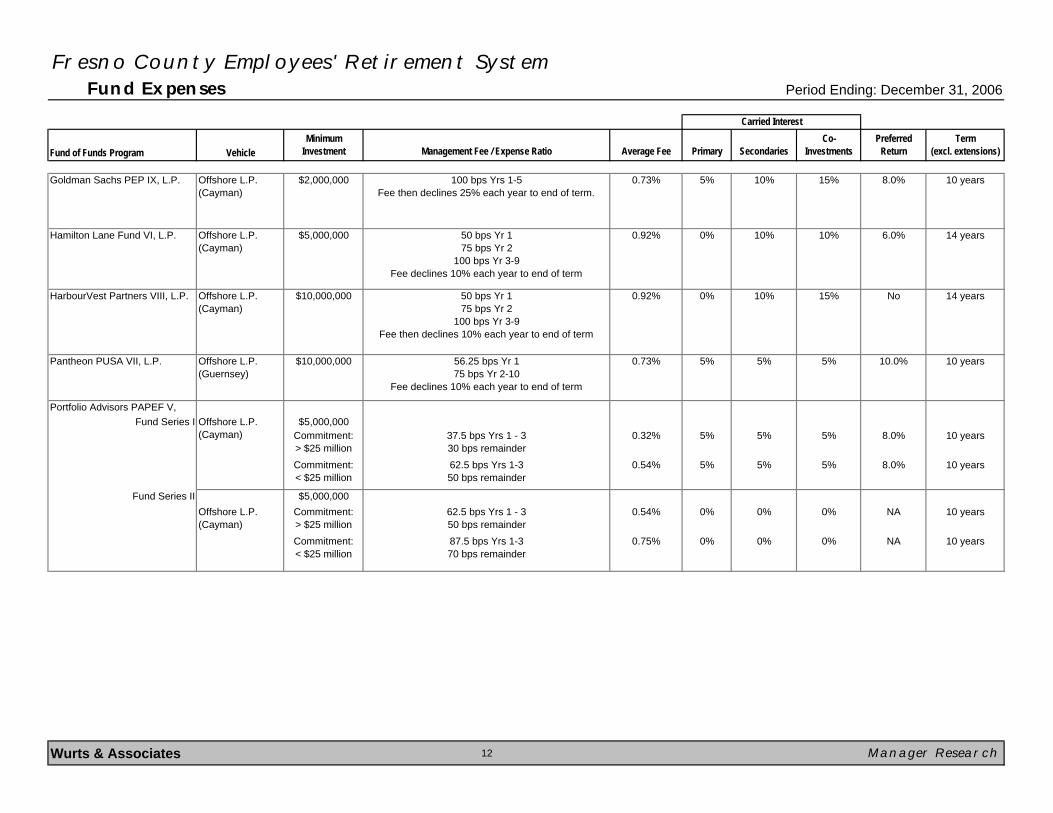
Fresno County Employees' Retirement System Fund Expenses Period Ending: December 31, 2006
Fund of Funds Program VehicleMinimum
Investment Management Fee / Expense Ratio Average Fee Primary SecondariesCo-
InvestmentsPreferred
ReturnTerm
(excl. extensions)
Goldman Sachs PEP IX, L.P. Offshore L.P. (Cayman)
$2,000,000 100 bps Yrs 1-5Fee then declines 25% each year to end of term.
0.73% 5% 10% 15% 8.0% 10 years
Hamilton Lane Fund VI, L.P. Offshore L.P. (Cayman)
$5,000,000 50 bps Yr 175 bps Yr 2
100 bps Yr 3-9Fee declines 10% each year to end of term
0.92% 0% 10% 10% 6.0% 14 years
HarbourVest Partners VIII, L.P. Offshore L.P. (Cayman)
$10,000,000 50 bps Yr 175 bps Yr 2
100 bps Yr 3-9Fee then declines 10% each year to end of term
0.92% 0% 10% 15% No 14 years
Pantheon PUSA VII, L.P. Offshore L.P. (Guernsey)
$10,000,000 56.25 bps Yr 175 bps Yr 2-10
Fee declines 10% each year to end of term
0.73% 5% 5% 5% 10.0% 10 years
Portfolio Advisors PAPEF V, Fund Series I $5,000,000
Commitment:> $25 million
37.5 bps Yrs 1 - 330 bps remainder
0.32% 5% 5% 5% 8.0% 10 years
Commitment:< $25 million
62.5 bps Yrs 1-350 bps remainder
0.54% 5% 5% 5% 8.0% 10 years
Fund Series II $5,000,000Offshore L.P. (Cayman)
Commitment:> $25 million
62.5 bps Yrs 1 - 350 bps remainder
0.54% 0% 0% 0% NA 10 years
Commitment:< $25 million
87.5 bps Yrs 1-370 bps remainder
0.75% 0% 0% 0% NA 10 years
Wurts & Associates 12 Manager Research
Carried Interest
Offshore L.P. (Cayman)
Fresno County Employees' Retirement System Product Background: Investment Strategy Period Ending: December 31, 2006
Goldman Sachs Asset Management Asset Class: Private Equity # Partnerships 18-25
GS PEP IX, L.P. Product Type: Fund-of-Funds Target Raise: $1,750 million
Final Close: 6/30/2007 GP Target Commitment (%) 5%
Investment Objective:
Portfolio Construction:
Manager Identification and Evaluation:
Wurts & Associates 13 Manager Research
Goldman's due diligence process begins by casting a very wide sourcing net. They have an "open door" policy in which they are willing to meet with any fund in the market rather than previewingoffering memoranda first and then deciding who to meet. Over the past 10 years more than 3,800 partnerships have been reviewed in which full due diligence has been completed on 500 (13% of thetotal) and have selected 148 managers (4% of original total) to be included in funds managed by PEG. Goldman also relies on the Goldman Sach Network which includes more than 20,000 employeesbased in over 40 countries which includes leveraged finance, capital markets, restructuring, investment banking, and merchant banking. PEG believes they can leverage their depth, experience,organizational brand and networks as a competitive advantage in sourcing potential investments. For example, of the 31 managers invested in PEP 2004 (Fund VII), 28 or over 90% wereoversubscribed.
PEP IX is Goldman Sachs' current globally diversified private equity fund-of-funds offering. The fund is the ninth PEP fund to be raised since the Private Equity Group's founding in 1996. The fund istargeting a total fund raise of approximately $1.25 to $1.75 billion. The fund will focus on investments in private equity by acquiring interests in partnerships focused on buyouts, venture capital, growthcapital, investments in distressed companies or investments in companies operating within particular industries. The Fund will also seek to make direct investments (co-investments) and purchasesecondary interests. Up to 75% of the portfolio will be invested in primary partnerships, up to 15% in secondary interests and a maximum of 25% in direct investments in portfolio companies.
Goldman raises funds every 12 to 18 months. From an L.P. perspective, they believe this reduces risk of exposure to any one vintage year and leads to a more predictable, smoother assent to a targetallocation to private equity versus making larger commitments every three to four years. PEP portfolios are typically diversified across 18 to 25 partnerships committed over a 12 to 18 month period andinvested over five or six years (capital is drawn down). Where possible attempts are made to equally weight commitments to funds. PEG takes a different approach to portfolio construction than manyof their peers in the industry. Portfolios are constructed from the bottom up with no pre-conceived allocations to partnerships based on region, industry, investment stage or other traditional allocationmethods. In general, they do not avoid very many areas of private equity and believe in a globally diversified portfolio. The two main areas of private equity that they have not included in their fundshistorically are real estate and mezzanine debt strategies. Across all of the group's prior PEP fund's the allocation by stage and region has been broadly diversified with 40% Buyout, 13% GrowthBuyout, 25% Industry Focused, 12% Distressed, 8% Venture Capital. 68% of investments have been North American, 28% Europe and the remainder Asia/Pacific and South America.
At least one senior member of PEG has to be involved in initial meeting (co-Head to VP). Following an initial meeting with a fund manager, the investment teams populate a one page initial meetingtemplate which provides details on the manager, describes the fund that is being raised, the size/strategy of the funds and lists the strengths and weaknesses of the fund. Each of these initial meetingforms is saved in their database system. For each fund that passes their intial meeting screen and are seen as promising candidates a deal team is formed which consists of at least two senior peopleand typically two junior people. The team schedules a one to two day due diligence visit to the general partner's office. Prior to the visit, they engage in significant prepatory work including reviewing allof the fund's documents, searching public records as well as media for relevant information, review fund portfolios and make initial reference check calls. The actual due diligence visit involves detaileddiscussions with both senior and junior members of the fund's investment team and a deal by deal, company by company examination of the fund's current and previous portfolios.
The due diligence visit is followed by numerous reference checks and follow on conference calls to discuss any other outstanding questions. The due diligence team then prepares a detailedinvestment memorandum. These memoranda generally include extensive descriptions of the proposed management company, fund strategies, transaction reviews, financials and cash flow models,lengthy discussions of investment considerations and transcripts of reference checks. The investment memoranda are presented and thoroughly reviewed by the 10 member PEG InvestmentCommittee who formally approves (or declines) all investment opportunities.
Fresno County Employees' Retirement System Product Background: Investment Strategy Period Ending: December 31, 2006
Hamilton Lane Advisors Asset Class: Private Equity # Partnerships 25-35
Hamilton Lane Private Equity Fund VI Product Type: Fund-of-Funds Target Raise: $750 million
Final Close: 2Q 2007 GP Target Commitment (%) 1%
Investment Objective:
Portfolio Construction:
Manager Identification and Evaluation:
Wurts & Associates 14 Manager Research
Upon completion of each step of the due diligence process, the fund is presented to Hamilton Lane's Investment Committee for approval or rejection before moving on to the next stage of due diligence.Hamilton Lane believes that this process provides the Investment Committee with a very broad market perspective of funds in all different strategies of the private equity market. They also believe thisprocess allows for consensus building that addresses issues or concerns that may arise from committee members as the potential investment makes its way through the process. A final approval of aninvestment requires majority approval from the Investment Committee.
At that time, if elected to move forward, a detailed questionnaire is issued to the fund manager for completion. The response to the questionnaire forms the basis of the full due diligence report. Onaverage, anywhere between 75-125 groups receive questionnaire requests. Following the review of the submitted questionnaire, a deal team conducts a day-long site visit at the fund manager's officeto go through in detail their track record, portfolio companies and investment strategy/philosophy. Site visits allow them to meet and evaluate the entire team from junior to senior investmentprofessionals. The team will typically conduct between 75-100 site visits per year. The process concludes with a final investment report that is the culmination of all preceding efforts and provides detailson the manager's performance, merits and issues as well as in-depth analysis of the portfolio. In addition to the steps outlined above, they make extensive reference calls as part of the due diligenceprocess, including calls to senior executives from current and former portfolio companies and sources not listed by the general partners. Reference calls allow them to develop an understanding of thecharacter of the individuals that comprise the general partner.
Hamilton Lane Private Equity Fund VI is a globally diversified private equity fund-of-funds. The goal of the fund is to generate top quartile risk-adjusted returns through the construction of a diversifiedportfolio of private equity assets. Hamilton Lane intends to place the fund's capital in all major sub-asset classes of private equity (buyouts, venture capital, special situations, secondaries and co-investments); across all major geographic regions including the United States, Canada, Japan, Western Europe and others; across a diversified set of fund managers to generate broad industryexposure through the underlying companies and in both partnership opportunities (primary and secondary) as well as direct transactions through co-investments.
Hamilton Lane's due diligence process is multi-tiered and places significant emphasis on those elements of risk and financial analysis that distinguish private equity from more conventional assetclasses. Their approach is designed to ensure that every important area of analysis is thoroughly reviewed. Hamilton Lane believes that with their "global footprint", size, scale, reputation and prominentclient base, they are positioned as a "first call" among fund managers seeking to raise capital regardless of size, focus or geography. There are five basic steps to Hamilton Lane's due diligenceprocess. The first step is inital screening of PPM's and manager data. On an annual basis, the team typically reviews between 350-550 offerings. In 2005, the group reviewed nearly 500 fund managers.Following initial screens, they meet with the fund manager in one of their offices allowing members of their investment team to ask questions directly regarding the group's nvestment philosophy,process and view of the market opportunity. They typically perform 175-250 meetings every year. Thorough due diligence notes are taken and then presented to the Investment Committee for fullreview.
Hamilton Lane expects to invest Fund VI across 25-35 underlying fund managers and gain additional diversification through secondary transactions and co-investments. The fund has a commitmentperiod of four years to allow flexibility in deploying committed assets to partnerships and expects an investment period of roughly five years. In terms of portfolio construction by stage, Hamilton expectsto allocate approximately 30% to large buyouts, 15% mid-market buyouts, 20% small buyout, 25% special situations and 10% venture capital. Special situations includes specialty, multi-stage,mezzanine and distressed debt. It is expected that 75% of assets will be invested in primary investments, 15% in direct/co-investments and 10% secondary investments. The fund will be diversifiedacross region with 75% expected to be allocated to United States partnerships and portfolio companies, 15% to Western Europe, and 10% to the rest of the world (includes Eastern Europe, Australiaand Asia).
Fresno County Employees' Retirement System Product Background: Investment Strategy Period Ending: December 31, 2006
HarbourVest Partners, LLC Asset Class: Private Equity # Partnerships 65-90
HarbourVest Partners VIII Product Type: Fund-of-Funds Target Raise: $4,900 million
Final Close: 2Q 2007 GP Target Commitment (%) 1%Investment Objective:
Portfolio Construction:
Manager Identification and Evaluation:
Wurts & Associates 15 Manager Research
HarbourVest's investment team as a whole is responsible for all due diligence, investment decisions and client service. Within the team, associates and senior associates typically focus on detailed analysisand industry research as part of the due diligence process while vice presidents, principals and managing directors dedicate a majority of their time to deal sourcing and monitoring, portfolio construction andinvestor relations. The Managing Directors make final decisions on a consensus basis with every office and every individual participating in all decisions. The Managing Directors are asked to vote on eachdeal and team decision.
The decision to make an investment (direct company, partnership or secondary) requires the consent of a group of HarbourVest investment professionals in at least four different meetings. Every Monday, allof the senior investment professionals attend their staff meeting. In addition, each specific investment group (direct team, partnership team, secondary team) meets on a weekly basis. Prior to any approval,all investment opportunities undergo the following: 1) The opportunity is vetted with the specific team meeting; 2) If approved at the team meeting, the opportunity is then brought to the weekly staff meetingseveral different times for initial review, additional review and a final decision. The initial review occurs after the deal has been initially vetted at the indiviudal team meeting. The purpose of the initial review isto introduce the opportunity to HarbourVest's senior investment staff. At this meeting the deal team circulates a thorough internal memorandum describing the opportunity to the investment professionals. Adecision is made to either decline the investment or to begin extensive due diligence.
HarbourVest Partners VIII investment program is a broadly diversified private equity fund-of-funds program. Fund VIII is structured as three separate limited partnership vehicles: HarbourVest Partners VIII-Venture Fund L.P., HarbourVest VIII-Buyout Fund L.P., HarbourVest Partners VIII-Mezzanine and Distressed Debt Fund L.P. In addition, for investors interested in a non-U.S. component to their privateequity program, HarbourVest is in the process of forming HIPEP V-2007 European Buyout Companion Fund. HIPEP is a companion fund to HarbourVest International Private Equity Partners V-PartnershipFund, L.P. which held its final close in December 2006. HarbourVest anticipates raising its next full non-U.S. investment program in late 2008.
HarbourVest strives to ensure that all of the major industry segments of private equity and venture capital are represented in the portfolio. They will invest in managers throughout the private equity spectrumfor diversification. These include small, medium and large buyout partnerships, venture fund managers that specialize in seed and early stage investing as well as those that focus in the later stage area.They anticipate and expect to reinvest with approximately 70-80% of fund managers over time. In addition, they maintain an open door policy to meet with all qualified private equity fund managers in order toensure they establish relationships early in an investment team's life and to track the team as it develops into the caliber of investment organization in which HarbourVest could one day invest.
HarbourVest Partners VIII investment program consists of three separate limited partnership vehicles (buyout, venture, mezzanine & distressed). Given capacity constraints, new investors will only be able toallocate a maximum of 15% to the venture capital fund. The Venture Capital Fund seeks to build a portfolio that consists principally of primary and secondary investments in U.S.-based venture capital funds.The goal is diversify the portfolio across companies that focus on high growth industries such as information technology, software, internet, communications, life sciences, medical devices and healthcareservices. The Venture Fund is expected to make investments in companies over three to five years for time diversification. Up to 35% of the Venture Fund may be invested in purchases of secondarypositions in existing venture capital and other private equity partnerships and portfolios. Up to 10% of the Venture Fund may be invested directly in operating companies. These investments are expected toinclude primarily growth equity transactions. In combination, a maximum of 35% can be allocated to secondary and direct investments in the fund. Investments of 30 to 40 partnerships with averagecommitments of $30 to $40 million per manager.
The Buyout fund seeks investments in U.S.-based buyout, recapitalization and other private equity funds and to a lesser extent, direct investments in operating companies. The goal is to build a portfolio diversified across partnerships and companies that focus on mature, cash flow positive sectors such as industrial products, consumer products, services, media and entertainment, and retail as well as growth industries such as communications, information technology and healthcare. It is expected that commitments to individual partnerships will be made over a three to five year period. Up to 35% may be invested in purchases of secondary positions and up to 10% may be invested directly in operating companies. The combination of secondaries and direct investments cannot exceed 35% of the fund. The fund is expected to invest in 25 to 35 partnerships with an average commitment of $50 million per manager.
The Mezzanine and Distressed Debt fund seeks to build a portfolio of primary and secondary investments in mezzanine debt, distressed debt, turnarounds, venture debt and other debt related private equity funds as well as direct mezzanine investments in operating companies. Up to 35% of the portfolio can be invested in a combination of secondary and direct investments. The fund is expected to invest in 10 to 15 partnerships in the U.S. and Europe with an average of $20 million per manager.
Fresno County Employees' Retirement System Product Background: Investment Strategy Period Ending: December 31, 2006
Pantheon Ventures Asset Class: Private Equity # Parternships 50-60
Pantheon USA Fund VII Product Type: Fund-of-Funds Target Raise: $1,500 million
Final Close: 6/30/2007 GP Target Commitment (%) 10%
Investment Objective:
Portfolio Construction:
Manager Identification and Evaluation:
Wurts & Associates 16 Manager Research
During the due diligence process Pantheon looks for experienced teams composed of outstanding general partners with proprietary knowledge and deal flow, a well defined and realistic investmentstrategy as well as a decision-making process that is compatible with the background of the general partners. They also look for firms with a strong balance of operating, financial, and marketingskills who have operated successfully as a team ideally for several years. They will consider new funds or spin-offs where the general partners are experienced. They target firms who generateproprietary, high quality deal flow and who originate as well as lead a high proportion of their investments. They prefer partners responsible for no more than five to eight portfolio investments eachdepending on stage. They also key into the compensation structure of key professionals and look for firms that have employees motivated by carried interest rather than fee income. There must alsobe a rationale split of the carried interest between the general partners. When gathering information, Pantheon does not rely on questionnaires; rather, they prefer to derive unique insights throughface-to-face meetings and proprietary research.
The primary team monitors the due diligence process and decides at each successive stage whether to continue. When the due diligence is complete, the Regional Investment Committee mustreach full consensus to approve an investment. The matter is then referred to the IMC for final review. More than 50% of the IMC must agree before an investment is approved. The legal aspects ofall opportunities are reviewed in parallel with investment due diligence, allowing them to identify any potential issues early in the process.
Pantheon's USA Fund VII is a diversified fund-of-funds focused on partnership investments (primarily North America) across buyouts, venture capital and special situations. The fund is allowed up to20% in secondary interests. Dedicated international exposure can be achieved through Pantheon's Europe fund-of-funds which invests roughly 80-85% in European buyouts, 10-15% in Europeanventure capital and the remainder in special situations.
Pantheon adopts a quantitative and qualitative approach to investment selection, which includes bottom-up and top-down approaches to investment evaluation and due diligence. Pantheon'sselection process takes into account the changing landscape of the global private equity marketplace as well as individual fund characteristics to evaluate whether opportunities combine asustainable strategy with the potential to deliver superior returns. Pantheon's top-down allocations reflect their strategy of creating portfolios diversified by fund stage, manager, vintage year, industrysector and geographic region. The firm has a concensus-based 6-stage process for manager selection, review and recommendation. During the first stage all potential opportunities are assessed bya local investment professional whether in offices in the U.S. or in the U.K. for example. Opportunities are then reviewed by Pantheon's regional teams who meet every week. Many proposals arerejected by the regional teams at this stage. If a positive concensus is achieved, the Firm's Investment Management Committee (IMC) is given an early opportunity to review and provide feedback onthe investment via an "advanced notice".
Pantheon expects to invest in approximately 50 to 60 partnerships. Investor capital is typically committed to funds over a three to five year period and underlying managers invest capital over a threeto six year investment period. In addition, Pantheon diversifies investments into prior vintage years with the purchase of selected secondary interests. Pantheon diversifies its portfolios by stageincluding early to late stage venture capital; leveraged buyouts and growth capital; and special situations (including energy funds, turnaround and mezzanine funds). The expected target allocationsrange between 25-35% venture capital, 55-65% buyouts, 0-10% special situations. The fund can also invest up to 20% in secondaries subject to availability.
Fresno County Employees' Retirement System Product Background: Investment Strategy Period Ending: December 31, 2006
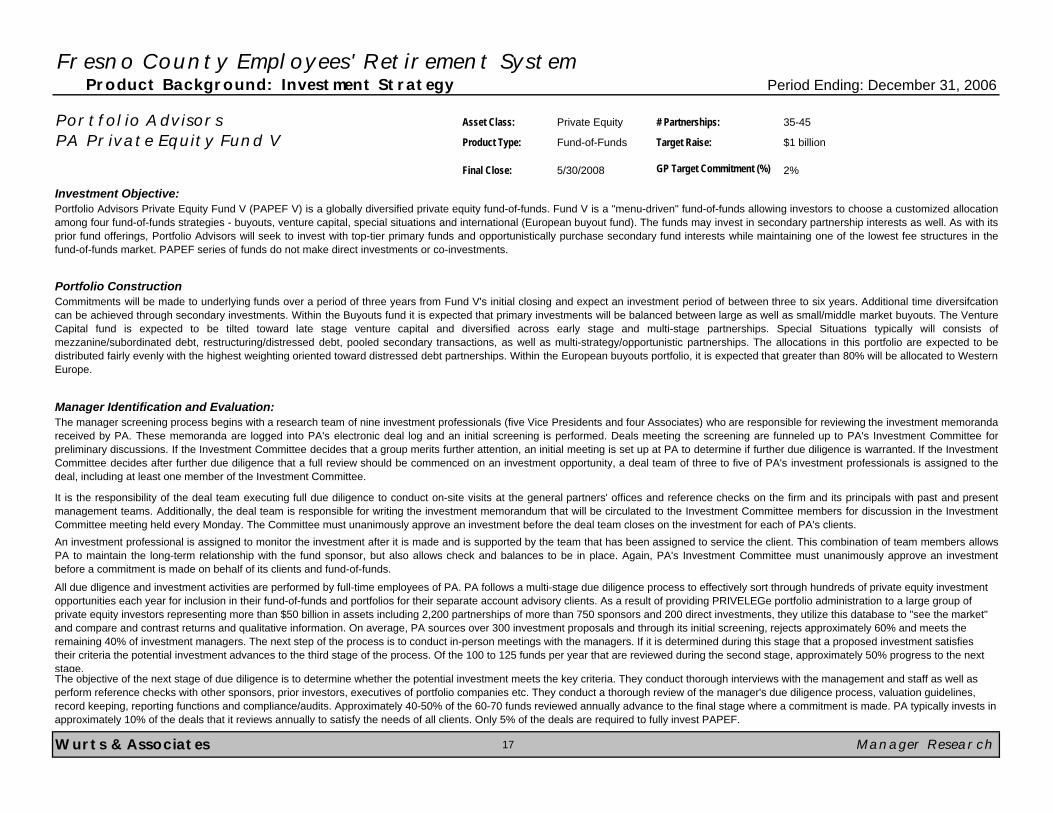
Portfolio Advisors Asset Class: Private Equity # Partnerships: 35-45
PA Private Equity Fund V Product Type: Fund-of-Funds Target Raise: $1 billion
Final Close: 5/30/2008 GP Target Commitment (%) 2%
Investment Objective:
Portfolio Construction
Manager Identification and Evaluation:
Wurts & Associates 17 Manager Research
An investment professional is assigned to monitor the investment after it is made and is supported by the team that has been assigned to service the client. This combination of team members allowsPA to maintain the long-term relationship with the fund sponsor, but also allows check and balances to be in place. Again, PA's Investment Committee must unanimously approve an investmentbefore a commitment is made on behalf of its clients and fund-of-funds.
All due dligence and investment activities are performed by full-time employees of PA. PA follows a multi-stage due diligence process to effectively sort through hundreds of private equity investment opportunities each year for inclusion in their fund-of-funds and portfolios for their separate account advisory clients. As a result of providing PRIVELEGe portfolio administration to a large group of private equity investors representing more than $50 billion in assets including 2,200 partnerships of more than 750 sponsors and 200 direct investments, they utilize this database to "see the market" and compare and contrast returns and qualitative information. On average, PA sources over 300 investment proposals and through its initial screening, rejects approximately 60% and meets the remaining 40% of investment managers. The next step of the process is to conduct in-person meetings with the managers. If it is determined during this stage that a proposed investment satisfies their criteria the potential investment advances to the third stage of the process. Of the 100 to 125 funds per year that are reviewed during the second stage, approximately 50% progress to the next stage.The objective of the next stage of due diligence is to determine whether the potential investment meets the key criteria. They conduct thorough interviews with the management and staff as well as perform reference checks with other sponsors, prior investors, executives of portfolio companies etc. They conduct a thorough review of the manager's due diligence process, valuation guidelines, record keeping, reporting functions and compliance/audits. Approximately 40-50% of the 60-70 funds reviewed annually advance to the final stage where a commitment is made. PA typically invests in approximately 10% of the deals that it reviews annually to satisfy the needs of all clients. Only 5% of the deals are required to fully invest PAPEF.
It is the responsibility of the deal team executing full due diligence to conduct on-site visits at the general partners' offices and reference checks on the firm and its principals with past and presentmanagement teams. Additionally, the deal team is responsible for writing the investment memorandum that will be circulated to the Investment Committee members for discussion in the InvestmentCommittee meeting held every Monday. The Committee must unanimously approve an investment before the deal team closes on the investment for each of PA's clients.
Portfolio Advisors Private Equity Fund V (PAPEF V) is a globally diversified private equity fund-of-funds. Fund V is a "menu-driven" fund-of-funds allowing investors to choose a customized allocationamong four fund-of-funds strategies - buyouts, venture capital, special situations and international (European buyout fund). The funds may invest in secondary partnership interests as well. As with itsprior fund offerings, Portfolio Advisors will seek to invest with top-tier primary funds and opportunistically purchase secondary fund interests while maintaining one of the lowest fee structures in thefund-of-funds market. PAPEF series of funds do not make direct investments or co-investments.
The manager screening process begins with a research team of nine investment professionals (five Vice Presidents and four Associates) who are responsible for reviewing the investment memorandareceived by PA. These memoranda are logged into PA's electronic deal log and an initial screening is performed. Deals meeting the screening are funneled up to PA's Investment Committee forpreliminary discussions. If the Investment Committee decides that a group merits further attention, an initial meeting is set up at PA to determine if further due diligence is warranted. If the InvestmentCommittee decides after further due diligence that a full review should be commenced on an investment opportunity, a deal team of three to five of PA's investment professionals is assigned to thedeal, including at least one member of the Investment Committee.
Commitments will be made to underlying funds over a period of three years from Fund V's initial closing and expect an investment period of between three to six years. Additional time diversifcationcan be achieved through secondary investments. Within the Buyouts fund it is expected that primary investments will be balanced between large as well as small/middle market buyouts. The VentureCapital fund is expected to be tilted toward late stage venture capital and diversified across early stage and multi-stage partnerships. Special Situations typically will consists ofmezzanine/subordinated debt, restructuring/distressed debt, pooled secondary transactions, as well as multi-strategy/opportunistic partnerships. The allocations in this portfolio are expected to bedistributed fairly evenly with the highest weighting oriented toward distressed debt partnerships. Within the European buyouts portfolio, it is expected that greater than 80% will be allocated to WesternEurope.
Fresno County Employees' Retirement System Key Personnel - Goldman Sachs Period Ending: December 31, 2006
Team Overview
Senior Investment Professionals Role / Title Education Yrs Experience at Firm Yrs PE Experience Yrs Investment
Experience
Mike Miele Managing Director,Co-Head of PEG MBA, Harvard 18 15 18
Charles Baillie Managing Director,Co-Head of PEG MBA, Harvard 14 9 14
Christopher Kojima Managing Director,Co-Head of PEG JD, Harvard 12 9 12
Marc Boheim Managing Director MBA, University of Chicago 13 7 13
Michael Brandmeyer Managing Director MBA, Columbia University 12 6 15
Harold Hope III Managing Director JD, Harvard 8 7 10
Tuan Lam Managing Director MBA, Harvard 8 8 14
Kiele Neas Managing Director MBA, Harvard 13 7 13
Kane Brenan Vice President JD, Georgetown University 9 6 11
Upacala Mapatuna Vice President BA, Williams College 4 6 11
Average 11 8 13
Wurts & Associates 18 Manager Research
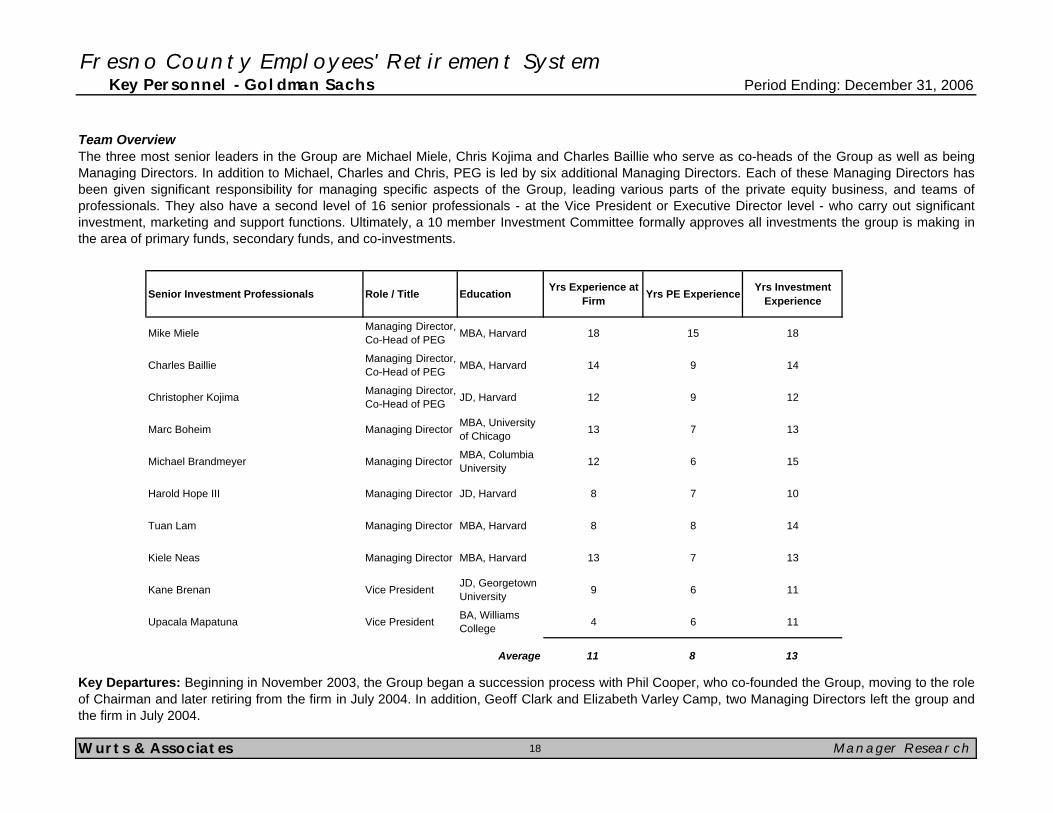
The three most senior leaders in the Group are Michael Miele, Chris Kojima and Charles Baillie who serve as co-heads of the Group as well as beingManaging Directors. In addition to Michael, Charles and Chris, PEG is led by six additional Managing Directors. Each of these Managing Directors hasbeen given significant responsibility for managing specific aspects of the Group, leading various parts of the private equity business, and teams ofprofessionals. They also have a second level of 16 senior professionals - at the Vice President or Executive Director level - who carry out significantinvestment, marketing and support functions. Ultimately, a 10 member Investment Committee formally approves all investments the group is making inthe area of primary funds, secondary funds, and co-investments.
Key Departures: Beginning in November 2003, the Group began a succession process with Phil Cooper, who co-founded the Group, moving to the roleof Chairman and later retiring from the firm in July 2004. In addition, Geoff Clark and Elizabeth Varley Camp, two Managing Directors left the group andthe firm in July 2004.
Fresno County Employees' Retirement System Key Personnel - Hamilton Lane Advisors Period Ending: December 31, 2006
Team Overview
Senior Investment Professionals Role / Title Education Yrs Experience at Firm Yrs PE Experience Yrs Investment
Experience
Mario Giannini CEO JD, Boston College 13 20 27
Hatley Rogers Chairman MBA, Harvard 3 22 25
Erik Hirsch CIO BA, University of Virginia 7 9 9
Paul Yett Managing Director BS, San Diego State University 7 10 12
Duke DeGrassi Managing Director BBA, University of Texas 7 32 37
Mike Kelly Managing Director MBA, College of William & Mary 12 12 16
Andrea Kramer Vice President MBA, Temple University 2 16 16
David Helgerson Vice President MBA, Duke University 3 7 10
Jaun Delgado-Moreira, CFA Vice PresidentPh.D. Universidad Complutense de Madrid
2 5 5
Average 6 15 17
Wurts & Associates 19 Manager Research
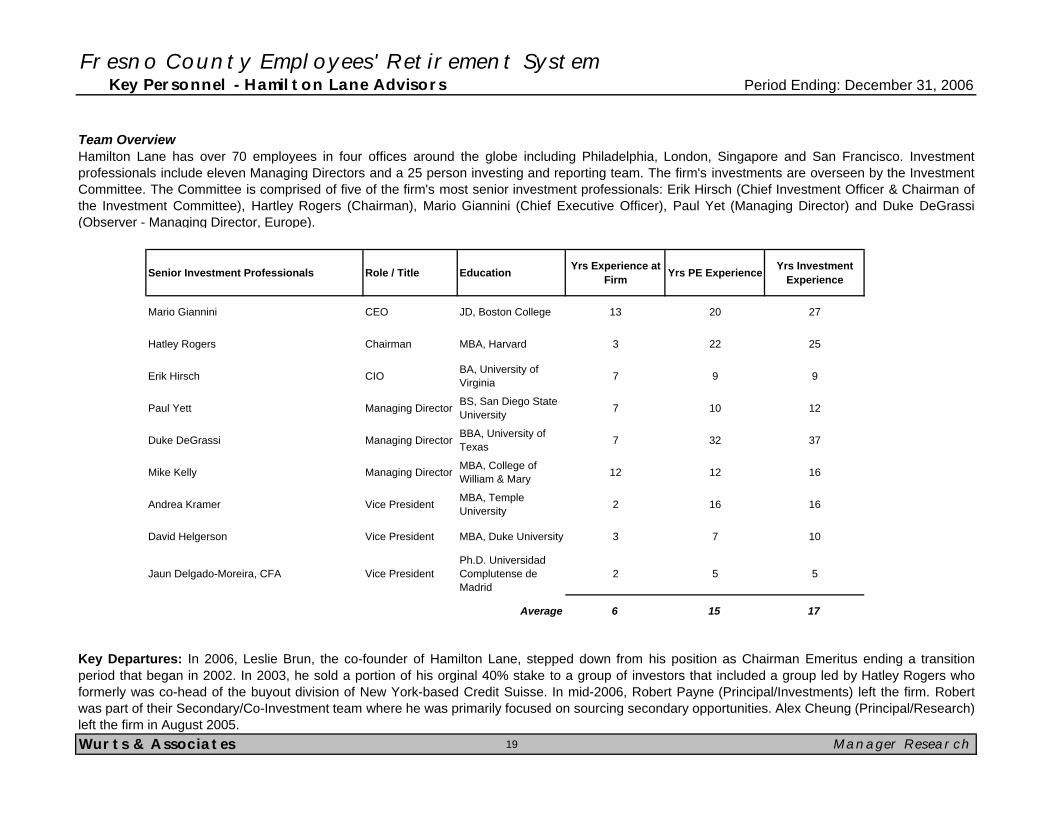
Hamilton Lane has over 70 employees in four offices around the globe including Philadelphia, London, Singapore and San Francisco. Investmentprofessionals include eleven Managing Directors and a 25 person investing and reporting team. The firm's investments are overseen by the InvestmentCommittee. The Committee is comprised of five of the firm's most senior investment professionals: Erik Hirsch (Chief Investment Officer & Chairman ofthe Investment Committee), Hartley Rogers (Chairman), Mario Giannini (Chief Executive Officer), Paul Yet (Managing Director) and Duke DeGrassi(Observer - Managing Director, Europe).
Key Departures: In 2006, Leslie Brun, the co-founder of Hamilton Lane, stepped down from his position as Chairman Emeritus ending a transitionperiod that began in 2002. In 2003, he sold a portion of his orginal 40% stake to a group of investors that included a group led by Hatley Rogers whoformerly was co-head of the buyout division of New York-based Credit Suisse. In mid-2006, Robert Payne (Principal/Investments) left the firm. Robertwas part of their Secondary/Co-Investment team where he was primarily focused on sourcing secondary opportunities. Alex Cheung (Principal/Research)left the firm in August 2005.
Fresno County Employees' Retirement System Key Personnel - HarbourVest Partners Period Ending: December 31, 2006
Team Overview
Senior Investment Professionals Role / Title Education Yrs Experience at Firm* Yrs PE Experience Yrs Investment
Experience
Edward Kane Senior Managing Director MBA, Harvard 24 30 32
Brooks Zug, CFA Senior Managing Director MBA, Harvard 24 31 32
Kevin Delbridge, CFA Senior Managing Director MBA, University of Massachusetts 19 20 27
George Anson Managing Director BA, University of Iowa 17 24 24
Kathleen Bacon Managing Director MBA, Dartmouth 13 14 18
John Begg Managing Director MBA, Harvard 14 14 21
Philip Bilden Managing Director MBA, Harvard 15 18 18
William Johnston Managing Director MBA, Syracuse 23 23 28
Frederick Maynard Managing Director MBA, Dartmouth 21 21 24
Hemal Mirani Managing Director MBA, Wharton 10 14 14
John Morris Managing Director MBA, Columbia 11 18 18
Ofer Nemirovsky Managing Director MBA, Harvard 20 20 25
Gregory Stento Managing Director MBA, Harvard 7 17 23
Michael Taylor Managing Director MBA, Wharton 8 12 15
Robert Wadsworth Managing Director MBA, Harvard 21 21 25
Peter Wilson Managing Director MBA, Harvard 11 14 16
Average 16 19 23
* May include predecessor firm Hancock Venture Partners.
Wurts & Associates 20 Manager Research
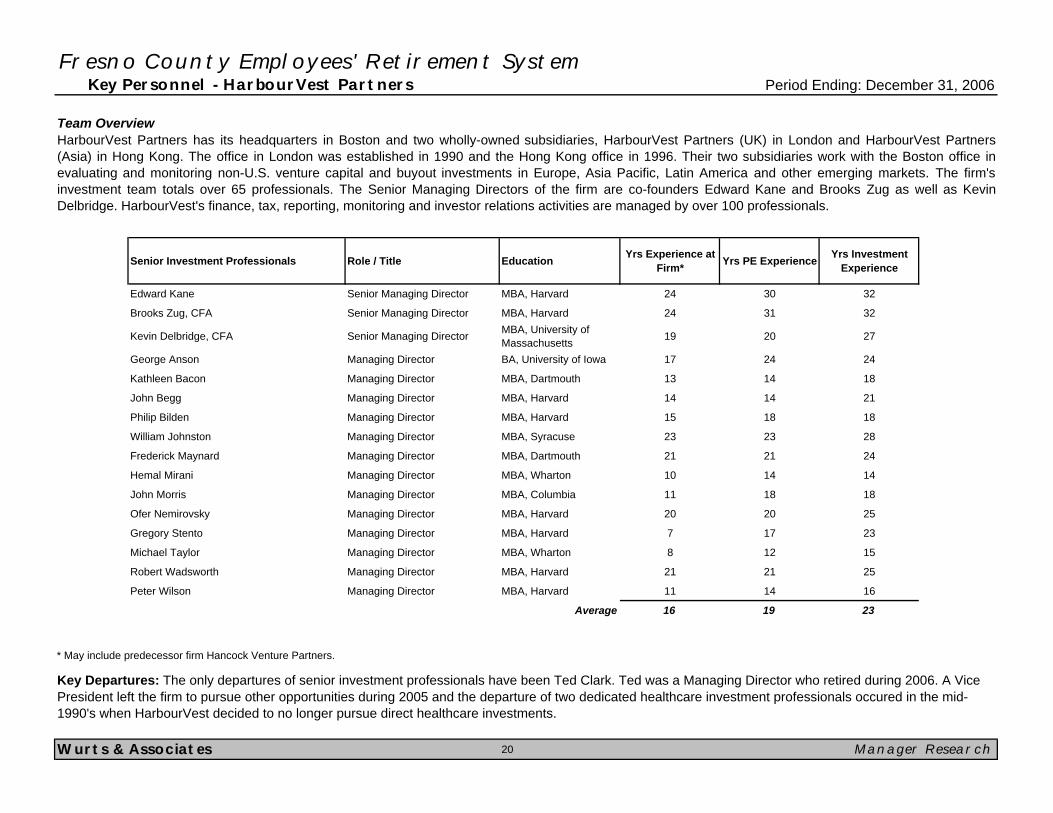
Key Departures: The only departures of senior investment professionals have been Ted Clark. Ted was a Managing Director who retired during 2006. A Vice President left the firm to pursue other opportunities during 2005 and the departure of two dedicated healthcare investment professionals occured in the mid-1990's when HarbourVest decided to no longer pursue direct healthcare investments.
HarbourVest Partners has its headquarters in Boston and two wholly-owned subsidiaries, HarbourVest Partners (UK) in London and HarbourVest Partners(Asia) in Hong Kong. The office in London was established in 1990 and the Hong Kong office in 1996. Their two subsidiaries work with the Boston office inevaluating and monitoring non-U.S. venture capital and buyout investments in Europe, Asia Pacific, Latin America and other emerging markets. The firm'sinvestment team totals over 65 professionals. The Senior Managing Directors of the firm are co-founders Edward Kane and Brooks Zug as well as KevinDelbridge. HarbourVest's finance, tax, reporting, monitoring and investor relations activities are managed by over 100 professionals.
Fresno County Employees' Retirement System Key Personnel - Pantheon Ventures Period Ending: December 31, 2006
Team Overview
Senior Investment Professionals Role / Title Education Yrs Experience at Firm Yrs PE Experience Yrs Investment
Experience
David Braman, CFA Senior Partner MBA, University of Denver 20 22 22
Jay Pierrepont Managing Partner MM, Northwestern 21 21 24
Gary Hiatt, CFA Managing Partner BS, University of North Carolina 10 19 19
Ian Deas Partner BC, University of Natal 16 16 20
Susan McAndrews Partner MA, Stanford 4 11 14
Roar Storebaug Vice President MBA, Cal State 7 16 16
Jeffrey Reed Vice President MBA, Clark University 7 9 12
Hallie Kim Vice President MBA, Columbia 3 5 5
Brian Buenneke Vice President MBA, Northwestern 2 9 9
Brett Johnson Vice President MBA, University of Chicago 1 6 6
Average 9 13 15
Wurts & Associates 21 Manager Research
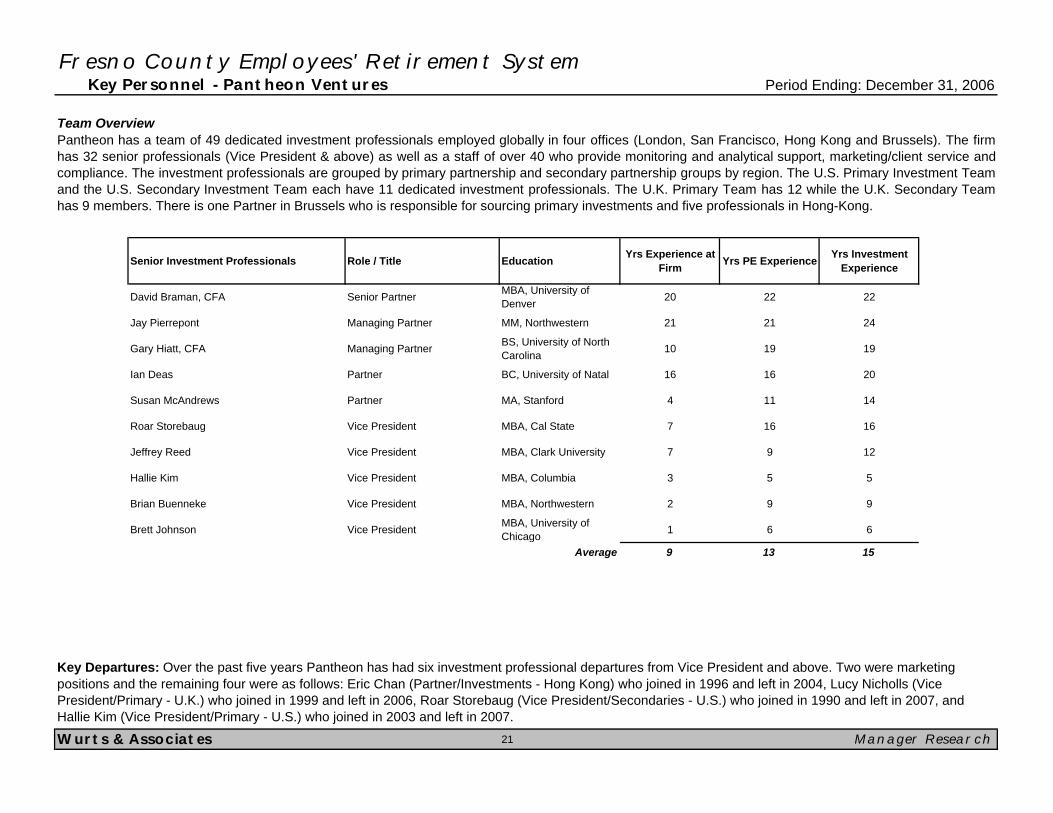
Pantheon has a team of 49 dedicated investment professionals employed globally in four offices (London, San Francisco, Hong Kong and Brussels). The firmhas 32 senior professionals (Vice President & above) as well as a staff of over 40 who provide monitoring and analytical support, marketing/client service andcompliance. The investment professionals are grouped by primary partnership and secondary partnership groups by region. The U.S. Primary Investment Teamand the U.S. Secondary Investment Team each have 11 dedicated investment professionals. The U.K. Primary Team has 12 while the U.K. Secondary Teamhas 9 members. There is one Partner in Brussels who is responsible for sourcing primary investments and five professionals in Hong-Kong.
Key Departures: Over the past five years Pantheon has had six investment professional departures from Vice President and above. Two were marketing positions and the remaining four were as follows: Eric Chan (Partner/Investments - Hong Kong) who joined in 1996 and left in 2004, Lucy Nicholls (Vice President/Primary - U.K.) who joined in 1999 and left in 2006, Roar Storebaug (Vice President/Secondaries - U.S.) who joined in 1990 and left in 2007, and Hallie Kim (Vice President/Primary - U.S.) who joined in 2003 and left in 2007.
Fresno County Employees' Retirement System Key Personnel - Portfolio Advisors Period Ending: December 31, 2006
Team Overview
Senior Investment Professionals Role / Title Education Yrs Experience at Firm Yrs PE Experience Yrs Investment
Experience
Paul Crotty Managing Director MBA, Wharton 9 32 32
William Indelicato Managing Director MBA, University of Connecticut 11 13 13
Brian Murphy, CFA Managing Director MBA, Columbia 10 18 18
Donna Smolens Managing Director MA, Fordham 3 19 19
William Walsh Managing Director BS, Siena College 4 21 22
Harry Pierandri Managing Director MBA, University of Connecticut 1 34 34
Todd Hughes, CFA Senior Vice President MBA, Columbia 10 12 12
Hugh Perloff, CPA Senior Vice President MBA, University of Connecticut 8 8 13
Chris Ruder Senior Vice President MBA, St. Louis University 1 12 12
Ken Wisdom Senior Vice President MBA, Dartmouth 4 13 15
Nicolas von der Schulenburg Senior Vice President MBA, Yale 1 7 9
Ken Jarvis Vice President MBA, University of Connecticut 9 9 14
Average 6 17 18
Wurts & Associates 22 Manager Research
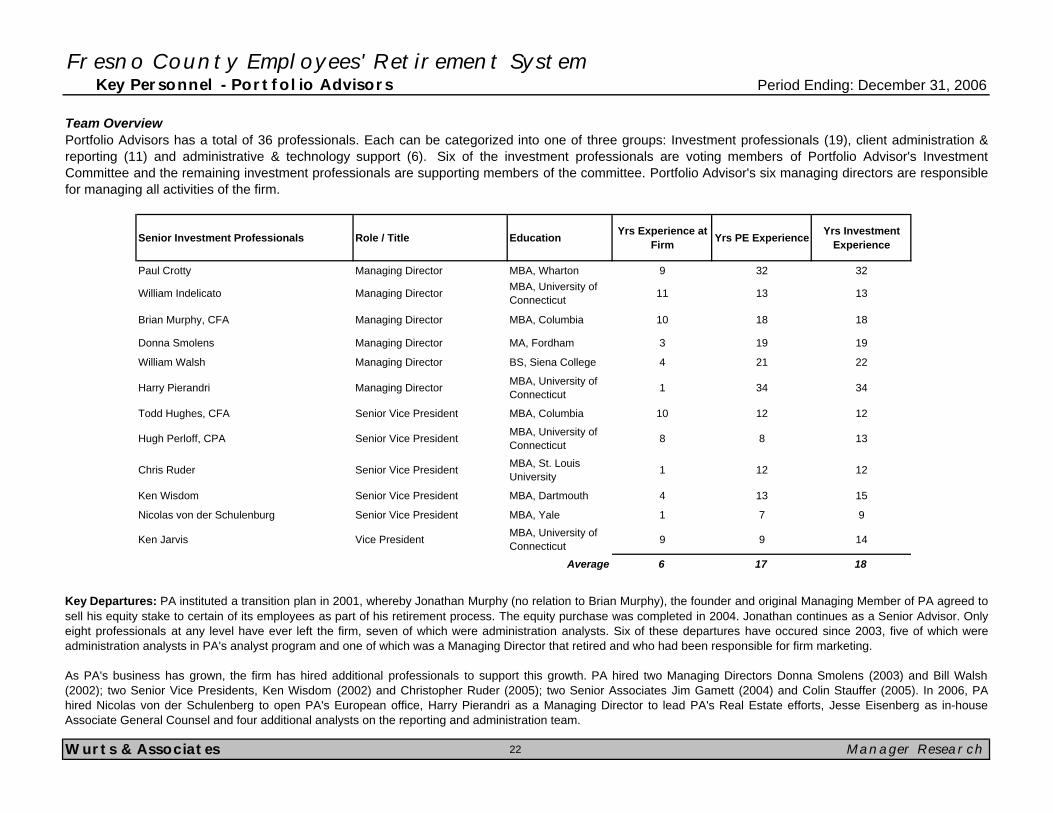
Portfolio Advisors has a total of 36 professionals. Each can be categorized into one of three groups: Investment professionals (19), client administration &reporting (11) and administrative & technology support (6). Six of the investment professionals are voting members of Portfolio Advisor's InvestmentCommittee and the remaining investment professionals are supporting members of the committee. Portfolio Advisor's six managing directors are responsiblefor managing all activities of the firm.
Key Departures: PA instituted a transition plan in 2001, whereby Jonathan Murphy (no relation to Brian Murphy), the founder and original Managing Member of PA agreed tosell his equity stake to certain of its employees as part of his retirement process. The equity purchase was completed in 2004. Jonathan continues as a Senior Advisor. Onlyeight professionals at any level have ever left the firm, seven of which were administration analysts. Six of these departures have occured since 2003, five of which wereadministration analysts in PA's analyst program and one of which was a Managing Director that retired and who had been responsible for firm marketing.
As PA's business has grown, the firm has hired additional professionals to support this growth. PA hired two Managing Directors Donna Smolens (2003) and Bill Walsh(2002); two Senior Vice Presidents, Ken Wisdom (2002) and Christopher Ruder (2005); two Senior Associates Jim Gamett (2004) and Colin Stauffer (2005). In 2006, PAhired Nicolas von der Schulenberg to open PA's European office, Harry Pierandri as a Managing Director to lead PA's Real Estate efforts, Jesse Eisenberg as in-houseAssociate General Counsel and four additional analysts on the reporting and administration team.