Embed Size (px)
Citation preview
ELK Asia Pacific Journals – 978-93-85537-06-6 ARIMPIE -2017
FRICTION AND WEAR CHARACTERISTICS OF EN-31 HIGH CARBON STEEL PLATES UNDER DRY AND LUBRICATED
CONDITION Naveen Kumar*, Kushal Pal Singh*, Rathin Dutta*, Krishnamurti Singh
*Assistant Professor, Department of Mechanical Engineering,, ITS Engineering College, Greater Noida, India-201308
Corresponding Author: Naveen Kumar, [email protected] Abstract- This paper deals with, micro-surface texturing and analyses have indicated that surface textures may significantly affect the tribological performance of contact interfaces. Electric discharge machining (EDM), which is an unconventional manufacturing technology, was proposed to fabricate micro-dimple arrays on EN-31 high carbon steel plate. An experimental setup based on a parallel plate was established to investigate the, friction and wear between two parallel plates. Using DUCOM reciprocating friction monitor, the friction coefficient and wear on untextured and textured parallel plates with 5% and 8% texture density are determined, experiments were conducted under different normal loads and sliding speeds to investigate friction and wear behaviours of untextured and textured samples in lubricated and dry condition. The results indicate that texture density and presence of lubricant have obvious influences on friction and wear of contacting surfaces and results also indicated that an optimum texture density might exist at which surface shows the best friction and wear behaviour. Key Words: Surface texture, texture density, Normal load, Sliding speed, Friction and wear.
1. INTRODUCTION
Friction is involved in thousands of applications in our daily lives. In some applications high friction is desirable, as in vehicles' tires on the roadways, brakes, clutches, and frictional power transmission systems. In other applications, friction reduction is a constant demand which reflects on energy efficiency, component durability, and system reliability. For example, the energy loss due to friction in automobiles is estimated to be 40% of the total energy generated by the internal combustion engine [1]. In all cases, understanding the mechanisms involved in friction and the means to control it are necessary. Various approaches have been employed in order to control friction, some of which are lubrication, coating, and surface modification such as texturing, which is the focus of this study.
Lubrication, whether hydrodynamic, boundary, or mixed
is one solution to control friction, however, lubrication in some operating conditions is not applicable. Such conditions are observed in micro-electrical mechanical systems. Therefore, researchers have been searching for a more reliable approach that can control friction in all operating conditions. Three decades ago [2], attention was drawn to surface patterning, or surface texturing, as an effective means to improve the tribological performance.
Various machining methods have been employed to create micro-texturing on the surface of different materials. Schneider [3] developed the vibro-rolling method to create shallow channels using a hard indenter that vibrates as it translates across the workpiece. Suh et al. [4] used chemical etching and abrasive machining to create modulated or undulated patterns that act as traps for oxide wear debris, and Willis [5] used honing to generate micro-grooves for the cylinder bores of internal combustion engines. The micro-grooves improve the lubrication between the cylinder walls and the piston ring.
Reactive ion etching (RIE) was used by Wang et al. [6-9] to explore the influence of micro-dimples on the silicon carbide surface sliding in water. Large circular dimples and small square depressions are fabricated using Reactive Ion Etching, where high energy chemical plasma is directed at the part causing surface material removal.
Meng et al. [10] presented a paper which include study on the effect of dimples on friction of parallel surfaces under different sliding conditions. In this paper they have discussed about the influence of rectangular dimple with the flat bottom on the friction of parallel surfaces at different sliding condition.
Micro-dimple array is a typical kind of texture and plays an important part in improving tribological performance. In starved lubrication, dimples act as reservoirs of lubricant, which supply back-up lubricant when lubricant film is broken down [11]. In hydrodynamic lubrication, dimples are utilized as micro-hydrodynamic bearings to help improve load carrying capacity of the lubricant film [36]. Dimples could also serve as traps for wear debris in both lubricated and dry sliding [2].
From the literature review, it is noticed that researchers have mainly focused on fabrication method of surface texturing and load carrying capacity of fabricated surfaces. Thus primary objective of this paper is to investigate the effect of friction and wear on EN-32 high carbon steel plate fabricated with multiple cylindrical dimple based on a parallel plate experimental setup.
2. EXPERIMENTAL SETUP 2.1 Electric discharge machining technique
Electric discharge machining (EDM) is considered as the most promising texturing technology. The main reason is that textures fabricated by EDM could be precisely controlled and this process is friendly to the environment.
ELK Asia Pacific Journals – 978-93-85537-06-6 ARIMPIE -2017
Electro Discharge Machining (EDM) is an electro-
thermal non-traditional machining process, where electrical energy is used to generate electrical spark and material removal mainly occurs due to thermal energy of the spark.
In EDM, the generator is used to apply voltage pulses between the tool and the job. A constant voltage is not applied. Only sparking is desired in EDM rather than arcing. Arcing leads to localised material removal at a particular point whereas sparks get distributed all over the tool surface leading to uniformly distributed material removal under the tool.
2.2 Process parameters used for fabrication of dimples
The process parameters used for the fabrication of microdimple on EN-31 high carbon steel plate by EDM (ROBOFORM – 20, CHARMILLES) is listed in Table 2.1:
Table 2.1: Parameters used for fabrication
Material removal mainly occurs due to thermal evaporation and melting hence dielectric fluid should provide an oxygen free machining environment. Further it should have enough strong dielectric resistance so that it does not breakdown electrically too easily but at the same time ionise when electrons collide with its molecule. Moreover, during sparking it should be thermally resistant as well.
2.3 Equipment used for fabrication of microdimple
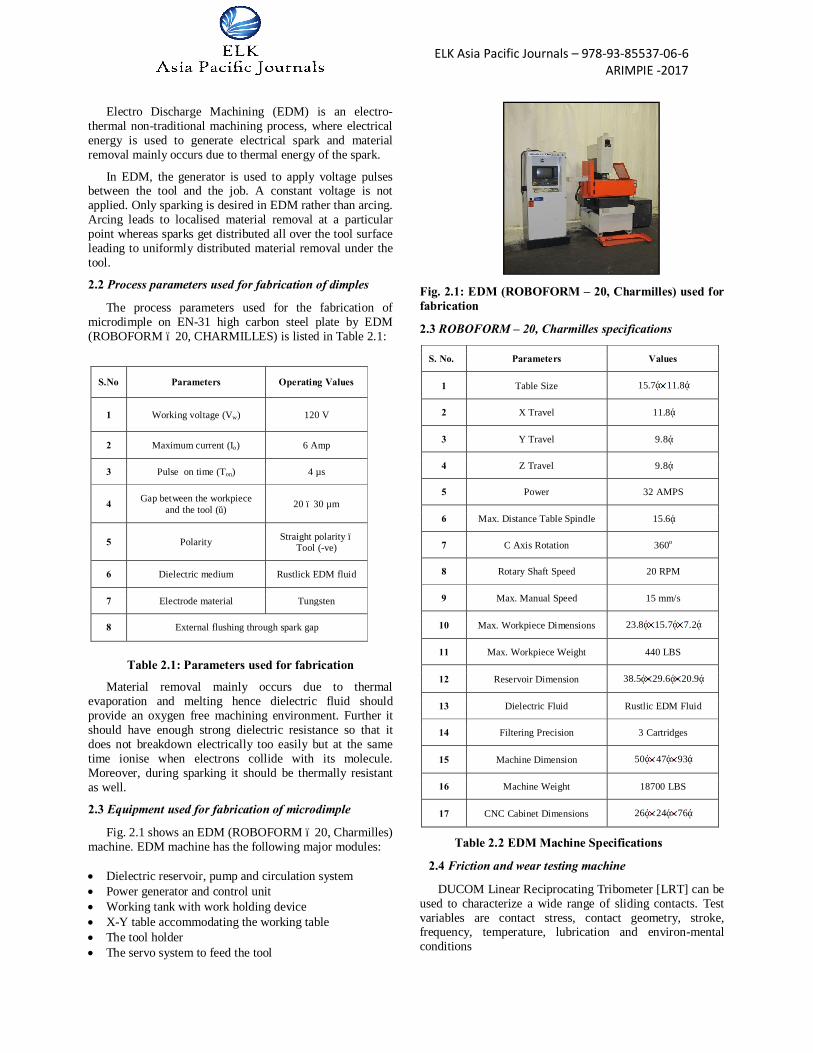
Fig. 2.1 shows an EDM (ROBOFORM – 20, Charmilles) machine. EDM machine has the following major modules: • Dielectric reservoir, pump and circulation system • Power generator and control unit • Working tank with work holding device • X-Y table accommodating the working table • The tool holder • The servo system to feed the tool
Fig. 2.1: EDM (ROBOFORM – 20, Charmilles) used for fabrication
2.3 ROBOFORM – 20, Charmilles specifications
S. No. Parameters Values
1 Table Size 15.7ʺ 11.8ʺ
2 X Travel 11.8 ̋
3 Y Travel 9.8 ̋
4 Z Travel 9.8 ̋
5 Power 32 AMPS
6 Max. Distance Table Spindle 15.6 ̋
7 C Axis Rotation 360o
8 Rotary Shaft Speed 20 RPM
9 Max. Manual Speed 15 mm/s
10 Max. Workpiece Dimensions 23.8ʺ 15.7ʺ 7.2ʺ
11 Max. Workpiece Weight 440 LBS
12 Reservoir Dimension 38.5ʺ 29.6ʺ 20.9ʺ
13 Dielectric Fluid Rustlic EDM Fluid
14 Filtering Precision 3 Cartridges
15 Machine Dimension 50ʺ 47ʺ 93ʺ
16 Machine Weight 18700 LBS
17 CNC Cabinet Dimensions 26ʺ 24ʺ 76ʺ
Table 2.2 EDM Machine Specifications
2.4 Friction and wear testing machine
DUCOM Linear Reciprocating Tribometer [LRT] can be used to characterize a wide range of sliding contacts. Test variables are contact stress, contact geometry, stroke, frequency, temperature, lubrication and environ-mental conditions
S.No Parameters Operating Values
1 Working voltage (Vw) 120 V
2 Maximum current (Io) 6 Amp
3 Pulse on time (Ton) 4 µs
4 Gap between the workpiece and the tool (δ) 20 – 30 µm
5 Polarity Straight polarity – Tool (-ve)
6 Dielectric medium Rustlick EDM fluid
7 Electrode material Tungsten
8 External flushing through spark gap
ELK Asia Pacific Journals – 978-93-85537-06-6 ARIMPIE -2017
Variety of sample shapes can be accommodated with suitable sample holders. Friction and wear tests were performed under dry-sliding condition using a high frequency linear-oscillation “DUCOM pin-on-plate reciprocating friction monitor”. The dry-sliding test began as the pin slid against a stationary counterpart plate
The reciprocating motion was generated via an electro-motor and normal load was applied using a dual cantilever beam.
The kinetic frictional force was recorded by the piezoelectric force sensor during the test and subsequently calculated in terms of root mean square value. The kinetic coefficient of friction value displayed on the instrumentation output was calculated based on recorded frictional force divided by the normal load.
This system is computer controlled and includes a data acquisition software that can be used to acquire, view and report results.
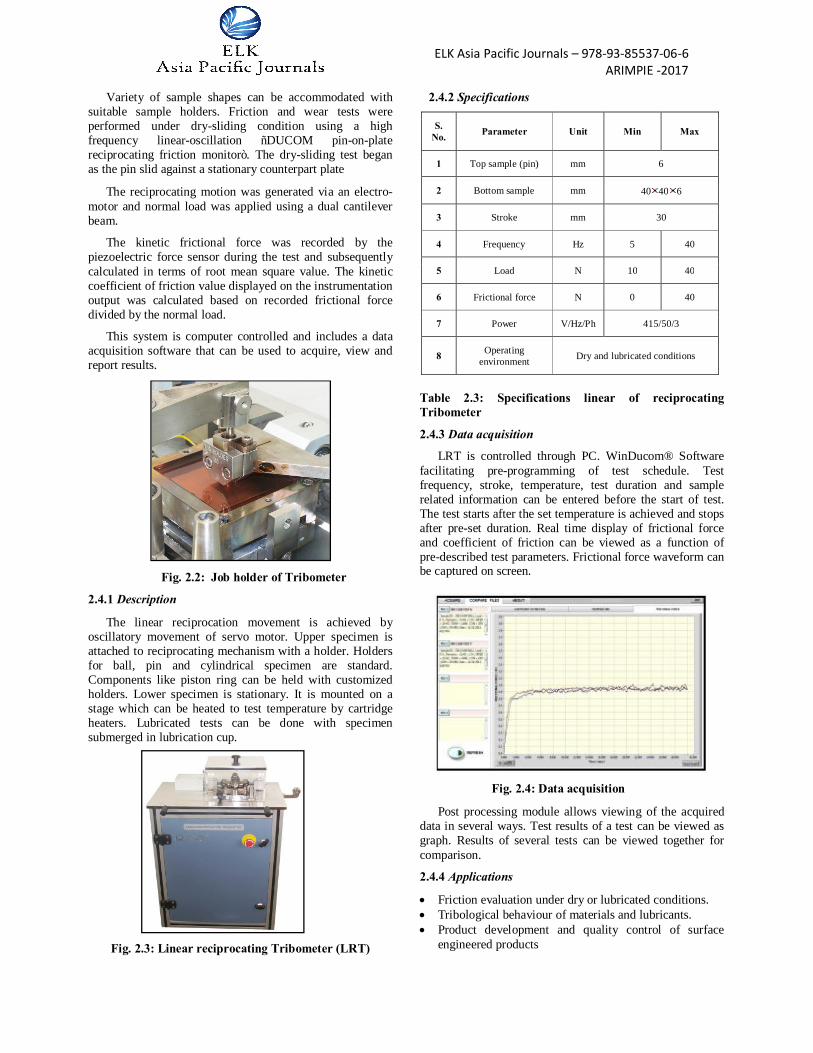
Fig. 2.2: Job holder of Tribometer
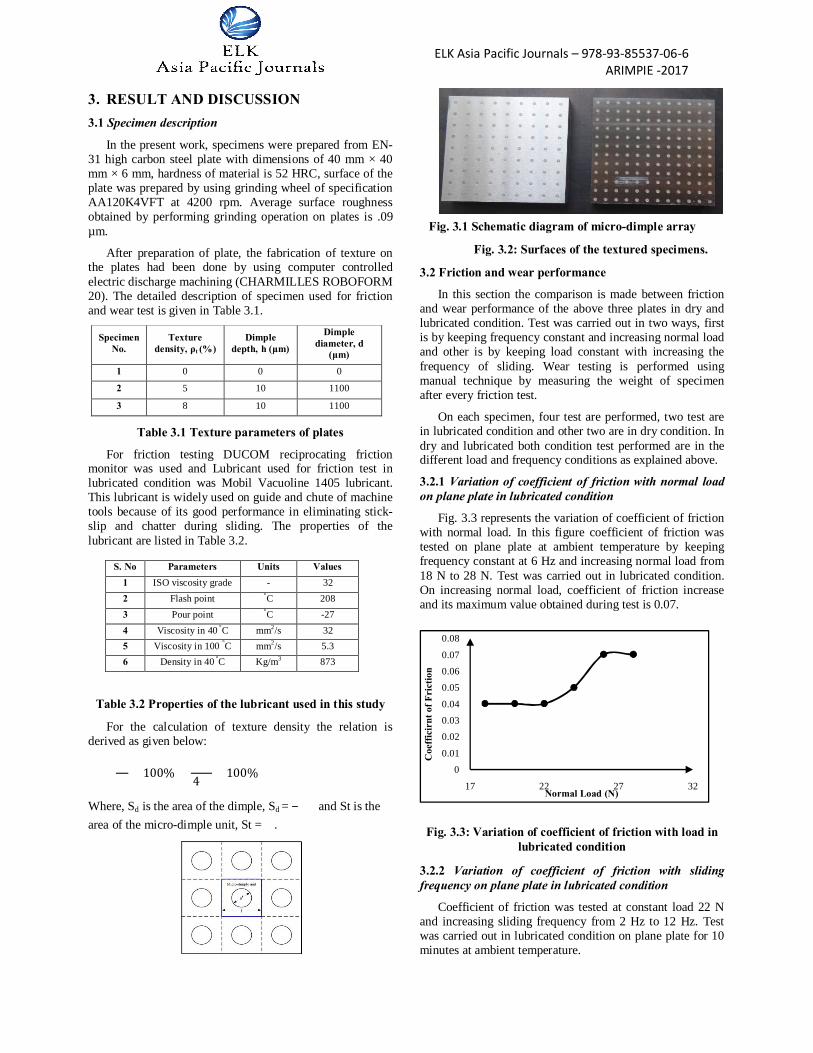
2.4.1 Description
The linear reciprocation movement is achieved by oscillatory movement of servo motor. Upper specimen is attached to reciprocating mechanism with a holder. Holders for ball, pin and cylindrical specimen are standard. Components like piston ring can be held with customized holders. Lower specimen is stationary. It is mounted on a stage which can be heated to test temperature by cartridge heaters. Lubricated tests can be done with specimen submerged in lubrication cup.
Fig. 2.3: Linear reciprocating Tribometer (LRT)
2.4.2 Specifications
S. No. Parameter Unit Min Max
1 Top sample (pin) mm 6
2 Bottom sample mm 40 40 6
3 Stroke mm 30
4 Frequency Hz 5 40
5 Load N 10 40
6 Frictional force N 0 40
7 Power V/Hz/Ph 415/50/3
8 Operating environment Dry and lubricated conditions
Table 2.3: Specifications linear of reciprocating Tribometer
2.4.3 Data acquisition
LRT is controlled through PC. WinDucom® Software facilitating pre-programming of test schedule. Test frequency, stroke, temperature, test duration and sample related information can be entered before the start of test. The test starts after the set temperature is achieved and stops after pre-set duration. Real time display of frictional force and coefficient of friction can be viewed as a function of pre-described test parameters. Frictional force waveform can be captured on screen.
Fig. 2.4: Data acquisition
Post processing module allows viewing of the acquired data in several ways. Test results of a test can be viewed as graph. Results of several tests can be viewed together for comparison.
2.4.4 Applications
• Friction evaluation under dry or lubricated conditions. • Tribological behaviour of materials and lubricants. • Product development and quality control of surface
engineered products
ELK Asia Pacific Journals – 978-93-85537-06-6 ARIMPIE -2017
3. RESULT AND DISCUSSION
3.1 Specimen description
In the present work, specimens were prepared from EN-31 high carbon steel plate with dimensions of 40 mm × 40 mm × 6 mm, hardness of material is 52 HRC, surface of the plate was prepared by using grinding wheel of specification AA120K4VFT at 4200 rpm. Average surface roughness obtained by performing grinding operation on plates is .09 µm.
After preparation of plate, the fabrication of texture on the plates had been done by using computer controlled electric discharge machining (CHARMILLES ROBOFORM 20). The detailed description of specimen used for friction and wear test is given in Table 3.1.
Specimen No.
Texture density, ρt (%)
Dimple depth, h (μm)
Dimple diameter, d
(μm)
1 0 0 0
2 5 10 1100
3 8 10 1100
Table 3.1 Texture parameters of plates
For friction testing DUCOM reciprocating friction monitor was used and Lubricant used for friction test in lubricated condition was Mobil Vacuoline 1405 lubricant. This lubricant is widely used on guide and chute of machine tools because of its good performance in eliminating stick-slip and chatter during sliding. The properties of the lubricant are listed in Table 3.2.
Table 3.2 Properties of the lubricant used in this study
For the calculation of texture density the relation is derived as given below:
�� ���
��� 100% �
���
4�� � 100%
Where, Sd is the area of the dimple, Sd = ��
��and St is the area of the micro-dimple unit, St =��.
Fig. 3.1 Schematic diagram of micro-dimple array
Fig. 3.2: Surfaces of the textured specimens.
3.2 Friction and wear performance
In this section the comparison is made between friction and wear performance of the above three plates in dry and lubricated condition. Test was carried out in two ways, first is by keeping frequency constant and increasing normal load and other is by keeping load constant with increasing the frequency of sliding. Wear testing is performed using manual technique by measuring the weight of specimen after every friction test.
On each specimen, four test are performed, two test are in lubricated condition and other two are in dry condition. In dry and lubricated both condition test performed are in the different load and frequency conditions as explained above.
3.2.1 Variation of coefficient of friction with normal load on plane plate in lubricated condition
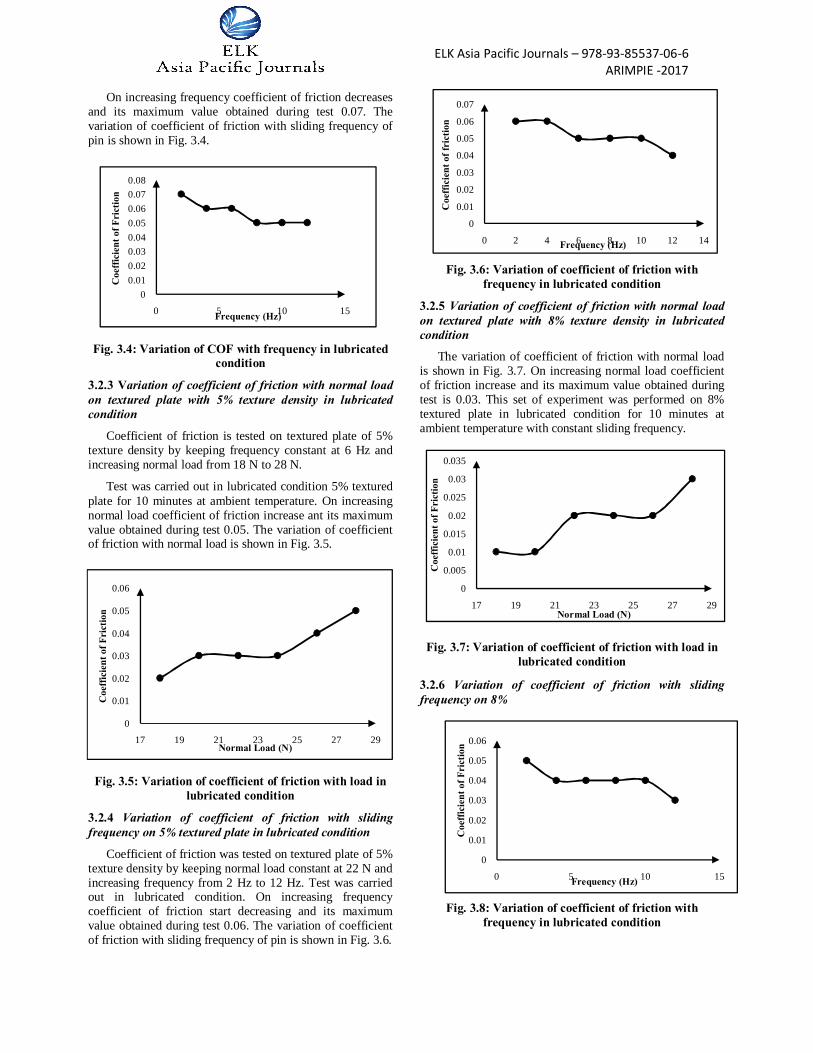
Fig. 3.3 represents the variation of coefficient of friction with normal load. In this figure coefficient of friction was tested on plane plate at ambient temperature by keeping frequency constant at 6 Hz and increasing normal load from 18 N to 28 N. Test was carried out in lubricated condition. On increasing normal load, coefficient of friction increase and its maximum value obtained during test is 0.07.
Fig. 3.3: Variation of coefficient of friction with load in lubricated condition
3.2.2 Variation of coefficient of friction with sliding frequency on plane plate in lubricated condition
Coefficient of friction was tested at constant load 22 N and increasing sliding frequency from 2 Hz to 12 Hz. Test was carried out in lubricated condition on plane plate for 10 minutes at ambient temperature.
S. No Parameters Units Values 1 ISO viscosity grade - 32 2 Flash point °C 208 3 Pour point °C -27 4 Viscosity in 40 °C mm2/s 32 5 Viscosity in 100 °C mm2/s 5.3 6 Density in 40 °C Kg/m3 873
00.01
0.020.030.04
0.050.060.07
0.08
17 22 27 32
Coe
ffic
irnt
of F
rict
ion
Normal Load (N)
ELK Asia Pacific Journals – 978-93-85537-06-6 ARIMPIE -2017
On increasing frequency coefficient of friction decreases and its maximum value obtained during test 0.07. The variation of coefficient of friction with sliding frequency of pin is shown in Fig. 3.4.
Fig. 3.4: Variation of COF with frequency in lubricated condition
3.2.3 Variation of coefficient of friction with normal load on textured plate with 5% texture density in lubricated condition
Coefficient of friction is tested on textured plate of 5% texture density by keeping frequency constant at 6 Hz and increasing normal load from 18 N to 28 N.
Test was carried out in lubricated condition 5% textured plate for 10 minutes at ambient temperature. On increasing normal load coefficient of friction increase ant its maximum value obtained during test 0.05. The variation of coefficient of friction with normal load is shown in Fig. 3.5.
Fig. 3.5: Variation of coefficient of friction with load in
lubricated condition
3.2.4 Variation of coefficient of friction with sliding frequency on 5% textured plate in lubricated condition
Coefficient of friction was tested on textured plate of 5% texture density by keeping normal load constant at 22 N and increasing frequency from 2 Hz to 12 Hz. Test was carried out in lubricated condition. On increasing frequency coefficient of friction start decreasing and its maximum value obtained during test 0.06. The variation of coefficient of friction with sliding frequency of pin is shown in Fig. 3.6.
Fig. 3.6: Variation of coefficient of friction with frequency in lubricated condition
3.2.5 Variation of coefficient of friction with normal load on textured plate with 8% texture density in lubricated condition
The variation of coefficient of friction with normal load is shown in Fig. 3.7. On increasing normal load coefficient of friction increase and its maximum value obtained during test is 0.03. This set of experiment was performed on 8% textured plate in lubricated condition for 10 minutes at ambient temperature with constant sliding frequency.
Fig. 3.7: Variation of coefficient of friction with load in lubricated condition
3.2.6 Variation of coefficient of friction with sliding frequency on 8%
Fig. 3.8: Variation of coefficient of friction with frequency in lubricated condition
00.010.020.030.040.050.060.070.08
0 5 10 15
Coe
ffic
ient
of F
rict
ion
Frequency (Hz)
0
0.01
0.02
0.03
0.04
0.05
0.06
17 19 21 23 25 27 29
Coe
ffic
ient
of F
rict
ion
Normal Load (N)
0
0.01
0.02
0.03
0.04
0.05
0.06
0.07
0 2 4 6 8 10 12 14
Coe
ffic
ient
of f
rict
ion
Frequency (Hz)
0
0.005
0.01
0.015
0.02
0.025
0.03
0.035
17 19 21 23 25 27 29
Coe
ffic
ient
of F
rict
ion
Normal Load (N)
0
0.01
0.02
0.03
0.04
0.05
0.06
0 5 10 15
Coe
ffic
ient
of F
rict
ion
Frequency (Hz)
ELK Asia Pacific Journals – 978-93-85537-06-6 ARIMPIE -2017
Coefficient of friction is tested on 8% textured plate at ambient temperature by keeping normal load constant at 22 N and increasing sliding frequency from 2 Hz to 12 Hz. Test carried out in lubricated condition.
On increasing frequency, coefficient of friction decreases and its maximum value observed from this test 0.05 which is shown in Fig. 3.8.
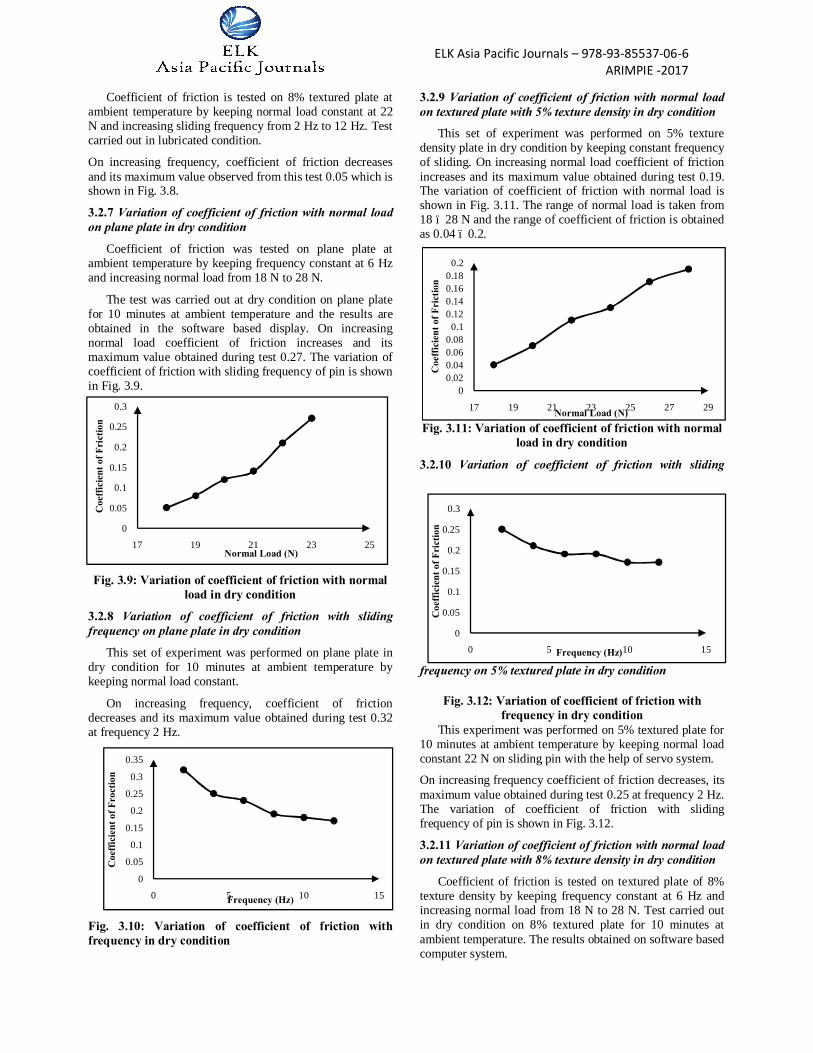
3.2.7 Variation of coefficient of friction with normal load on plane plate in dry condition
Coefficient of friction was tested on plane plate at ambient temperature by keeping frequency constant at 6 Hz and increasing normal load from 18 N to 28 N.
The test was carried out at dry condition on plane plate for 10 minutes at ambient temperature and the results are obtained in the software based display. On increasing normal load coefficient of friction increases and its maximum value obtained during test 0.27. The variation of coefficient of friction with sliding frequency of pin is shown in Fig. 3.9.
Fig. 3.9: Variation of coefficient of friction with normal load in dry condition
3.2.8 Variation of coefficient of friction with sliding frequency on plane plate in dry condition
This set of experiment was performed on plane plate in dry condition for 10 minutes at ambient temperature by keeping normal load constant.
On increasing frequency, coefficient of friction decreases and its maximum value obtained during test 0.32 at frequency 2 Hz.
Fig. 3.10: Variation of coefficient of friction with frequency in dry condition
3.2.9 Variation of coefficient of friction with normal load on textured plate with 5% texture density in dry condition
This set of experiment was performed on 5% texture density plate in dry condition by keeping constant frequency of sliding. On increasing normal load coefficient of friction increases and its maximum value obtained during test 0.19. The variation of coefficient of friction with normal load is shown in Fig. 3.11. The range of normal load is taken from 18 – 28 N and the range of coefficient of friction is obtained as 0.04 – 0.2.
Fig. 3.11: Variation of coefficient of friction with normal load in dry condition
3.2.10 Variation of coefficient of friction with sliding
frequency on 5% textured plate in dry condition
Fig. 3.12: Variation of coefficient of friction with frequency in dry condition
This experiment was performed on 5% textured plate for 10 minutes at ambient temperature by keeping normal load constant 22 N on sliding pin with the help of servo system.
On increasing frequency coefficient of friction decreases, its maximum value obtained during test 0.25 at frequency 2 Hz. The variation of coefficient of friction with sliding frequency of pin is shown in Fig. 3.12.
3.2.11 Variation of coefficient of friction with normal load on textured plate with 8% texture density in dry condition
Coefficient of friction is tested on textured plate of 8% texture density by keeping frequency constant at 6 Hz and increasing normal load from 18 N to 28 N. Test carried out in dry condition on 8% textured plate for 10 minutes at ambient temperature. The results obtained on software based computer system.
0
0.05
0.1
0.15
0.2
0.25
0.3
17 19 21 23 25
Coe
ffic
ient
of F
rict
ion
Normal Load (N)
0
0.05
0.1
0.15
0.2
0.25
0.3
0.35
0 5 10 15
Coe
ffic
ient
of F
roct
ion
Frequency (Hz)
00.020.040.060.08
0.10.120.140.160.18
0.2
17 19 21 23 25 27 29
Coe
ffic
ient
of F
rict
ion
Normal Load (N)
0
0.05
0.1
0.15
0.2
0.25
0.3
0 5 10 15
Coe
ffic
ient
of F
rict
ion
Frequency (Hz)
ELK Asia Pacific Journals – 978-93-85537-06-6 ARIMPIE -2017
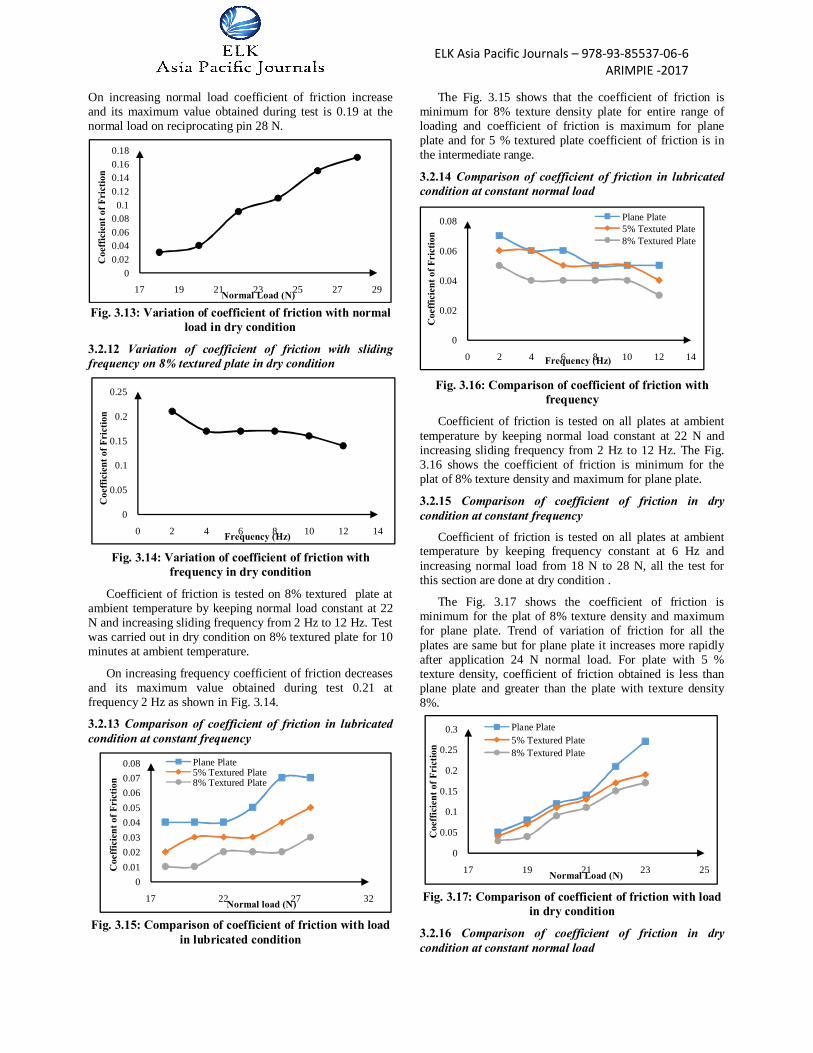
On increasing normal load coefficient of friction increase and its maximum value obtained during test is 0.19 at the normal load on reciprocating pin 28 N.
Fig. 3.13: Variation of coefficient of friction with normal load in dry condition
3.2.12 Variation of coefficient of friction with sliding frequency on 8% textured plate in dry condition
Fig. 3.14: Variation of coefficient of friction with frequency in dry condition
Coefficient of friction is tested on 8% textured plate at ambient temperature by keeping normal load constant at 22 N and increasing sliding frequency from 2 Hz to 12 Hz. Test was carried out in dry condition on 8% textured plate for 10 minutes at ambient temperature.
On increasing frequency coefficient of friction decreases and its maximum value obtained during test 0.21 at frequency 2 Hz as shown in Fig. 3.14.
3.2.13 Comparison of coefficient of friction in lubricated condition at constant frequency
Fig. 3.15: Comparison of coefficient of friction with load in lubricated condition
The Fig. 3.15 shows that the coefficient of friction is minimum for 8% texture density plate for entire range of loading and coefficient of friction is maximum for plane plate and for 5 % textured plate coefficient of friction is in the intermediate range.
3.2.14 Comparison of coefficient of friction in lubricated condition at constant normal load
Fig. 3.16: Comparison of coefficient of friction with frequency
Coefficient of friction is tested on all plates at ambient temperature by keeping normal load constant at 22 N and increasing sliding frequency from 2 Hz to 12 Hz. The Fig. 3.16 shows the coefficient of friction is minimum for the plat of 8% texture density and maximum for plane plate.
3.2.15 Comparison of coefficient of friction in dry condition at constant frequency
Coefficient of friction is tested on all plates at ambient temperature by keeping frequency constant at 6 Hz and increasing normal load from 18 N to 28 N, all the test for this section are done at dry condition .
The Fig. 3.17 shows the coefficient of friction is minimum for the plat of 8% texture density and maximum for plane plate. Trend of variation of friction for all the plates are same but for plane plate it increases more rapidly after application 24 N normal load. For plate with 5 % texture density, coefficient of friction obtained is less than plane plate and greater than the plate with texture density 8%.
Fig. 3.17: Comparison of coefficient of friction with load in dry condition
3.2.16 Comparison of coefficient of friction in dry condition at constant normal load
00.020.040.060.080.1
0.120.140.160.18
17 19 21 23 25 27 29
Coe
ffic
ient
of F
rict
ion
Normal Load (N)
0
0.05
0.1
0.15
0.2
0.25
0 2 4 6 8 10 12 14
Coe
ffic
ient
of F
rict
ion
Frequency (Hz)
00.010.020.030.040.050.060.070.08
17 22 27 32
Coe
ffic
ient
of F
rict
ion
Normal load (N)
Plane Plate5% Textured Plate8% Textured Plate
0
0.02
0.04
0.06
0.08
0 2 4 6 8 10 12 14
Coe
ffic
ient
of F
rict
ion
Frequency (Hz)
Plane Plate5% Textuted Plate8% Textured Plate
0
0.05
0.1
0.15
0.2
0.25
0.3
17 19 21 23 25
Coe
ffic
ient
of F
rict
ion
Normal Load (N)
Plane Plate5% Textured Plate8% Textured Plate
ELK Asia Pacific Journals – 978-93-85537-06-6 ARIMPIE -2017
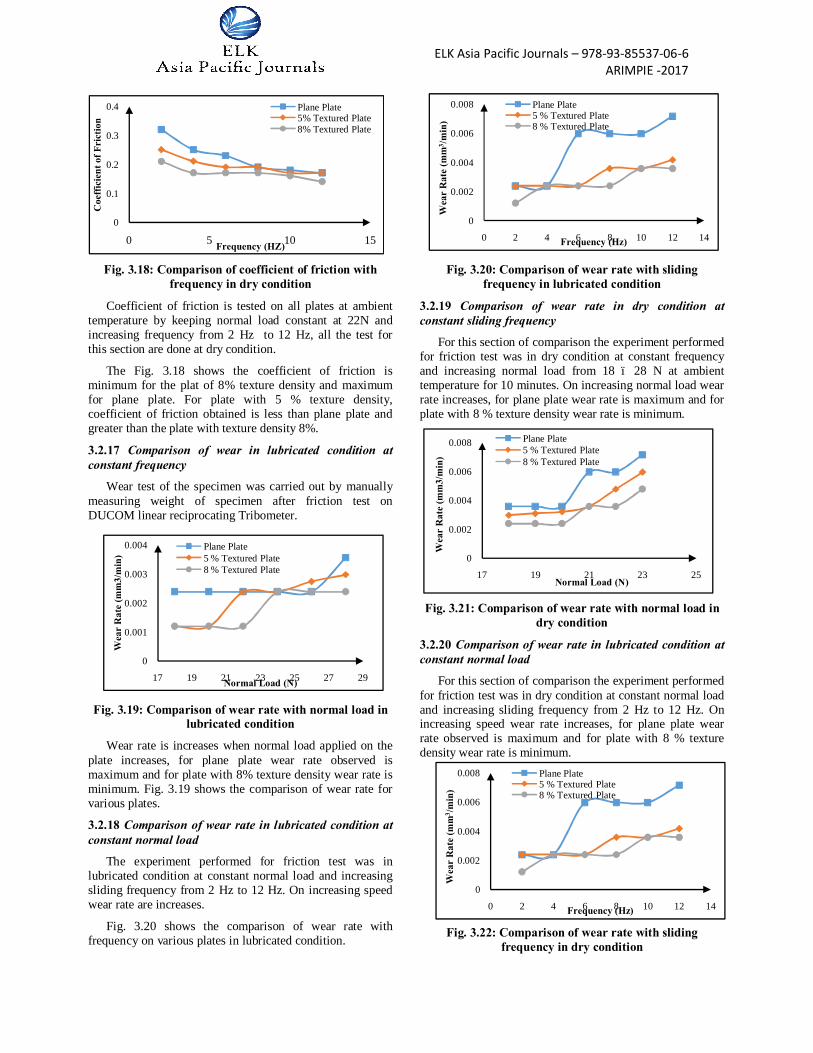
Fig. 3.18: Comparison of coefficient of friction with frequency in dry condition
Coefficient of friction is tested on all plates at ambient temperature by keeping normal load constant at 22N and increasing frequency from 2 Hz to 12 Hz, all the test for this section are done at dry condition.
The Fig. 3.18 shows the coefficient of friction is minimum for the plat of 8% texture density and maximum for plane plate. For plate with 5 % texture density, coefficient of friction obtained is less than plane plate and greater than the plate with texture density 8%.
3.2.17 Comparison of wear in lubricated condition at constant frequency
Wear test of the specimen was carried out by manually measuring weight of specimen after friction test on DUCOM linear reciprocating Tribometer.
Fig. 3.19: Comparison of wear rate with normal load in lubricated condition
Wear rate is increases when normal load applied on the plate increases, for plane plate wear rate observed is maximum and for plate with 8% texture density wear rate is minimum. Fig. 3.19 shows the comparison of wear rate for various plates.
3.2.18 Comparison of wear rate in lubricated condition at constant normal load
The experiment performed for friction test was in lubricated condition at constant normal load and increasing sliding frequency from 2 Hz to 12 Hz. On increasing speed wear rate are increases.
Fig. 3.20 shows the comparison of wear rate with frequency on various plates in lubricated condition.
Fig. 3.20: Comparison of wear rate with sliding frequency in lubricated condition
3.2.19 Comparison of wear rate in dry condition at constant sliding frequency
For this section of comparison the experiment performed for friction test was in dry condition at constant frequency and increasing normal load from 18 – 28 N at ambient temperature for 10 minutes. On increasing normal load wear rate increases, for plane plate wear rate is maximum and for plate with 8 % texture density wear rate is minimum.
Fig. 3.21: Comparison of wear rate with normal load in dry condition
3.2.20 Comparison of wear rate in lubricated condition at constant normal load
For this section of comparison the experiment performed for friction test was in dry condition at constant normal load and increasing sliding frequency from 2 Hz to 12 Hz. On increasing speed wear rate increases, for plane plate wear rate observed is maximum and for plate with 8 % texture density wear rate is minimum.
Fig. 3.22: Comparison of wear rate with sliding frequency in dry condition
0
0.1
0.2
0.3
0.4
0 5 10 15
Coe
ffic
ient
of F
rict
ion
Frequency (HZ)
Plane Plate5% Textured Plate8% Textured Plate
0
0.001
0.002
0.003
0.004
17 19 21 23 25 27 29
Wea
r R
ate
(mm
3/m
in)
Normal Load (N)
Plane Plate5 % Textured Plate8 % Textured Plate
0
0.002
0.004
0.006
0.008
17 19 21 23 25
Wea
r R
ate
(mm
3/m
in)
Normal Load (N)
Plane Plate5 % Textured Plate8 % Textured Plate
0
0.002
0.004
0.006
0.008
0 2 4 6 8 10 12 14
Wea
r R
ate
(mm
3 /min
)
Frequency (Hz)
Plane Plate5 % Textured Plate8 % Textured Plate
0
0.002
0.004
0.006
0.008
0 2 4 6 8 10 12 14
Wea
r R
ate
(mm
3 /min
)
Frequency (Hz)
Plane Plate5 % Textured Plate8 % Textured Plate
ELK Asia Pacific Journals – 978-93-85537-06-6 ARIMPIE -2017
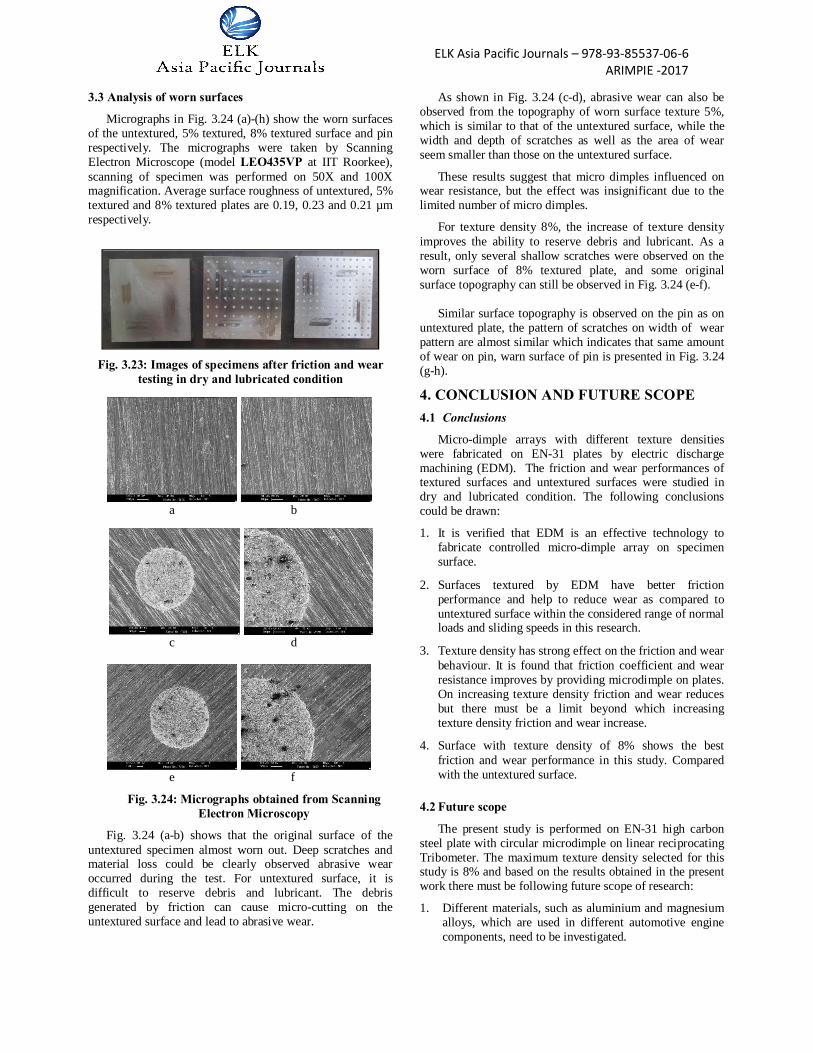
3.3 Analysis of worn surfaces
Micrographs in Fig. 3.24 (a)-(h) show the worn surfaces of the untextured, 5% textured, 8% textured surface and pin respectively. The micrographs were taken by Scanning Electron Microscope (model LEO435VP at IIT Roorkee), scanning of specimen was performed on 50X and 100X magnification. Average surface roughness of untextured, 5% textured and 8% textured plates are 0.19, 0.23 and 0.21 µm respectively.
Fig. 3.23: Images of specimens after friction and wear
testing in dry and lubricated condition
a b
c d
e f
Fig. 3.24: Micrographs obtained from Scanning Electron Microscopy
Fig. 3.24 (a-b) shows that the original surface of the untextured specimen almost worn out. Deep scratches and material loss could be clearly observed abrasive wear occurred during the test. For untextured surface, it is difficult to reserve debris and lubricant. The debris generated by friction can cause micro-cutting on the untextured surface and lead to abrasive wear.
As shown in Fig. 3.24 (c-d), abrasive wear can also be observed from the topography of worn surface texture 5%, which is similar to that of the untextured surface, while the width and depth of scratches as well as the area of wear seem smaller than those on the untextured surface.
These results suggest that micro dimples influenced on wear resistance, but the effect was insignificant due to the limited number of micro dimples.
For texture density 8%, the increase of texture density improves the ability to reserve debris and lubricant. As a result, only several shallow scratches were observed on the worn surface of 8% textured plate, and some original surface topography can still be observed in Fig. 3.24 (e-f).
Similar surface topography is observed on the pin as on
untextured plate, the pattern of scratches on width of wear pattern are almost similar which indicates that same amount of wear on pin, warn surface of pin is presented in Fig. 3.24 (g-h).
4. CONCLUSION AND FUTURE SCOPE 4.1 Conclusions
Micro-dimple arrays with different texture densities were fabricated on EN-31 plates by electric discharge machining (EDM). The friction and wear performances of textured surfaces and untextured surfaces were studied in dry and lubricated condition. The following conclusions could be drawn:
1. It is verified that EDM is an effective technology to fabricate controlled micro-dimple array on specimen surface.
2. Surfaces textured by EDM have better friction performance and help to reduce wear as compared to untextured surface within the considered range of normal loads and sliding speeds in this research.
3. Texture density has strong effect on the friction and wear behaviour. It is found that friction coefficient and wear resistance improves by providing microdimple on plates. On increasing texture density friction and wear reduces but there must be a limit beyond which increasing texture density friction and wear increase.
4. Surface with texture density of 8% shows the best friction and wear performance in this study. Compared with the untextured surface.
4.2 Future scope
The present study is performed on EN-31 high carbon steel plate with circular microdimple on linear reciprocating Tribometer. The maximum texture density selected for this study is 8% and based on the results obtained in the present work there must be following future scope of research:
1. Different materials, such as aluminium and magnesium alloys, which are used in different automotive engine components, need to be investigated.
ELK Asia Pacific Journals – 978-93-85537-06-6 ARIMPIE -2017
2. Surfaces textured by EDM have better friction performance and help to reduce wear as compared to untextured surface within the considered range of normal loads and sliding speeds in this research.
3. Texture density has strong effect on the friction and wear behaviour. It is found that friction coefficient and wear resistance improves by providing microdimple on plates. On increasing texture density friction and wear reduces but there must be a limit beyond which increasing texture density friction and wear increase.
4. Surface with texture density of 8% shows the best friction and wear performance in this study. Compared with the untextured surface.
REFERENCES
[1] Nakada, M.: “Trends in engine technology and tribology”, Tribol. Int, Vol 27, pp. 3-8, 1994.
[2] Etsion, I.: “State of the art in laser surface texturing”, Journal of Tribology,Vol. 127(1), pp. 248-253, 2005.
[3] Schneider, Y.G.: “Formation of surfaces with uniform micropatterns on precision machine and instrument parts”, Precision Engineering, Vol. 6, p p. 219-225, 1984.
[4] Suh, N.P., M. Mosleh and P.S. Howard: “Control of friction”, Wear, Vol. 175, pp. 151- 158, 1994.
[5] Willis, E.: “Surface finish in relation to cylinder liners”, Wear, Vol. 109: pp. 351-366, 1995.
[6] Wang, X., K. Kato, K. Adachi and K. Aizawa: “Loads carrying capacity map for the surface texture design of SiC thrust bearing sliding in water”, Tribology International, Vol. 36, pp. 189-197, 2003.
[7] Xiaolei, W., K. Adachi, K. Otsuka and K. Kato: “Optimization of the surface texture for silicon carbide sliding in water”, Applied Surface Science, Vol. 253, pp. 1282-6, 2006.
[8] Xiaolei, W., K. Kato and K. Adachi: “The critical condition for the transition from HL to ML in water-lubricated SiC”, Tribology Letters, Vol. 16, pp. 253-258, 2004.
[9] Wang, X., K. Kato and K. Adachi: “The lubrication effect of micro-pits on parallel sliding faces of sic in water”, Tribology Transactions, Vol. 45, pp. 294-301, 2002.
[10] Fanming M., Rui Z., Tiffany Davis, Jian Cao, Q. Jana Wang, Diann H.,and Jordan Liu: “Study on the effect of dimples on friction of parallel surfaces under different sliding conditions”, applied surface science, Vol. 256, pp. 2863-2875, 2010.
[11] G. Ryk, Y. Kligerman, I. Etsion: “Experimental investigation of laser surface texturing for reciprocating automotive components”, Tribol. Trans., Vol. 45, pp. 444-449, 2002.
ABBREVATIONS
EDM Electric discharge machining µm Micrometer MEMS Micro – electrical mechanical system AJM Abrasive jet machining LBM Laser beam machining VMT Vibro – mechanical texturing LST Laser surface texturing EBM Electron beam machining ECM Electrochemical machining Vw Working voltage V Voltage Io Maximum current Ton Pulse on time δ Gap between workpiece and tool µs Microsecond Amp Ampere RPM Rotation per minute mm/s Millimeter per second LBS Pound LRT Linear reciprocating tribometer mm Millimeter N Newton Hz Hertz SEM Scanning electron microscopy �� Textured density Sd Area of dimple St Area of microdimple unit d Diameter of dimple l Length of microdimple unit