Embed Size (px)
Citation preview
FRM4SOC Field Inter-Comparison Exercise (FICE) D-190, TR-8 TECHNICAL REPORT ‘Protocols and Procedures for FieldInter-Comparisons of FiducialReference Measurement (FRM) Field OceanColour Radiometers (OCR) used for Satellite Validation’Gavin Tilstone, Giorgio Dall’Olmo, Robert Brewin.Plymouth Marine Laboratory, Remote Sensing Group
Title D-190: TR-8Document reference
FRM4SOC-TR-8
Project ESA – FRM4SOC Contract ESRIN/Contract No. 4000117454/16/1-SBo Deliverable D-190 TR-8ATTN Tania Casal
ESA/ESTEC Technical Officer Keplerlaan 1 2201 AZ Noordwijk The Netherlands
Version 3.0 Date issued 15.08.2018 Approved by Sub-contractor Contractor Customer Name: Gavin Tilstone Riho Vendt Tânia Casal Organisation: Plymouth Marine
Laboratory (PML) University of Tartu ESA/ESTEC
Position: Senior Research Scientist
Project manager Technical Officer
Date: 15.08.2018 20.08.2018 Signature:
Document Change Record
ESRIN/Contract No. 4000117454/16/1-SBo Fiducial Reference Measurements for Satellite Ocean Colour (FRM4SOC) D-
190: TR-8
Ref: FRM4SOC-TR-8 Date: 15.08.2018 Ver: 3.0 Page 1 (44)
Index Issue Revision Date Brief description Issued by 1. 0 1 16.09.2016 Daft Gavin Tilstone 2. 1 0 22.05.2017 Original Issue Gavin Tilstone 3. 2 0 29.11.2017 Updated version Gavin Tilstone 4. 3 0 15.08.2018 Updated version Gavin Tilstone
Distribution List
Company/Organisation Name Format No. of Copies TO Riho Vendt Electronic file (PDF) 1 TO Viktor Vabson Electronic file (PDF) 1 TO Tiia Lillemaa Electronic file (PDF) 1 TO Joel Kuusk Electronic file (PDF) 1 TO Anu Reinart Electronic file (PDF) 1 RBINS Kevin Ruddick Electronic file (PDF) 1 NPL Andrew Banks Electronic file (PDF) 1 PML Gavin Tilstone Electronic file (PDF) 1 ACRI-ST Christophe Lerebourg Electronic file (PDF) 1 ESA ESTEC/EOP-SME Tania Casal Electronic file – pdf and
original (WORD) file 1 pdf 1
WORD file ESA ESTEC/EOP-SME Craig Donlon Electronic file – pdf and
originaal (WORD) file 1 pdf 1
WORD file ESA ESRIN/IPL-POE Silke Bode Electronic file – pdf and
original (WORD) file 1 pdf 1
WORD file
ESRIN/Contract No. 4000117454/16/1-SBo Fiducial Reference Measurements for Satellite Ocean Colour (FRM4SOC) D-
190: TR-8
Ref: FRM4SOC-TR-8 Date: 15.08.2018 Ver: 3.0 Page 2 (44)
CONTENTS APPLICABLE DOCUMENTS ......................................................................................................... 4 ACRONYMS AND ABBREVIATIONS .......................................................................................... 5 1 INTRODUCTION ...................................................................................................................... 6
2 OBJECTIVES ............................................................................................................................. 6
3 ORGANIZATION ...................................................................................................................... 6 3.1 PILOT .......................................................................................................................................... 6
3.2 QUANTIFYING DIFFERENCES BETWEEN METHODS ...................................................... 6
3.3 COMPARISON OVERVIEW .....................................................................................................11
3.4 TIMETABLE ...............................................................................................................................11
3.5 TRAVEL ARRANGEMENTS FOR FICE……………………………………………...……...39
3.6 FLIGHTS TO VENICE & DIRECTIONS TO THE AAOT 40
4 REFERENCES ......................................................................................................................... 42 APPENDIX 1 HOTEL arrangements at AAOT 45

ESRIN/Contract No. 4000117454/16/1-SBo Fiducial Reference Measurements for Satellite Ocean Colour (FRM4SOC) D-
190: TR-8
Ref: FRM4SOC-TR-8 Date: 15.08.2018 Ver: 3.0 Page 3 (44)
APPLICABLE DOCUMENTS Ref. No. Version
/ Issue Document Title
1-8500 SoW 1 Fiducial Reference Measurements for Satellite Ocean Colour (FRM4SOC) Statement of Work (SOW)
ESRIN/Contract No. 4000117454/16/1-SBo Fiducial Reference Measurements for Satellite Ocean Colour (FRM4SOC) D-
190: TR-8
Ref: FRM4SOC-TR-8 Date: 15.08.2018 Ver: 3.0 Page 4 (44)
ACRONYMS AND ABBREVIATIONS
ESA European Space Agency FRM Fiducial Reference Measurements IR Infra-Red IOCCG International Ocean Colour Group ISO International Organization for Standardization JRC Joint Research Centre LCE Laboratory Calibration Exercise NMI National Metrology Institute PML Plymouth Marine Laboratory OCR Ocean Colour Radiometry RBINS Royal Belgian Institute Natural Science TO Tartu Observatory TR Technical Report
ESRIN/Contract No. 4000117454/16/1-SBo Fiducial Reference Measurements for Satellite Ocean Colour (FRM4SOC) D-
190: TR-8
Ref: FRM4SOC-TR-8 Date: 15.08.2018 Ver: 3.0 Page 5 (44)
1 INTRODUCTION To underpin the validation of satellite OCR, it essential that above and in water radiometers used to collect FRM’s, to ascertain the accuracy of Sentinel 2 & 3 products, are intercompared to assess data consistency and characterise uncertainties between instruments. In the absence of such field inter-comparisons, the use of a wide range of instruments, methods and laboratories may only add to the uncertainty in the accuracy of Sentinel 2 & 3 products. The primary data product in satellite ocean colour used to generate biogeochemical concentrations of chlorophyll a (Chl a) and total suspended matter (TSM) that are widely distributed to the user community for monitoring the marine environment, is the spectral remote sensing reflectance (Rrs) measured from the satellite sensor as the top of atmosphere radiance. Measurements of this parameter in situ are generally obtained through the deployment of in-water and above water optical measurement systems (OMS). OMS include fixed platforms, ships and tethered buoys. 2 OBJECTIVES
The FICE will address the following Objectives: A. A range of different OMS methods will be deployed, including above water
radiometry, underwater profiling, underwater measurements at fixed depths or combined above/underwater measurements from floating systems.
B. Different processing schemes are applied to the data from these systems. C. The same calibration sources and methods for the absolute radiometric calibration
of field instruments will be used and uncertainty budgets for each sensor will be estimated.
3 ORGANIZATION
3.1 PILOT Repetition of the errors reported in these previous NASA SIRREX and SIMRIC and ESA MVT field inter-comparisons will be reduced by:
• Calibrating all sensors at the same reference laboratory using the same plaques and and radiation sources traceable to SI standards prior to the AAOT.
• Use of SeaPRISM (above-water) and WiSPER (in-water) as reference sensors. • Reducing environmental effects including tilt and roll and illumination geometry by
using the stable AAOT platform. • Reducing environmental effects as a result of heterogeneous conditions by conducting
continuous above-water radiometry measurements throughout daylight hours for a period of ~5 weeks.
The FICE experiments will be conducted at two principal platforms:
A. The Acqua Alta Oceanographic Tower (AAOT). B. The Atlantic Meridional Transect (AMT).
These have been chosen as they both have a long history of use for satellite ocean colour validation and development during recent NASA and ESA missions (e.g. O’Reilly et al. 1998;
ESRIN/Contract No. 4000117454/16/1-SBo Fiducial Reference Measurements for Satellite Ocean Colour (FRM4SOC) D-
190: TR-8
Ref: FRM4SOC-TR-8 Date: 15.08.2018 Ver: 3.0 Page 6 (44)
Zibordi et al. 2006). Both platforms offer excellent deployment conditions for above water, floating and underwater profiling systems (e.g. Hooker et al. 2005), provide a range of oceanographic conditions to characterise measurement uncertainties and allow a large number of measurements to be taken per day (Brewin et al. 2014; Zibordi et al. 2002). Good agreement between radiometric sensors was achieved at the AAOT under ARC MERIS MVT because of the stability of the platform and the near ideal deployment conditions experienced at its location. The use of multi- sensor and method comparisons at the AAOT and long track above water radiometric comparison on the AMT will provide the volume and quality of data for a stand-alone publication in potentially high impact factor journal.
A. FICE-AAOT. The Acqua Alta Oceanographic Tower in off the Gulf of Venice, Italy, in the northern Adriatic Sea is a purpose built steel tower with a platform containing an instrument house to facilitate the measurement of ocean properties under exceptionably stable conditions. The platform has a long history of optical measurements to support and validate both NASA and ESA ocean colour missions (Zibordi et al. 2006; 2009b). An autonomous OMS has been developed at the tower, the data from which are widely used and accessed by the ocean colour community for satellite validation (Zibordi et al. 2004b, 2009c). Both in- and above-water optical measurements at the AAOT are taken under near ideal conditions due to the stability of the platform which has a fixed geometry, the frequency of clear sky conditions, the relatively low sun zenith angles and moderate to low sea states that are experienced at the tower. The water type at the tower can vary from clear open sea to turbid coastal. The atmospheric conditions are mostly dominated by continental and occasionally maritime, aerosols. This variability offers the opportunity perform field inter-comparisons under a wide range of environmental conditions. Continuous data acquisition of above water radiometry coupled with field campaigns to characterise the in water optics makes this site unique in the ability to inter-compare an array of sensors and methods at any one time. The AAOT-FICE was undertaken in July 2018 over a ten day period for simultaneous deployment of in- and above-water water radiometers listed in Table 1. All optical sensors were inter-calibrated against the same standards and methods prior to the FICE. The data products listed in Table 2 were inter-compared. Data analysis was conducted on centre wavelengths for Sentinel 2 & 3 (400, 412, 442, 510, 560, 620, 665, 673, 681, 708 nm). PARTICIPANTS
PML, JRC, RBINS, and TO will take part in the FICE-AAOT, plus a further 3-4 laboratories from the candidate laboratories given in Table 1. To extend the FICE-AAOT to an International level, we have budgeted for major US and Australian laboratories, as representatives of the NASA and ESA ocean colour vicarious calibration and validation community, to participate in this FICE. In addition, further European Laboratories who played an active role in LCE-2 were also invited to participate. The range of laboratories will not only provide a broad cross section of the International Ocean Colour community, but also offers comparisons between different optical sensors and methods.
ESRIN/Contract No. 4000117454/16/1-SBo Fiducial Reference Measurements for Satellite Ocean Colour (FRM4SOC) D-
190: TR-8
Ref: FRM4SOC-TR-8 Date: 15.08.2018 Ver: 3.0 Page 7 (44)
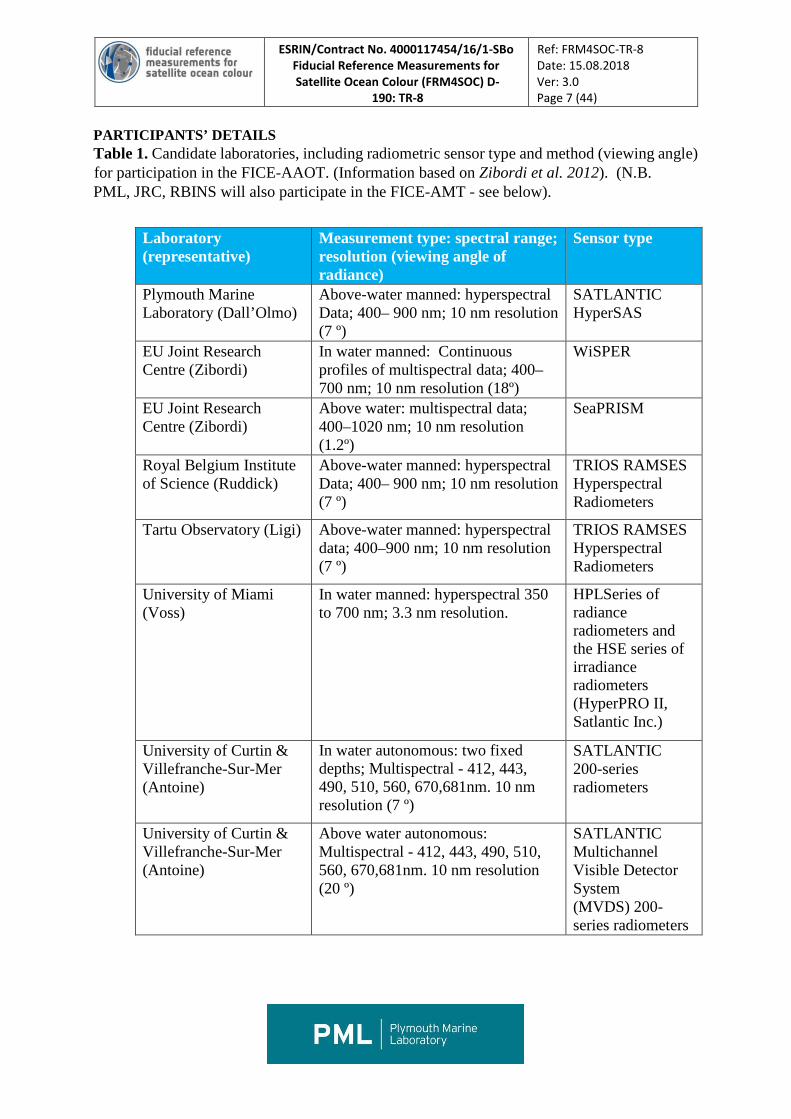
PARTICIPANTS’ DETAILS Table 1. Candidate laboratories, including radiometric sensor type and method (viewing angle) for participation in the FICE-AAOT. (Information based on Zibordi et al. 2012). (N.B. PML, JRC, RBINS will also participate in the FICE-AMT - see below).
Laboratory (representative)
Measurement type: spectral range; resolution (viewing angle of radiance)
Sensor type
Plymouth Marine Laboratory (Dall’Olmo)
Above-water manned: hyperspectral Data; 400– 900 nm; 10 nm resolution (7 º)
SATLANTIC HyperSAS
EU Joint Research Centre (Zibordi)
In water manned: Continuous profiles of multispectral data; 400– 700 nm; 10 nm resolution (18º)
WiSPER
EU Joint Research Centre (Zibordi)
Above water: multispectral data; 400–1020 nm; 10 nm resolution (1.2º)
SeaPRISM
Royal Belgium Institute of Science (Ruddick)
Above-water manned: hyperspectral Data; 400– 900 nm; 10 nm resolution (7 º)
TRIOS RAMSES Hyperspectral Radiometers
Tartu Observatory (Ligi) Above-water manned: hyperspectral data; 400–900 nm; 10 nm resolution (7 º)
TRIOS RAMSES Hyperspectral Radiometers
University of Miami (Voss)
In water manned: hyperspectral 350 to 700 nm; 3.3 nm resolution.
HPLSeries of radiance radiometers and the HSE series of irradiance radiometers (HyperPRO II, Satlantic Inc.)
University of Curtin & Villefranche-Sur-Mer (Antoine)
In water autonomous: two fixed depths; Multispectral - 412, 443, 490, 510, 560, 670,681nm. 10 nm resolution (7 º)
SATLANTIC 200-series radiometers
University of Curtin & Villefranche-Sur-Mer (Antoine)
Above water autonomous: Multispectral - 412, 443, 490, 510, 560, 670,681nm. 10 nm resolution (20 º)
SATLANTIC Multichannel Visible Detector System (MVDS) 200- series radiometers
ESRIN/Contract No. 4000117454/16/1-SBo Fiducial Reference Measurements for Satellite Ocean Colour (FRM4SOC) D-
190: TR-8
Ref: FRM4SOC-TR-8 Date: 15.08.2018 Ver: 3.0 Page 8 (44)
Bigelow Laboratory for Ocean Sciences (Balch)
Above water autonomous: Multispectral (412, 443, 490, 510, 531, 555, 670 nm); 10 nm resolution (7 º)
SATLANTIC MicroSAS on automated pointing system with rotating gimble to track sun position & reduce tilt and roll
Helmholtz-Zentrum Geesthacht (Krasseman)
Above-water manned: hyperspectral Data; 400– 900 nm; 10 nm resolution
TRIOS RAMSES Hyperspectral
(7 º) Radiometers
Laboratoire d’Océanographie de Villefranche-sur-Mer (Claustre)
In water: ProVal float system; multispectral data; 400– 900 nm; 10 nm resolution (20º)
SATLANTIC Multichannel radiometers
Institute of Oceanology of the Polish Academy of Sciences (Darecki)
Above-water manned: hyperspectral Data; 400– 900 nm; 10 nm resolution (7 º)?
TRIOS RAMSES Hyperspectral Radiometers?
Norwegian Institute for Water Research (Sorensen)
Above-water manned: hyperspectral Data; 400– 900 nm; 10 nm resolution (7 º)
TRIOS RAMSES Hyperspectral Radiometers
Stockholm University & Bio-Optika (Kratzer)
In-water autonomous fixed depth multispectral data; 400–700 nm; 10 nm resolution (20º)
TACCS: Tethered Attenuation Coefficient Chain Sensor
Sagremarisco Lda & Bio-Optika (Icely)
In-water autonomous fixed depth hyperspectral data; 350–800 nm; 11 nm resolution (18º)
TACCS
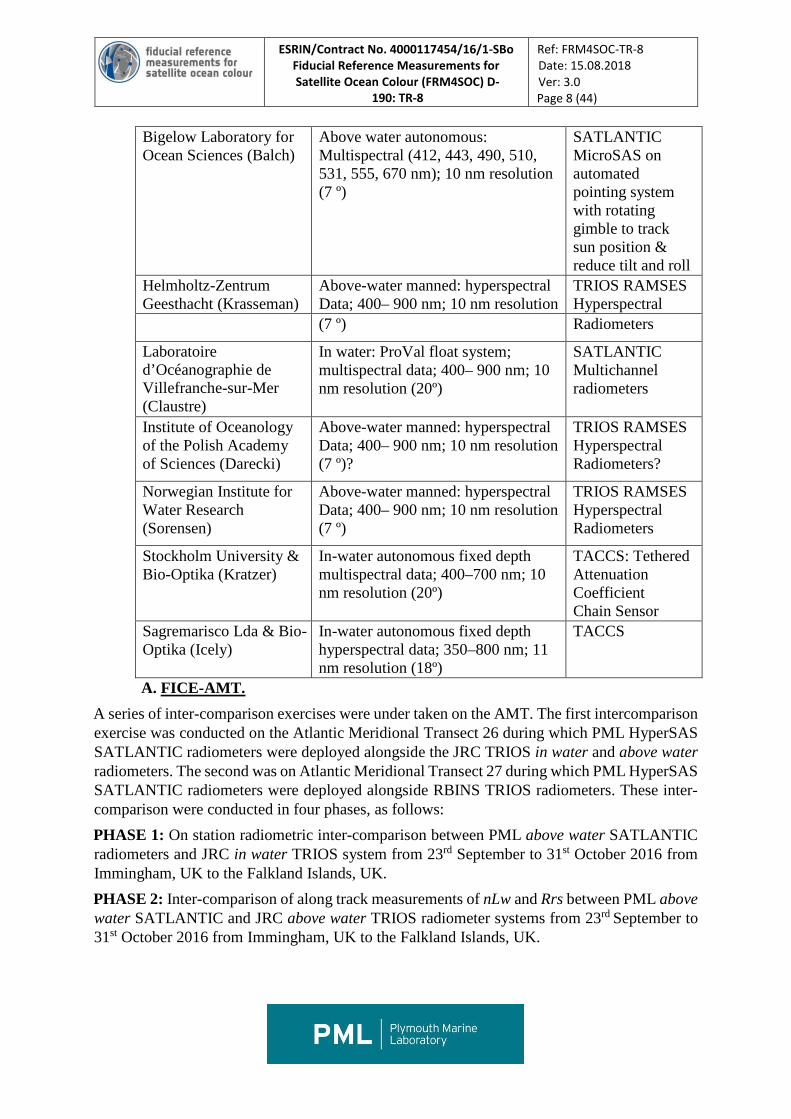
A. FICE-AMT. A series of inter-comparison exercises were under taken on the AMT. The first intercomparison exercise was conducted on the Atlantic Meridional Transect 26 during which PML HyperSAS SATLANTIC radiometers were deployed alongside the JRC TRIOS in water and above water radiometers. The second was on Atlantic Meridional Transect 27 during which PML HyperSAS SATLANTIC radiometers were deployed alongside RBINS TRIOS radiometers. These inter-comparison were conducted in four phases, as follows: PHASE 1: On station radiometric inter-comparison between PML above water SATLANTIC radiometers and JRC in water TRIOS system from 23rd September to 31st October 2016 from Immingham, UK to the Falkland Islands, UK. PHASE 2: Inter-comparison of along track measurements of nLw and Rrs between PML above water SATLANTIC and JRC above water TRIOS radiometer systems from 23rd September to 31st October 2016 from Immingham, UK to the Falkland Islands, UK.
ESRIN/Contract No. 4000117454/16/1-SBo Fiducial Reference Measurements for Satellite Ocean Colour (FRM4SOC) D-
190: TR-8
Ref: FRM4SOC-TR-8 Date: 15.08.2018 Ver: 3.0 Page 9 (44)
PHASE 3: On station radiometric inter-comparison between PML, RBINS and TO radiometers from 23rd to 29th September 2017 from the National Oceanography Centre (NOC), Southampton, UK to the Azores, Portugal. PHASE 4: Conducted from 23rd September to 4th November 2017 from Southampton, UK to South Georgia and the Falkland Islands to compare along track measurements of nLw and Rrs between PML and TO radiometers only.
Background.
The AMT has been operated by the Plymouth Marine Laboratory (PML) in collaboration with NOC, Southampton for the past two decades. The cruise is conducted between the UK and the sparsely sampled South Atlantic during the annual passage from October to November of a NERC ship (RRS James Clark Ross, RRS James Cook or RRS Discovery). The transect covers several ocean provinces where key physical and biogeochemical variables such as chlorophyll, primary production, nutrients, temperature, salinity and oxygen are measured. The stations sampled are principally in the North and South Atlantic Gyres, but also the productive waters of the Celtic Sea, Patagonian Shelf and Equatorial upwelling zone are visited, which therefore offers a wide range of variability in which to conduct FICE for the FRM4SOC. There are few calibration / validation sites in the blue water oligotrophic gyres of the global oceans, because of the cost of accessing and maintaining measurement platforms in such remote locations. The NOAA moored buoy MOBY (off Hawaii) has been used during the US Sea viewing Wide-Field-of-view Sensor (SeaWiFS), Moderate-resolution Imaging Spectroradiometer (MODIS) and Visible Infrared Imaging Radiometer Suite (VIIRS) missions to provide vicarious calibration data to monitor and reference to satellite Level2 Reflectance (L2R) data. Both MOBY and BOUSSOLE (the CNRS, France optical moored buoy) provided this capability for MERIS, but there were few independent sites in deep blue, case 1 waters that are used for ocean colour validation. AMT therefore offers an excellent opportunity to conduct field inter-comparisons at these sites. The AMT has an excellent heritage for ocean colour (OC) satellite calibration and validation. At IOC in 2014 and 2015, AMT was heralded as one of NASA SeaWiFS 10 greatest highlights and it was recommended this ocean observing platform be funded to provide vital calibration / validation data for future satellite missions. AMT not only provided vital FRM data for the duration of the SeaWiFS mission but also served as a developmental and intercomparison platform for selecting the most accurate ocean colour algorithm for SeaWiFS. Many of the early AMTs in the late 1990s were financially supported by NASA for the early pre- and post-launch work on the SeaWiFS. This work included in-situ radiometric measurements to compare against the satellite derived values of water leaving radiance and coincidental measurements of chlorophyll for vicarious calibration and algorithm development. Recent AMTs have renewed the optical drive with continuous, highly accurate and well calibrated measurements of hyperspectral absorption, attenuation and backscatter (Inherent Optical Properties – IOPs) using an established optical flow-through set-up (WET Labs ECO-BB3 meter and WET Labs ACs; see Dall’Olmo et al. 2012) working from seawater from the ship’s clean flow-through system. Measurements of particulate absorption are calibrated with discrete HPLC chlorophyll measurements to derive continuous along-tack estimates of chlorophyll concentration (Brewin et al. 2014). This has resulted in unprecedented
ESRIN/Contract No. 4000117454/16/1-SBo Fiducial Reference Measurements for Satellite Ocean Colour (FRM4SOC) D-
190: TR-8
Ref: FRM4SOC-TR-8 Date: 15.08.2018 Ver: 3.0 Page 10 (44)
numbers of data points (e.g. 400 per cruise) for use in satellite validation work (e.g. Figure 1). PML have opportunistically taken coincident with hyperspectral radiometer measurements of water leaving radiance (SATLANTIC HYPERSAS; see Figure 2). The AMT-FICE will inter-compare the above-water measurements listed in Table 2, and the sensors and methods deployed by PML, JRC and RBINS (see Table 1) along a 7000 mile transect in both productive and coastal waters as well as the clearest waters in the Atlantic Ocean and under Sentinel -2 and -3 swaths additionally allowing multi-sensor comparisons at the time of satellite match-ups. Uncertainty budgets on instrument calibration, measurement platform and measurement processing will be computed to ensure measurement traceability to NIST/NPL standards based on calibrations before, during and after the cruises. This will contribute to quantification of the errors in these FRMs and also in level 2 OLCI products in open ocean Atlantic environments. The AMT-FICE will be conducted early in the project and before the main FICE at AAOT in July 2018, so that it can be used as a guide to the scheduled activities at the FICE. The AMT-FICE will enable the consortium to develop knowledge of potential biases between measurements made by instruments under a range of operational and in water optical conditions. The AMT is costly and would be beyond the resources available to a single task and Lead within this ITT. PML will provide the ship time, personnel (both scientific, technical and ship) and additional data (CTD, biogeochemical concentrations, IOPs) at no cost to the project. Small resources are sought to cover the travel expenses of RBINS to and from the ship and for construction of a dedicated radiometer mounting to enable such an inter-comparison on RRS Discovery. 3.2 QUANTIFYING DIFFERENCES BETWEEN METHODS. In-water radiometric continuous profiles are usually made by winch or freefall. The accuracy of the resulting radiometric products depends on the sampling depth interval and on the depth resolution (D’Alimonte et al., 2010; Zibordi et al. 2004a, 2012). In some environments (particularly coastal, case 2 waters), the heterogeneous nature of the optical properties, a high accuracy in in water radiometric products can only be determined by sampling close to the surface (e.g. TAACS in Table 1) and / or by producing a large number of measurements per unit depth (Zibordi et al., 2004b) as long as the variance in sensor tilt resulting from waves and currents is eliminated or reduced. In-water fixed-depth profiles are normally obtained from the deployment of optical sensors on buoys at fixed depths (e.g. Antoine et al. 2008) or from buoys with autonomous profiling systems (e.g. Laurenco et al. 2000; Zielinski et al. 2006). These OPMs are capable of measuring Lu and Ed simultaneous at multiple depths. Assuming that tilt is negligible, the accuracy of the radiometric products is a function of the fixed depths used for the optical sensors, the acquisition rate and duration of logging interval (Zibordi et al., 2009a; 2012). Above-water methods use measurements of total radiance from above the sea (LT), sky radiance Li and above water Ed(0+) which are used to determine Lw. The measurement geometry is determined by the sea-viewing angle, the sky-viewing angle and the difference between sun and sensor azimuth angles (Deschamps et al., 2004; Hooker et al., 2004; Zibordi et al., 2004b). The accuracy of Lw is dependent on the degree to which sun glint can be minimized which is normally done by choosing suitable measurement geometries (nominally +135º viewing angle; Mobley, 1999). The application of statistical filtering schemes on LT (Hooker et al., 2002a; Zibordi et al., 2002), correction methods based on known reflectance properties of seawater in
ESRIN/Contract No. 4000117454/16/1-SBo Fiducial Reference Measurements for Satellite Ocean Colour (FRM4SOC) D-
190: TR-8
Ref: FRM4SOC-TR-8 Date: 15.08.2018 Ver: 3.0 Page 11 (44)
the near-infrared (Ruddick et al., 2006), or polarisers to directly reduce sky- and sun glint (Fougnie et al., 1999) can also be used to minimise glint effects. Each of these factors in the different methods will be considered in the FICE and the uncertainties arising from them will be calculated.
3.3 COMPARISON OVERVIEW Table 2. FRM products that will be inter-compared during the FICE-AAOT and FICE-AMT.
Fiducial Reference Measurement Abbreviation Units Above water Apparent Optical properties
AOPs
Remote sensing reflectance Rrs= Lu/Ed sr-1 Normalised water leaving radiance nLw mW cm-1 m-1 sr-1 In water Apparent Optical properties AOPs Photosynthetically active radiation PAR E m-2 s-1 Attenuation coefficient Kd m-1 Euphotic depth Zeu m Downwelling Irradiance Ed mW cm-1 m-1 Upwelling radiance Lu mW cm-1 m-1 Upwelling irradiance Eu mW cm-1 m-1
Overview of AAOT:
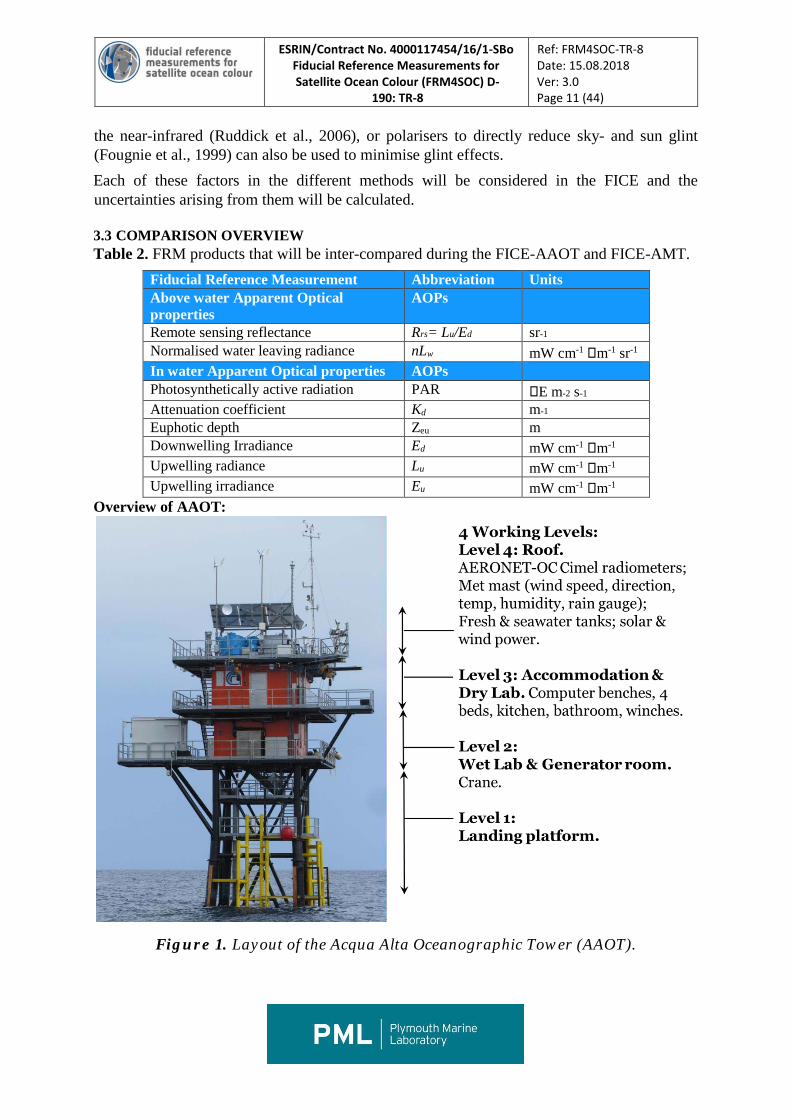
Figure 1. Layout of the Acqua Alta Oceanographic Tower (AAOT).
ESRIN/Contract No. 4000117454/16/1-SBo Fiducial Reference Measurements for Satellite Ocean Colour (FRM4SOC) D-
190: TR-8
Ref: FRM4SOC-TR-8 Date: 15.08.2018 Ver: 3.0 Page 12 (44)
Background. The Acqua Alta Oceanographic Tower (AAOT) off the Gulf of Venice, Italy, in the northern Adriatic Sea is a purpose built steel tower with a platform containing an instrument house to facilitate the measurement of ocean properties under exceptionably stable conditions (Fig. 1). The platform has a long history of optical measurements to support and validate both NASA and ESA ocean colour missions (Zibordi et al. 2006; 2009b). Maximum water depth around the AAOT is 13.6 m. The average chlorophyll-a concentration during July is 0.9±0.3 mg m-3, total suspended matter content is TSM is 1.8±0.4 g m-3, and absorption coefficient of coloured dissolved organic matter at 412 nm (aCDOM(412)) is 0.17±0.03 m-1 (Zibordi et al. 2012).
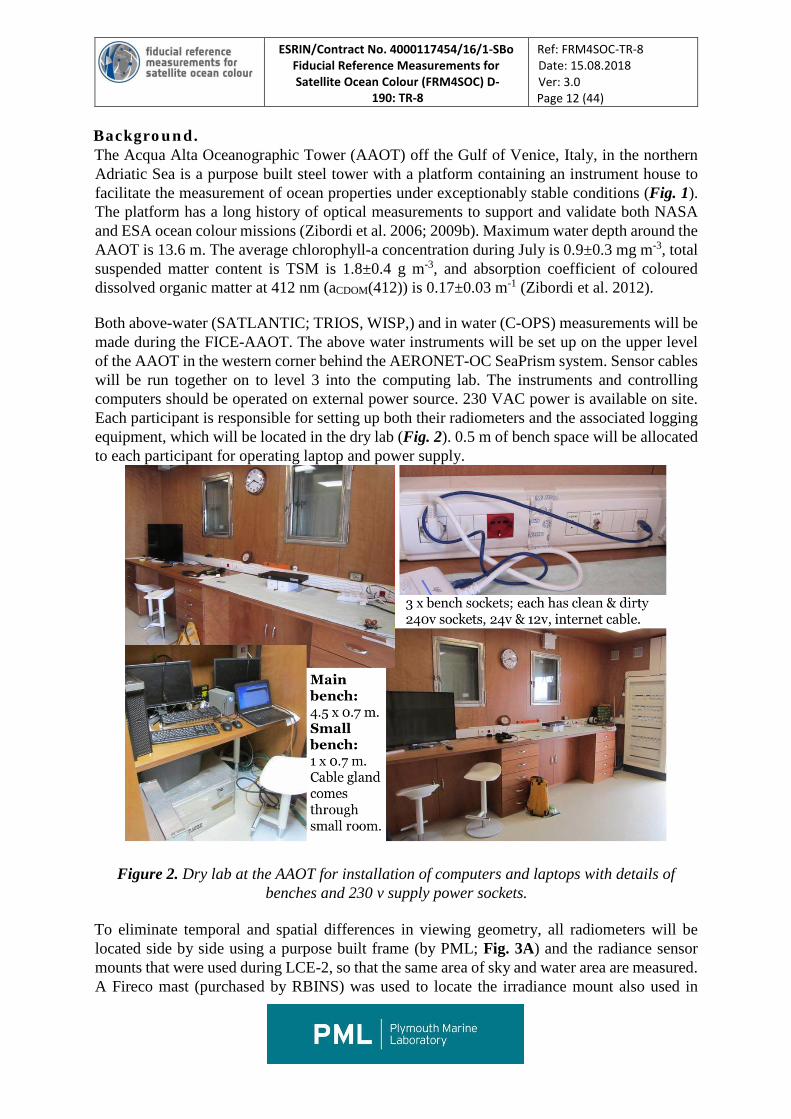
Both above-water (SATLANTIC; TRIOS, WISP,) and in water (C-OPS) measurements will be made during the FICE-AAOT. The above water instruments will be set up on the upper level of the AAOT in the western corner behind the AERONET-OC SeaPrism system. Sensor cables will be run together on to level 3 into the computing lab. The instruments and controlling computers should be operated on external power source. 230 VAC power is available on site. Each participant is responsible for setting up both their radiometers and the associated logging equipment, which will be located in the dry lab (Fig. 2). 0.5 m of bench space will be allocated to each participant for operating laptop and power supply.
Figure 2. Dry lab at the AAOT for installation of computers and laptops with details of benches and 230 v supply power sockets.
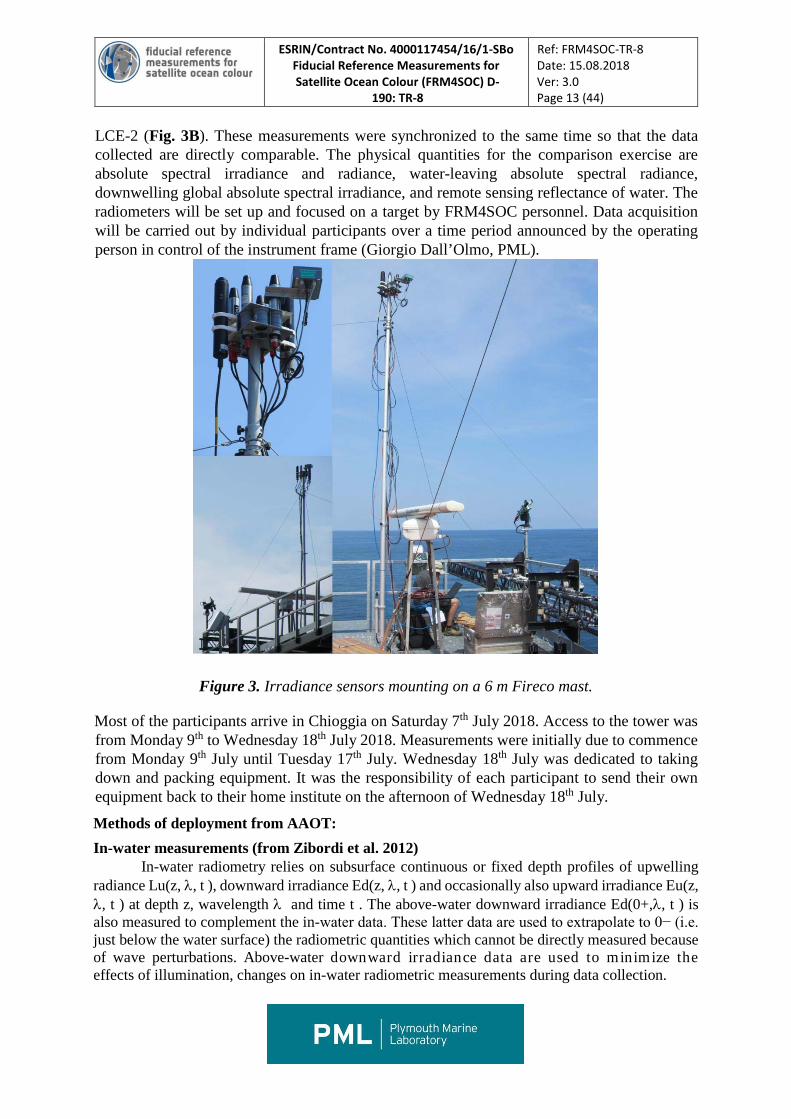
To eliminate temporal and spatial differences in viewing geometry, all radiometers will be located side by side using a purpose built frame (by PML; Fig. 3A) and the radiance sensor mounts that were used during LCE-2, so that the same area of sky and water area are measured. A Fireco mast (purchased by RBINS) was used to locate the irradiance mount also used in
ESRIN/Contract No. 4000117454/16/1-SBo Fiducial Reference Measurements for Satellite Ocean Colour (FRM4SOC) D-
190: TR-8
Ref: FRM4SOC-TR-8 Date: 15.08.2018 Ver: 3.0 Page 13 (44)
LCE-2 (Fig. 3B). These measurements were synchronized to the same time so that the data collected are directly comparable. The physical quantities for the comparison exercise are absolute spectral irradiance and radiance, water-leaving absolute spectral radiance, downwelling global absolute spectral irradiance, and remote sensing reflectance of water. The radiometers will be set up and focused on a target by FRM4SOC personnel. Data acquisition will be carried out by individual participants over a time period announced by the operating person in control of the instrument frame (Giorgio Dall’Olmo, PML).
Figure 3. Irradiance sensors mounting on a 6 m Fireco mast.
Most of the participants arrive in Chioggia on Saturday 7th July 2018. Access to the tower was from Monday 9th to Wednesday 18th July 2018. Measurements were initially due to commence from Monday 9th July until Tuesday 17th July. Wednesday 18th July was dedicated to taking down and packing equipment. It was the responsibility of each participant to send their own equipment back to their home institute on the afternoon of Wednesday 18th July.
Methods of deployment from AAOT: In-water measurements (from Zibordi et al. 2012)
In-water radiometry relies on subsurface continuous or fixed depth profiles of upwelling radiance Lu(z, λ, t ), downward irradiance Ed(z, λ, t ) and occasionally also upward irradiance Eu(z, λ, t ) at depth z, wavelength λ and time t . The above-water downward irradiance Ed(0+,λ, t ) is also measured to complement the in-water data. These latter data are used to extrapolate to 0− (i.e. just below the water surface) the radiometric quantities which cannot be directly measured because of wave perturbations. Above-water downward irradiance data are used to minimize the effects of illumination, changes on in-water radiometric measurements during data collection.
ESRIN/Contract No. 4000117454/16/1-SBo Fiducial Reference Measurements for Satellite Ocean Colour (FRM4SOC) D-
190: TR-8
Ref: FRM4SOC-TR-8 Date: 15.08.2018 Ver: 3.0 Page 14 (44)
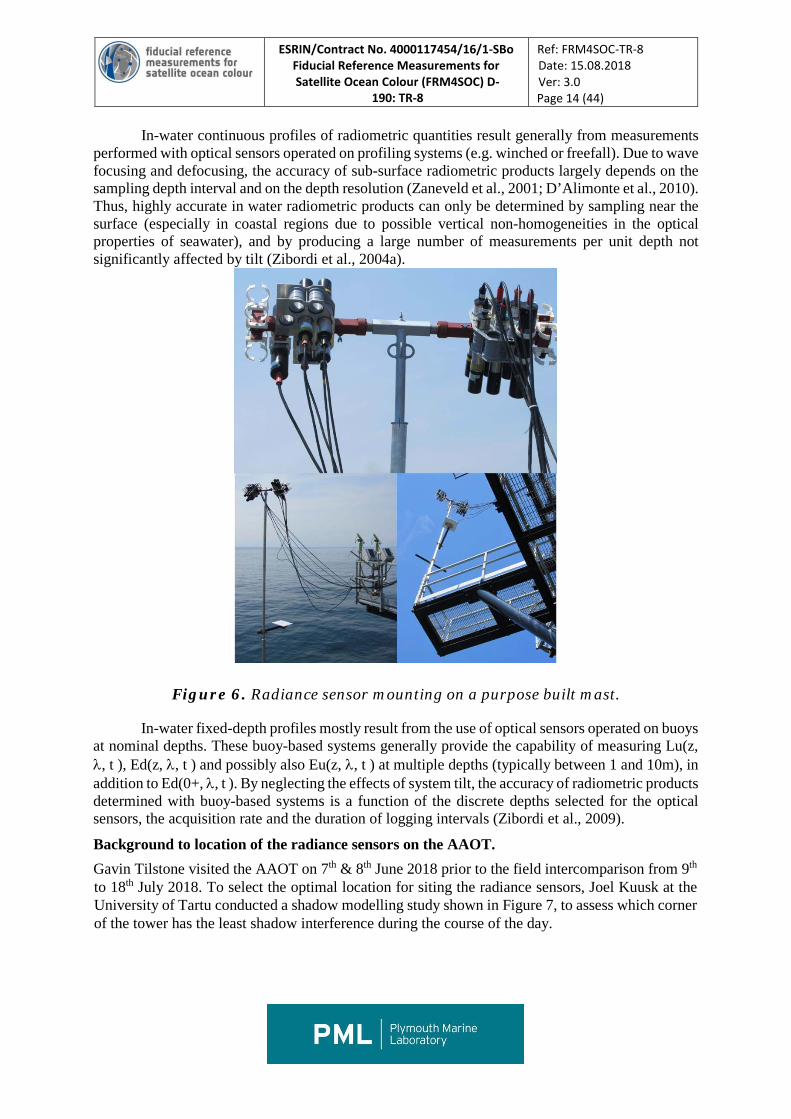
In-water continuous profiles of radiometric quantities result generally from measurements performed with optical sensors operated on profiling systems (e.g. winched or freefall). Due to wave focusing and defocusing, the accuracy of sub-surface radiometric products largely depends on the sampling depth interval and on the depth resolution (Zaneveld et al., 2001; D’Alimonte et al., 2010). Thus, highly accurate in water radiometric products can only be determined by sampling near the surface (especially in coastal regions due to possible vertical non-homogeneities in the optical properties of seawater), and by producing a large number of measurements per unit depth not significantly affected by tilt (Zibordi et al., 2004a).
Figure 6. Radiance sensor mounting on a purpose built mast.
In-water fixed-depth profiles mostly result from the use of optical sensors operated on buoys at nominal depths. These buoy-based systems generally provide the capability of measuring Lu(z, λ, t ), Ed(z, λ, t ) and possibly also Eu(z, λ, t ) at multiple depths (typically between 1 and 10m), in addition to Ed(0+, λ, t ). By neglecting the effects of system tilt, the accuracy of radiometric products determined with buoy-based systems is a function of the discrete depths selected for the optical sensors, the acquisition rate and the duration of logging intervals (Zibordi et al., 2009).
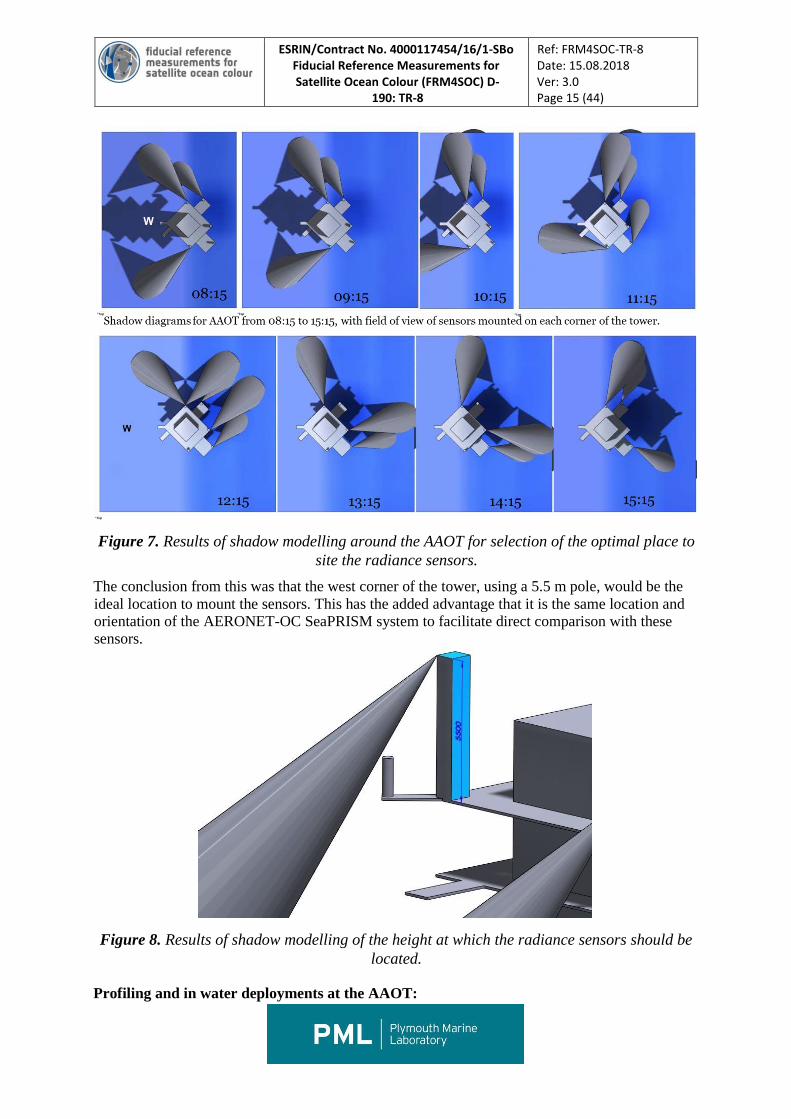
Background to location of the radiance sensors on the AAOT. Gavin Tilstone visited the AAOT on 7th & 8th June 2018 prior to the field intercomparison from 9th to 18th July 2018. To select the optimal location for siting the radiance sensors, Joel Kuusk at the University of Tartu conducted a shadow modelling study shown in Figure 7, to assess which corner of the tower has the least shadow interference during the course of the day.
ESRIN/Contract No. 4000117454/16/1-SBo Fiducial Reference Measurements for Satellite Ocean Colour (FRM4SOC) D-
190: TR-8
Ref: FRM4SOC-TR-8 Date: 15.08.2018 Ver: 3.0 Page 15 (44)
Figure 7. Results of shadow modelling around the AAOT for selection of the optimal place to site the radiance sensors.
The conclusion from this was that the west corner of the tower, using a 5.5 m pole, would be the ideal location to mount the sensors. This has the added advantage that it is the same location and orientation of the AERONET-OC SeaPRISM system to facilitate direct comparison with these sensors.
Figure 8. Results of shadow modelling of the height at which the radiance sensors should be located.
Profiling and in water deployments at the AAOT:
ESRIN/Contract No. 4000117454/16/1-SBo Fiducial Reference Measurements for Satellite Ocean Colour (FRM4SOC) D-
190: TR-8
Ref: FRM4SOC-TR-8 Date: 15.08.2018 Ver: 3.0 Page 16 (44)
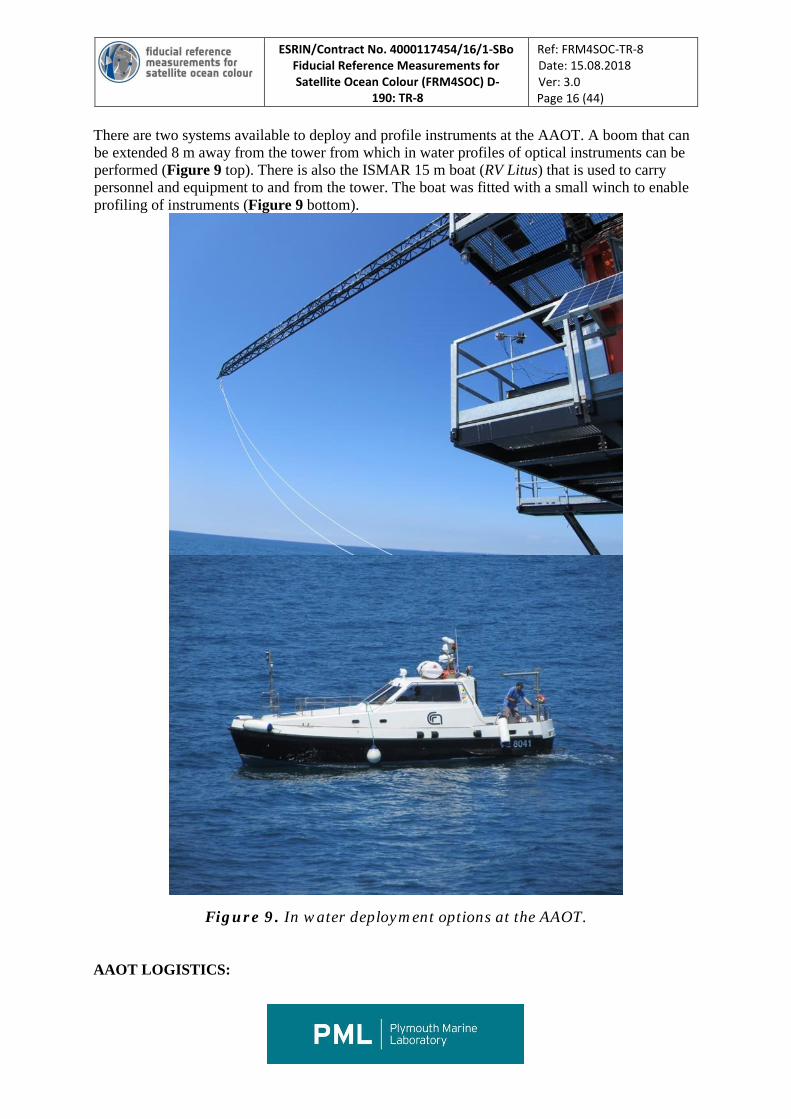
There are two systems available to deploy and profile instruments at the AAOT. A boom that can be extended 8 m away from the tower from which in water profiles of optical instruments can be performed (Figure 9 top). There is also the ISMAR 15 m boat (RV Litus) that is used to carry personnel and equipment to and from the tower. The boat was fitted with a small winch to enable profiling of instruments (Figure 9 bottom).
Figure 9. In water deployment options at the AAOT.
AAOT LOGISTICS:

ESRIN/Contract No. 4000117454/16/1-SBo Fiducial Reference Measurements for Satellite Ocean Colour (FRM4SOC) D-
190: TR-8
Ref: FRM4SOC-TR-8 Date: 15.08.2018 Ver: 3.0 Page 17 (44)
On 9th July, the radiometers were delivered to the AAOT Jetty from ISMAR and personnel were transferred by boat from the Jetty to the AAOT. The inter-comparison will finish on 18 July 2018 when you will pack-up your sensors. You will be responsible for organising your own shipment of your radiometers on the afternoon of 18th July 2018. This should be organised prior to travelling to Venice.
AAOT DAILY SCHEDULE: • Boat pick up – 08:00 from Jetty.
• Arrival at AAOT – 9:30
• MEASUREMENTS START – 10:00
• Lunch – 12:30 – 13:00 (Food will be supplied by the sailors on board the AAOT).
• MEASUREMENTS STOP 15:30
• Travel back to Hotel 17:00.
• Data Processing – from 17:30 – 18:30 OR Weather pending, there may be other opportunities during the week to work up data.
FICE-AAOT ANCILLARY measurements: In water Inherent Optical Properties (ap, cp from WET Labs AC-S; bbp from WET Labs BB3. Discrete samples for the analysis
A. FICE-AMT. The Atlantic Meridional Transect (AMT) has been operated by the Plymouth Marine Laboratory (PML) in collaboration with National Oceanography Centre (NOC) Southampton for the past two decades. The cruise is conducted between the UK and the sparsely sampled South Atlantic during the annual passage from October to November of a NERC ship (RRS James Clark Ross, RRS James Cook or RRS Discovery). The transect covers several ocean provinces where key physical and biogeochemical variables such as chlorophyll, primary production, nutrients, temperature, salinity and oxygen are measured. The stations sampled are principally in the North and South Atlantic Gyres, but also the productive waters of the Celtic Sea, Patagonian Shelf and Equatorial upwelling zone are visited, which therefore offers a wide range of variability in which to conduct FICE for the FRM4SOC. There are few calibration / validation sites in the blue water oligotrophic gyres of the global oceans, because of the cost of accessing and maintaining measurement platforms in such remote locations. The NOAA moored buoy MOBY (off Hawaii) has been used during the US Sea viewing Wide-Field-of-view Sensor (SeaWiFS), Moderate-resolution Imaging Spectroradiometer (MODIS) and Visible Infrared Imaging Radiometer Suite (VIIRS) missions to provide vicarious calibration data to monitor and reference to satellite Level2 Reflectance (L2R) data. Both MOBY and BOUSSOLE (the CNRS, France optical moored buoy) provided this capability for MERIS, but there were few independent sites in deep blue, case 1 waters that are used for ocean colour validation. AMT therefore offers an excellent opportunity to conduct field inter-comparisons at these sites.
ESRIN/Contract No. 4000117454/16/1-SBo Fiducial Reference Measurements for Satellite Ocean Colour (FRM4SOC) D-
190: TR-8
Ref: FRM4SOC-TR-8 Date: 15.08.2018 Ver: 3.0 Page 18 (44)
The AMT has an excellent heritage for ocean colour (OC) satellite calibration and validation. At IOC in 2014 and 2015, AMT was heralded as one of NASA SeaWiFS 10 greatest highlights and it was recommended this ocean observing platform be funded to provide vital calibration / validation data for future satellite missions. AMT not only provided vital FRM data for the duration of the SeaWiFS mission but also served as a developmental and inter-comparison platform for selecting the most accurate ocean colour algorithm for SeaWiFS. Many of the early AMTs in the late 1990s were financially supported by NASA for the early pre- and post-launch work on the SeaWiFS. This work included in-situ radiometric measurements to compare against the satellite derived values of water leaving radiance and coincidental measurements of chlorophyll for vicarious calibration and algorithm development. Recent AMTs have renewed the optical drive with continuous, highly accurate and well calibrated measurements of hyperspectral absorption, attenuation and backscatter (Inherent Optical Properties – IOPs) using an established optical flow-through set-up (WET Labs ECO-BB3 meter and WET Labs ACs; see Dall’Olmo et al. 2012) working from seawater from the ship’s clean flow-through system. Measurements of particulate absorption are calibrated with discrete HPLC chlorophyll measurements to derive continuous along-tack estimates of chlorophyll concentration (Brewin et al. 2014). This has resulted in unprecedented numbers of data points (e.g. 400 per cruise) for use in satellite validation work (e.g. Figure 10). PML have opportunistically taken coincident with hyperspectral radiometer measurements of water leaving radiance (SATLANTIC HYPERSAS; see Figure 11). The AMT-FICE will inter-compare the above-water measurements listed in Table 4, and the sensors and methods deployed by PML, JRC and RBINS (see also Table 4) along a 4000 mile transect in both productive and coastal waters as well as the clearest waters in the Atlantic Ocean and under Sentinel 2 and 3 swaths additionally allowing multisensor comparisons at the time of satellite match-ups. Uncertainty budgets on instrument calibration, measurement platform and measurement processing will be computed to ensure measurement traceability to NIST/NPL standards based on calibrations before, during and after the cruises. This will contribute to quantification of the errors in these FRMs and also in level 2 OLCI products in open ocean Atlantic environments. The AMT-FICE was conducted early in the project on AMT26 from 4 September to 11 October 2016 so that these initial ship-borne comparisons were used to guide the main FICE at AAOT in 2017. The AMT-FICE enabled the consortium to develop knowledge of potential biases between measurements made by instruments under a range of operational and in water optical conditions. The AMT is costly and would be beyond the resources available to a single task and Lead within this ITT. PML will provide the ship time, personnel (both scientific, technical and ship) and additional data (CTD, biogeochemical concentrations, IOPs) at no cost to the project. Small resources are sought to cover the travel expenses of RBINS to and from the ship. 1.2. Campaign management and planning approach. PML has managed the AMT programme for 20 years and has extensive experience in campaign organization and implementation. A description of the campaign management and planning approach based on existing procedures includes the following:
• Cruise planning begins 20 months in advance of the cruise. For the AMT4SentinelFRM campaign (AMT27 – DY084) the Ship-time & Marine Equipment Application Form (SMEAF) was submitted to NERC Marine Planning in March 2017. Approval was given in August 2017. A copy of the SME will be made available to ESA if required. Way points of the cruise track are listed in Table 3.
ESRIN/Contract No. 4000117454/16/1-SBo Fiducial Reference Measurements for Satellite Ocean Colour (FRM4SOC) D-
190: TR-8
Ref: FRM4SOC-TR-8 Date: 15.08.2018 Ver: 3.0 Page 19 (44)
• The ship time will be provided by the Natural Environment Research Council (NERC) on RRS Discovery. Marine equipment, infrastructure and technical support was provided by National Marine Facilities (NMF). A suite of core biogeochemical data (listed in Table 4) were also collected by PML and NOCS scientists. The core costs of the ship-time, infrastructure and technical support and the AMT core parameters, are funded through UK government NERC “National Capability”.
• A provisional planning meeting with BAS and NMF was held by teleconference in April 2017.
• A follow up meeting was held in May 2017 with BAS ship managers and NMF marine equipment supplies to firm up logistical arrangements for the campaign.
• Diplomatic clearance requests will be submitted to BAS by June 2017. • All cruise participants and stakeholders will be invited to a cruise planning workshop at
PML in June 2017. • COSHH, RISK and campaign execution questionnaires will be coordinated by PML prior
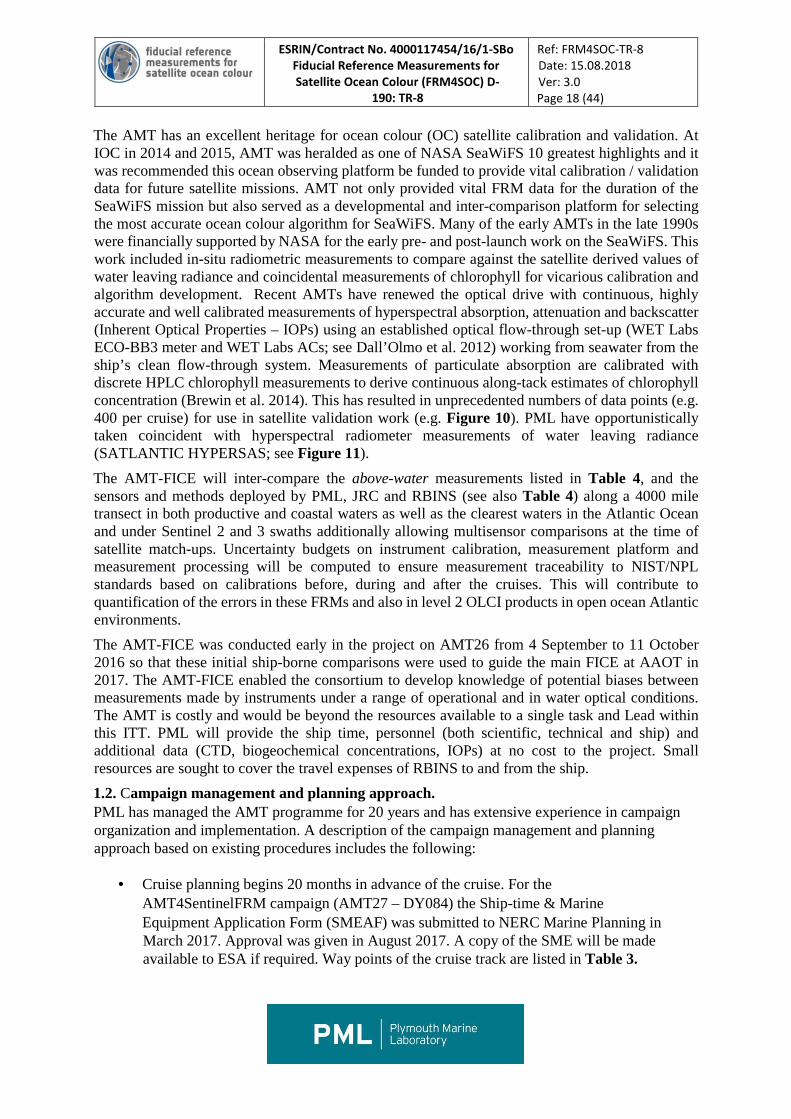
to submission to BAS in August 2017. This is supported via an interactive web site, an example of which is provided in Fig. 10.
• Campaign mobilisation started in Southampton, UK on 18th September 2017, and departed Port on 23rd September and arrived in Port Stanley, The Falkland Islands on 5th November 2017.
• A cruise report was compiled and submitted during December 2017.
Figure 10. Example web site managed by PML, to plan and execute ground campaigns.
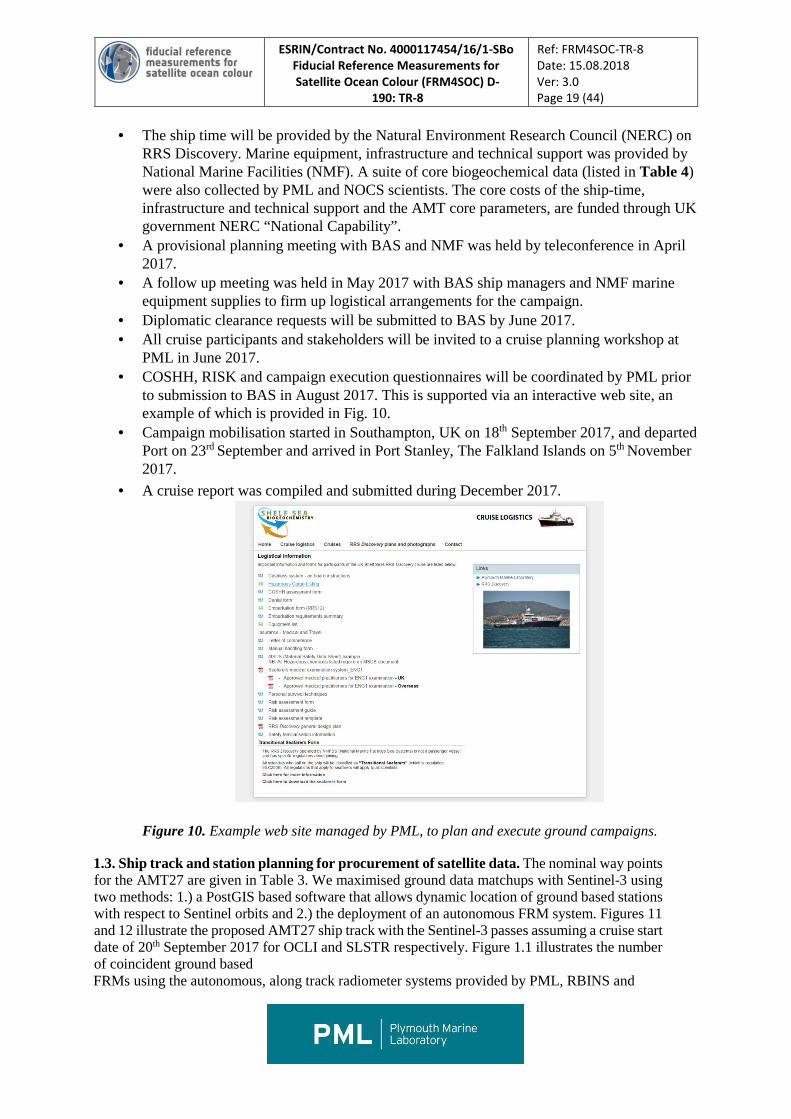
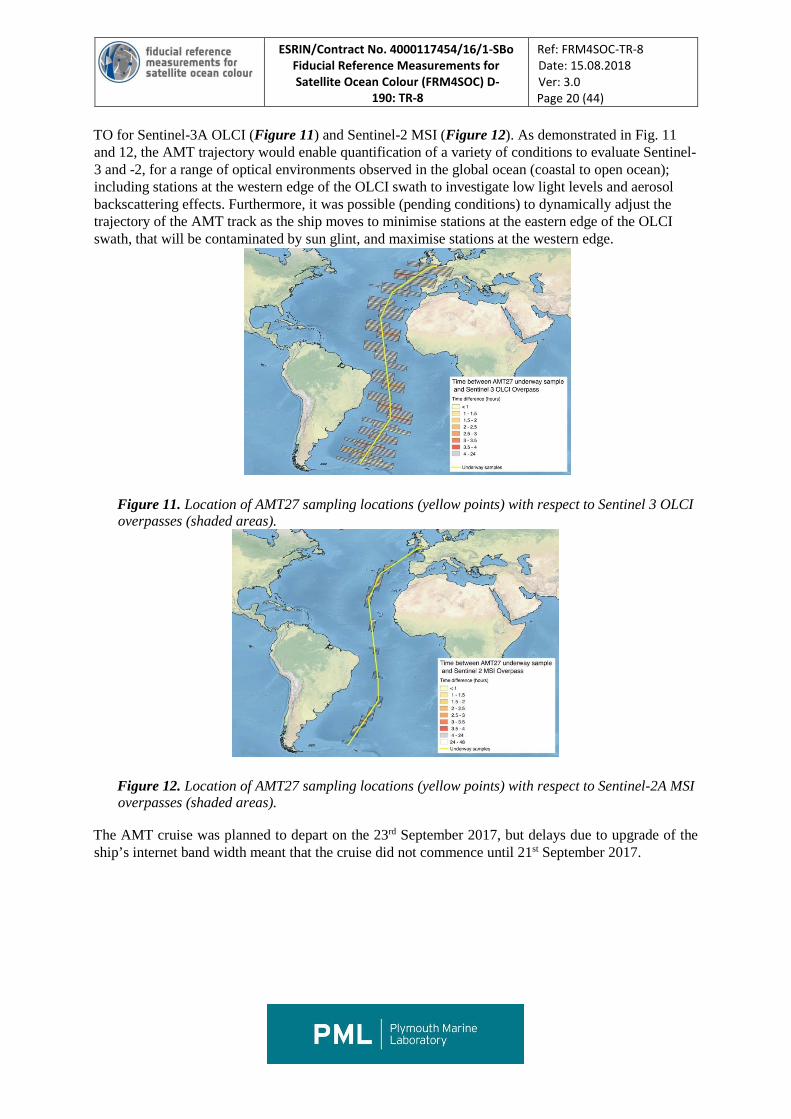
1.3. Ship track and station planning for procurement of satellite data. The nominal way points for the AMT27 are given in Table 3. We maximised ground data matchups with Sentinel-3 using two methods: 1.) a PostGIS based software that allows dynamic location of ground based stations with respect to Sentinel orbits and 2.) the deployment of an autonomous FRM system. Figures 11 and 12 illustrate the proposed AMT27 ship track with the Sentinel-3 passes assuming a cruise start date of 20th September 2017 for OCLI and SLSTR respectively. Figure 1.1 illustrates the number of coincident ground based FRMs using the autonomous, along track radiometer systems provided by PML, RBINS and
ESRIN/Contract No. 4000117454/16/1-SBo Fiducial Reference Measurements for Satellite Ocean Colour (FRM4SOC) D-
190: TR-8
Ref: FRM4SOC-TR-8 Date: 15.08.2018 Ver: 3.0 Page 20 (44)
TO for Sentinel-3A OLCI (Figure 11) and Sentinel-2 MSI (Figure 12). As demonstrated in Fig. 11 and 12, the AMT trajectory would enable quantification of a variety of conditions to evaluate Sentinel-3 and -2, for a range of optical environments observed in the global ocean (coastal to open ocean); including stations at the western edge of the OLCI swath to investigate low light levels and aerosol backscattering effects. Furthermore, it was possible (pending conditions) to dynamically adjust the trajectory of the AMT track as the ship moves to minimise stations at the eastern edge of the OLCI swath, that will be contaminated by sun glint, and maximise stations at the western edge.
Figure 11. Location of AMT27 sampling locations (yellow points) with respect to Sentinel 3 OLCI overpasses (shaded areas).
Figure 12. Location of AMT27 sampling locations (yellow points) with respect to Sentinel-2A MSI overpasses (shaded areas).
The AMT cruise was planned to depart on the 23rd September 2017, but delays due to upgrade of the ship’s internet band width meant that the cruise did not commence until 21st September 2017.
ESRIN/Contract No. 4000117454/16/1-SBo Fiducial Reference Measurements for Satellite Ocean Colour (FRM4SOC) D-
190: TR-8
Ref: FRM4SOC-TR-8 Date: 15.08.2018 Ver: 3.0 Page 21 (44)
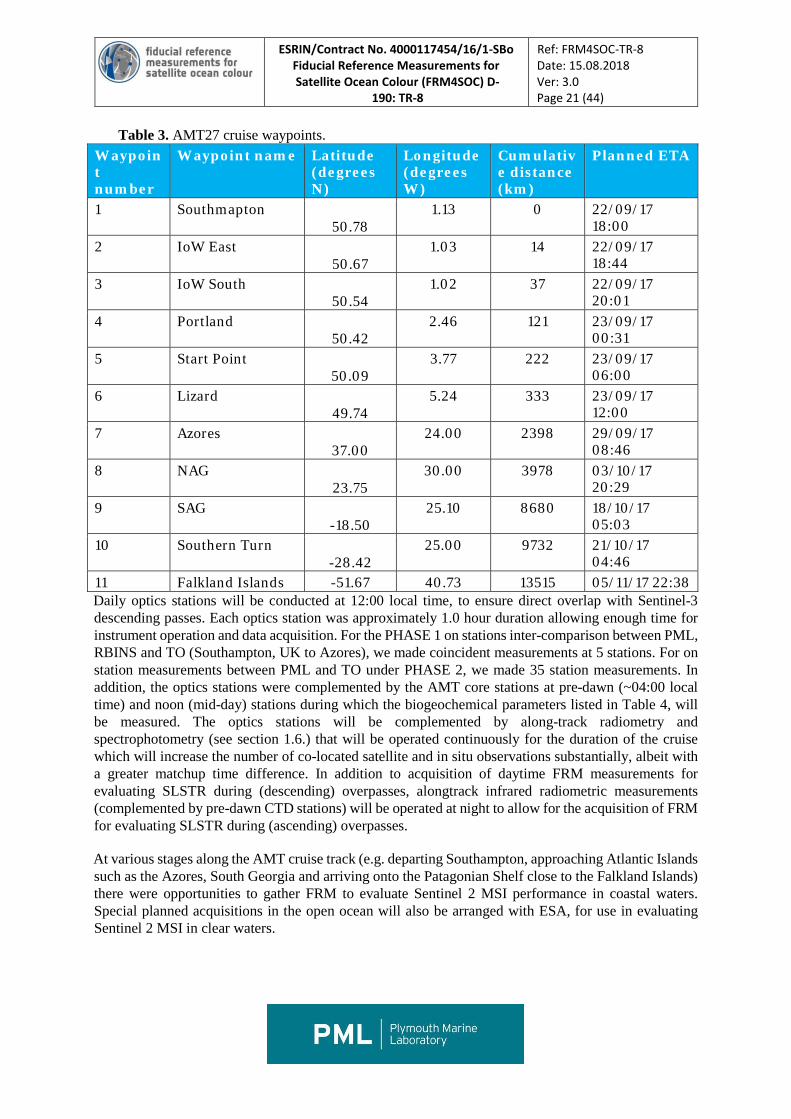
Table 3. AMT27 cruise waypoints. Waypoin t number
Waypoint name Latitude (degrees N)
Longitude (degrees W)
Cumulativ e distance (km)
Planned ETA
1 Southmapton 50.78
1.13 0 22/09/17 18:00
2 IoW East 50.67
1.03 14 22/09/17 18:44
3 IoW South 50.54
1.02 37 22/09/17 20:01
4 Portland 50.42
2.46 121 23/09/17 00:31
5 Start Point 50.09
3.77 222 23/09/17 06:00
6 Lizard 49.74
5.24 333 23/09/17 12:00
7 Azores 37.00
24.00 2398 29/09/17 08:46
8 NAG 23.75
30.00 3978 03/10/17 20:29
9 SAG -18.50
25.10 8680 18/10/17 05:03
10 Southern Turn -28.42
25.00 9732 21/10/17 04:46
11 Falkland Islands -51.67 40.73 13515 05/11/17 22:38 Daily optics stations will be conducted at 12:00 local time, to ensure direct overlap with Sentinel-3 descending passes. Each optics station was approximately 1.0 hour duration allowing enough time for instrument operation and data acquisition. For the PHASE 1 on stations inter-comparison between PML, RBINS and TO (Southampton, UK to Azores), we made coincident measurements at 5 stations. For on station measurements between PML and TO under PHASE 2, we made 35 station measurements. In addition, the optics stations were complemented by the AMT core stations at pre-dawn (~04:00 local time) and noon (mid-day) stations during which the biogeochemical parameters listed in Table 4, will be measured. The optics stations will be complemented by along-track radiometry and spectrophotometry (see section 1.6.) that will be operated continuously for the duration of the cruise which will increase the number of co-located satellite and in situ observations substantially, albeit with a greater matchup time difference. In addition to acquisition of daytime FRM measurements for evaluating SLSTR during (descending) overpasses, alongtrack infrared radiometric measurements (complemented by pre-dawn CTD stations) will be operated at night to allow for the acquisition of FRM for evaluating SLSTR during (ascending) overpasses.
At various stages along the AMT cruise track (e.g. departing Southampton, approaching Atlantic Islands such as the Azores, South Georgia and arriving onto the Patagonian Shelf close to the Falkland Islands) there were opportunities to gather FRM to evaluate Sentinel 2 MSI performance in coastal waters. Special planned acquisitions in the open ocean will also be arranged with ESA, for use in evaluating Sentinel 2 MSI in clear waters.
ESRIN/Contract No. 4000117454/16/1-SBo Fiducial Reference Measurements for Satellite Ocean Colour (FRM4SOC) D-
190: TR-8
Ref: FRM4SOC-TR-8 Date: 15.08.2018 Ver: 3.0 Page 22 (44)
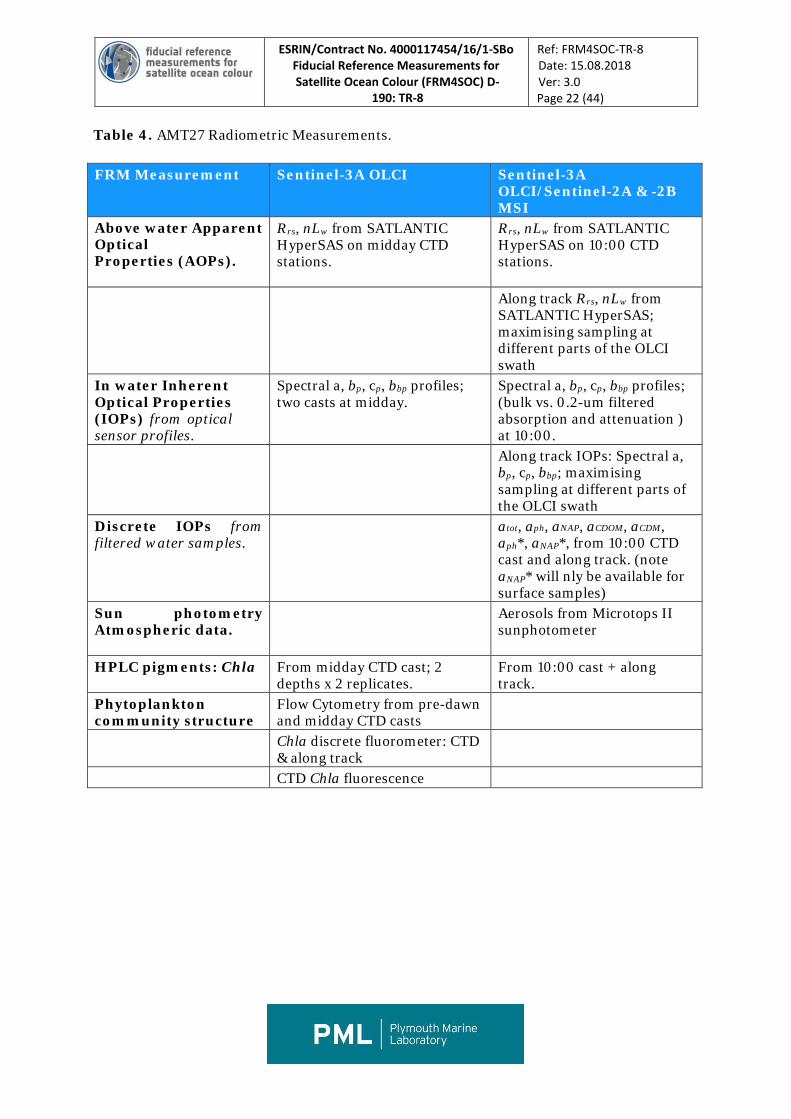
Table 4. AMT27 Radiometric Measurements.
FRM Measurement Sentinel-3A OLCI Sentinel-3A OLCI/Sentinel-2A & -2B MSI
Above water Apparent Optical Properties (AOPs).
Rrs, nLw from SATLANTIC HyperSAS on midday CTD stations.
Rrs, nLw from SATLANTIC HyperSAS on 10:00 CTD stations.
Along track Rrs, nLw from SATLANTIC HyperSAS; maximising sampling at different parts of the OLCI swath
In water Inherent Optical Properties (IOPs) from optical sensor profiles.
Spectral a, bp, cp, bbp profiles; two casts at midday.
Spectral a, bp, cp, bbp profiles; (bulk vs. 0.2-um filtered absorption and attenuation ) at 10:00.
Along track IOPs: Spectral a, bp, cp, bbp; maximising sampling at different parts of the OLCI swath
Discrete IOPs from filtered water samples.
atot, aph, aNAP, aCDOM, aCDM, aph*, aNAP*, from 10:00 CTD cast and along track. (note aNAP* will nly be available for surface samples)
Sun photometry Atmospheric data.
Aerosols from Microtops II sunphotometer
HPLC pigments: Chla From midday CTD cast; 2 depths x 2 replicates.
From 10:00 cast + along track.
Phytoplankton community structure
Flow Cytometry from pre-dawn and midday CTD casts
Chla discrete fluorometer: CTD & along track
CTD Chla fluorescence
ESRIN/Contract No. 4000117454/16/1-SBo Fiducial Reference Measurements for Satellite Ocean Colour (FRM4SOC) D-
190: TR-8
Ref: FRM4SOC-TR-8 Date: 15.08.2018 Ver: 3.0 Page 23 (44)
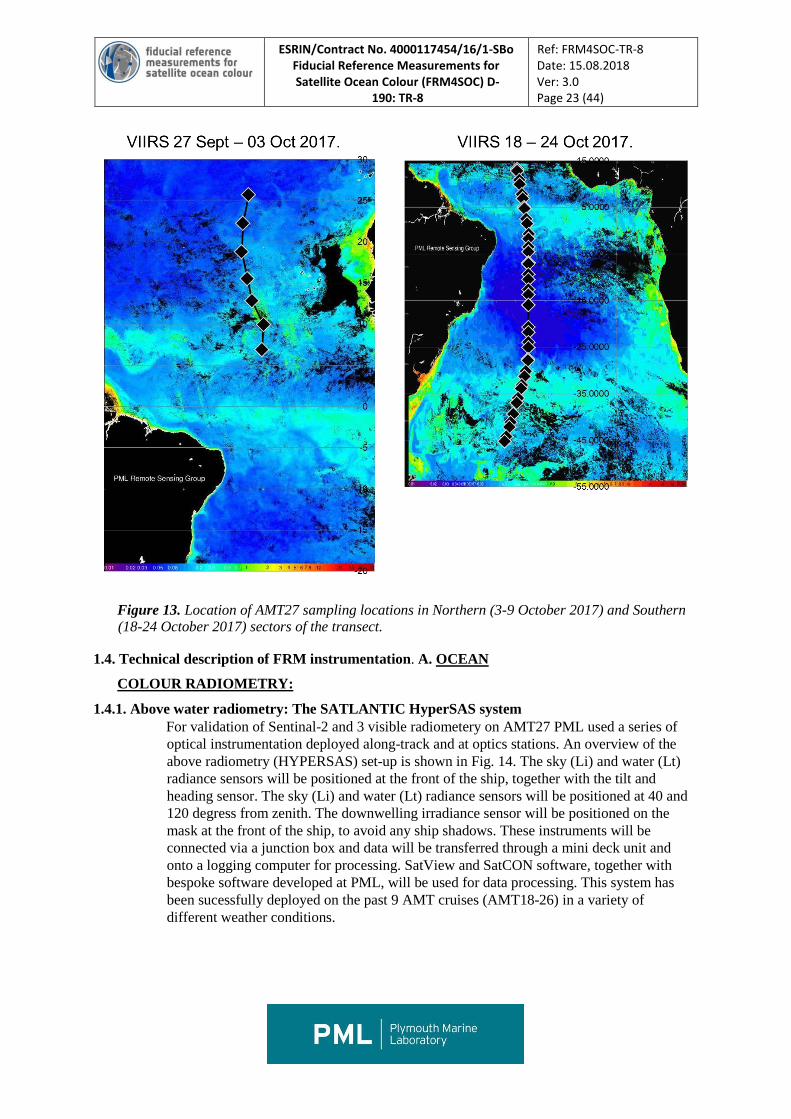
Figure 13. Location of AMT27 sampling locations in Northern (3-9 October 2017) and Southern (18-24 October 2017) sectors of the transect.
1.4. Technical description of FRM instrumentation. A. OCEAN
COLOUR RADIOMETRY:
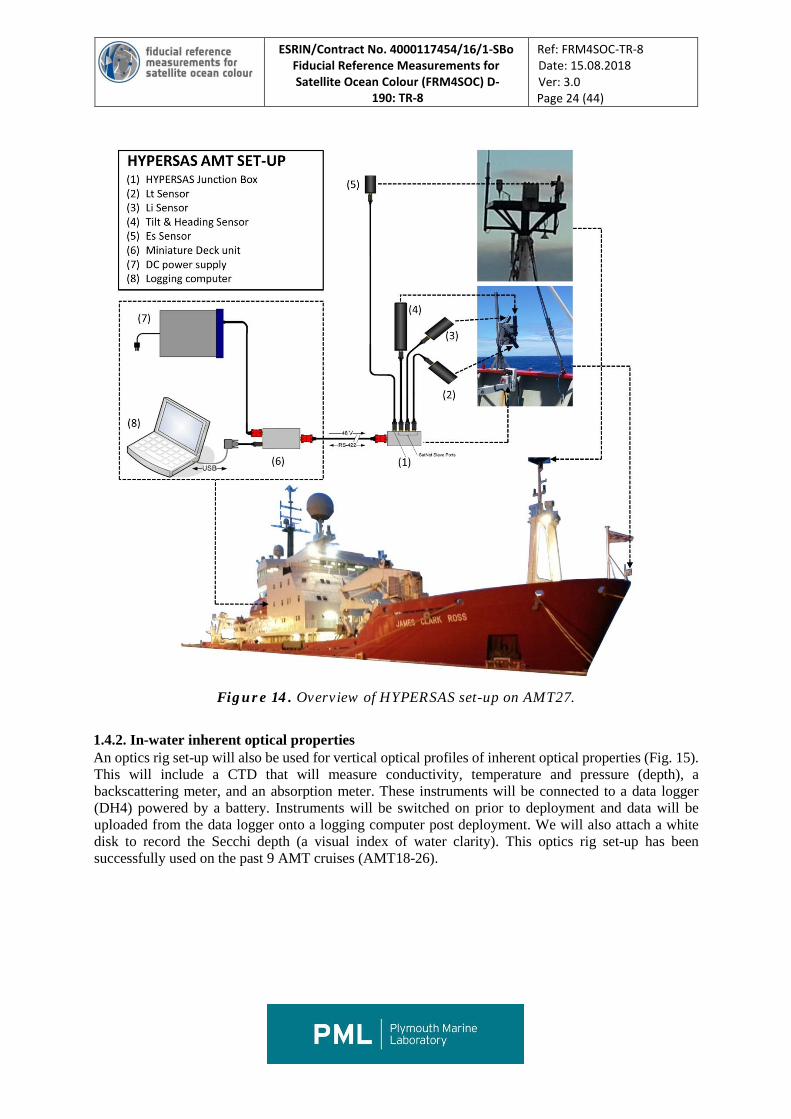
1.4.1. Above water radiometry: The SATLANTIC HyperSAS system For validation of Sentinal-2 and 3 visible radiometery on AMT27 PML used a series of optical instrumentation deployed along-track and at optics stations. An overview of the above radiometry (HYPERSAS) set-up is shown in Fig. 14. The sky (Li) and water (Lt) radiance sensors will be positioned at the front of the ship, together with the tilt and heading sensor. The sky (Li) and water (Lt) radiance sensors will be positioned at 40 and 120 degress from zenith. The downwelling irradiance sensor will be positioned on the mask at the front of the ship, to avoid any ship shadows. These instruments will be connected via a junction box and data will be transferred through a mini deck unit and onto a logging computer for processing. SatView and SatCON software, together with bespoke software developed at PML, will be used for data processing. This system has been sucessfully deployed on the past 9 AMT cruises (AMT18-26) in a variety of different weather conditions.
ESRIN/Contract No. 4000117454/16/1-SBo Fiducial Reference Measurements for Satellite Ocean Colour (FRM4SOC) D-
190: TR-8
Ref: FRM4SOC-TR-8 Date: 15.08.2018 Ver: 3.0 Page 24 (44)
Figure 14. Overview of HYPERSAS set-up on AMT27.
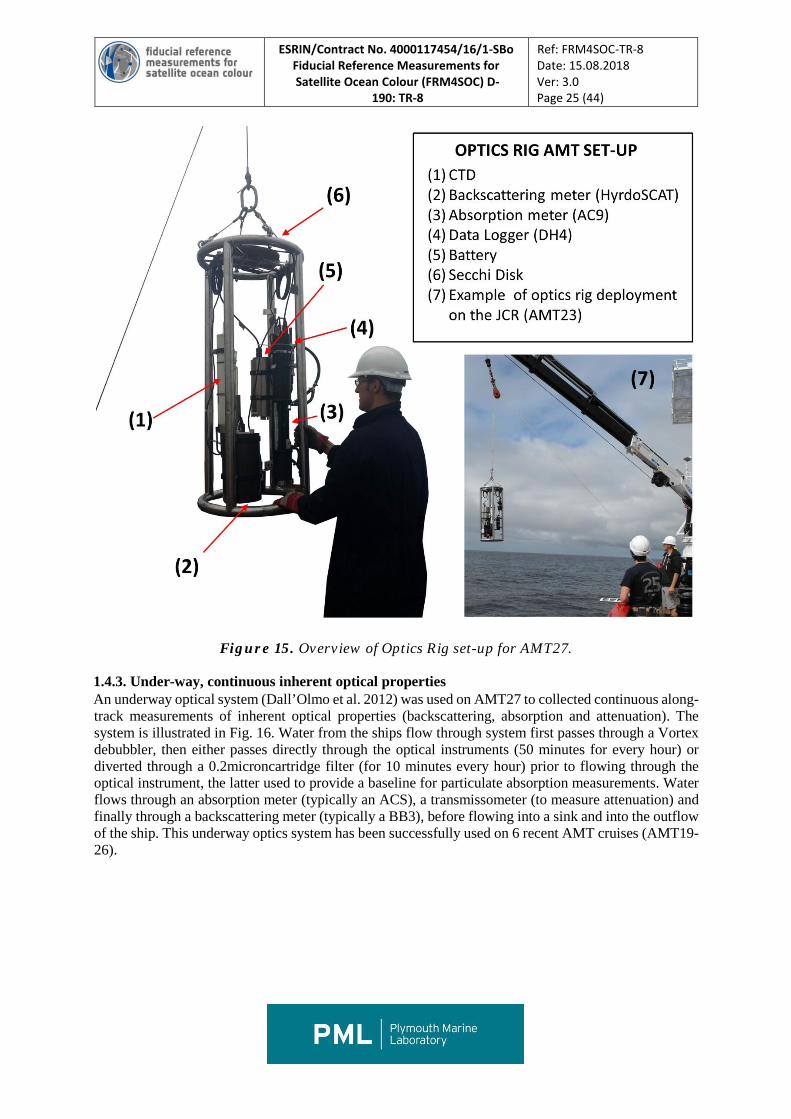
1.4.2. In-water inherent optical properties An optics rig set-up will also be used for vertical optical profiles of inherent optical properties (Fig. 15). This will include a CTD that will measure conductivity, temperature and pressure (depth), a backscattering meter, and an absorption meter. These instruments will be connected to a data logger (DH4) powered by a battery. Instruments will be switched on prior to deployment and data will be uploaded from the data logger onto a logging computer post deployment. We will also attach a white disk to record the Secchi depth (a visual index of water clarity). This optics rig set-up has been successfully used on the past 9 AMT cruises (AMT18-26).
ESRIN/Contract No. 4000117454/16/1-SBo Fiducial Reference Measurements for Satellite Ocean Colour (FRM4SOC) D-
190: TR-8
Ref: FRM4SOC-TR-8 Date: 15.08.2018 Ver: 3.0 Page 25 (44)
Figure 15. Overview of Optics Rig set-up for AMT27.
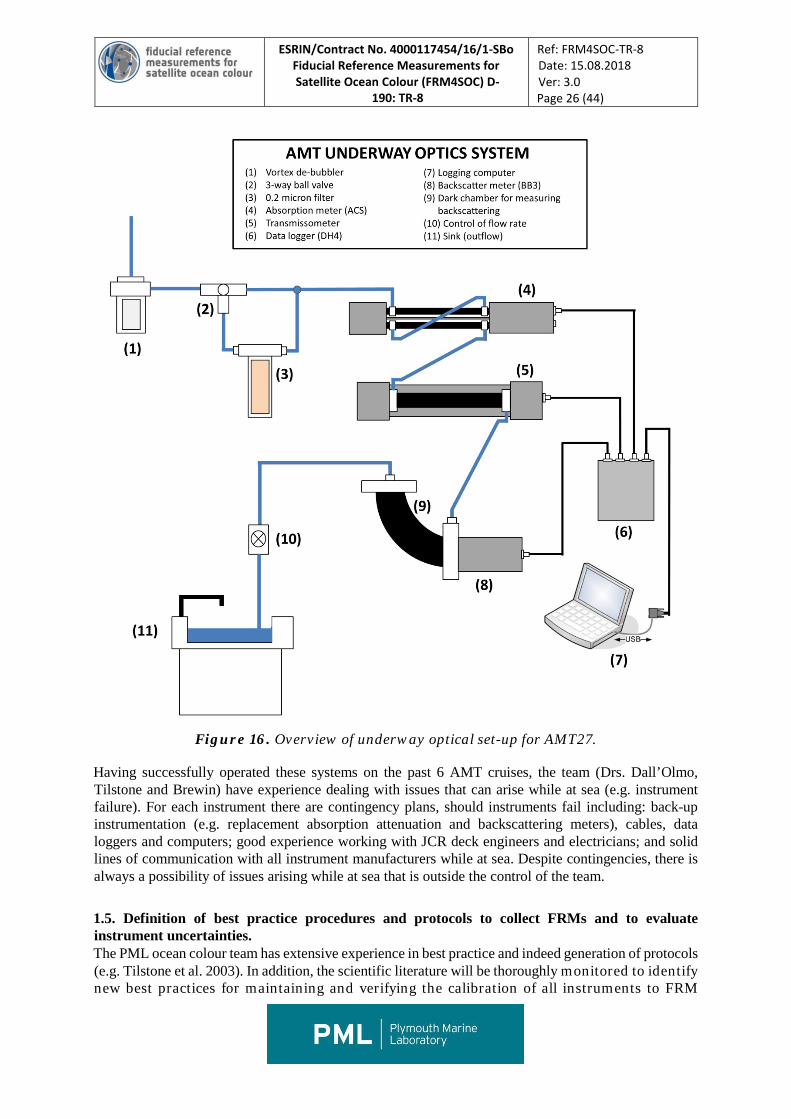
1.4.3. Under-way, continuous inherent optical properties An underway optical system (Dall’Olmo et al. 2012) was used on AMT27 to collected continuous along-track measurements of inherent optical properties (backscattering, absorption and attenuation). The system is illustrated in Fig. 16. Water from the ships flow through system first passes through a Vortex debubbler, then either passes directly through the optical instruments (50 minutes for every hour) or diverted through a 0.2microncartridge filter (for 10 minutes every hour) prior to flowing through the optical instrument, the latter used to provide a baseline for particulate absorption measurements. Water flows through an absorption meter (typically an ACS), a transmissometer (to measure attenuation) and finally through a backscattering meter (typically a BB3), before flowing into a sink and into the outflow of the ship. This underway optics system has been successfully used on 6 recent AMT cruises (AMT19-26).
ESRIN/Contract No. 4000117454/16/1-SBo Fiducial Reference Measurements for Satellite Ocean Colour (FRM4SOC) D-
190: TR-8
Ref: FRM4SOC-TR-8 Date: 15.08.2018 Ver: 3.0 Page 26 (44)
Figure 16. Overview of underway optical set-up for AMT27.
Having successfully operated these systems on the past 6 AMT cruises, the team (Drs. Dall’Olmo, Tilstone and Brewin) have experience dealing with issues that can arise while at sea (e.g. instrument failure). For each instrument there are contingency plans, should instruments fail including: back-up instrumentation (e.g. replacement absorption attenuation and backscattering meters), cables, data loggers and computers; good experience working with JCR deck engineers and electricians; and solid lines of communication with all instrument manufacturers while at sea. Despite contingencies, there is always a possibility of issues arising while at sea that is outside the control of the team.
1.5. Definition of best practice procedures and protocols to collect FRMs and to evaluate instrument uncertainties. The PML ocean colour team has extensive experience in best practice and indeed generation of protocols (e.g. Tilstone et al. 2003). In addition, the scientific literature will be thoroughly monitored to identify new best practices for maintaining and verifying the calibration of all instruments to FRM
ESRIN/Contract No. 4000117454/16/1-SBo Fiducial Reference Measurements for Satellite Ocean Colour (FRM4SOC) D-
190: TR-8
Ref: FRM4SOC-TR-8 Date: 15.08.2018 Ver: 3.0 Page 27 (44)
quality throughout the duration of AMT27. In addition, best practices will be undertaken and protocols will be implemented for producing uncertainty budgets for all instruments and for the range of environmental conditions expected during AMT.
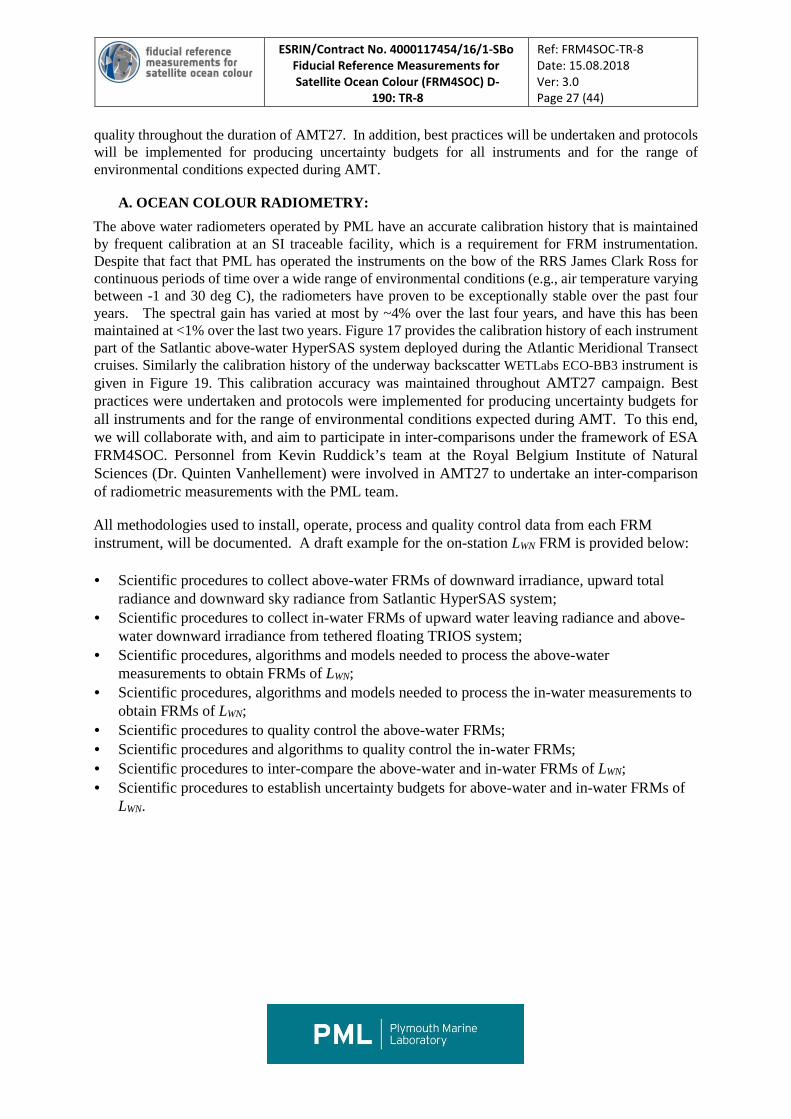
A. OCEAN COLOUR RADIOMETRY: The above water radiometers operated by PML have an accurate calibration history that is maintained by frequent calibration at an SI traceable facility, which is a requirement for FRM instrumentation. Despite that fact that PML has operated the instruments on the bow of the RRS James Clark Ross for continuous periods of time over a wide range of environmental conditions (e.g., air temperature varying between -1 and 30 deg C), the radiometers have proven to be exceptionally stable over the past four years. The spectral gain has varied at most by ~4% over the last four years, and have this has been maintained at <1% over the last two years. Figure 17 provides the calibration history of each instrument part of the Satlantic above-water HyperSAS system deployed during the Atlantic Meridional Transect cruises. Similarly the calibration history of the underway backscatter WETLabs ECO-BB3 instrument is given in Figure 19. This calibration accuracy was maintained throughout AMT27 campaign. Best practices were undertaken and protocols were implemented for producing uncertainty budgets for all instruments and for the range of environmental conditions expected during AMT. To this end, we will collaborate with, and aim to participate in inter-comparisons under the framework of ESA FRM4SOC. Personnel from Kevin Ruddick’s team at the Royal Belgium Institute of Natural Sciences (Dr. Quinten Vanhellement) were involved in AMT27 to undertake an inter-comparison of radiometric measurements with the PML team.
All methodologies used to install, operate, process and quality control data from each FRM instrument, will be documented. A draft example for the on-station LWN FRM is provided below:
• Scientific procedures to collect above-water FRMs of downward irradiance, upward total radiance and downward sky radiance from Satlantic HyperSAS system;
• Scientific procedures to collect in-water FRMs of upward water leaving radiance and above-water downward irradiance from tethered floating TRIOS system;
• Scientific procedures, algorithms and models needed to process the above-water measurements to obtain FRMs of LWN;
• Scientific procedures, algorithms and models needed to process the in-water measurements to obtain FRMs of LWN;
• Scientific procedures to quality control the above-water FRMs; • Scientific procedures and algorithms to quality control the in-water FRMs; • Scientific procedures to inter-compare the above-water and in-water FRMs of LWN; • Scientific procedures to establish uncertainty budgets for above-water and in-water FRMs of
LWN.
ESRIN/Contract No. 4000117454/16/1-SBo Fiducial Reference Measurements for Satellite Ocean Colour (FRM4SOC) D-
190: TR-8
Ref: FRM4SOC-TR-8 Date: 15.08.2018 Ver: 3.0 Page 28 (44)
Figure 17. Calibration History of the PML operated Satlantic above-water radiometric system.
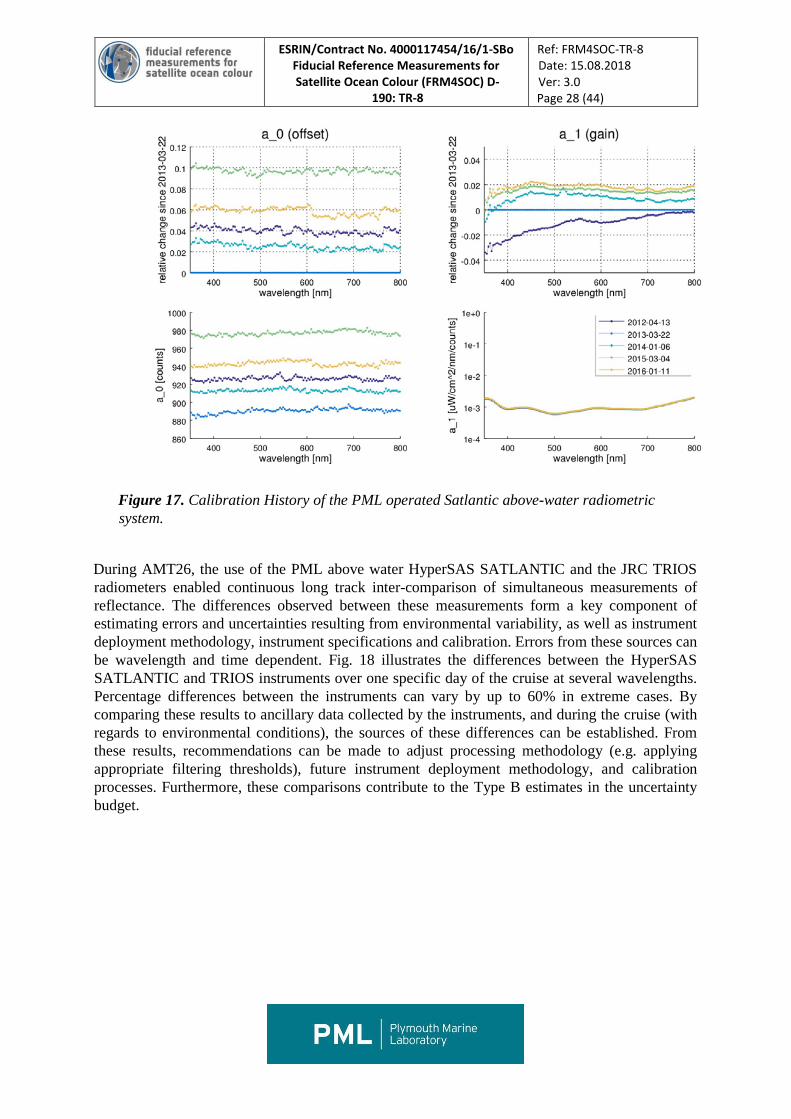
During AMT26, the use of the PML above water HyperSAS SATLANTIC and the JRC TRIOS radiometers enabled continuous long track inter-comparison of simultaneous measurements of reflectance. The differences observed between these measurements form a key component of estimating errors and uncertainties resulting from environmental variability, as well as instrument deployment methodology, instrument specifications and calibration. Errors from these sources can be wavelength and time dependent. Fig. 18 illustrates the differences between the HyperSAS SATLANTIC and TRIOS instruments over one specific day of the cruise at several wavelengths. Percentage differences between the instruments can vary by up to 60% in extreme cases. By comparing these results to ancillary data collected by the instruments, and during the cruise (with regards to environmental conditions), the sources of these differences can be established. From these results, recommendations can be made to adjust processing methodology (e.g. applying appropriate filtering thresholds), future instrument deployment methodology, and calibration processes. Furthermore, these comparisons contribute to the Type B estimates in the uncertainty budget.
ESRIN/Contract No. 4000117454/16/1-SBo Fiducial Reference Measurements for Satellite Ocean Colour (FRM4SOC) D-
190: TR-8
Ref: FRM4SOC-TR-8 Date: 15.08.2018 Ver: 3.0 Page 29 (44)
Figure 18. Percentage in Rrs between above water HyperSAS and in water TRIOS radiometers at 400, 440 and 550 nm during AMT26.
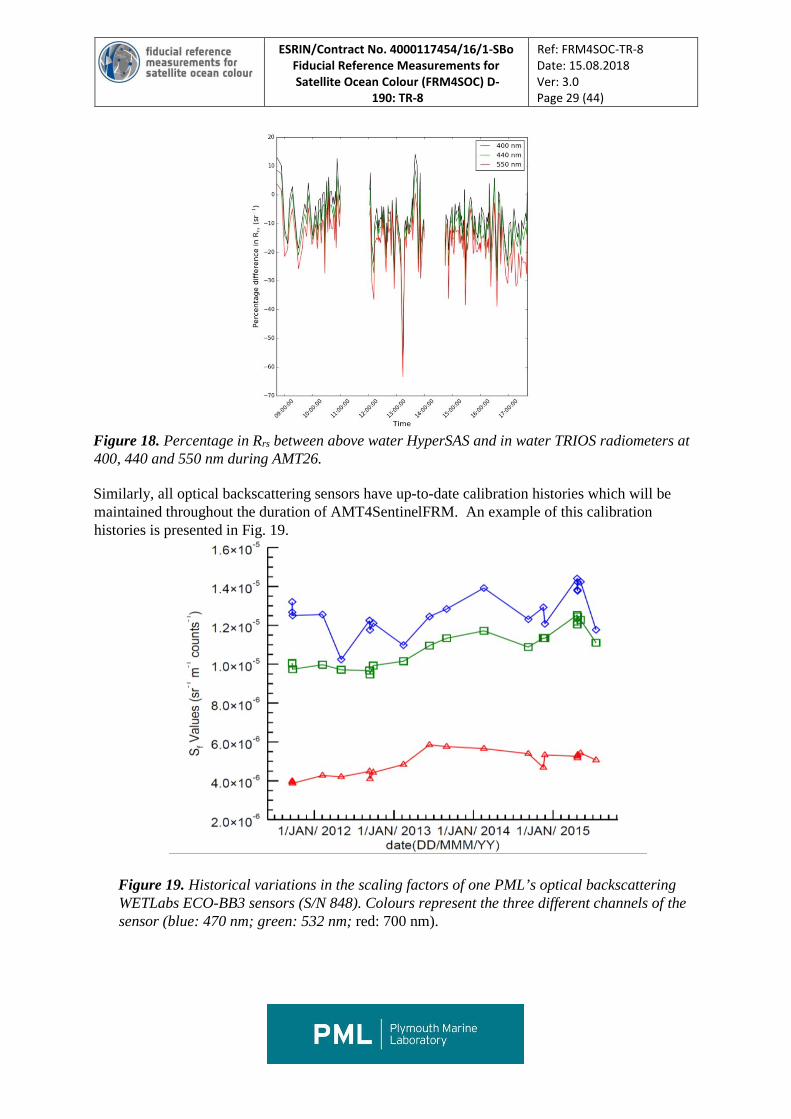
Similarly, all optical backscattering sensors have up-to-date calibration histories which will be maintained throughout the duration of AMT4SentinelFRM. An example of this calibration histories is presented in Fig. 19.
Figure 19. Historical variations in the scaling factors of one PML’s optical backscattering WETLabs ECO-BB3 sensors (S/N 848). Colours represent the three different channels of the sensor (blue: 470 nm; green: 532 nm; red: 700 nm).
ESRIN/Contract No. 4000117454/16/1-SBo Fiducial Reference Measurements for Satellite Ocean Colour (FRM4SOC) D-
190: TR-8
Ref: FRM4SOC-TR-8 Date: 15.08.2018 Ver: 3.0 Page 30 (44)
1.5.1. CALCULATION OF OCEAN COLOUR RADIOMETRY UNCERTAINTY BUDGETS.
Uncertainty budgets are required for any Fiducial Reference Measurement and will be compiled for all optical and thermal infrared measurements conducted in the framework of the AMT27. An uncertainty budget is prepared using by the following steps:
1. Definition of the measurement equation. The measurement equation is the analytical (or numerical) expression that links the measurement output (e.g., particulate optical backscattering at a given wavelength) with the input variables and parameters used to compute it (e.g., raw counts from the backscattering instrument, calibration coefficients, etc.). The measurement equation therefore also links the uncertainties in the inputs with the uncertainty of the output. A general form of the measurement equation is therefore:
𝑦𝑦 = (𝑥𝑥1,𝑥𝑥2, … , 𝑥𝑥𝑛𝑛) [1]
where y is the measurand or the measurement output, the xi are the input variables and f is the functional relationship linking inputs and measurand.
2. Identification and quantification of all potential sources of uncertainty in the input components of the measurement equation. This is the most critical part of the process and requires an in depth understanding of the instrumentation, of the methods used for its calibration and characterization, of the physical principles behind the measurements, as well as of any approximation employed in the measurement equation. Uncertainties in the input variables and parameters are quantified in different ways depending on the specific uncertainty, for example:
a. by analysing existing datasets (e.g., noise in signal), b. by conducting additional targeted experimental measurements (e.g., field
measurements of dark counts), c. by conducting instrument characterization exercises (e.g., wall effect), d. by assessing instrumental drift through pre- and post-cruise calibrations, e. by extracting uncertainty estimates from the literature.
It is also important to distinguish and report which uncertainties are of “type A” and which of “type B” (BIMP & ISO, 1995). Type A uncertainties are estimates of the uncertainty that are obtained by repeated observations and therefore quantify random uncertainties. Type B uncertainties are not obtained from repeated measurements, but evaluated by scientific judgment based on any information available for the variance of the measurand, through calibration and characterisation of the instrument.
3. Quantify potential correlations between different sources of uncertainty. Input variables can be correlated and so can the uncertainties associated with these variables. When computing the combined uncertainty in the output measurement, it is critical to account for these correlations, because, as a consequence of these correlations, the combined uncertainty can either significantly decrease or increase. The identification and
ESRIN/Contract No. 4000117454/16/1-SBo Fiducial Reference Measurements for Satellite Ocean Colour (FRM4SOC) D-
190: TR-8
Ref: FRM4SOC-TR-8 Date: 15.08.2018 Ver: 3.0 Page 31 (44)
quantification of correlations among input variables is achieved by analysing existing datasets and careful consideration of the measurement process.
4. Propagation of uncertainties. Each source of uncertainty then needs to be propagated through the measurement equation to quantify the “combined uncertainty”, u, in the measurand due to the uncertainty in each separate input variable. This error propagation is achieved by either applying the law of propagation of uncertainty (equation 2 below; BIPM and ISO, 1995) or, if the measurement equation is numerical in nature or non-linear and input variables have relatively large uncertainties, through Monte Carlo methods. Monte Carlo methods can also be used to ensure that the uncertainty estimates obtained from the law of propagation of uncertainties have been correctly calculated.
The law of propagation of uncertainties is used to calculate the “combined variance”, uc2,
and has the following general form:
[2]
where, u2(xi) are the variances of the input variables, and u(xi, xj) are the covariances between the input variables.
5. Calculation of the overall combined uncertainty. To calculate the final value of the overall combined uncertainty in the output parameter, equation 2 is then applied to all input variables to combine all sources of uncertainty and any identified correlation term.
6. Compilation of the uncertainty budget. The uncertainty budget is finally compiled by reporting each source of uncertainty and the combined uncertainty. This budget allows one to understand the relative contribution of each source of uncertainty to the final measurements and can be used as a guide to define methods to reduce the combined uncertainty in the measurand.
7. Presentation of results. All results of the above exercise are finally presented in tabular and/or graphical form. Specifically, three tables will be prepared for each measurement presenting (i) the identified sources of uncertainty, their quantified values, and their type; (ii) any correlation among input variables and their quantified values; and (iii) the uncertainty budget.
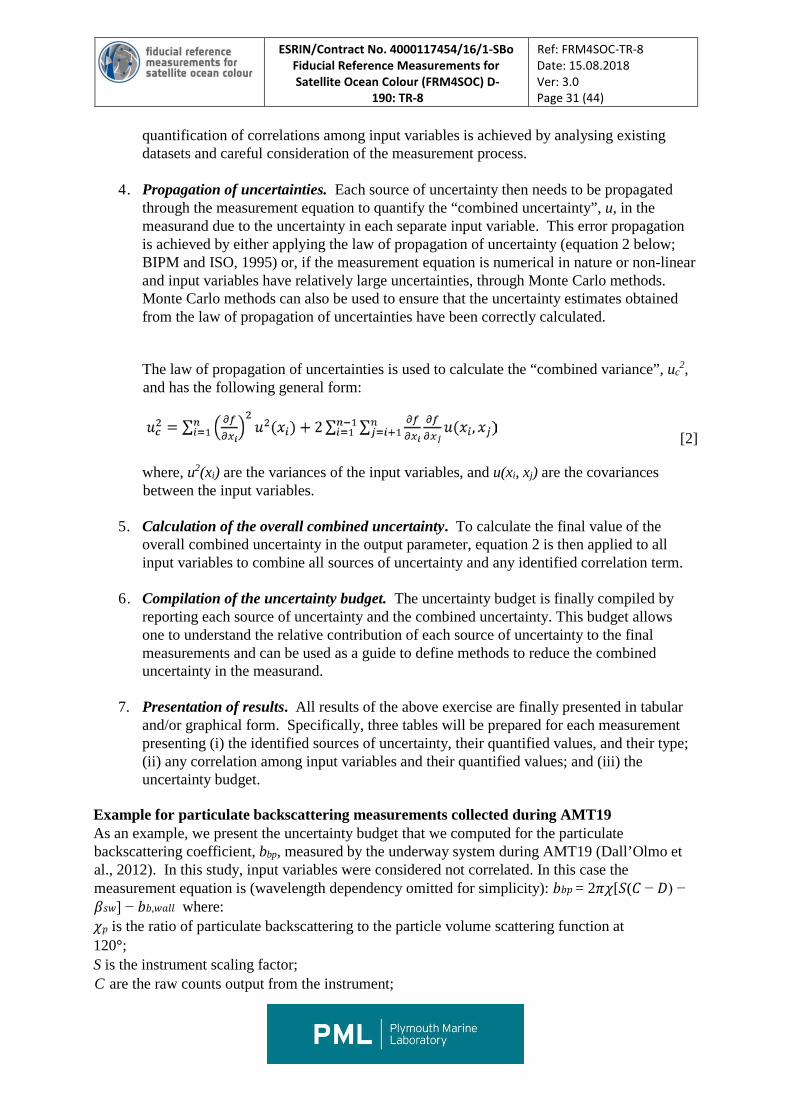
Example for particulate backscattering measurements collected during AMT19 As an example, we present the uncertainty budget that we computed for the particulate backscattering coefficient, bbp, measured by the underway system during AMT19 (Dall’Olmo et al., 2012). In this study, input variables were considered not correlated. In this case the measurement equation is (wavelength dependency omitted for simplicity): 𝑏𝑏𝑏𝑏𝑏𝑏 = 2𝜋𝜋𝜋𝜋[𝑆𝑆(𝐶𝐶 − 𝐷𝐷) − 𝛽𝛽𝑠𝑠𝑠𝑠] − 𝑏𝑏𝑏𝑏,𝑠𝑠𝑤𝑤𝑤𝑤𝑤𝑤 where: 𝜋𝜋𝑏𝑏 is the ratio of particulate backscattering to the particle volume scattering function at 120°; S is the instrument scaling factor; C are the raw counts output from the instrument;
ESRIN/Contract No. 4000117454/16/1-SBo Fiducial Reference Measurements for Satellite Ocean Colour (FRM4SOC) D-
190: TR-8
Ref: FRM4SOC-TR-8 Date: 15.08.2018 Ver: 3.0 Page 32 (44)
D are the instrument dark counts; 𝛽𝛽𝑠𝑠𝑠𝑠 is the volume scattering function of pure sea-water; 𝑏𝑏𝑏𝑏,𝑤𝑤𝑤𝑤𝑤𝑤 is the contribution to the signal recorded by the instrument due to reflections inside the flow-through chamber where the backscattering meter in installed.
Table 6. Uncertainties (their units in squared brackets) assigned to each input variable, their type and the how they were determined.
Variable, xi
Uncertainty, u(xi) Uncertainty type
Reference
𝜋𝜋𝑏𝑏 2.9 [%] B Sullivan and Twardowski, 2009
S 10 [%] A Sullivan et al., 2012 C 2.5 [counts] A Measured D 1.5 [counts] A Measured 𝛽𝛽𝑠𝑠𝑠𝑠 2.24 [counts] B Zhang et al., 2009 𝑏𝑏𝑏𝑏,𝑠𝑠𝑤𝑤𝑤𝑤𝑤𝑤 5.2×10⁻⁵ [m-1] A Measured
Table 7. Uncertainty budget for bbp(526) and demonstrates the importance of reducing the uncertainty in the scaling factor for accurately determining particulate backscattering.
Variable, xi Contribution to uc ×10-4 [m-1] 𝜋𝜋𝑏𝑏 0.24 S 2.19 C 0.78 D 0.47 𝛽𝛽𝑠𝑠𝑠𝑠 0.23 𝑏𝑏𝑏𝑏,𝑠𝑠𝑤𝑤𝑤𝑤𝑤𝑤 0.52
Quadrature sum 2.45×10⁻⁴
1.6. ABOVE WATER RADIOMETRY: THE TRIOS SYSTEM (RBINS).
RBINS will deploy TRIOS RAMSES radiometers on AMT27 alongside the PML HyperSAS system on the same mounting on the bow of the ship (see Figure 1.10).
For this system, Remote sensing reflectance, ρw (λ), as defined by:
𝜌𝜌𝑤𝑤 = 𝜋𝜋𝐿𝐿𝑤𝑤(λ)𝐸𝐸𝑆𝑆(λ)
is calculated from simultaneous above-water measurements of downwelling irradiance,
Es (λ), radiance from the water surface, Lt (λ) and sky radiance, Lsky(λ). The latter two measurements are used to calculate the intermediate parameter, Lw(λ) , the water-leaving radiance (after removal of
ESRIN/Contract No. 4000117454/16/1-SBo Fiducial Reference Measurements for Satellite Ocean Colour (FRM4SOC) D-
190: TR-8
Ref: FRM4SOC-TR-8 Date: 15.08.2018 Ver: 3.0 Page 33 (44)
air-sea interface reflection). This method corresponds to “Method 1” of (Mueller et al. 2000) and Ruddick et al. (2002) and Ruddick et al. (2006).
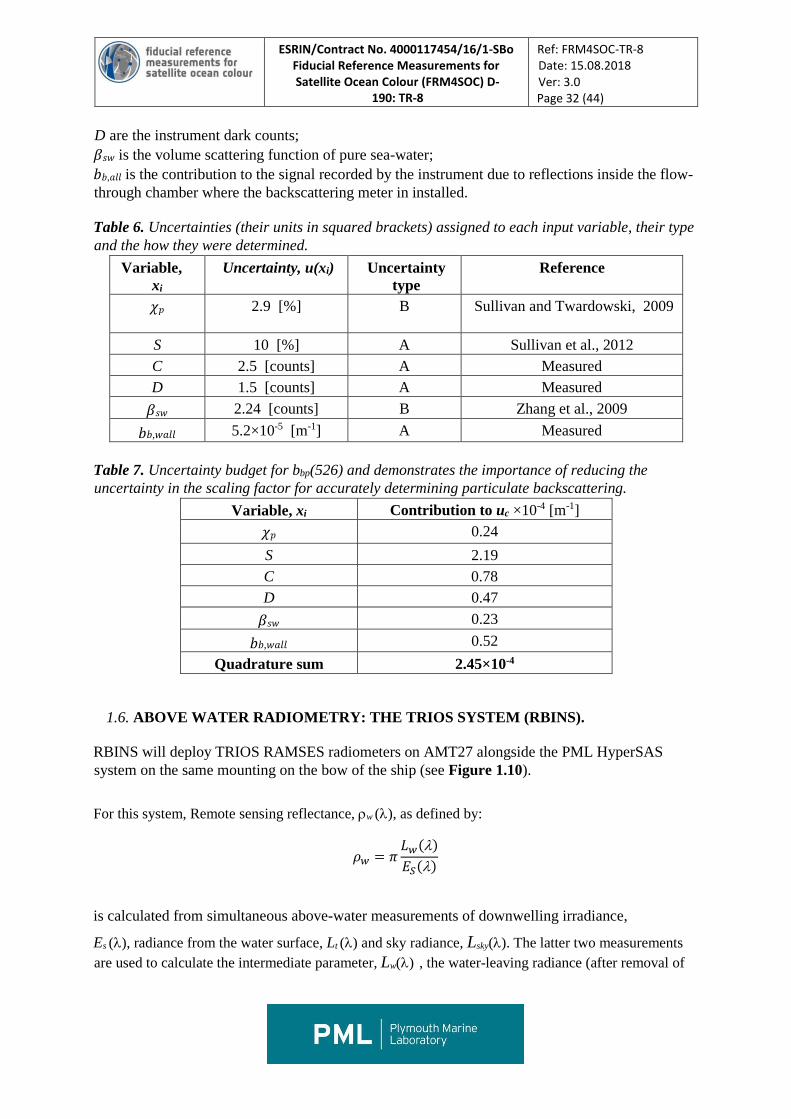
Figure 20. (left) System of two radiance and one irradiance sensor installed on steel frame. (right) As installed at prow of ship with irradiance sensor mounted separately to reduce optical interference from mast.
1.6.1. INSTRUMENT DESCRIPTION The measurement system consists of three hyperspectral spectroradiometers, either TriOS-RAMSES or SATLANTIC OCR, two measuring radiance and one measuring downwelling irradiance with a cosine collector (Fig. 20). The sensors measure over the wavelength range 350-950nm with sampling approximately every 3.3nm with spectral width of about 10nm. The sensors are based on the Carl Zeiss Monolithic Miniature Spectrometer (MMS) incorporating a 256 channel silicon photodiode array. Integration time varies from 4ms to 8s and is automatically adjusted to measured light intensity. The data stream from all three instruments is integrated by a IPS-104 power supply and interface unit and logged on a PC via a RS232 connection. The radiance sensors have a field of view of 7°. A two-axis tilt sensor is incorporated inside the downwelling irradiance sensor. The instruments are mounted on a steel frame, similar in concept to that used by (Hooker and Lazin 2000). The frame is fixed to the prow of the ship, facing forwards to minimise ship shadow and reflection and 1-8m above the water surface. Where necessary to avoid optical interference the downwelling irradiance sensor is mounted separately elsewhere on the ship.
1.6.2. INSTRUMENT CALIBRATION AND QUALITY ASSURANCE
The instruments are calibrated twice per year at NIST-traceable facilities in the framework of MERIS Validation Team workshops.
1.7. METHODOLOGY AND PROCESSING DESCRIPTION.
1.7.1. Deployment of the instrument The instruments are mounted on a steel frame, which can be fixed to the bow of the ship. The sensors should face forward to minimize ship shadow and reflection. Before measurements the
ESRIN/Contract No. 4000117454/16/1-SBo Fiducial Reference Measurements for Satellite Ocean Colour (FRM4SOC) D-
190: TR-8
Ref: FRM4SOC-TR-8 Date: 15.08.2018 Ver: 3.0 Page 34 (44)
frame is levelled horizontally and the sea and sky-viewing angles are fixed at 40° with respect to zenith and viewing in the same azimuth angle. In this way the sky is viewed in the direction from which light will enter the sea-viewing sensor after reflection at a flat sea surface. The radiance sensor lenses and the irradiance sensor collector are inspected manually before each measurement and are cleaned of spray and dust when necessary. The ship is manoeuvred on station to point the radiance sensors at a relative azimuth angle of 135° with respect to sun. New platforms have been developed which automatically track the position of the sun so that continuous quality assured measurements can be taken whilst the ship is steaming (Balch et al. 2011). When the correct position and angle are achieved measurements are started and continue for 10 minutes, taking a scan of the three instruments every 10s. During measurements wind speed is recorded and sea, sun and sky state conditions are noted, especially if variable because of cloud movement or floating matter. The ship position and orientation are monitored for drift. Lens caps are used to protect all three sensors except during the 10 minute measurement sequence.
Measurements can also be made underway for a ship heading of 135° relative to sun, providing a transect of reflectance spectra. For such measurements the lenses are inspected at the end of the transect and any spray droplets are noted. During such measurements visual checks are made of the sea surface for variability such as fronts or floating material and the ship heading is monitored.
1.7.2. Description of processing techniques employed Data is acquired with the MSDA software (v1.94 in 2001-2002) using the file recorder function and calibrated radiometrically using nominal calibration constants. Dark values are removed with the “dynamic offset” function, which uses blocked photodiode array channels. Calibrated data for Es
(λ), Lt (λ) and Lsky(λ) is interpolated to 2.5nm intervals and exported to Excel for recalibration to the MERIS Validation Team standard and for further processing.
1.7.3. Preprocessing Quality Checks The multitemporal dataset is screened to: • Remove dropout (incomplete spectra) • Avoid measurements during temporal fluctations of Es (λ) , arising mainly from clouds or haze
passing in front of the sun
• Avoid measurements during strong temporal fluctuations of Lsky(λ) , arising mainly from
variable cloudiness in the sky-viewing direction
• Avoid outliers of Lt (λ) • Avoid measurements with high tilt or roll (greater than five degrees) Five scans of Es(λ) , Lsky(λ)
and Lt (λ) are used for further processing.
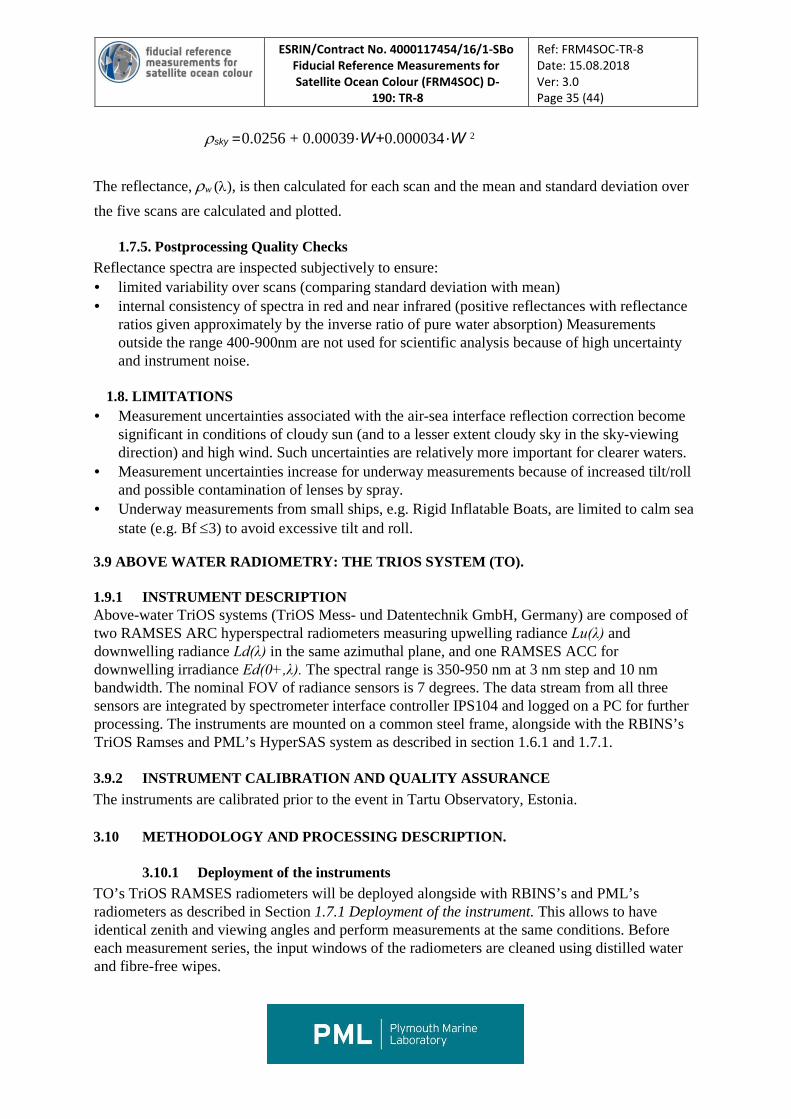
1.7.4. Data Processing The water-leaving radiance is calculated by,
where ρsky , the air-sea interface reflection coefficient, is estimated for sunny conditions
from Figure 9 of (Mobley 1999) as function of wind speed in m/s, W :
ESRIN/Contract No. 4000117454/16/1-SBo Fiducial Reference Measurements for Satellite Ocean Colour (FRM4SOC) D-
190: TR-8
Ref: FRM4SOC-TR-8 Date: 15.08.2018 Ver: 3.0 Page 35 (44)
ρsky =0.0256 + 0.00039·W+0.000034 ·W 2
The reflectance, ρw (λ), is then calculated for each scan and the mean and standard deviation over the five scans are calculated and plotted.
1.7.5. Postprocessing Quality Checks Reflectance spectra are inspected subjectively to ensure: • limited variability over scans (comparing standard deviation with mean) • internal consistency of spectra in red and near infrared (positive reflectances with reflectance
ratios given approximately by the inverse ratio of pure water absorption) Measurements outside the range 400-900nm are not used for scientific analysis because of high uncertainty and instrument noise.
1.8. LIMITATIONS • Measurement uncertainties associated with the air-sea interface reflection correction become
significant in conditions of cloudy sun (and to a lesser extent cloudy sky in the sky-viewing direction) and high wind. Such uncertainties are relatively more important for clearer waters.
• Measurement uncertainties increase for underway measurements because of increased tilt/roll and possible contamination of lenses by spray.
• Underway measurements from small ships, e.g. Rigid Inflatable Boats, are limited to calm sea state (e.g. Bf ≤3) to avoid excessive tilt and roll.
3.9 ABOVE WATER RADIOMETRY: THE TRIOS SYSTEM (TO).
1.9.1 INSTRUMENT DESCRIPTION Above-water TriOS systems (TriOS Mess- und Datentechnik GmbH, Germany) are composed of two RAMSES ARC hyperspectral radiometers measuring upwelling radiance Lu(λ) and downwelling radiance Ld(λ) in the same azimuthal plane, and one RAMSES ACC for downwelling irradiance Ed(0+,λ). The spectral range is 350-950 nm at 3 nm step and 10 nm bandwidth. The nominal FOV of radiance sensors is 7 degrees. The data stream from all three sensors are integrated by spectrometer interface controller IPS104 and logged on a PC for further processing. The instruments are mounted on a common steel frame, alongside with the RBINS’s TriOS Ramses and PML’s HyperSAS system as described in section 1.6.1 and 1.7.1.
3.9.2 INSTRUMENT CALIBRATION AND QUALITY ASSURANCE The instruments are calibrated prior to the event in Tartu Observatory, Estonia. 3.10 METHODOLOGY AND PROCESSING DESCRIPTION.
3.10.1 Deployment of the instruments TO’s TriOS RAMSES radiometers will be deployed alongside with RBINS’s and PML’s radiometers as described in Section 1.7.1 Deployment of the instrument. This allows to have identical zenith and viewing angles and perform measurements at the same conditions. Before each measurement series, the input windows of the radiometers are cleaned using distilled water and fibre-free wipes.
ESRIN/Contract No. 4000117454/16/1-SBo Fiducial Reference Measurements for Satellite Ocean Colour (FRM4SOC) D-
190: TR-8
Ref: FRM4SOC-TR-8 Date: 15.08.2018 Ver: 3.0 Page 36 (44)
3.10.2 Description of processing techniques employed. Data is acquired and processed with software developed in TO. All three spectra are recorded simultaneously where the time interval between the scans can be manually set. The integration time is adjusted automatically in the range of 4ms - 4s based on the scene brightness.
The remote sensing reflectance, ρw (λ), is calculated with the correction coefficient of the air-sea
interface reflection, ρsk, similarly as described in Section 1.7.4. In addition NIRsimilarity correction and filter for clear/cloudy sky is applied after Ruddick et al. 2006.
3.11 LIMITATIONS The considered uncertainty sources are: • uncertainty of the absolute radiometric calibration of the Lu, Ld, and Ed sensors; • uncertainty due to inherent straylight effects of the Lu, Ld, and Ed sensors; • uncertainty of the NIR-similarity correction; • effects of non-cosine response of the Ed sensor; • environmental perturbations (estimated from the variation ofρw (λ)).
4 ABOVE WATER RADIOMETRY: THE WISP INSTRUMENT (TO). TO will deploy two Water Insight’s WISP-3 handheld spectrometers.
4.1.1 INSTRUMENT DESCRIPTION The WISP instrument has three radiometers which are, via optical fibers, connected respectively to one cosine corrector to measure the downwelling irradiance [Ed(λ)], and two radiance sensors: the downwelling radiance from the sky [Lsky (λ; θ)] in which θ = 42 deg from the zenith and the total upwelling radiance [Lu(λ; θ)] at 42 deg from the nadir (θ = 138 deg). One instruments is using Gershun tubes for radiance sensors and the other one lenses. Otherwise, the two sensors are identical. These three radiometers and the angles are chosen according to Mobley’s (1999) guidance on above-water radiometric measurements (Hommsersom et al., 2012).
4.1.2 INSTRUMENT CALIBRATION AND QUALITY ASSURANCE The instruments are calibrated prior to the event in Tartu Observatory, Estonia.
4.2 METHODOLOGY AND PROCESSING DESCRIPTION.
4.2.1 Deployment of the instrument Devices are hand held instruments and the measurements will be taken at an azimuth angle of 135 deg relative to the Sun. In this way the direct reflectance effects (e.g., sun glint), that occur at the surface, are avoided as much as possible (Mobley, 1999). The measurements are taken as often as the instruments allow during the 10 minute window and have to be managed by a person pressing the buttons on the instrument.
4.2.2 Data Processing Raw measurement data is stored on the SD-card and from there, it is uploaded to the WISPWeb, where the calculation takes place and is therefore controlled by Water Insight.
ESRIN/Contract No. 4000117454/16/1-SBo Fiducial Reference Measurements for Satellite Ocean Colour (FRM4SOC) D-
190: TR-8
Ref: FRM4SOC-TR-8 Date: 15.08.2018 Ver: 3.0 Page 37 (44)
4.3 LIMITATIONS Integration time is calculated on every measurement set and as one set is average of ten measurements then sometimes adapting to light together with measurements will take longer. Therefore the number of measurements during the 10 minute window is probably smaller than for other sensors. Also as it is hand held instrument, then the irradiance sensor is more affected by the ship.
APPROACH TO DATA & AUTHORSHIP AGREEMENT.
4.4 TIMETABLE FOR THE FICE-AAOT AND FICE-AMT.
There are four phases of the FICE, which are illustrated in Table 3. The first phase prepares for the measurements; the second phase is the measurements themselves and the third phase the analysis and report writing. Table 8. FICE Implementation Plan Schedule. PHASE 1: PREPARATION International invitation to participate September, 2016 Application form available on web site September, 2016 Applications open until April 2017 Selection of participants?? May 2017 Announcement of participation Julyy 2017 PHASE 2: AAOT Inter-comparison Radiometer shipment from TO to participants by May, 2018 Participants to ship radiometers to AAOT by June 2018 FICE AAOT 8 days excl travel. Dates pending confirmation from ISMAR
June-July, 2018 tbd
PHASE 3: AMT Inter-comparison Dates for AMT27 20 Sept to 5 Nov 2017 BoL’s, CARs, COSHH, RA to be completed by July 2017
July 2017
Embarkation on RRS DISCOVERY 18 September 2017 Disembarkation in Azores 30 September 2017 Disembarkation in Falkland Islands 5 Nov 2017 PHASE 4: ANALYSIS AND REPORTS Calibrated sensors returned to participants July, 2018 Participants to send raw data from AAOT intercomparison
August, 2018
Draft A (results circulated to participants) August, 2018 Final draft report circulated to participants 31 August, 2018 Final Report published 31 August, 2018
4.5 TRAVEL ARRANGEMENTS FOR FICE
Plymouth Marine Laboratory will be arranging all travel and hotel arrangements. The point of contact for this is:
ESRIN/Contract No. 4000117454/16/1-SBo Fiducial Reference Measurements for Satellite Ocean Colour (FRM4SOC) D-
190: TR-8
Ref: FRM4SOC-TR-8 Date: 15.08.2018 Ver: 3.0 Page 38 (44)
Kim Hockley Plymouth Marine Laboratory Prospect Place West Hoe Plymouth UK PL1 3DH
Email: [email protected]
Tel: 01752 633100
Final List of Participants: 1. Martin Ligi, TO 2. Martin Hieronymi, HZG 3. Davide D'Alimonte, CIMA 4. Astrid Bracher , AWI 5. Maycira Costa, UVIC, 6. Vincenzo Vellucci, LOV, 7. Dieter Vansteenwegen, VLIZ (c/o RBINS), 8. Giorgio Dall’Olmo, PML 9. Gavin Tilstone, PML. 10. Kevin Ruddick, RBINS (8-15 July only),11. Matthew Beck,
RBINS (14-18 July only), 12. Tania Casal, ESA; (10 - 13 July only).
CALIBRATION of RADIOMETERS prior to Inter-Comparison: The FRM4SOC Project will pay for the shipping of your radiometers to Tartu Observatory, Estonia. Your radiometers need to arrive at Tartu Observatory, before 10 June 2018. Failure to meet this date, will mean that you will not be able to participate in the FRM4SOC AAOT inter-comparison. The calibration files will be sent to you prior to 01.07.2018 the inter-comparison and are to be used in any subsequent work up of the inter-comparison data.
ADDRESS for SHIPPING RADIOMETERS for pre- inter-comparison CALIBRATION: Tartu Observatory, University of Tartu Observatooriumi 1 EE-61602 Tõravere Estonia tel + 372 737 4511 fax +372 737 4555 Email: [email protected]
ESRIN/Contract No. 4000117454/16/1-SBo Fiducial Reference Measurements for Satellite Ocean Colour (FRM4SOC) D-
190: TR-8
Ref: FRM4SOC-TR-8 Date: 15.08.2018 Ver: 3.0 Page 39 (44)
4.6 FLIGHTS TO VENICE & DIRECTIONS TO THE AAOT
THE "ACQUA ALTA" RESEARCH TOWER WAS INSTALLEd ON JANUARY 1970 OFF THE GULF OF VENICE, ITALY, BY MIcoPERI FOR THE cnr. THIS TOWER coNSISTS OF A PLATFORM coNTAINING AN INSTRUMENT HOUSE, SUPPORTEd BY A STEEL PIPE STRUCTURE, SIMILAR TO THAT OF AN OIL WELL dERRICK. THE PIPE STRUCTURE IS HAMMEREd 22 M INTO THE BOTTOM THROUGH EACH OF ITS FOUR HOLLOW LEGS. THE TOWER IS SITUATEd IN 16 M OF WATER (MLLW). THE GULF OF VENICE SITE WAS CHOSEN BECAUSE IT PROVIdEd THE BEST coMBINATION OF dESIRABLE OCEANOGRAPHIC FEATURES ANd PRACTICAL OPERATING coNVENIENCE.
THE AAOT IS LOCATED NEAR TO INSTITUTE OF MARINE SCIENCES - NATIONAL RESEARCH COUNCIL ADDRESS: ISMAR-CNRARSENALE - TESA 104, CASTELLO 2737/F 30122 VENEZIA, ITALY. TEL (+39) 041 2407927; FAX (+39) 041 2407940
Venice is connected to the mainland (Venezia Mestre) by the “Ponte della Libertà”, 4 km long, which allows road vehicles and trains to travel to the lagoon. The bridge leads to the Cruise Terminal, to the “Tronchetto” and “Piazzale Roma” terminals and to the Railway Station. Vehicles cannot pass beyond these terminals, so those arriving by car must park and those arriving by train must alight at Venezia Saint Lucia Railway Station.
By air:
If you are arriving at “Marco Polo” airport, located in Tessera (Venice mainland) take:
- the ALILAGUNA lines (public waterbus transportation) according to your destination. You can buy your tickets at the ticket offices located a) in the arrival hall; b) just in front of the waterbus stop or c) on board, with an additional fare of 1 EUR; - the ACTV AERObus n. 5 to Piazzale Roma (20 minutes’ ride);
- the ATVO airport bus to Piazzale Roma (20 minutes’ ride);
- the car taxi (approximately 20 minutes’ ride);
- the boat taxi (approximately 90,00-100,00 EUR, 30-40 minutes’ ride).
If you are arriving at “Canova” airport, near Treviso, catch the ATVO bus-express (1 hour ride) to Piazzale Roma.
By train:
If you arrive by train, at the railway station of Venezia Santa Lucia, take the boat (line 5.2 just in front of the railway station) and stop at BACINI. For the water bus service timetable please refer to the following link.
Hence walk according to the paths given in the map.
ESRIN/Contract No. 4000117454/16/1-SBo Fiducial Reference Measurements for Satellite Ocean Colour (FRM4SOC) D-
190: TR-8
Ref: FRM4SOC-TR-8 Date: 15.08.2018 Ver: 3.0 Page 40 (44)
The entrance of the Institute of Marine Sciences is located at Tesa 104 (“Tesa” is the name of the single attached building where ships were originally built).
By car:
When you drive to Venice and park your car at Piazzale Roma or at the Tronchetto Terminal, it is possible within walking distance to reach Actv landing stages for the main public transport waterbus routes.
Parking places here are limited and expensive, but other car parking facilities are available on the mainland and are linked with the city through public transport.
Check availability and rates from VeneziaUnica website by clicking on "PARKING".
From Piazzale Roma, take the boat (line 5.2 at the waterbus stop located in front of the Railway Station) and stop at BACINI. For the water bus service timetable please refer to the following link.
Hence walk according to the paths given in the map.
The entrance of the Institute of Marine Sciences is located at Tesa 104 (“Tesa” is the name of the single attached building where ships were originally built).
Tickets
An ordinary ticket for the in town navigation service costs 7,50 EUR* and you can travel on any route (except Alilaguna lines, ACTV routes n. 16, 19, 21 and Casino) with route changes in the same direction, for 75 minutes from the moment of ticket validation.
You can buy conveniently-priced tourist tickets for trips with a minimum length of 24 hours to a maximum of 7 days. Another convenient solution is to buy “Carta Venezia” (Venice card) at the ACTV (boat ticket) office located in Piazzale Roma (this service is available only here and requires to provide a valid identity document). The cost is of 50,00 EUR* and allows to buy tickets at the local reduced fare (1,50 EUR* per ride). The card lasts for 5 years.
For more information on ACTV ticket prices, please refer to the VeneziaUnica website.
* Please consider that costs are provided as a reference. Fares may change in time. For any updated information please refer to the VeneziaUnica website.
ISMAR Contact for Sending Equipment: Address and contact for sending equipment is: Mauro Bastianini. Consiglio Nazionale delle Ricerche Istituto di Scienze Marine (CNR-ISMAR) Arsenale, Tesa 104, Castello 2737/F 30122 Venezia - Italia Telephone: +39 041 2407924.
ESRIN/Contract No. 4000117454/16/1-SBo Fiducial Reference Measurements for Satellite Ocean Colour (FRM4SOC) D-
190: TR-8
Ref: FRM4SOC-TR-8 Date: 15.08.2018 Ver: 3.0 Page 41 (44)
Email: [email protected]
INSURANCE: You will provide your own insurance to cover you and your equipment. For those who do not have insurance it can be purchased from ISMAR at a cost of at the price of 12.00 EUR per person per day.
5 REFERENCES
Antoine, D., d'Ortenzio, F., Hooker, S. B., Becu, G., Gentili, B., Tailliez, D., et al. Assessment of uncertainty in the ocean reflectance determined by three satellite ocean color sensors (MERIS, SeaWiFS and MODIS-A) at an offshore site in the Mediterranean Sea (BOUSSOLE project). Journal of Geophysical Research-Oceans, 113, C07013, 2008.
Balch, W. M., D. T. Drapeau, B. C. Bowler, E. Lyczskowski, E. S. Booth, and D. Alley (2011). The contribution of coccolithophores to the optical and inorganic carbon budgets during the Southern Ocean Gas Exchange Experiment: New evidence in support of the “Great Calcite Belt” hypothesis, J. Geophys. Res., 116, C00F06, doi:10.1029/2011JC006941
Brewin, R. J. W., Dall’Olmo, G. (2014) Evaluating ocean-colour data using underway optical sampling along the Atlantic Meridional Transect (AMT): Chlorophyll-a concentration. Presentation at the Ocean Optics XXII conference, Portland Maine, US, 26-31 Oct 2014.
Brewin, R. J. W., Sathyendranath, S., Müller, D., Brockmann, C., Deschamps, P-Y., Devred, E., Doerffer, R., Fomferra, N., Franz, B., Grant, M., Groom, S., Horseman, A., Hu, C., Krasemann, H., Lee, Z., Maritorena, S., Mélin, F., Peters, M., Platt, T., Regner, R., Smyth, T., Steinmetz, F., Swinton, J., Werdell, J. & White, G.N. (2015) The Ocean Colour Climate Change Initiative: III. A round-robin comparison on in-water bio-optical algorithms. Remote Sensing of Environment, 162, 271-294. doi:10.1016/j.rse.2013.09.016
D’Alimonte, D., Zibordi, G., Kajiyama, T., and Cunha, J. C.: A Monte Carlo code for high spatial resolution ocean color simulations, Appl. Optics, 49, 4936–4950, 2010.
Dall'Olmo G., Boss E., Behrenfeld M. and Westberry T. (2012). Particulate optical scattering coefficients along an Atlantic Meridional Transect. Opt. Express 20, 21532-21551.
Deschamps, P.-Y., Fougnie, B., Frouin, R., Lecomte, P., and Verwaerde, C.: SIMBAD: a field radiometer for satellite ocean-color validation, Appl. Optics, 43, 4055–4069, 2004.
Fargion G.S., Mueller J.L. 2000. Ocean Optics Protocols for Satellite Ocean Colour Sensor Validation, Revision 2. NASA Goddard Space Flight Center, Greenbelt, Maryland, pp 125 – 153.
Fougnie, B., Frouin, R., Lecomte, P., and Deschamps, P. Y.: Reduction of skylight reflection effects in the above-water measurement of diffuse marine reflectance, Appl. Optics, 38, 3844–3856, 1999.
Hooker, S. B. and G. Lazin (2000). The SeaBOARR-99 Field Campaign. Greenbelt, Maryland, NASA: 46.
Hooker, S. B., Lazin, G., Zibordi, G., and McClean, S.: An evaluation of above- and in-water methods for determining water leaving radiances, J. Atmos. Ocean. Tech., 19, 486– 515, 2002a.
Hooker, S. B., McLean, S., Small, M., Lazin, G., Zibordi, G., and Brown, J.: The Seventh SeaWiFS Intercalibration Round-Robin Experiment (SIRREX-7), March 1999. SeaWiFS Report NASA/TM-2001-206892, vol. 17, edited by: Hooker, S. B. and Firestone, E. R., NASA Goddard Space Flight Center, Greenbelt, Maryland, 2002b.
Hooker, S. B., Zibordi, G., Berthon, J.-F., and Brown, J.W.: Above-Water Radiometry in shallow coastal waters, Appl. Optics, 43, 4254–4268, 2004.
Hooker, S. B. and Zibordi, G.: Platform perturbation in Above-Water Radiometry, Appl. Optics, 44, 553–567, 2005.
ESRIN/Contract No. 4000117454/16/1-SBo Fiducial Reference Measurements for Satellite Ocean Colour (FRM4SOC) D-
190: TR-8
Ref: FRM4SOC-TR-8 Date: 15.08.2018 Ver: 3.0 Page 42 (44)
Hommersom, A., Kratzer, S., Laanen, M., Ansko, I., Ligi, M., Bresciani, M., Giardino, C., Beltrán-Abaunza, J.M., Moore, G., Wernand, M., Peters, S. (2012). Intercomparison in the field between the new WISP-3 and other radiometers (TriOS Ramses, ASD FieldSpec, and TACCS). J. Appl. Remote Sens. 6. dx.doi.org/10.1117/1.JRS.6.063615
Lourenco, A., Egarnes, L., Thoral, K., Vivier, F., Du Chaffaut, M., Provost, C. Moored autonomous 'Yoyo Profiler': The surface challenge. Sea Technology 41(6): 46-50, 2000.
Mobley, C. D. (1999). “Estimation of the remote-sensing reflectance from above-surface measurements.” Applied Optics 38: 7442-7455.
Moore, G. F., Icely, J. D., and Kratzer, S.: Field Inter-comparison and validation of in-water radiometer and sun photometers for MERIS validation, Proceedings of the ESA Living Planet Symposium, Special Publication SP-686, 2010.
Mueller, J. L., C. Davis, R. Arnone, R. Frouin, K. Carder, Z. P. Lee, R. G. Steward, S. Hooker, C. D. Mobley and S. McLean (2000). Above-water radiance and remote sensing reflectance measurements and analysis protocols. Ocean Optics protocols for satellite ocean color sensor validation Revision 2. Greenbelt, Maryland, National Aeronautical and Space Administration: 98-107.
Mueller J.L., Giulietta S. Fargion and C. R. McClain, (2003) Ocean Optics Protocols For Satellite Ocean Color Sensor Validation, Revision 5, Volume V: Biogeochemical and Bio-Optical Measurements and Data Analysis Protocols National Aeronautical and Space administration, USA TM/2003.
O'Reilly, J. E., Maritorena, S., Mitchell, B. G., Siegel, D. A., Carder, K. L., Garver, S. A., et al. Ocean color chlorophyll algorithms for SeaWiFS. Journal of Geophysical ResearchOceans, 103, 24937–24953, 1998
Ruddick, K., De Cauwer, V., Park, Y., and Moore, G.: Seaborne measurements of near infrared water-leaving reflectance – the similarity spectrum for turbid waters, Limnol. Oceanogr., 51, 1167–1179, 2006.
Ruddick, K., V. De Cauwer, Y. Park, G. Becu, J.-P. De Blauwe, E. D. Vreker, P.-Y. Deschamps, M. Knockaert, B. Nechad, A. Pollentier, P. Roose, D. Saudemont and D. v. Tuyckom (2002). Preliminary validation of MERIS water products for Belgian coastal waters. Envisat Validation workshop, 9-13th December 2002, Frascati, European Space Agency.
Ruddick K, De Cauwer V, Park Y-J. (2006). Seaborne measurements of near infra-red water leaving reflectance: The similarity spectrum for turbid waters. Limnology and Oceanography, 51, 1167-1179.
Tilstone GH, Moore GF, Sorensen K, Doerffer R, Rottgers R, Ruddick KG, Pasterkamp R. (2003). Protocols for the validation of MERIS products in Case 2 waters. Proceedings from ENVISAT MAVT Conference, 20 - 24 October 2003, Frascatti, Italy. European Space Agency. http://envisat.esa.int/workshops/mavt_2003/MAVT- 2003_802_REVAMPprotocols3.pdf
Zibordi, G., Hooker, S. B., Berthon, J.-F., and D’Alimonte, D.: Autonomous above–water radiance measurement from an offshore platform: A field assessment, J. Atmos. Ocean. Tech., 19, 808–819, 2002.
Zibordi, G., D’Alimonte, D., and Berthon, J.-F.: An evaluation of depth resolution requirements for optical profiling in coastal waters, J. Atmos. Ocean. Tech., 21, 1059– 1073, 2004a.
Zibordi, G., Melin, F., Hooker, S. B., D’Alimonte, D., and Holben, B.: An autonomous abovewater system for the validation of ocean color radiance data, IEEE Trans. Geosc. Rem. Sens., 42, 401–415, 2004b.
ESRIN/Contract No. 4000117454/16/1-SBo Fiducial Reference Measurements for Satellite Ocean Colour (FRM4SOC) D-
190: TR-8
Ref: FRM4SOC-TR-8 Date: 15.08.2018 Ver: 3.0 Page 43 (44)
Zibordi, G., Melin, F., and Berthon, J.-F.: Comparison of SeaWiFS, MODIS and MERIS radiometric products at a coastal site, Geophys Res. Lett., 33, L06617, doi:10.1029/2006GL025778, 2006.
Zibordi, G., Berthon, J.-F., and D’Alimonte, D.: An evaluation of radiometric products fixeddepth and continuous in-water profile data from a coastal site, J. Atmos. Ocean. Tech., 26, 91–186, 2009a.
Zibordi, G., Berthon, J.-F., M´elin, F., D’Alimonte, D., and Kaitala, S.: Validation of satellite ocean color primary products at optically complex coastal sites: Northern Adriatic Sea, Northern Baltic Proper and Gulf of Finland, Remote Sens. Environ., 113, 2574–2591, 2009b.
Zibordi, G., Holben, B., Slutsker, I., Giles, D., D’Alimonte, D, Melin, F., Berthon, J.-F., Vandemark, D., Feng, H., Schuster, G., Fabbri, B.E., Kaitala, S., and Sepp¨al¨a, J.: AERONET-OC: a network for the validation of Ocean Color primary radiometric products, J. Atmos. Ocean. Tech., 26, 1634–1651, 2009c.
Zibordi, G., Ruddick, K., Ansko, I., Moore, G. F., Kratzer, S., Icely, J. D., Reinhart, A. In situ determination of the remote sensing reflectance: an inter-comparison, Ocean Sci., 8, 567–586, 2012
Zielinski,O., Cembella,B., Heuermann, R. Bio-optical sensors onboard autonomous profiling floats. Proceedings of the International Conference on Offshore Mechanics and Arctic Engineering - OMAE. 25TH International Conference on Offshore Mechanics and Arctic Engineering, OMAE 2006; Hamburg; Germany; 4 - 9 June 2006; Code 68588; P. 5. 2006.
ESRIN/Contract No. 4000117454/16/1-SBo Fiducial Reference Measurements for Satellite Ocean Colour (FRM4SOC) D-
190: TR-8
Ref: FRM4SOC-TR-8 Date: 15.08.2018 Ver: Page 44 (44)
APPENDIX 1 HOTEL arrangements at AAOT
HOTEL
COMMENTS / FACILITIES
Hotel Mediterraneo, Chioggia, Venice.
Tourist hotel. Comfortable & pleasant.
Also open out of the tourist season.
Breakfast from 07:30 a.m. Not amenable to early
breakfast.