Embed Size (px)
Citation preview
From “Discards Management” to “Materials
Management”: Oregon’s 2050 Vision and
Framework for Action
David Allaway
Oregon Department of Environmental Quality
NEWMOA
June 6, 2017
David Allaway | Oregon Department of Environmental Quality
• Introduction:
What is “sustainable materials management” (SMM)?
Why is Oregon transitioning away from “discards management”
and into SMM?
• How is Oregon making this transition?
Vision/Plan effort
Enabling legislation
What is DEQ doing that is new or different as a result?
Overview of Today’s Webinar
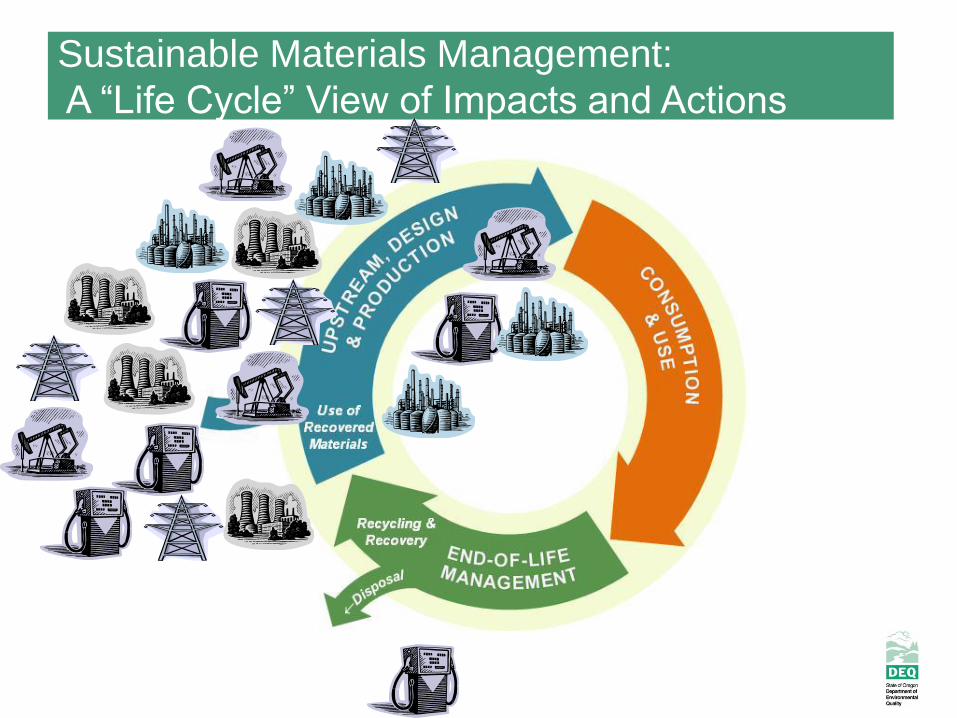
2 Working Definitions from US EPA:
“Materials management is an approach to using and
reusing resources most efficiently and sustainably
throughout their lifecycles. It seeks to minimize materials
used and all associated environmental impacts.”
“Materials management refers to the life cycle of materials
as they trace their course through the economy, from raw
material extraction to product manufacture, transport, use,
source reduction, reuse, recycling, and disposal.”
What is Materials Management?
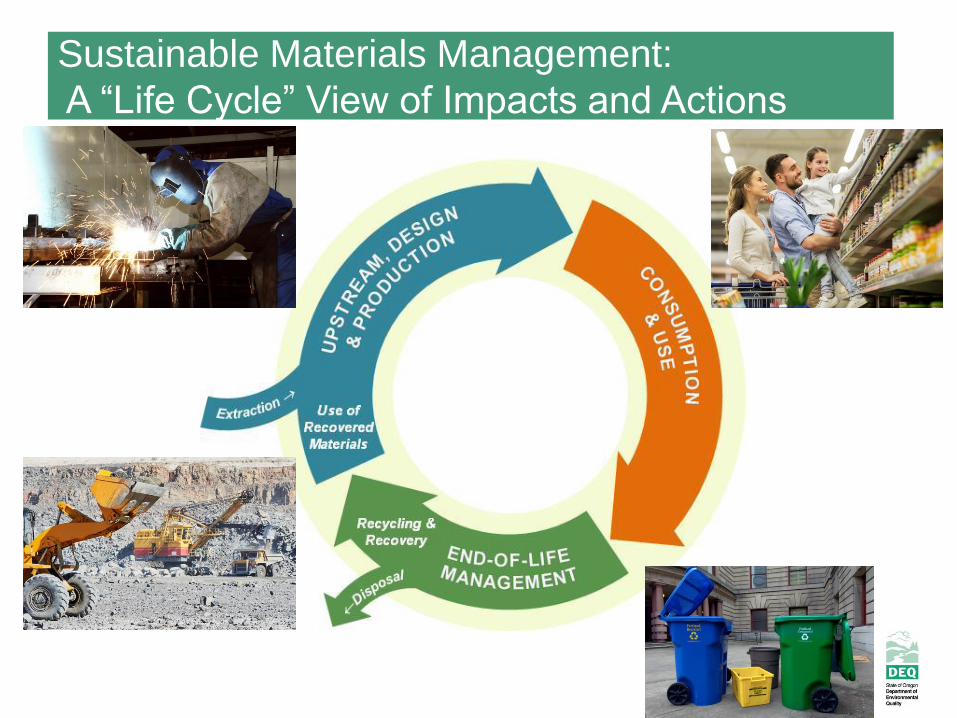
Sustainable Materials Management:
A “Life Cycle” View of Impacts and Actions
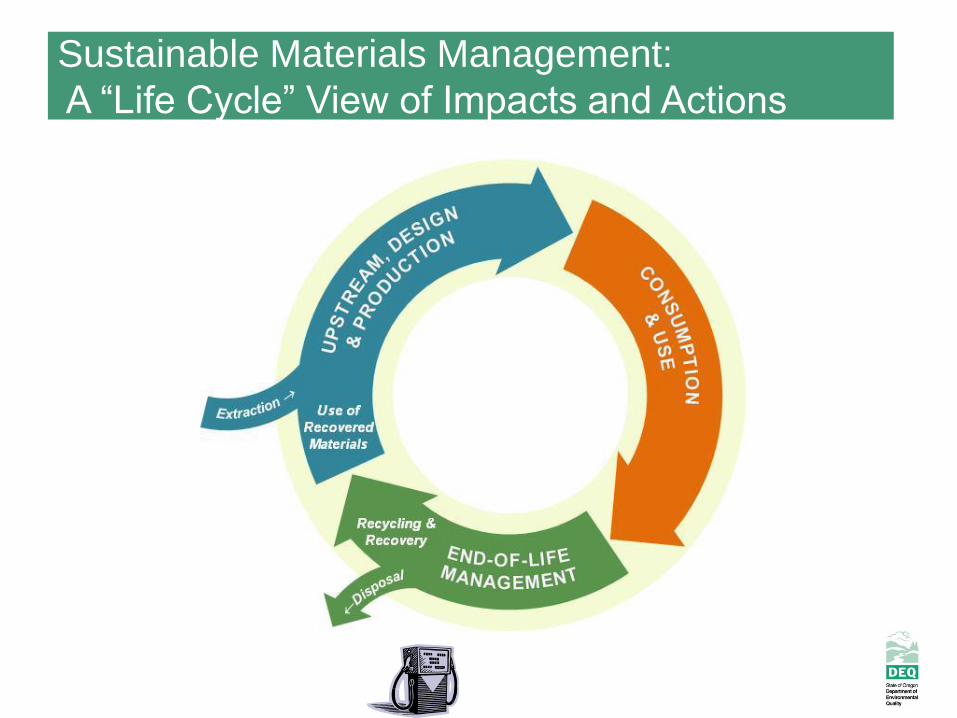
Sustainable Materials Management:
A “Life Cycle” View of Impacts and Actions
Sustainable Materials Management:
A “Life Cycle” View of Impacts and Actions
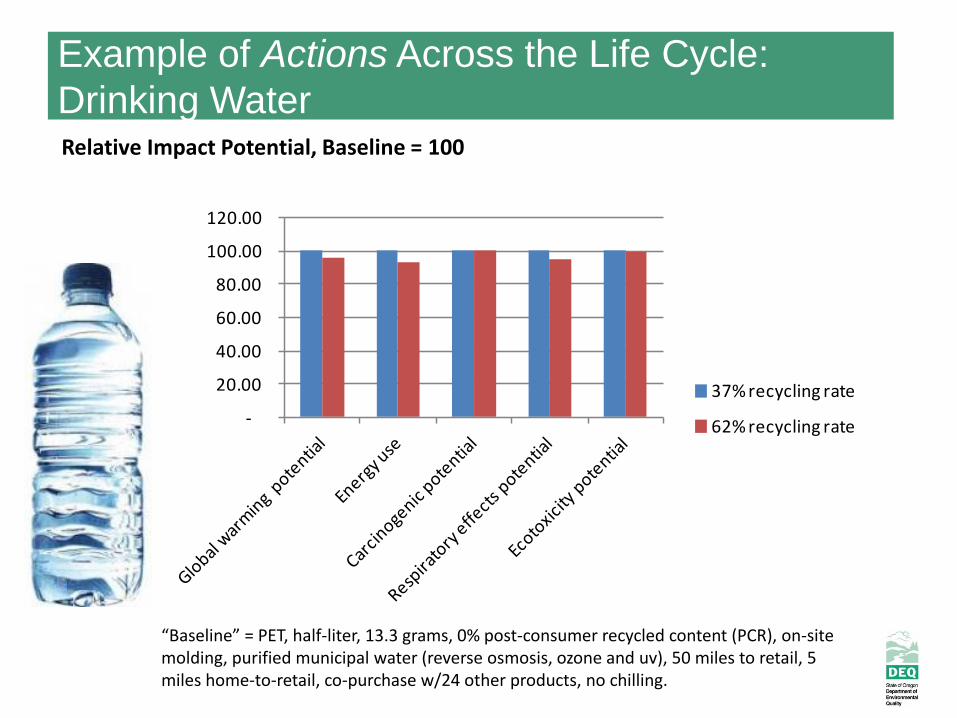
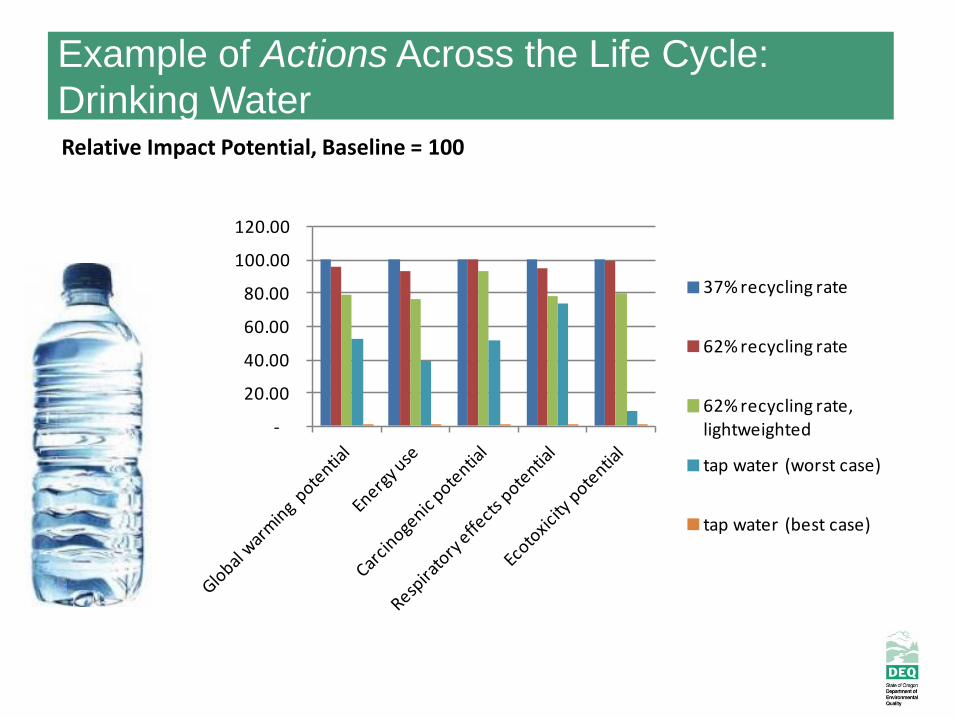
Example of Actions Across the Life Cycle:
Drinking Water
-
20.00
40.00
60.00
80.00
100.00
120.00
37% recycling rate
62% recycling rate
“Baseline” = PET, half-liter, 13.3 grams, 0% post-consumer recycled content (PCR), on-site molding, purified municipal water (reverse osmosis, ozone and uv), 50 miles to retail, 5 miles home-to-retail, co-purchase w/24 other products, no chilling.
Relative Impact Potential, Baseline = 100
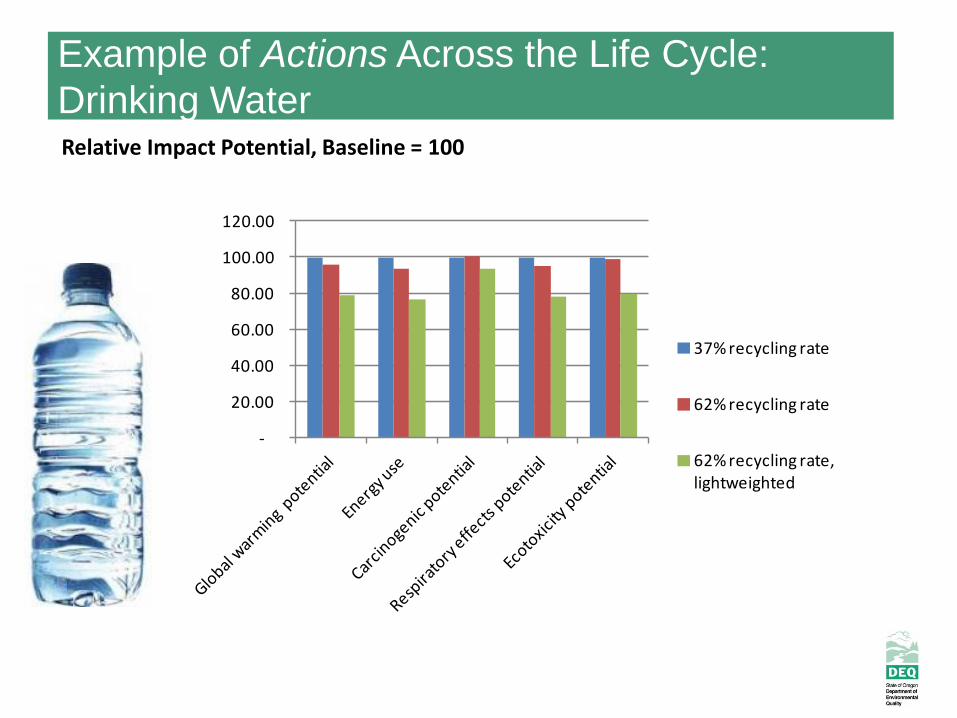
Example of Actions Across the Life Cycle:
Drinking Water
-
20.00
40.00
60.00
80.00
100.00
120.00
37% recycling rate
62% recycling rate
62% recycling rate, lightweighted
Relative Impact Potential, Baseline = 100
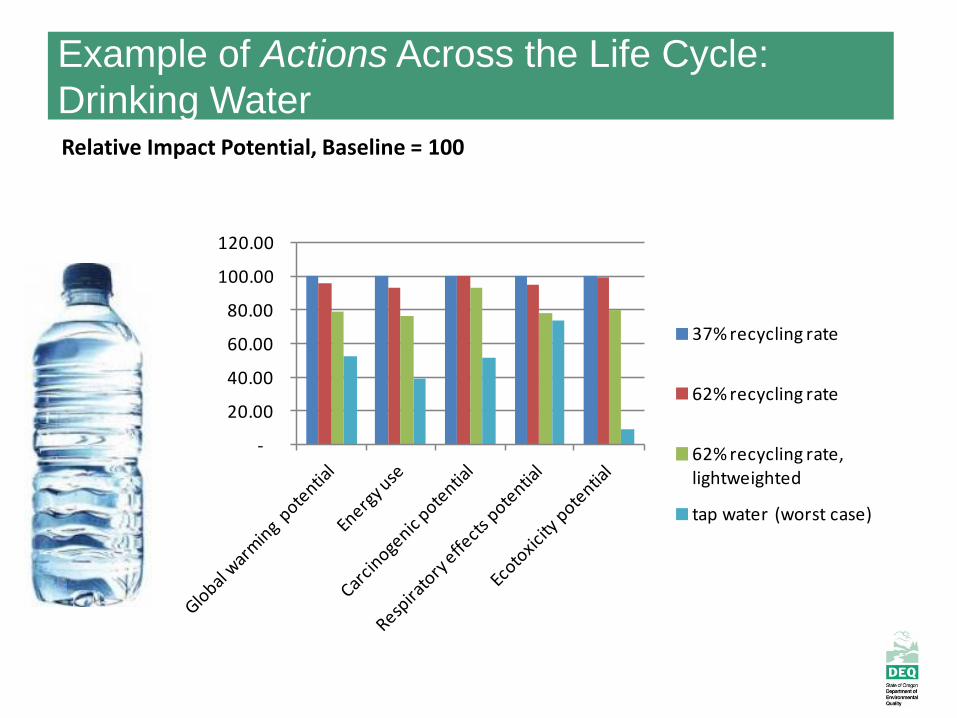
Example of Actions Across the Life Cycle:
Drinking Water
-
20.00
40.00
60.00
80.00
100.00
120.00
37% recycling rate
62% recycling rate
62% recycling rate, lightweighted
tap water (worst case)
Relative Impact Potential, Baseline = 100
Example of Actions Across the Life Cycle:
Drinking Water
-
20.00
40.00
60.00
80.00
100.00
120.00
37% recycling rate
62% recycling rate
62% recycling rate, lightweighted
tap water (worst case)
tap water (best case)
Relative Impact Potential, Baseline = 100
Answers Complex Questions about Choices and Impact - Everyday, people make choices about products and services:
• Which products do we buy?
• What are they made of and how are they made?
• How do we use them?
• What do we do with stuff when we’re through with it?
All of these choices have environmental consequences not limited to solid waste –some large, some small, almost all unseen.
Multi-attribute - Very narrowly focused attributes like “recyclable”, “biodegradable”, or “organic” don’t tell us about the actual environmental impacts that occur in all stages of the life cycle.
Offers Inter-related Solutions - SMM requires interaction between programs that deal with a wide range of media (air, water, etc.) to identify and address "hotspots" which cause major environmental impacts.
Why Materials Management
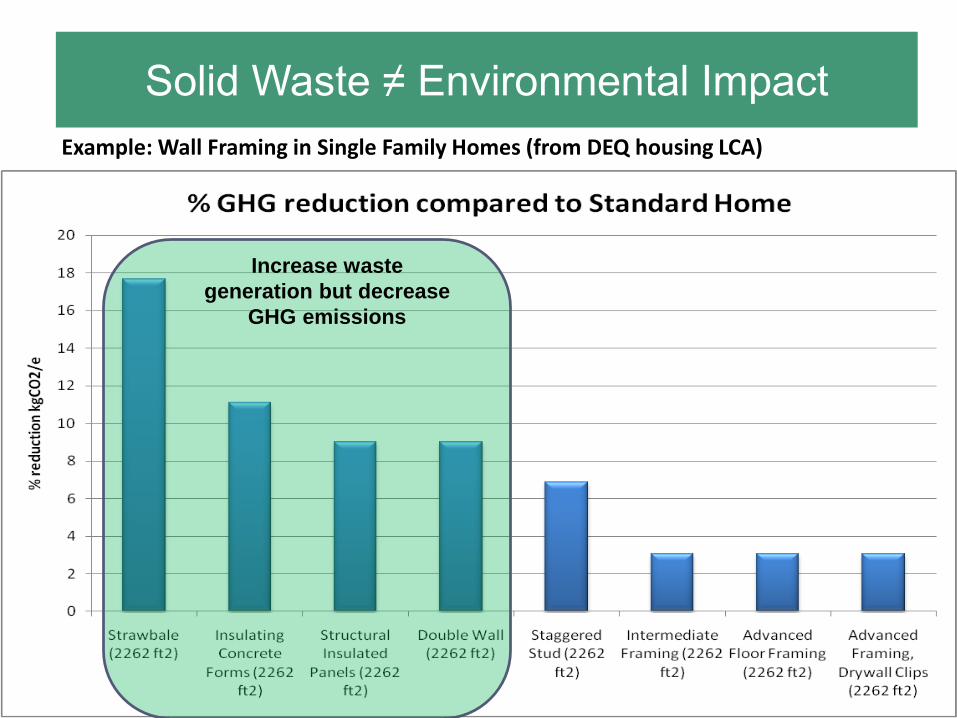
Increase waste
generation but decrease
GHG emissions
Solid Waste ≠ Environmental Impact
Example: Wall Framing in Single Family Homes (from DEQ housing LCA)
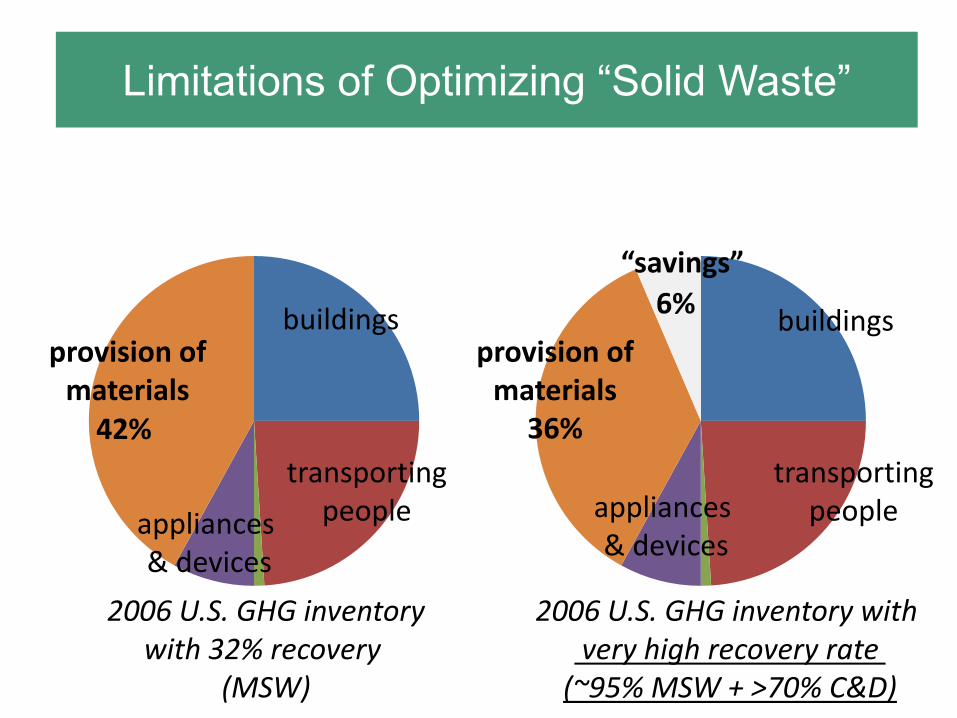
Limitations of Optimizing “Solid Waste”
42%
6%
2006 U.S. GHG inventorywith 32% recovery
(MSW)
2006 U.S. GHG inventory with very high recovery rate
(~95% MSW + >70% C&D)
provision ofmaterials
provision ofmaterials
36%
“savings”
buildings
transportingpeopleappliances
& devices
buildings
transportingpeopleappliances
& devices
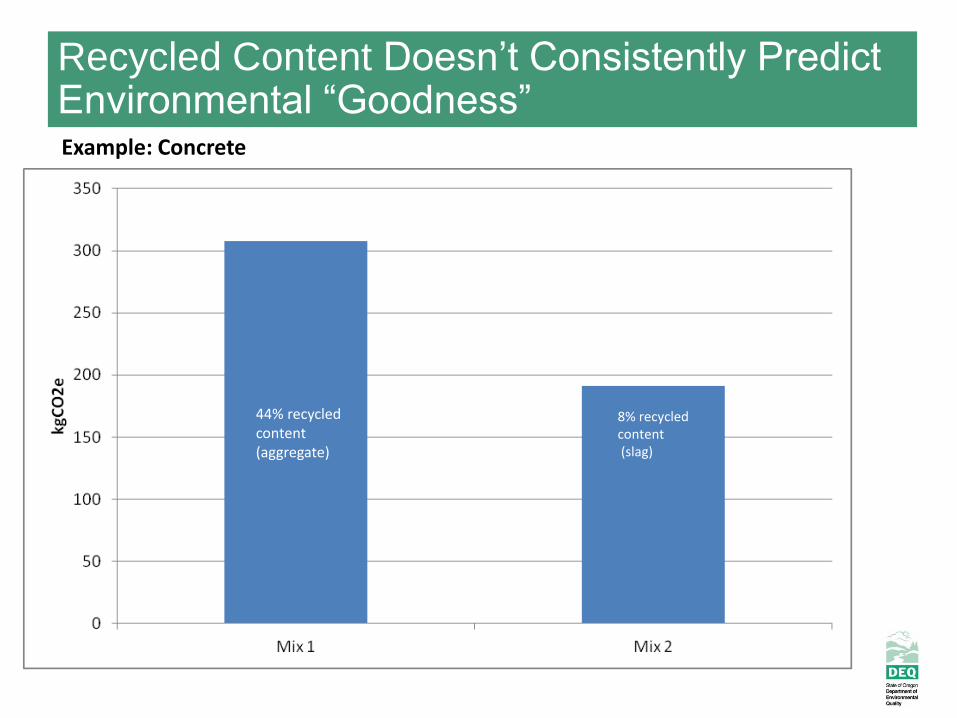
Recycled Content Doesn’t Consistently Predict Environmental “Goodness”Example: Concrete
44% recycled content (aggregate)
8% recycled content(slag)
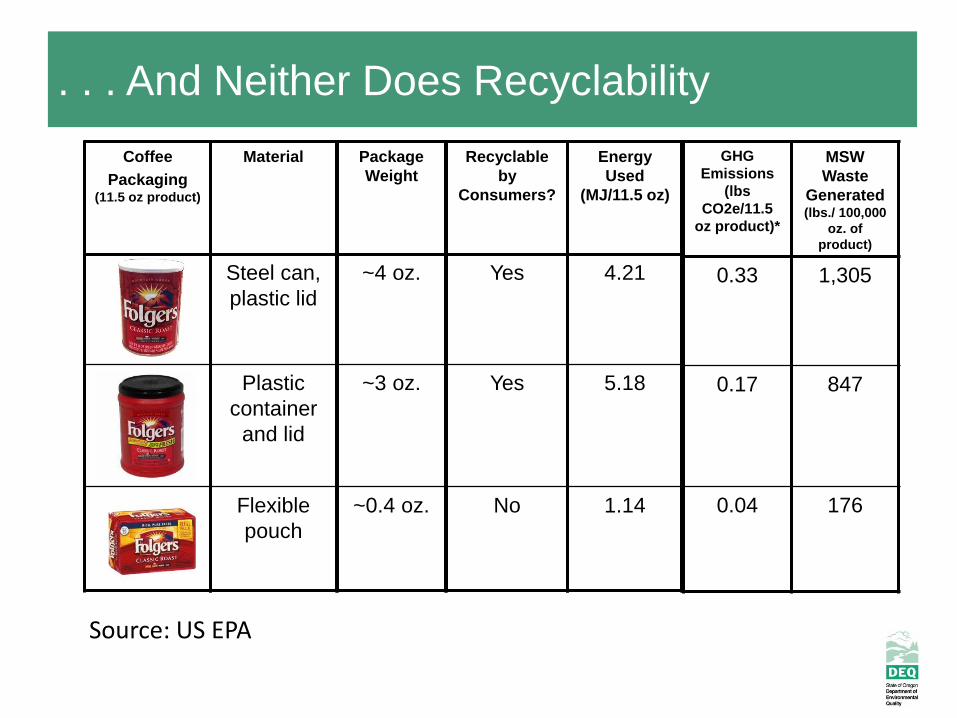
. . . And Neither Does Recyclability
44% recycled content (aggregate)
8% recycled content(slag)
Coffee
Packaging (11.5 oz product)
Material
Steel can,
plastic lid
Plastic
container
and lid
Flexible
pouch
Package
Weight
~4 oz.
~3 oz.
~0.4 oz.
Recyclable
by
Consumers?
Yes
Yes
No
Energy
Used
(MJ/11.5 oz)
4.21
5.18
1.14
GHG
Emissions
(lbs
CO2e/11.5
oz product)*
MSW
Waste
Generated (lbs./ 100,000
oz. of
product)
0.33 1,305
0.17 847
0.04 176
Source: US EPA
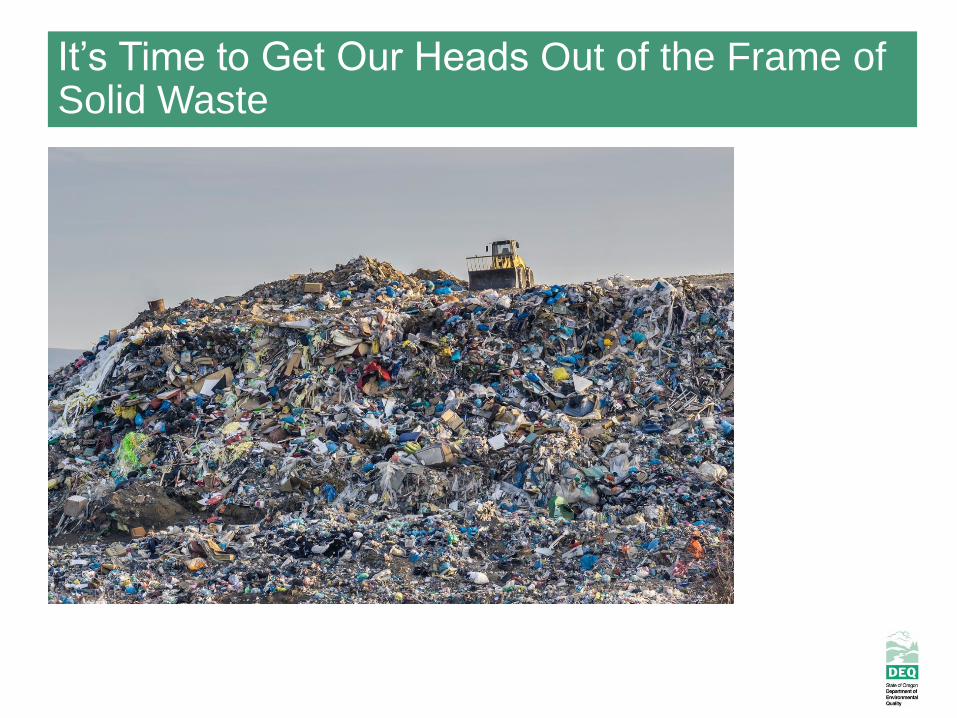
It’s Time to Get Our Heads Out of the Frame of Solid Waste
• Introduction:
What is “sustainable materials management” (SMM)?
Why is Oregon transitioning away from “discards management”
and into SMM?
• How did Oregon make this transition?
Vision/Plan effort
Enabling legislation
What is DEQ doing that is new or different as a result?
Overview of Today’s Webinar
Statutorily-Required State Plan
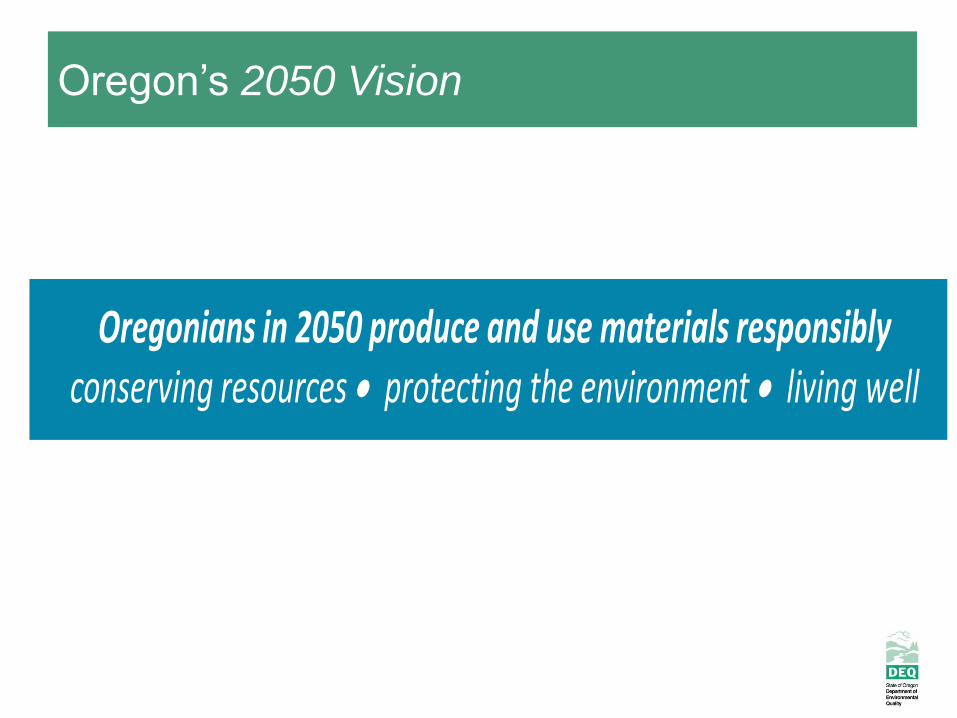
Oregon’s 2050 Vision
2050 Visionfor Materials Management in Oregon
Oregonians in 2050 produce and use materials responsiblyconserving resources protecting the environment living well
Oregon’s 2050 Vision
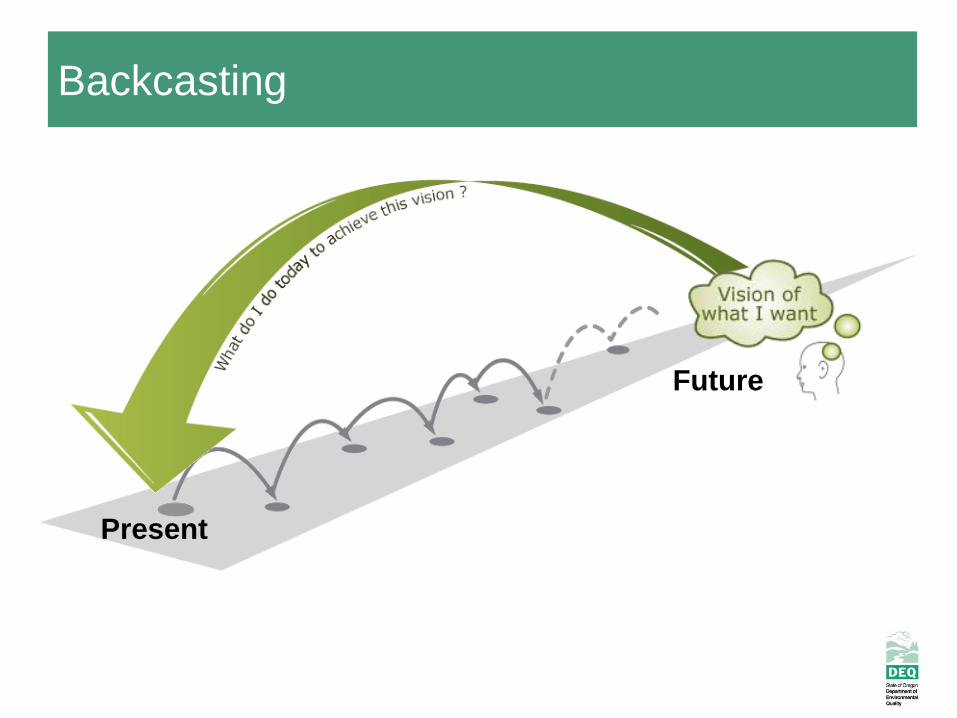
Backcasting
Present
Future
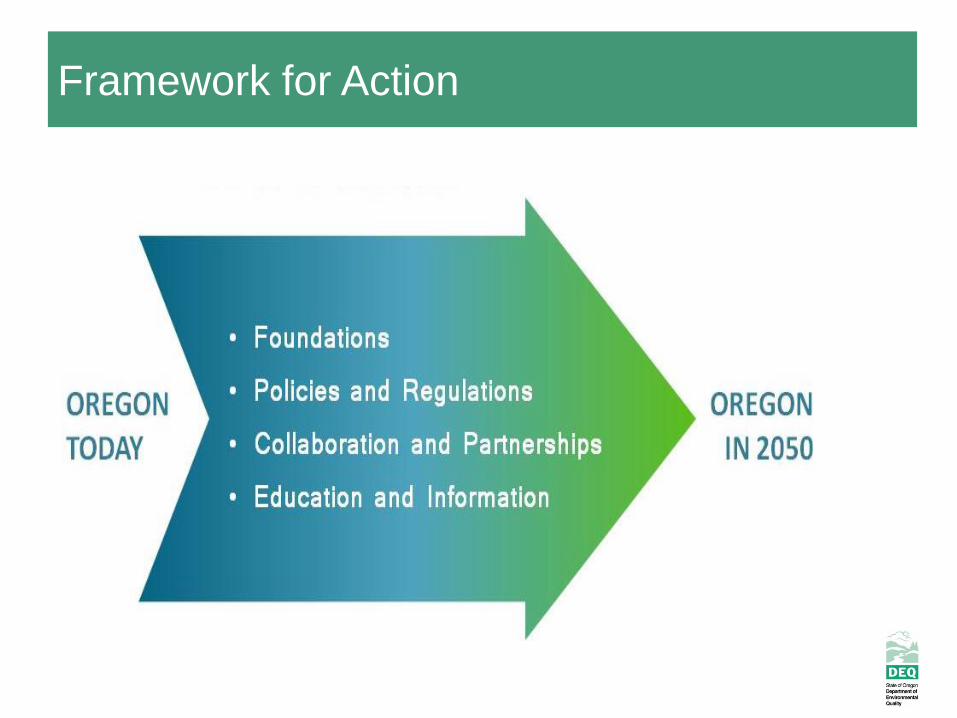
Framework for Action
• Not an implementation plan
• DEQ will reevaluate every six years
Framework for Action
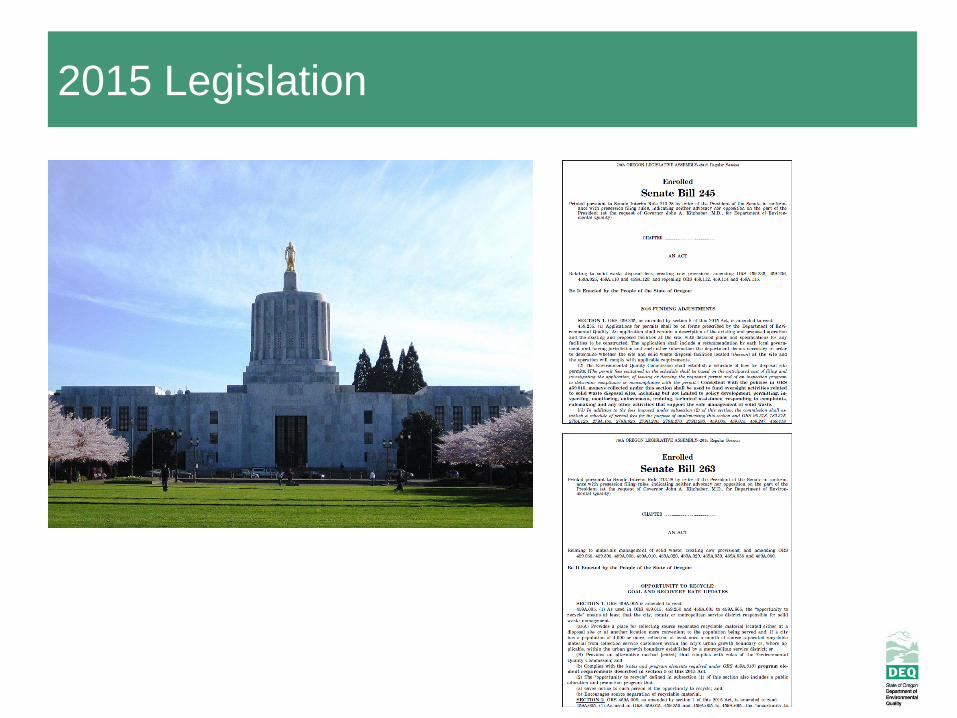
2015 Legislation
2015 Legislation: Key Outcomes
• Revised authority
• Restored and stable funding
• Expanded granting authority
• Revised/new goals Statewide recovery goal (all wastes)
Local (“wasteshed”) recovery goals
Statewide material-specific recovery goals (food, plastics, carpet)
“Outcome-based recovery rates”
Updated waste generation goals
• Changes to Oregon’s “Opportunity to Recycle” requirements New waste prevention and reuse program elements
New requirements related to reducing contamination
Closed multi-tenant recycling opportunity loophole
• Introduction:
What is “sustainable materials management” (SMM)?
Why is Oregon transitioning away from “discards management”
and into SMM?
• How did Oregon make this transition?
Vision/Plan effort
Enabling legislation
What is DEQ doing that is new or different as a result?
Overview of Today’s Webinar
Smorgasbord
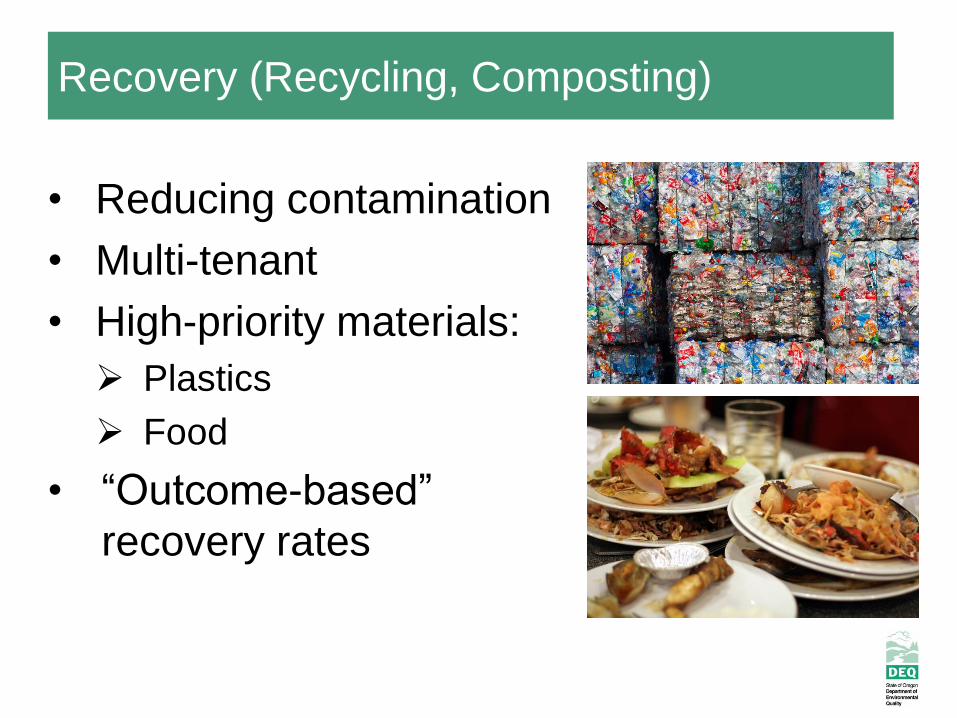
Recovery (Recycling, Composting)
• Reducing contamination
• Multi-tenant
• High-priority materials:
Plastics
Food
• “Outcome-based”
recovery rates
Preventing the Wasting of Food
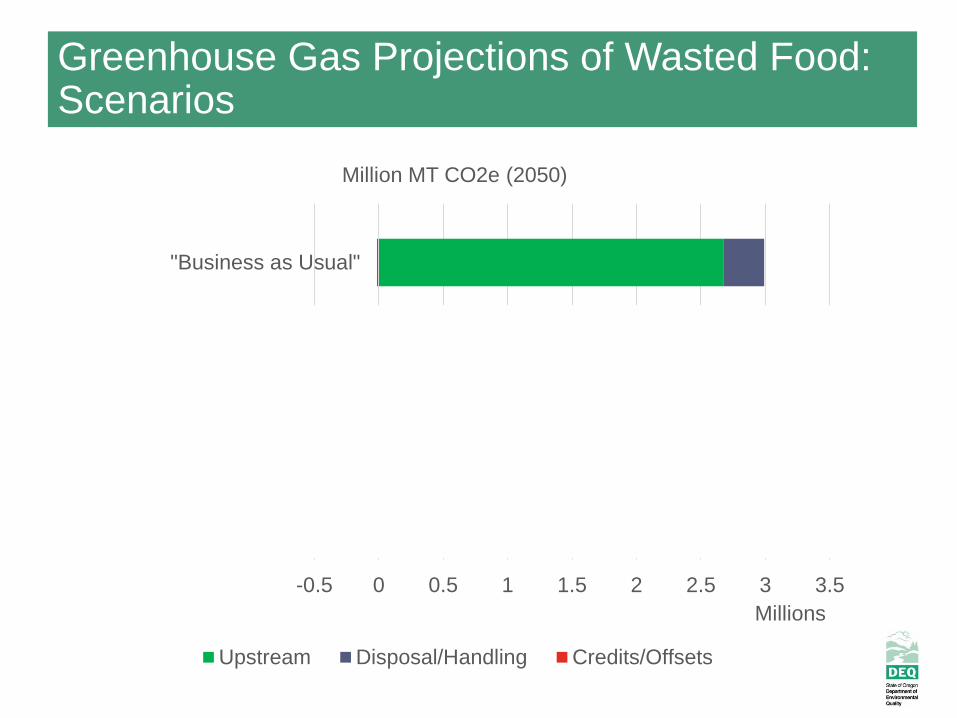
Greenhouse Gas Projections of Wasted Food: Scenarios
-0.5 0 0.5 1 1.5 2 2.5 3 3.5
"BAU" w/ 25% recovery, generation40% below 2012 levels
"BAU" w/ 25% recovery
"Business as Usual"
Millions
Million MT CO2e (2050)
Upstream Disposal/Handling Credits/Offsets
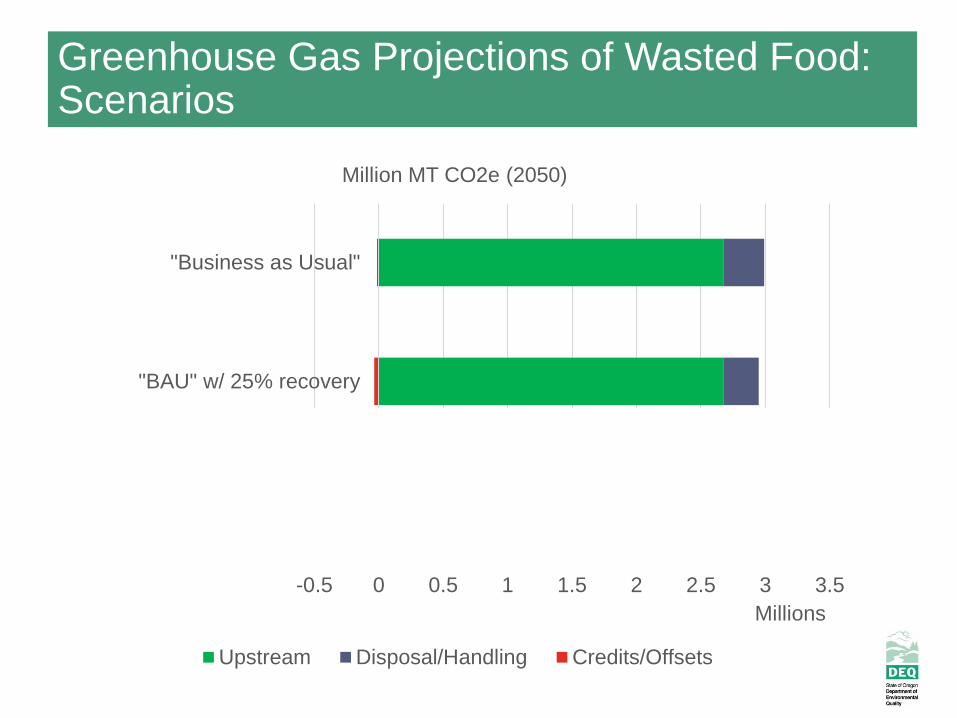
Greenhouse Gas Projections of Wasted Food: Scenarios
-0.5 0 0.5 1 1.5 2 2.5 3 3.5
"BAU" w/ 25% recovery, generation40% below 2012 levels
"BAU" w/ 25% recovery
"Business as Usual"
Millions
Million MT CO2e (2050)
Upstream Disposal/Handling Credits/Offsets
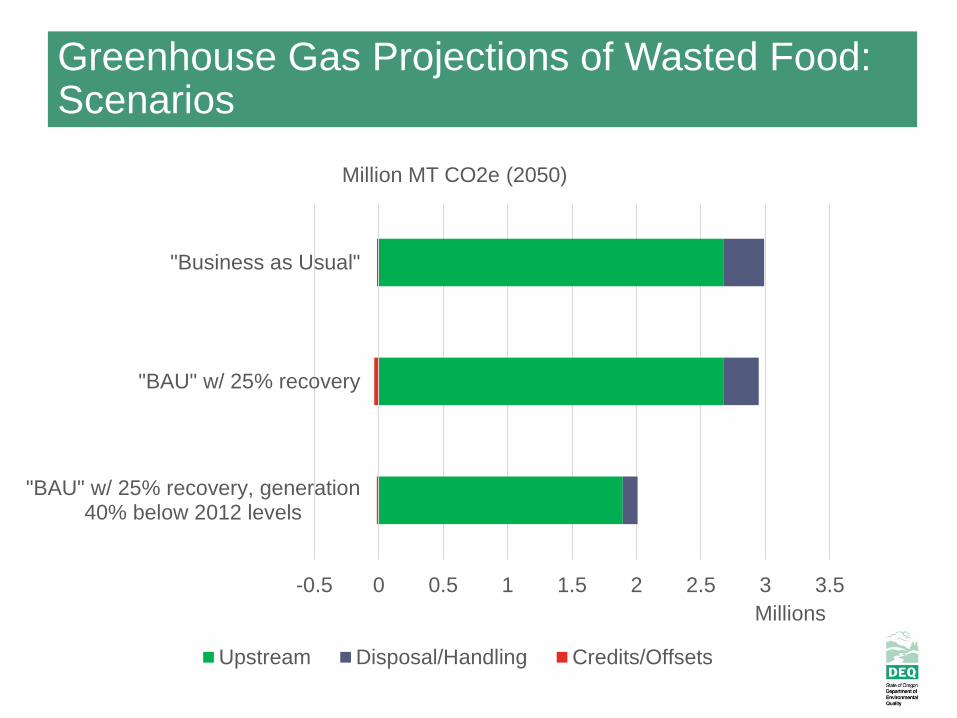
Greenhouse Gas Projections of Wasted Food: Scenarios
-0.5 0 0.5 1 1.5 2 2.5 3 3.5
"BAU" w/ 25% recovery, generation40% below 2012 levels
"BAU" w/ 25% recovery
"Business as Usual"
Millions
Million MT CO2e (2050)
Upstream Disposal/Handling Credits/Offsets
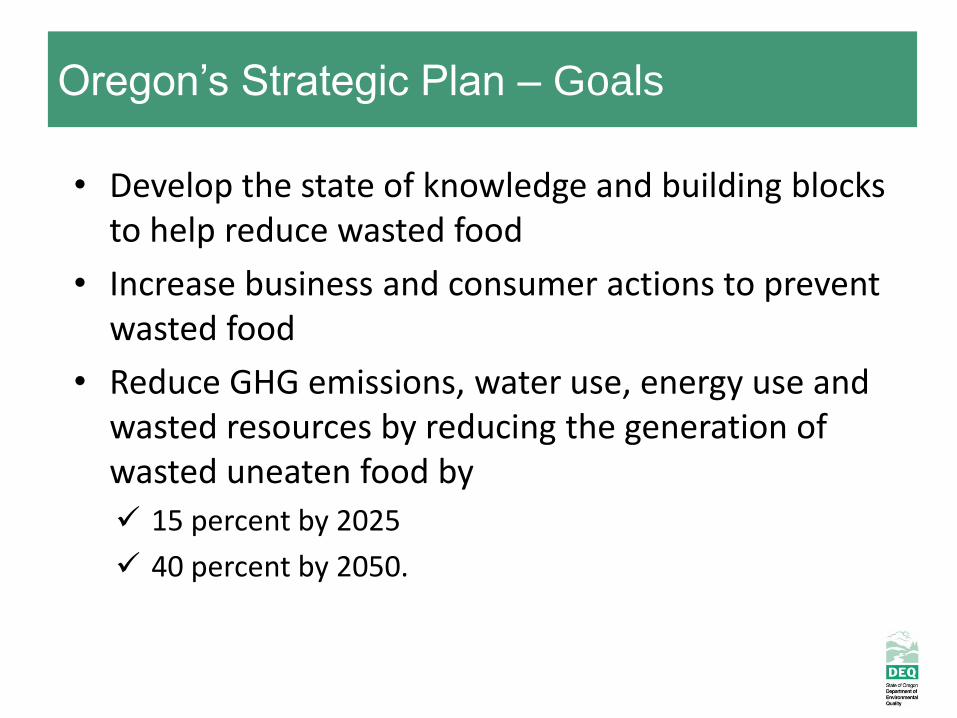
• Develop the state of knowledge and building blocks to help reduce wasted food
• Increase business and consumer actions to prevent wasted food
• Reduce GHG emissions, water use, energy use and wasted resources by reducing the generation of wasted uneaten food by
15 percent by 2025
40 percent by 2050.
Oregon’s Strategic Plan – Goals
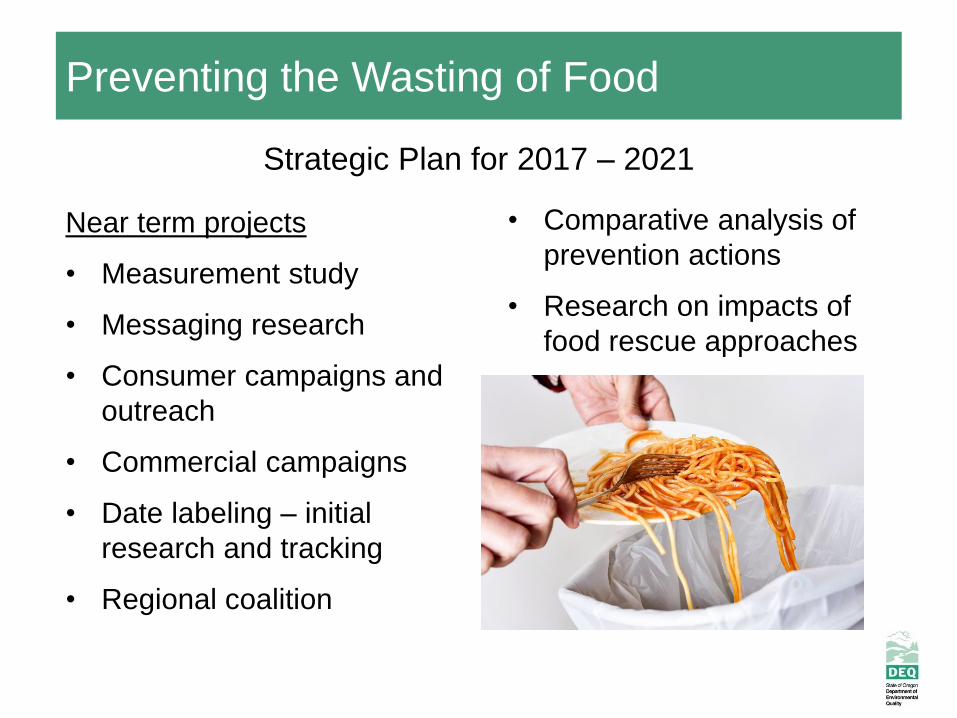
Preventing the Wasting of Food
Near term projects
• Measurement study
• Messaging research
• Consumer campaigns and
outreach
• Commercial campaigns
• Date labeling – initial
research and tracking
• Regional coalition
Strategic Plan for 2017 – 2021
• Comparative analysis of
prevention actions
• Research on impacts of
food rescue approaches
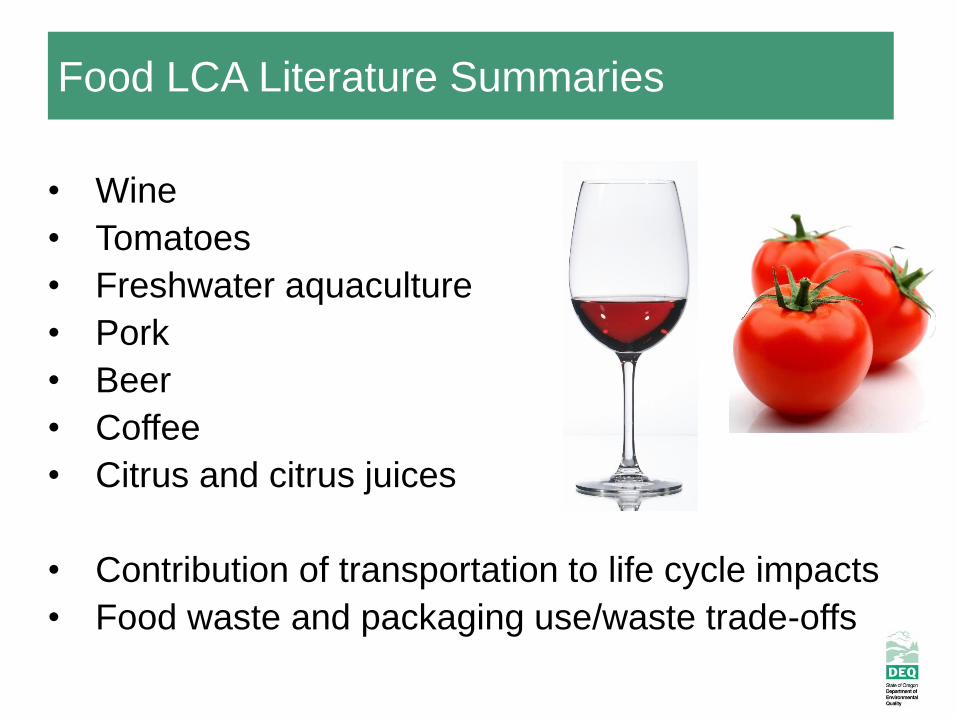
Food LCA Literature Summaries
• Wine
• Tomatoes
• Freshwater aquaculture
• Pork
• Beer
• Coffee
• Citrus and citrus juices
• Contribution of transportation to life cycle impacts
• Food waste and packaging use/waste trade-offs
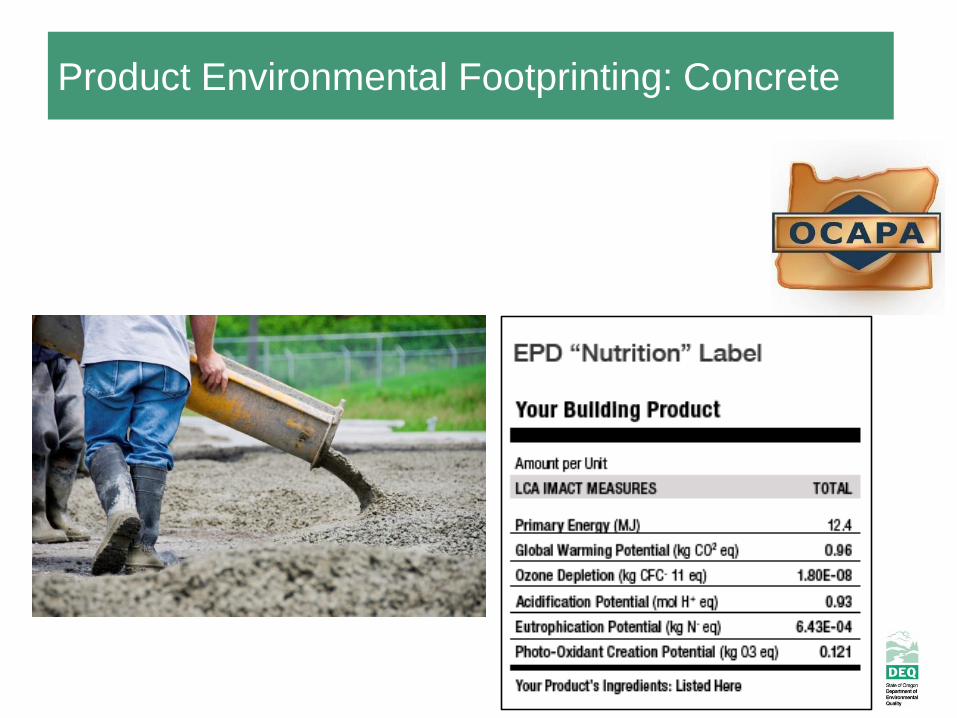
Product Environmental Footprinting: Concrete
Reuse, Repair and Product Lifespan Extension
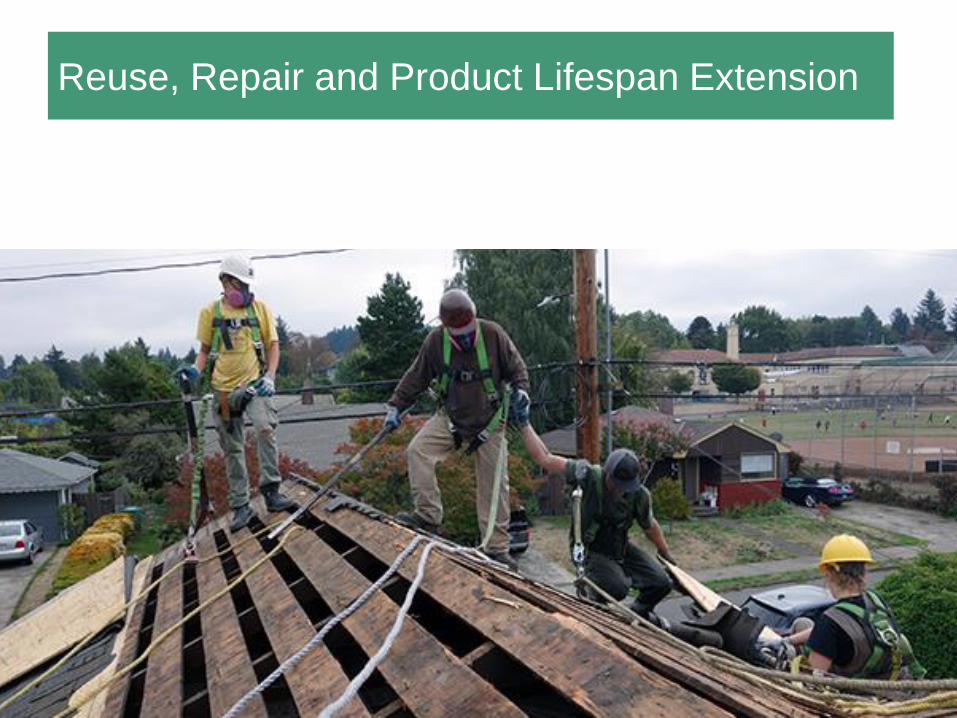
Reuse, Repair and Product Lifespan Extension
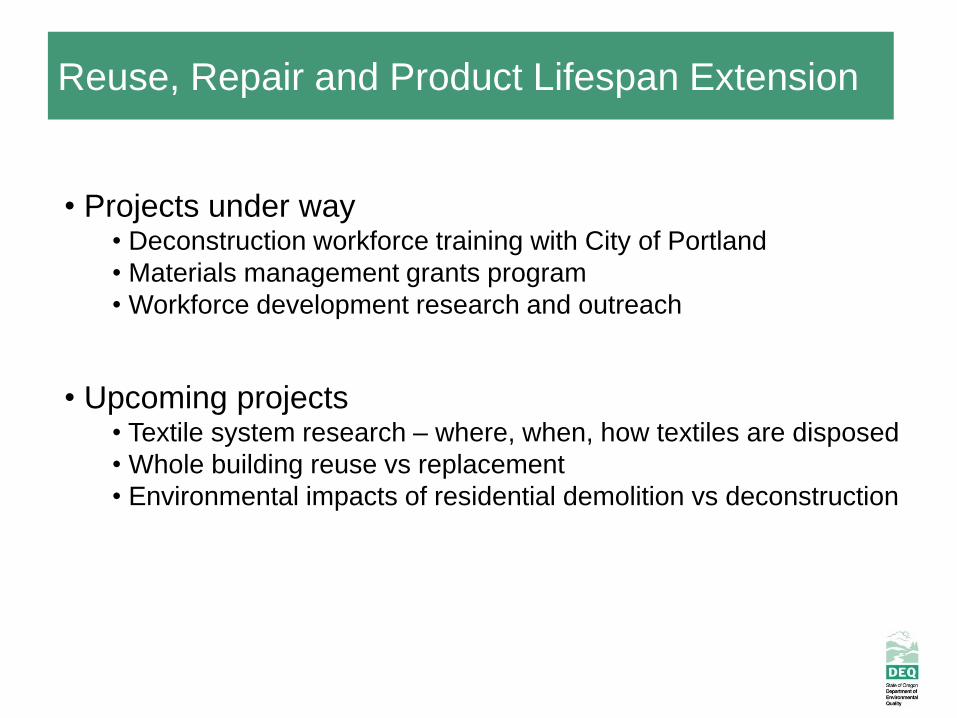
• Projects under way• Deconstruction workforce training with City of Portland
• Materials management grants program
• Workforce development research and outreach
• Upcoming projects• Textile system research – where, when, how textiles are disposed
• Whole building reuse vs replacement
• Environmental impacts of residential demolition vs deconstruction
Reuse, Repair and Product Lifespan Extension
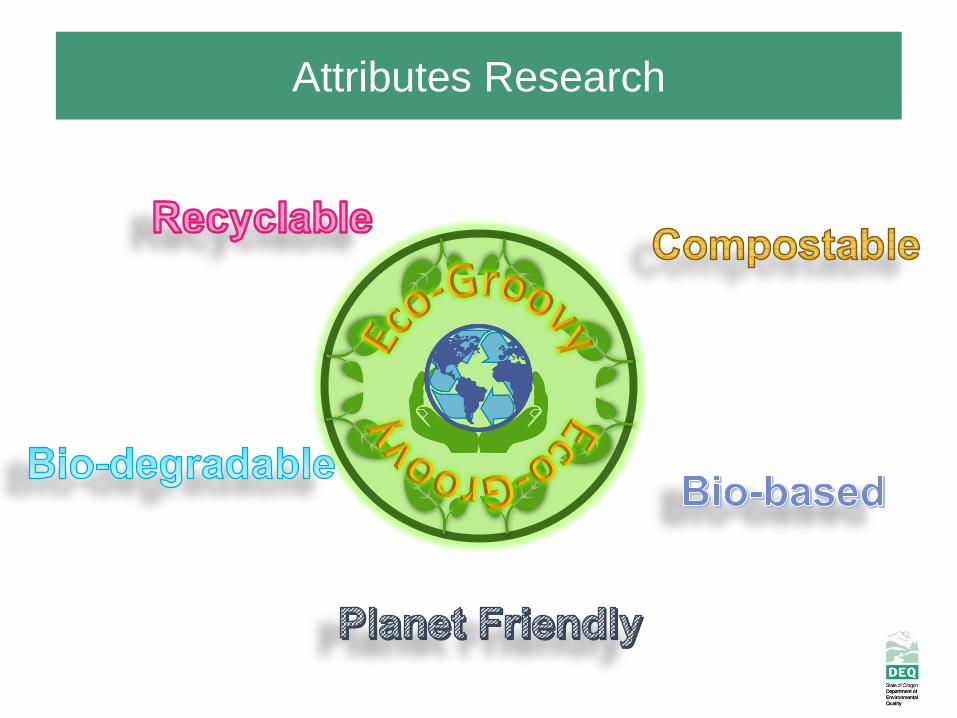
Attributes Research
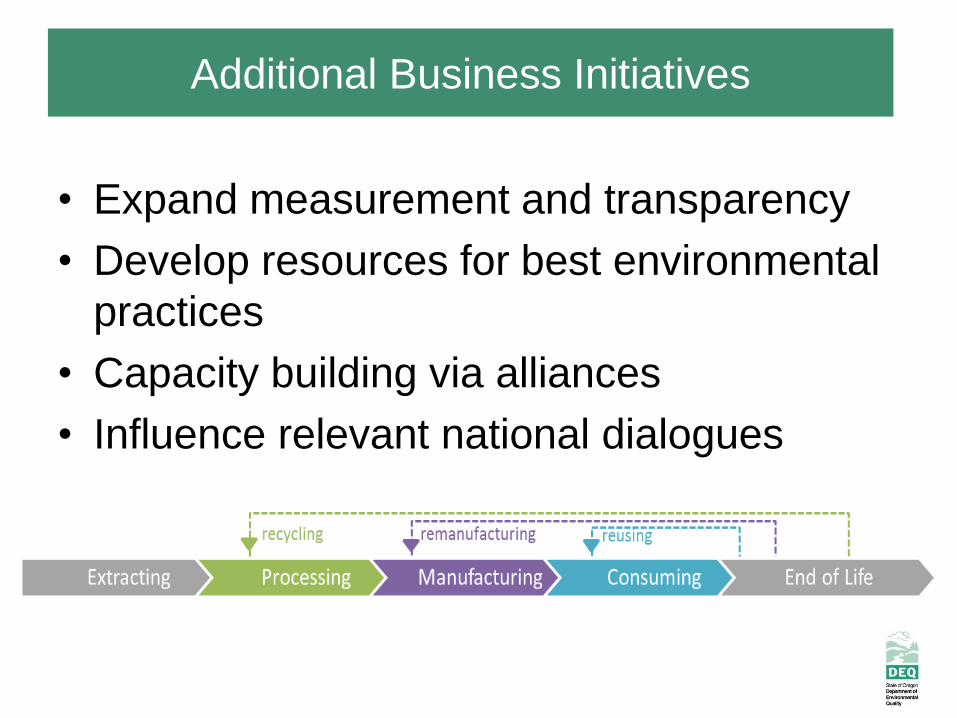
Additional Business Initiatives
• Expand measurement and transparency
• Develop resources for best environmental
practices
• Capacity building via alliances
• Influence relevant national dialogues
Purchasing
Accelerate environmental standards in state and local purchasing
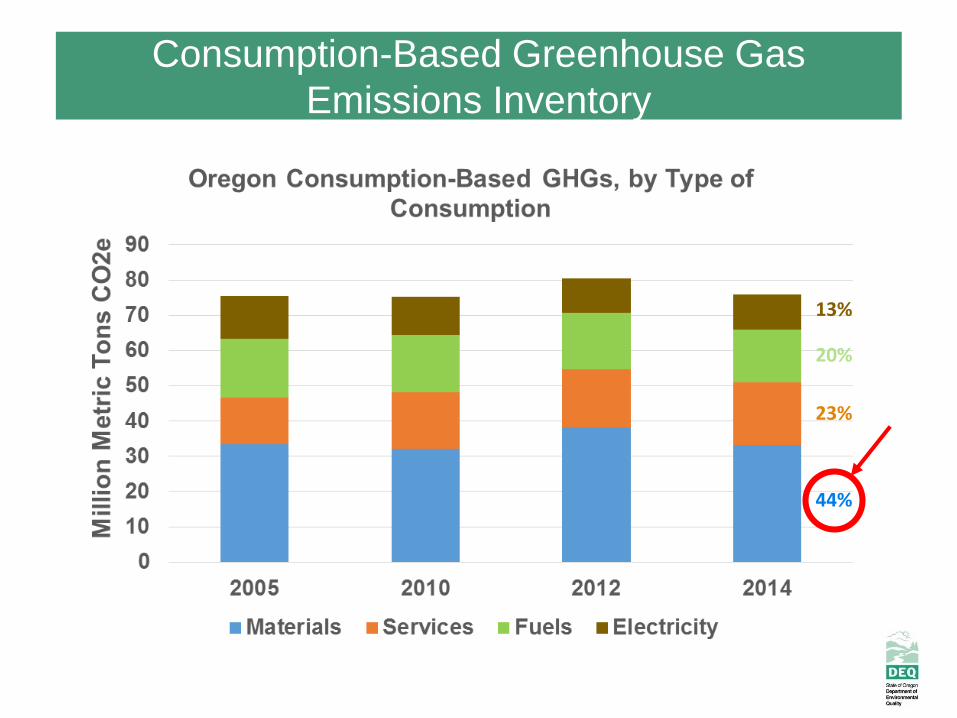
Consumption-Based Greenhouse Gas
Emissions Inventory
44%
23%
20%
13%


![Marine Policy Archimerarchimer.ifremer.fr/doc/00183/29415/27776.pdf · discards have been observed on board professional vessels [19]. ... The assessment of discards has also been](https://img.pdfslide.net/doc/110x75/5b90281409d3f2857e8b4a0f/marine-policy-discards-have-been-observed-on-board-professional-vessels-19.jpg)