Embed Size (px)
Citation preview

REVIEW
From bedside to bench—practical considerations to avoidpre-analytical pitfalls and assess sample quality for high-resolutionmetabolomics and lipidomics analyses of body fluids
Rainer Lehmann1,2,3
Received: 25 April 2021 /Revised: 24 May 2021 /Accepted: 31 May 2021# The Author(s) 2021
AbstractThe stability of lipids and other metabolites in human body fluids ranges from very stable over several days to veryunstable within minutes after sample collection. Since the high-resolution analytics of metabolomics and lipidomicsapproaches comprise all these compounds, the handling of body fluid samples, and thus the pre-analytical phase, is ofutmost importance to obtain valid profiling data. This phase consists of two parts, sample collection in the hospital(“bedside”) and sample processing in the laboratory (“bench”). For sample quality, the apparently simple steps in thehospital are much more critical than the “bench” side handling, where (bio)analytical chemists focus on highly stan-dardized processing for high-resolution analysis under well-controlled conditions. This review discusses the most criticalpre-analytical steps for sample quality from patient preparation; collection of body fluids (blood, urine, cerebrospinalfluid) to sample handling, transport, and storage in freezers; and subsequent thawing using current literature, as well asown investigations and practical experiences in the hospital. Furthermore, it provides guidance for (bio)analyticalchemists to detect and prevent potential pre-analytical pitfalls at the “bedside,” and how to assess the quality of alreadycollected body fluid samples. A knowledge base is provided allowing one to decide whether or not the sample quality isacceptable for its intended use in distinct profiling approaches and to select the most suitable samples for high-resolutionmetabolomics and lipidomics investigations.
Keywords Metabolomics . Lipidomics . Pre-analytic . Blood . Urine . Cerebrospinal fluid . Serum . Plasma
Introduction
In targeted and non-targeted biomedical metabolomics andlipidomics studies, the quality of the achieved analytical data isnot only dependent on the knowhow and experience of(bio)analytical chemists, but is highly dependent on the qualityof the sample. Low-quality samples caused by inaccuracies in thepre-analytical phase are the reason for up to 80% of laboratorytesting errors in daily clinical routine diagnostics [1–3]. Coveringa multitude of lipids and other metabolites of extremely differentstabilities, the sample quality is very critical for high-resolutionapproaches, which is in contrast to targeted analysis of selecteddistinct parameters in clinical chemical diagnostic routine. So,accidental or systematic pre-analytical issues affecting com-pounds with low stability can lead to high variability in the ana-lytical data or even bias final results and conclusions.
Published in the topical collection Recent Trends in (Bio)AnalyticalChemistry with guest editors Antje J. Baeumner and Günter Gauglitz.
* Rainer [email protected]
1 Institute for Clinical Chemistry and Pathobiochemistry, UniversityHospital Tuebingen, Hoppe-Seyler-Strasse 3,72076 Tuebingen, Germany
2 Core Facility Clinical Chemistry Laboratory, German Center forDiabetes Research (DZD), 72076 Tuebingen, Germany
3 Department for Molecular Diabetology, Institute for DiabetesResearch and Metabolic Diseases of the Helmholtz ZentrumMuenchen at the University of Tuebingen, University of Tuebingen,72076 Tuebingen, Germany
https://doi.org/10.1007/s00216-021-03450-0
/ Published online: 22 June 2021
Analytical and Bioanalytical Chemistry (2021) 413:5567–5585

It is important to note in this context that the mostcritical steps regarding the quality of body fluid samplestake place in the clinical settings or the animal house, butnot in the laboratories of analytical (bio)chemists orbiobanks where all processes are usually highly standard-ized and strictly controlled to avoid any deterioration ofsample quality (Fig. 1). In many clinical settings, the col-lection of study samples is a compromise between re-quirement and feasibility. Hence, (bio)analytical chemistsshould be aware that the samples, although entitled to beof high quality, may have some limitation with respect tospecific needs essential for high-resolution analysis. Thisstands in contrast to the usual statement that sample col-lection is the easy part in complex biomedical biomarkerstudies. Figure 1 shows major steps of the pre-analyticalphase including cross references to the correspondingchapters, as well as examples of probable limitations atthe site of sample collection.
This review will discuss key aspects of the pre-analyticalphase, such as collection of body fluids (blood, urine, cerebro-spinal fluid), sample handling, transportation, and storage infreezers. It will provide a base for identification of potentialpre-analytical pitfalls already in the planning phase and enableto assess the quality of already collected body fluid samples.This information should facilitate the decision to select themost appropriate sample for each profiling approach, sinceeven the best high-end instruments and/or greatest analyticalexperience and efforts of (bio)analytical chemists cannot
compensate effects of pre-analytical inadequacies and errors.Best practice strategies and potential pitfalls of the pre-analyt-ical multistage body fluid processing for lipid and metaboliteextraction are discussed in detail elsewhere [4–6] and will notbe considered in the context of this review.
The planning phase in a biomedicalmetabolomics and lipidomics study
The planning phase is an important first pre-analytical step,although it takes place before sample collection. At this point,future limitations and errors affecting sample quality shouldbe identified, jointly discussed by all involved scientists, i.e.,(bio)analytical chemists, study nurses, clinical doctors, etc.,and subsequently eliminated. Table 1 summarizes notes andconsiderations for those discussions. Usually, a mismatch ex-ists between the idea of ideal sample collection conditions andactual logistic and practical possibilities, respectively limita-tions. This implies the need for compromises and well-bal-anced joint decisions which are finally committed in recom-mendations and standard operating procedures (SOPs) to en-sure collection of good-quality samples for metabolomics andlipidomics analyses. It means agreeing on sample collectionand handling procedures that are practical and achievable byall parties. The following chapters highlight all the critical pre-analytical steps with respect to most common errors and howto avoid them, and offer as well as suggestions and
Planning phase Pre-analytical phase
Bedside
Patient / participantpreparation
(Chapt. 6)
Body fluid sampling
(blood; Chapt. 3)(urine; Chapt. 4)(CSF; Chapt. 5)
Centrifugation (Chapt. 3.3.3.2)
Transportation(Chapt. 3.2.1
and 4.3)
Examples of occasionally met limitations at the site of sample collection, which
should be checked**
Bench - Laboratory side -
(bio)analytical experts
Freezer / storage
(Chapt. 3.6.)
Time /Temperature !
Thawing / refreezing(Chapt. 3.6.)
Sample preparation for high-resolution profiling
Very critical* Less critical* Usually safe*
*with regard to effects on sample quality**ambient temperature during sampling/handling (air conditioned, not regulated?) // staff in charge for body fluid sampling (rotating, ever-changing, experts ore.g. students?) // interruption during sampling or handling by other clinical duties (phone call, patients,…)? // nearby cooling options for body fluids (refrigerator, ice machine,…?) // distance to the next centrifuge (realistic time span to reach?) // availability of this centrifuge (unpredictable processing delays?) // standardized sample transportation conditions (fixed temperature, time, duration, etc.?) // storage options for body fluid aliquots after centrifugation until final long-term storage (+4°C, -20°C, -80°C?)
Fig. 1 Flowchart of the pre-analytical phase from bedside to bench in biomedical metabolomics and lipidomics projects. Risk assessment was appliedsolely with regard to negative effects on sample quality (multistage metabolite and lipid extraction is not considered)
5568 Lehmann R.

recommendations for solutions on how to get high-qualitybody fluids from the bedside to the bench for metabolomicsand lipidomics analyses.
Blood samples
Collection tubes may introduce chemical noise
Nowadays, venipuncture tubes are generally made of plasticrather than glass. Two main types of tubes are commonly inuse in hospitals, either containing a polymer-based gel whichseparates cellular compounds from plasma or coagulum fromserum after a centrifugation step, or tubes without such a sep-arator between serum/plasma and cellular compounds.Additionally, tubes contain usually additives, either an antico-agulant to prevent clotting (plasma tubes) or a clottingpromotor to reduce the coagulation time of whole blood (se-rum tubes).
The release of plasticizers from blood collection tubes intosamples is a potential issue that may have a particularly neg-ative impact on high-resolution mass spectrometric analysis.Furthermore, additives in tubes may contain interfering com-pounds [7], e.g., spurious amount of sarcosine in one brand ofEDTA vacutainer tubes [8]. Tubes containing gel-based sep-arators should be used with caution due to the risk of impropergel barrier formation [9, 10] or alteration of the concentrationof metabolite groups of interest or distinct compounds by thegel, e.g., methionine sulfoxide [10].
This means that during the planning phase of a project, theblood collection tubes to be used should be tested to determinewhether they are suitable or whether they contain or releaseinterfering compounds (Table 1). A detailed test descriptiontubes can be found for example in the method section of ref-erence [7]. The suitability check also applies to all other plastictubes and compounds planned to be used in the pre-analyticalprocess up to sample preparation for mass spectrometric anal-ysis, i.e., for all types of liquids (e.g., solvents), pipette tipsand other plastic products, with regard to short- and long-termsample storage in freezers or liquid nitrogen, the suitability ofcryotubes or other vials and the corresponding labels(Table 1). Special attention is needed when long-term freezingat ultra-low temperatures is planned, because not all labels andmarkings endure temperatures of −80 °C or −196 °C, which inthe worst case can lead to detached labels.
Whole blood
From blood drawing until separation from cells is most criticalfor plasma and serum quality
Blood is the most commonly analyzed body fluid in biomed-ical metabolomics and lipidomics studies (Fig. 2). In a se-quence drawing blood in different tubes for various analyticalpurposes, the question arises which is the best sampling order,particularly which position is best for the tube for metabolo-mics and lipidomics. Up to now, no data exist to answer thisquestion, but the tube for metabolomics and lipidomics should
Table 1 Notes and considerations for the planning phase
Materials- check suitability of all tubes and tips (chemical resistance,contaminations, etc.)
- in multi-center studies:- use same brand and type, i.e., material, additive(s), etc.- harmonize sample labeling for all participating sites- if different brands are unavoidable test all sample collectors,tubes, …
- tube labels: do they withstand all storage conditions (e.g., −196 °C ofliquid nitrogen)?
Study participants- prepare a comprehensible participant instruction and meaningful study
questionnaire- standardize participant conditions
- fasting period (≥ 12 h)- resting period (no unaccustomed or strenuous physicalactivity 48 h before collection)
- day time for sample collection (ideally between 7 and 10 am)- health state of control groups: perform simple clinical chemical test andrecord results
- some aspects to be considered in a study questionnaire- anthropometric data- stress before sample collection- unaccustomed situations the day before sample collection(extreme exercise, food excess,…)
- xenobiotics, dietary supplements, drugs- life style factors (e.g., alcohol consumption per day or week,cigarettes per day,…)- food or special food the day/evening before specimencollection
- special diets (e.g., Atkins diet, vegan,…)
Storage of the metabolomics and lipidomics data- define precisely data storage architecture (e.g., file and sample name),access privileges, and data back-up
Body fluid collection and preparation- apply uniform sample labeling- define sample type and collected volume
- plasma or serum (which additive)?- midstream second morning urine or 24-h collection urine?
- standardize collection procedure (e.g., tourniquet application time, siteof venipuncture, collection order for different tubes, sample mixing,…)
- sample handling and transportation: standardize time period andtemperature until centrifugation (continuous cooling is highlyrecommended)
- processing delays: define acceptance criteria regarding sample stability- define centrifugation conditions for blood, urine, CSF (G force,temperature, time, brake use, etc.)
- standardize the post-centrifugation period until storage or furtherprocessing (should be as short as possible, but fulfillable)
- define volume and number of sample aliquots for long-term storage at−80 °C or below by the analytical needs
- thaw samples at 4 °C and standardize accurate mixing of thawedsamples (avoid repetitive freeze-thaw cycles and mark refrozensamples)
- deviations from the protocol: specify recording and documentation(information should be accessible to all involved scientists)
5569From bedside to bench—practical considerations to avoid pre-analytical pitfalls and assess sample quality...

not be the first one, at least if the collection of plasma isintended (for details, see the “Usable and unusableanticoagulation additives” section and Table 2). After bloodsampling, nearly half of the volume in the tube consists ofcellular compounds, and the other part is serum or plasma,depending on the collection tube that is used. These billionsof cells are highly active in the anaerobic milieu of the tube,continuously releasing, up taking, and metabolizing metabo-lites. Detectable effects on the metabolome depend mainly onthe interval until erythrocytes, leucocytes, and platelets areseparated from plasma or serum and on the temperature duringthis time period [11–13]. For example, lower temperaturesreduce the activity of cellular metabolism. Hence, importantquestions that (bio)analytical chemist should ask the clinical
cooperation partner are the time frame from blood drawing tocentrifugation and the temperature during this period.
Drastic minimization of the time until centrifugation is of-ten difficult to achieve in clinical setting and animal housesdue to logistic limitations. Access to a centrifuge is often notpossible at the site where the blood is drawn. A possible strat-egy to manage this problem is to stabilize the composition ofthe metabolome and lipidome in whole blood by reducing thetemperature in the blood collection tube after drawing andduring transportation [11, 12, 14–16]. Based on our experi-ence, an achievable time frame until centrifugation is 120 minat 4 °C, which can be fulfilled in most clinical settings and isalso acceptable with respect to sample quality (0.5% signifi-cant changes of metabolite features) [11] (see also Table 2).
Table 2 Suggestions of specific procedures tominimize pre-analytical issues inmetabolomics and lipidomics studies respecting compromises betweenrequirements for perfect sample quality and practical feasibilities at the medical sites
Blood Urine Cerebrospinal fluid (CSF)
Pre-tests Testing of the suitability of collection tubes, tips, cryovials, etc. (chemical noise, etc.)
Sample labels on tubes Definition of reasonable and comprehensible sample labeling
File names for data base storage Definition of reasonable, comprehensible, and uniform sample and file names
Study control group Exclude apparently healthy subjects
Sample material EDTA plasma*(should not be the first tube ina blood drawing sequence)
Cooled at once (4–8 °C) after collection
Midstream 2nd morning urine(standardize or, at least, recordthe diet on previous day)
Pairs of CSF and EDTA plasma**
Transportation At 4–8 °C (cold pack or iced water)
Centrifugation and aliquoting Within 2 h after collection
2500×g/4 °C/10 min/using brake 2000×g/4 °C/10 min/using brake CSF: 2000×g/4 °C/10 min/using brake
After centrifugation Transfer supernatant aliquots into cryotubes as soon as possible (keep samples always at 4 °C until freezing)
Storage −80 °C or below
Thawing At 4 °C (avoid refreezing)
Recording Documentation of any deviation from the protocol
*First, fill a 5-ml discard tube to avoid possible thromboplastin contaminations if no other blood drawing is intended
**Collected at the same point of time
Plasma
63 EDTA
33 Heparin
12 EDTA
8 Heparin
= Metabolomics
= Lipidomics
Number of studies
specifying
additives
Serum
CSF
Urine
Fig. 2 Number of biomedicalmetabolomics and lipidomicspublications studying major bodyfluids (blood, urine, cerebrospinalfluid (CSF)) based on a PubMedsearch (dated Feb. 2021). Searchterms: metabolomics and plasma;metabolomics and serum;lipidomics and plasma, etc.). Thenumber of specified additives inplasma samples is also given(search terms: metabolomics andplasma and EDTA, etc.)
5570 Lehmann R.

Immediate cooling after blood drawing (by cold packs, inrefrigerator, or in iced water) is highly advisable to avoid greatfluctuations in the results or even misleading findings [7, 14,17–19]. Unfortunately, this is only possible for plasma bloodcollection tubes, because the clotting process for generatingserum from whole blood requires a defined time at room tem-perature (for details, see the “Choosing plasma or serum?Metabolite and lipid profiles are different” section).Accordingly, it is much easier to standardize the generationof plasma and reduce any release of enzymes or ex vivo cel-lular metabolic activities after blood drawing. For EDTA plas-ma, we detected in a non-targeted metabolomics approach thatonly 0.5% of more than 1800 ion masses showed significantalterations within 120 min when whole blood is cooled downto 4 °C immediately after drawing [11]. In contrast, almost10% of all metabolite features changed significantly at roomtemperature [11]. At some sample collection sites in hospitals,it is not possible to fulfill even a time frame of 2 h untilcentrifugation. Therefore, we also checked a longer timeframe of 480 min exposure of whole blood to 4 °C. We foundless than 2% significant changes in the metabolome, com-pared to more than 16% altered ion masses at room tempera-ture during the same period [11]. After 48 h at room temper-ature, more than 30% of 1012 tested metabolites in EDTAwhole blood had changed. The most affected were nucleo-tides, energy-related metabolites, peptides, and carbohydrates[12]. In an elegant study, the group of M. Giera studied thepre-analytical stability of 133 oxylipins reporting no alter-ations beyond the analytical variance of 20% in EDTA wholeblood for up to 24 h at 4 °C (or at 20 °C for 4 h) [14]. Inaddition to refrigeration, the authors suggested after centrifu-gation of whole blood to add either methanol [20] or butylatedhydroxytoluene [14] into EDTA plasma for lipidomics inves-tigation, or at least for the profiling of oxylipins. Cooling ofwhole blood activates platelets. However, in the metaboliteprofile covered by our recent approach, we could not detecta relevant effect of platelets after cooling [15]. If we are givena choice in the planning phase of a biomedical study, wesuggest collecting plasma for mass spectrometry-driven meta-bolomics and lipidomics investigations (kept cooled immedi-ately after blood drawing until centrifugation) [15].
Overly demanding blood processing recommendations,i.e., centrifugation of samples as soon as possible or within atime that is hardly achievable, should be avoided because theymay cause variabilities in blood processing until centrifuga-tion. The frequency of such pre-analytical pitfalls, such asdifference in time until centrifugation between 15 and 90min, or evenmore, depends on the respective additional dutiesof study nurses or medical doctors. Therefore, it is mandatoryto standardize the treatment of whole blood in a feasible man-ner and to document every accidental or systematic error inorder to detect and eliminate possible outliers at an early stage.Table 2 summarizes suggestions of specific procedures to
minimize pre-analytical issues in metabolomics andlipidomics studies. The suggestions in this table are based oncompromises between requirements for perfect sample qualityand practical feasibilities at the medical sites. The best way tominimize the risk of inaccuracies and errors is to organizesample collection in the clinical surrounding at a study wardby a specialized and diligent team focused on specimen col-lection, cold chain, and blood processing [11].
Exact planning and valid information about the conditionsof whole blood handling is imperative for the success of meta-bolomics and lipidomics studies. This avoids the identificationof “biomarkers” reflecting the ex vivo metabolism of red andwhite blood cells or thrombocytes after blood drawing insteadof real biomarkers reflecting the pathophysiological situationof the patients of the study.
Effects of hemolysis on metabolite and lipid profiles
In the clinical routine laboratory, sample analysis may be in-terfered with or biased by extreme concentrations of variouscompounds. Most common factors, such as hemolysis, icter-us, and lipemia, are illustrated in Fig. 3A. However, amongthese factors, only hemolytic samples cause frequent problemsin metabolomics and lipidomics analysis [7, 17, 21].Dependent on the extent of hemolysis, it could lead to a mas-sive release of proteins (incl. enzymes), as well as metabolites,electrolytes, and lipids into serum or plasma. It may occurin vivo, caused by a disease, or ex vivo caused during blooddrawing or whole blood sample handling. In a daily clinicalpractice, but also in research studies, ex vivo hemolysis is oneof the most frequent pre-analytical errors [22]. A variety ofreasons may cause ex vivo hemolysis of various stages [23],like lack of experience in blood sampling from a young studynurses or medical students, cooling the sample below 4 °Cduring transportation, rigorous shaking instead of slightlyswaying the tube for mixing additives and whole blood, toolow inner diameter of the needle or too strong aspiration ofblood, as well as limited time or stress during blood drawing[24].
Notably, hemolytic plasma or serum is not necessarily de-tected visually, since slightly hemolytic samples look muchalike normal samples, but the metabolome has alreadychanged [7, 17, 21]. Hemolysis may affect up to 20% of allfeatures in non-targeted metabolomics approaches [7].
How to reliably identify hemolytic samples? A specificmetabolite biomarker or pattern to reveal hemolytic serum orplasma samples directly in metabolite or lipid profiles, i.e.,without additional analysis, would be desirable. However,there are no reports published to date, regarding the simplifi-cation to detect one of the most common pre-analytical errors.An existing possibility is a routine optical method performedat two wavelengths that allows reliable quantification of freehemoglobin in plasma or serum [23].
5571From bedside to bench—practical considerations to avoid pre-analytical pitfalls and assess sample quality...
Plasma and serum, a pre-analytical point of view
Choosing plasma or serum? Metabolite and lipid profiles aredifferent
Plasma and serum are almost equal in use for metabolomicsinvestigations of blood (Fig. 2). These data are in line with thestill ongoing debate of (bio)analytical chemists which samplematerial is more suited for profiling approaches. For historicalreasons, serum is the first-choice sample material in manyclinical studies and consequently stored in huge numbers inbiobanks, although the majority of high-throughput routinediagnostic assays meanwhile prioritize plasma. This meansthat the use of serum for metabolomics investigation is some-times based on the fact that serum is the only available samplematerial . But what should be considered when a
(bio)analytical chemist has the choice to select either plasmaor serum for high-resolution analysis?
The principal difference between serum and plasma is theinitiation of a clotting process (serum) or its prevention (plas-ma) inside the blood collection tube after drawing the blood.This difference involves consequences for the correspondingmetabolite profiles. During the clotting process to generateserum out of whole blood, which imperatively need the expo-sure to room temperature, platelets and enzyme cascades areactivated and platelets release proteases and other enzymes aswell as metabolites, including lipids [15, 25]. For the genera-tion of plasma, this clotting process is prevented byanticoagulation additives inside the tube. Based on the de-scribed essential difference in the generation of plasma andserum, it can be easily considered that the metabolome andlipidome between serum and plasma is different. In general,
a
b
c
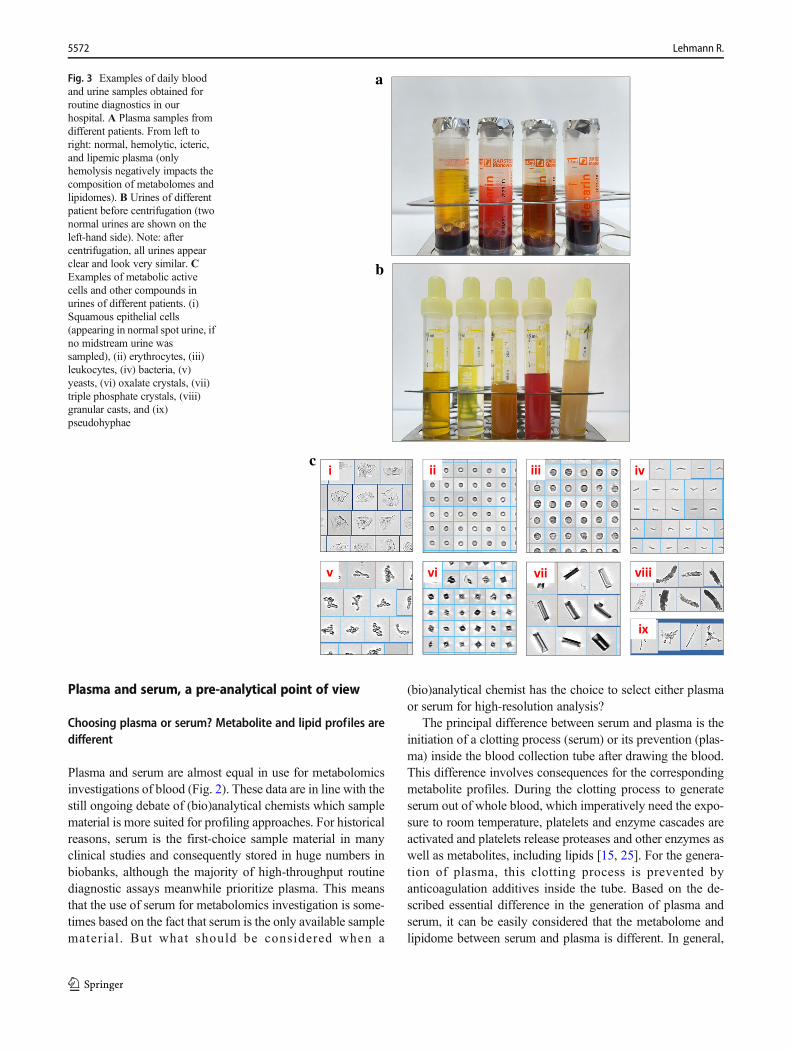
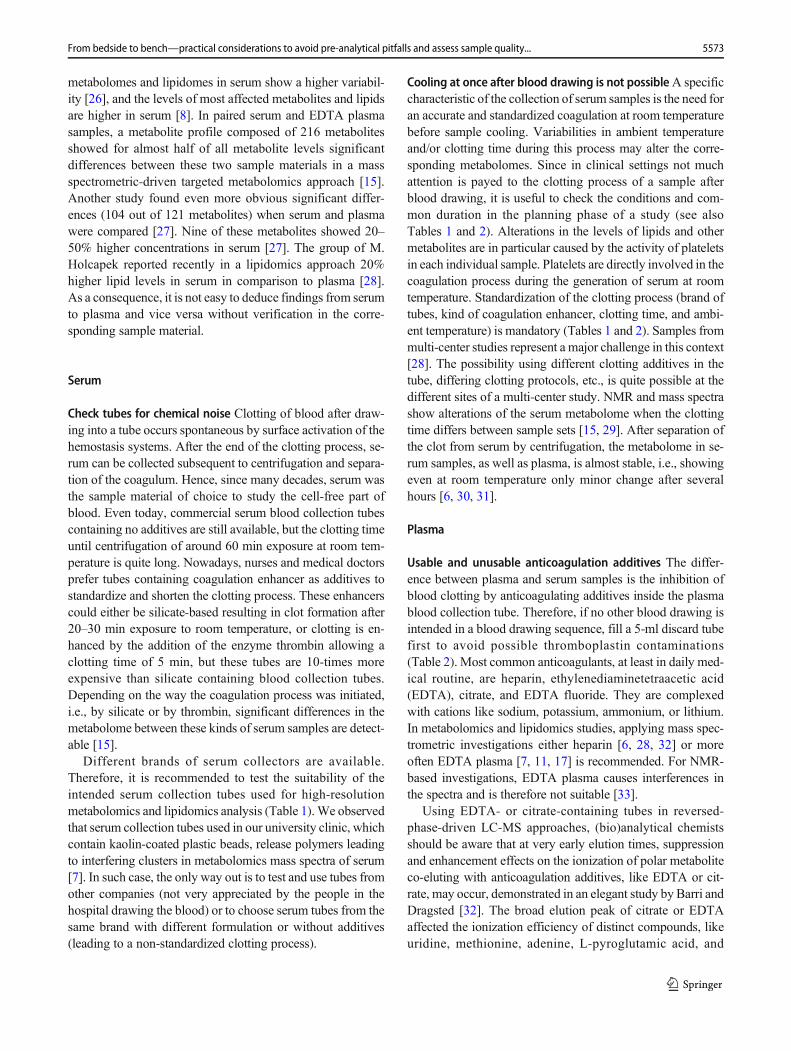
Fig. 3 Examples of daily bloodand urine samples obtained forroutine diagnostics in ourhospital. A Plasma samples fromdifferent patients. From left toright: normal, hemolytic, icteric,and lipemic plasma (onlyhemolysis negatively impacts thecomposition of metabolomes andlipidomes). B Urines of differentpatient before centrifugation (twonormal urines are shown on theleft-hand side). Note: aftercentrifugation, all urines appearclear and look very similar. CExamples of metabolic activecells and other compounds inurines of different patients. (i)Squamous epithelial cells(appearing in normal spot urine, ifno midstream urine wassampled), (ii) erythrocytes, (iii)leukocytes, (iv) bacteria, (v)yeasts, (vi) oxalate crystals, (vii)triple phosphate crystals, (viii)granular casts, and (ix)pseudohyphae
5572 Lehmann R.
metabolomes and lipidomes in serum show a higher variabil-ity [26], and the levels of most affected metabolites and lipidsare higher in serum [8]. In paired serum and EDTA plasmasamples, a metabolite profile composed of 216 metabolitesshowed for almost half of all metabolite levels significantdifferences between these two sample materials in a massspectrometric-driven targeted metabolomics approach [15].Another study found even more obvious significant differ-ences (104 out of 121 metabolites) when serum and plasmawere compared [27]. Nine of these metabolites showed 20–50% higher concentrations in serum [27]. The group of M.Holcapek reported recently in a lipidomics approach 20%higher lipid levels in serum in comparison to plasma [28].As a consequence, it is not easy to deduce findings from serumto plasma and vice versa without verification in the corre-sponding sample material.
Serum
Check tubes for chemical noise Clotting of blood after draw-ing into a tube occurs spontaneous by surface activation of thehemostasis systems. After the end of the clotting process, se-rum can be collected subsequent to centrifugation and separa-tion of the coagulum. Hence, since many decades, serum wasthe sample material of choice to study the cell-free part ofblood. Even today, commercial serum blood collection tubescontaining no additives are still available, but the clotting timeuntil centrifugation of around 60 min exposure at room tem-perature is quite long. Nowadays, nurses and medical doctorsprefer tubes containing coagulation enhancer as additives tostandardize and shorten the clotting process. These enhancerscould either be silicate-based resulting in clot formation after20–30 min exposure to room temperature, or clotting is en-hanced by the addition of the enzyme thrombin allowing aclotting time of 5 min, but these tubes are 10-times moreexpensive than silicate containing blood collection tubes.Depending on the way the coagulation process was initiated,i.e., by silicate or by thrombin, significant differences in themetabolome between these kinds of serum samples are detect-able [15].
Different brands of serum collectors are available.Therefore, it is recommended to test the suitability of theintended serum collection tubes used for high-resolutionmetabolomics and lipidomics analysis (Table 1).We observedthat serum collection tubes used in our university clinic, whichcontain kaolin-coated plastic beads, release polymers leadingto interfering clusters in metabolomics mass spectra of serum[7]. In such case, the only way out is to test and use tubes fromother companies (not very appreciated by the people in thehospital drawing the blood) or to choose serum tubes from thesame brand with different formulation or without additives(leading to a non-standardized clotting process).
Cooling at once after blood drawing is not possibleA specificcharacteristic of the collection of serum samples is the need foran accurate and standardized coagulation at room temperaturebefore sample cooling. Variabilities in ambient temperatureand/or clotting time during this process may alter the corre-sponding metabolomes. Since in clinical settings not muchattention is payed to the clotting process of a sample afterblood drawing, it is useful to check the conditions and com-mon duration in the planning phase of a study (see alsoTables 1 and 2). Alterations in the levels of lipids and othermetabolites are in particular caused by the activity of plateletsin each individual sample. Platelets are directly involved in thecoagulation process during the generation of serum at roomtemperature. Standardization of the clotting process (brand oftubes, kind of coagulation enhancer, clotting time, and ambi-ent temperature) is mandatory (Tables 1 and 2). Samples frommulti-center studies represent a major challenge in this context[28]. The possibility using different clotting additives in thetube, differing clotting protocols, etc., is quite possible at thedifferent sites of a multi-center study. NMR and mass spectrashow alterations of the serum metabolome when the clottingtime differs between sample sets [15, 29]. After separation ofthe clot from serum by centrifugation, the metabolome in se-rum samples, as well as plasma, is almost stable, i.e., showingeven at room temperature only minor change after severalhours [6, 30, 31].
Plasma
Usable and unusable anticoagulation additives The differ-ence between plasma and serum samples is the inhibition ofblood clotting by anticoagulating additives inside the plasmablood collection tube. Therefore, if no other blood drawing isintended in a blood drawing sequence, fill a 5-ml discard tubefirst to avoid possible thromboplastin contaminations(Table 2). Most common anticoagulants, at least in daily med-ical routine, are heparin, ethylenediaminetetraacetic acid(EDTA), citrate, and EDTA fluoride. They are complexedwith cations like sodium, potassium, ammonium, or lithium.In metabolomics and lipidomics studies, applying mass spec-trometric investigations either heparin [6, 28, 32] or moreoften EDTA plasma [7, 11, 17] is recommended. For NMR-based investigations, EDTA plasma causes interferences inthe spectra and is therefore not suitable [33].
Using EDTA- or citrate-containing tubes in reversed-phase-driven LC-MS approaches, (bio)analytical chemistsshould be aware that at very early elution times, suppressionand enhancement effects on the ionization of polar metaboliteco-eluting with anticoagulation additives, like EDTA or cit-rate, may occur, demonstrated in an elegant study by Barri andDragsted [32]. The broad elution peak of citrate or EDTAaffected the ionization efficiency of distinct compounds, likeuridine, methionine, adenine, L-pyroglutamic acid, and
5573From bedside to bench—practical considerations to avoid pre-analytical pitfalls and assess sample quality...

arginine [32]. On the other hand, the ionization of creatinine,proline, and valine showing retention in the same time win-dow was unaffected. Furthermore, based on the cations com-plexed with the additives, the increased occurrence of respec-tive adducts should be respected [32]. Recently, high similar-ity in lipid levels and profiles between EDTA and lithium-heparinate plasma was demonstrated [28]. In contrast,Hahnefeld et al. reported in a comparison of lipid profilescollected in either EDTA or sodium fluoride/citrate tubes amarkedly increased signal level of some endocannabinoidsand arachidonoyl ethanolamide in EDTA tubes [19]. Fortargeted approaches, Paglia and colleagues reported the detec-tion of spurious amount of sarcosine in a brand of EDTAvacutainer tubes and advise against the use of these tubes forthe exact quantification of sarcosine [8].
Lithium heparin is another common anticoagulation addi-tive in commercial blood collection tubes. Several groups pre-fer and recommend the use of Li+-heparin tubes [6, 28, 32].However, an example of own experience of brand-specificeffects of tubes was the detection of prominent polymer clus-ters in mass spectra from Li+-heparin tubes during a suitabilitytest of all blood collection tubes routinely used in our univer-sity hospital (all originate from the same manufacturer) [7].Subsequent testing of Li+-heparin tubes from another leadingcompany did not show any disturbance in the total ion chro-matogram (unpublished observation). The tested brands werethe two world leading manufacturers of blood collectiontubes. This underline, as noted in Table 1, the absolute needto test every specific type of sample collection tube before theuse in biomedical projects to exclude in targeted approachesany non-tolerable interference on compounds of interest or innon-targeted approach more general effects on the analyticalmetabolite profiles (Table 1).
It is quite important to fix all specific information abouttube type (including order number) in the pre-analytical SOPand communicate it clearly to the persons collecting the bloodsamples. After the plasma samples had arrived in the freezer, itis too late. Special care is required in multi-center studiesbecause, even though it is possible to arrange collection ofthe same type of plasma, e.g., K+-EDTA plasma, at eachparticipating hospital, it is highly unlikely that all sites willuse the same brand of sample collector.
In this context, two aspects have to be considered: (a) addi-tives are inevitable, and (b) analytical pre-tests focusing on thecompounds of interest are needed before start of a biomedicalmetabolomics/lipidomics project to figure out the most suitableblood samplers. An intense literature search could also be anoption, but most publications lack a clear specification of theused blood sample collector and brand (Fig. 2), even the namingof the included additive in the investigated plasma samples is notcommon practice. In a PubMed search (dated Feb. 2021), thehuge majority of the more than 5600 biomedical metabolomicspublications that analyzed plasma did not further specify the
sample material (only 63 specified the use of EDTA and 33Li+-heparin plasma). The same was found in lipidomics studies:of more than 1300 reports, only 12 specified the use of EDTAand 8 Li+-heparin plasma (Fig. 2).
The centrifugation force of whole blood can alter the metab-olite profile in plasmaA less required information in the plan-ning phase or during the selection of plasma samples from abiobank is the applied centrifugation force on whole blood forthe separation of erythrocytes, leukocytes, and platelets.Excessive forces (> 4500g) carry the risk to cause hemolysisand they are usually avoided. However, if too low a centrifu-gation force or too short centrifugation time is applied, im-proper separation of cells from plasma may occur.
Common centrifugation forces for whole blood used inclinical routine laboratories and biobanks worldwide are be-tween 1500 and 4000g for 5–10 min. Erythrocytes and leuko-cytes can be removed under these conditions, but a significantnumber of platelets still remain in the EDTA plasma fraction.For instance, at conditions of 1,500g for 10 min, 137,500platelets per microliter remain in EDTA plasma [34]; at3,000g for 5 min, 59,500 platelets per microliter [34]; and at4000g for 10 min, 27,000 remaining platelets per microliterwere detected [15]. Hence, even state-of-the-art separatedplasma is not cell-free. The correct term for this standard plas-ma is “platelet-poor” plasma (PPP). Generation of platelet-free plasma (PFP), which contains per definition < 10,000platelets per microliter, needs more complex centrifugationsteps that are usually not applied in clinical routine laborato-ries or biobanks.
Regardless of whether a platelet-poor standard plasmasample is frozen directly for storage or processed for immedi-ate metabolomics analysis, the platelets contained in the sam-ple are lysed, thereby releasing membrane lipids and cellularcontent into plasma. Fortunately, in a comparison of differentEDTA plasma samples obtained by a centrifugation of 1,500gfor 10 min (137,500 platelets/μl) vs 3,000g for 5 min (59,500platelets/μl), the alterations of the metabolome showed onlyslight differences in a PLS-DA analysis of NMR and LC-MSspectra [34]. A comparison of platelet-free and platelet-poorEDTA plasma (i.e., plasma containing 3,000 vs 27,000 plate-lets/μl) revealed no significant differences in a metabolite pro-file of 216 metabolites [15]. Current data suggest that plasmagenerated with low centrifugation force (e.g., at 2000g or be-low) may bear a risk for possible alterations in the metabo-lome or lipidome by platelet contaminations, which can beincreased by additional short centrifugation time. Another as-pect in this context is that in extreme cases in critically illpatients, the individual platelet count varies and range fromless than 10,000 to more than 1,000,000 platelets/μl [25].
In summary, parts of the metabolite or lipid profiles inplasma may be slightly affected by compounds originatingfrom platelets remaining in the sample. The number of
5574 Lehmann R.

remaining platelets in plasma is dependent on the appliedcentrifugation conditions of whole blood (force and time)and, therefore, it is advisable to standardize and control cen-trifugation (for suggestions see Table 2). Mixing of plasmaderived from different or unknown centrifugation conditionsshould be avoided. Whenever possible, multi-center studiesshould apply the same or at least similar centrifugation condi-tions for whole blood to avoid differences in the metabolomethat reflect sample handling at respective sites. For metabolo-mics and lipidomics, investigations preferred higher centrifu-gation (between 2300 and 4000g for 5–10 min). However, athigher centrifugation forces, the risk of damaging cellularcompounds increases, which is especially true for samplesfrom patients with hematological disorders. These diseasesmay affect the integrity of cellular membranes. In such cases,a compromise is needed for the generation of plasma samplesfor metabolomics and lipidomics analysis by applying lowercentrifugation forces. Table 2 summarize suggestions of spe-cific procedures to minimize pre-analytical issues in metabo-lomics and lipidomics studies, thereby taking compromisesinto account between requirements for perfect sample qualityand practical feasibilities at the medical sites.
Dried blood and dried urine spot samples need specialconsiderations
For decades, newborn screening has been performed usingdried blood spot (DBS) samples. Among the screened geneticdisorders are also metabolic diseases; therefore, DBS-basedmetabolite profiling of newborn samples is very common forroutine diagnostic purposes [35]. Hence, the transition of DBSsamples from well-established routine metabolite profiling tothe rather new scientific field of metabolomics was small [36].In addition to DBS, metabolomics analyses of dried urine spot(DUS) samples are also performed [36].
Usually, approximately 20–50 μl of blood is spotted onto afilter paper and dried. For metabolomics investigations, themajor difference from plasma or serum analysis is that themetabolite profile of a DBS sample represents not only me-tabolites from plasma or serum but also from all cellular com-pounds like erythrocytes, platelets, and leukocytes, i.e., it re-flects the metabolome of a lysate of whole blood [37]. Limitsof pre-analytical stability of metabolites on the dried filterpaper detected by routine newborn screening after long-termstorage, such as profiles of acylcarnitines and amino acids,have been well investigated and led to the recommendationto correct quantitative DBS data appropriate for sample decayduring long-term storage [38, 39]. Using complementaryHILIC and reversed-phase LC-MS to collect thousands offeatures, Palmer and colleagues studied the stability of themetabolomes in DBS and DUS samples in a non-targetedmetabolomics approach [37]. At room temperature (21 °C),metabolite profiles on DBS and DUS are stable for up to 4
weeks and at −20 °C for 1 year. The authors recommended thetransportation of DBS and DUS samples within 28 days atroom temperature (21 °C) for final storage at −20 °C or −80°C [37]. In general, preliminary DBS and DUS stability testsof metabolite profiles of interest or distinct metabolites areadvised [36, 40], as well as filter paper tests to exclude anyinterfering compounds released from the filter during samplepretreatment.
Biomarkers to assess the quality of plasma and serumsamples
Every blood sample intended for research use ends up in eitherplasma or serum aliquots. Therefore, it is not surprising thatnumerous publications exist investigating the alterations ofmetabolite or lipid profiles and corresponding quality markersin plasma or serum, i.e., already after the separation fromcellular components [30, 41–46]. However, the describedchanges in serum and plasma are of minor pre-analytical im-portance for the following reasons: (a) in comparison tochanges that occur in whole blood during handling in thehospital, i.e., before the separation of plasma or serum, thesealterations are small (far below inter-individual variations),and (b) shortcomings in handling of plasma or serum are notvery frequent because the processing of these aliquots usuallyoccurs in clinical laboratories or biobanks under highly stan-dardized conditions, performed by experts focused on sampleprocessing. Therefore, in one of the most critical phases forthe quality of plasma and serum samples, i.e., the time periodfrom blood drawing until centrifugation, sophisticated SOPand joint interdisciplinary discussions and agreements withthe cooperation partners collecting the blood samples areneeded, but they do not guarantee the prevention of eitherrandom or systematic deviations in the handling of wholeblood.
Quantitative measures of one or more pre-analytical bio-marker(s) to assess handling and processing of whole bloodsamples is more preferable, than checking notes in handlingprotocols. However, to date, only a few studies aimed to iden-tify biomarkers reflecting delayed processing of whole blood[11, 13, 17, 47]. The applicability, on the other hand, is limitedto some extent, because either a complex and difficult to an-alyze pattern is suggested [17], or the described tool containsbiomarkers like lactate [13, 47], which could be greatly affect-ed in their blood concentration by physiological as well asdisease states. Liu X. and colleagues identified and rigorouslyvalidated in more than 2000 serum and plasma samples (4E,14Z)-sphingadienine-C18-1-phosphate (common name:sphingosine-1-phosphate d18:2; S1P-d18:2) as a biomarkerto verify compliance with SOP-prescribed time for processinginto plasma or serum and/or time-to-storage of whole blood at4 °C, i.e., to identify occasional delays, accidental errors, orsystematic deviations in the handling of whole blood [11].
5575From bedside to bench—practical considerations to avoid pre-analytical pitfalls and assess sample quality...

Cutoff levels for S1P-d18:2 (plasma: ≤ 0.085 μg/ml; serum: ≤0.154μg/ml) are also given, allowing (bio)analytical scientiststo decide whether or not sample quality is acceptable for theintended use, even without any knowledge of the whole bloodhandling performed from collection to centrifugation.Noteworthy, S1P is a class of lipids well known to showalterations in their blood levels due to physiological condi-tions or diseases states [48–50], but Liu et al. showed thatalterations caused by these conditions are minor in compari-son to changes based on pre-analytical errors [11], i.e., farbelow the S1P-d18:2 cutoff levels for the separation of plasmaand serum samples of good and less suited quality for meta-bolomics and lipidomics studies.
Freezing and long-term storage of plasma and serum
Usually, metabolomics and lipidomics analyses are notperformed at the same day as body fluids’ collection.Hence, the samples need to be stored frozen until furtheranalyses. The ideal way to freeze samples, like stepwisefreezing, snap freezing, etc., and whether different freez-ing strategies show any effect on the metabolome is stillunclear. Usually, samples are stored in aliquot days,weeks, or years in laboratory freezers or biobanks understandardized conditions at −80 °C or below. However, atthe sites of body fluid collection, i.e., in a hospital orstudy ward, −80 °C freezers do usually not exist nearby.Therefore, it is not uncommon to use −20 °C freezers asintermediate storage for body fluids either for some hours,but also for days until the next set of samples istransported to the site of long-term storage at −80 °C orbelow. This raises the question about the stability of me-tabolite and lipid pattern in body fluids under differentstorage conditions.
In the context of sample storage, effects of freeze-and-thawcycles are also of interest, because in every biomedical study,the number of stored aliquots is limited. Thawing, and as timegoes on, refreezing of limited valuable sample material is un-avoidable. Moreover, it should be considered that the samplestability is also highly dependent on the frequency and dura-tion of opening the door of the freezer (e.g., in a hospitalward), which is not only true for storage at −20 °C but alsoat −80 °C. However, thawing of samples standing close to theopen door of freezer occurs much faster at −20 °C than at −80°C. Special attention should be whether self-defrosting −20 °Cfreezers are in use.
Storage at −20 °C
There are very few reports on the stability of samples at−20 °C intended for metabolomics and lipidomics inves-tigations exist, because this is not the common storagetemperature. At −20 °C, residual enzymatic activity
cannot be excluded [20]. Additionally, polyunsaturatedfatty acids (PUFA) are sensitive to degradation whenstored at −20 °C [20, 51, 52]. A panel of 133 oxylipinswas stable for up to 5 days at −20 °C in EDTA plasma[14]. After 4 weeks of storage, PUFAs were highly de-graded and this effect was volume dependent, i.e., lowerin 250 μl than in 80 μl [51]. On the other hand, a non-targeted metabolomics approach that included 2600 traitsrevealed only minor changes of the plasma metabolomeafter storage at −20 °C for 4 weeks, but this study wasperformed with only 4 different samples [53]. Even inorganic solution, i.e., independent of possible effects ofcompounds included in body fluids, a standard mixture of28 hydrophilic endogenous compounds showed stabilityfor only 2 weeks at −20 °C [54]. To conclude, storageof lipids at −20 °C can be critical even for a short periodof time. Short-term storage of body fluids at −20 °C for afew days before long-term storage at −80 °C or lowertemperatures for metabolomics analysis could be feasible,but preliminary stability tests are recommended.
Storage at −80 °C and below
Storage at a temperature of −80 °C for months and years ismost common for body fluids. At a minimum of 15 months,total plasma oxylipins are robust in EDTA plasma stored at−80 °C [14, 20]. The authors recommended adding the freeradical scavenger butylated hydroxytoluene (BHT) to thesamples directly after plasma separation [14]. After 2.5 yearsof storage at −80 °C, negligible changes were observed foramino acids, LPCs, and PCs in lithium-heparin plasma from21 non-fasted individuals in an NMR-driven metabolomicsstudy [44]. In a sophisticated targeted mass spectrometricstudy, Haid et al. investigated the storage stability of a profileof 111 metabolites in EDTA plasma over 5 years at −80 °C[55]. In contrast to the less sensitive NMR study, Haid et al.also covered low abundant plasma metabolites. After 5 yearsof storage at −80 °C, no significant changes were detected forhalf of all metabolites, and the rest showed minor alterationsof ≤ 15% [55], i.e., far below inter-individual differences inbiomedical metabolite profiling. The approach included me-tabolite classes of amino acids, glycerophospholipids,sphingolipids, hexoses, and acylcarnitines. In EDTA plasmastored for up to 16 years, Wagner-Golbs et al. revealed, usingNMR profiling of 231 metabolites, only 2% changes in thefirst 7 years of storage at −80 °C [56]. After 16 years, thelevels of 26% of all metabolites were significantly altered incomparison to latest samples of the same individuals; mainlyaffected were complex lipids, fatty acids, metabolites fromenergy metabolism, and amino acids [56]. However, the au-thors mentioned as a limitation of their study that due to thestudy design, they cannot exclude that changes in lifestyle,diseases, etc., of their participants during these 16 years,
5576 Lehmann R.

which may have affected and biased their findings and con-clusions [56]. In addition to the ideal storage of deep-frozensamples at −196 °C (liquid nitrogen), Haid and colleaguesdemonstrated and recommended a strategy to compensatefor storage effects at −80 °C on metabolite levels by a regres-sion model [55]. A prerequisite for the application of thismodel is the storage of sufficient number of aliquots of eitherpooled study samples or comparable samples together withthe study samples to allow repetitive measurements of thesepooled QC sample aliquots over the whole storage time periodto generate the regression model [55].
To conclude, slight changes during long-term storage at−80 °C cannot be prevented, but the changes are not pro-nounced and can be corrected by sophisticated strategies suchas the regression model mentioned above. The data also illus-trate that analysis of samples with different storage ages maysignificantly affect the final profiling results, at least for somemetabolites. On the other hand, sample collection in complexhuman biomedical projects and multi-center studies usuallytakes months or even years. Hence, it is often unavoidable tomix samples of different storage age when metabolite or lipidprofiling of a large cohort is performed. For the interpretationof those data, in addition to the variability due to differentstorage times (e.g., ±15% [55]), it is important to consider thatthe biological and inter-individual variability is usually muchhigher. This assumption is supported by numerous publica-tions reporting valid data achieved in sets of body fluids storedfor various periods at −80°C.
Effects of unavoidable repetitive freezing and thawingof serum or plasma aliquots
In most biomedical studies, long-term storage of many ali-quots of body fluids is common practice allowing to performvarious analysis. However, the number of these aliquots iscontinuously decreasing over time, particularly for the mostinteresting samples. This inevitable leads to repetitive thawingand refreezing to keep all residues of the limited sample ma-terial. As a consequence, the composition of the metabolomeor lipidome of these refrozen aliquots could be affected.
How often serum or plasma samples need to be repeatedlythawed is highly dependent on the number of aliquots stored.Before the study begins, this issue, as well as the volume ofeach aliquot, should be carefully considered, thereby respect-ing the storage space and practical feasibility of aliquot gen-eration (Tables 1 and 2). Choosing a smaller number of ali-quots usually results in higher volumes and consequentlymore leftovers to be refrozen.
Variations in room temperature, exposure time to room orother temperatures, activation of enzymes inside the sample,etc., may occur from day to day during thawing. Since thawingat room or even higher temperature (hand warmth) is very fast, itis regularly applied. Four thawing cycles for 30 min at room
temperature followed by refreezing at −80°C showed significantchanges of serum and plasma levels of phospholipids, glycerol,and other lipids, as well as carnitine, choline, proline, acetone,glucose, alanine, and pyruvate in two independent NMR-drivenstudies [44, 57]. In contrast, four-times thawing EDTA plasma at4 °C (iced water) and refreezing at −80 °C led only to marginalalterations in the EDTA plasma metabolome, which was studiedusing a non-targeted LC-MS approach [7]. Several years later,these investigations were repeated and the findings were con-firmed by Goodman et al. [58]. Metabolites from lipid metabo-lism and central carbon metabolism, as well as antioxidants andnucleotides, were among the few compounds that were sensitiveto repeated three times refreezing [58]. Helmschrodt et al. inves-tigated the sensitivity of some reactive oxygen species-derivedoxysterols to repetitive thaw cycles and found that up to ninecycles had no effect [59]. A mixture of 11 polar standard com-pounds resisted to 10 freeze-thaw cycles [54]. Noteworthy, vol-atile metabolites should be absolutely excluded from repetitivefreeze-thaw cycles due to evaporation [44, 57].
Interestingly, in a PCA score-plot, individual differences inthe sensitivity to freeze-thaw cycles of the EDTA plasma me-tabolome were obvious for two out of ten study participants[7]. Similar individual effects had been reported in an NMR-driven study [44]. The authors of this study speculated that ahigh content of lipids could be the reason for these differencesin individual plasma samples.
In general, it is recommended to thaw body fluids < 10 °Cfor metabolomics and lipidomics analyses to prevent signifi-cant changes of the metabolite or lipid profiles [7, 58, 60]. Theunavoidable freeze-and-thaw cycles should be carefully doc-umented and a mixing of aliquots should be avoided, at leastfor metabolomics and lipidomics analysis.
Urine
Urine, in contrast to blood, is an easy and non-invasive tocollect body fluid, which is also well suited for metabolomicsanalysis, as documented by a considerable number of publi-cations (Fig. 2). Normal urine is a transparent, yellowish, al-most cell-free body fluid with very low protein content. Therisk of alterations of the metabolome after collection, i.e., dur-ing transportation, handling, and processing is very low risk.A totally different situation exists in disease states. The com-position of urine can change significantly (Fig. 3B), andcarries a high risk for pre-analytical changes of the metabo-lome [16]. Hence, from the pre-analytical point of view, urinesamples in biomedical studies may also contain enzymes, cel-lular, as well as other compounds (Fig. 3C), which is in clearcontrast to urine from healthy donors. This means, urine sam-ples can be highly contaminated with metabolic active com-pounds of microbiological and human origin or be almost freeof any contaminations. Consequently, data from high-
5577From bedside to bench—practical considerations to avoid pre-analytical pitfalls and assess sample quality...

resolution metabolomics investigations could be affected tovarious extents based on pre-analytical issues during samplecollection or transportation.
Urine test strips are an easy and very fast to perform optionto assess this risk. Further on, they are well suited to achievevery useful qualitative information about the composition ofurine (including possible compounds affecting the metabo-lome) and the health state of an individual. Urine test stripscan be applied directly after collection and before any furthersample processing qualitative information of the number ofleukocytes, erythrocytes, increased protein content, fastedstate (ketone bodies), as well as pH value, and many othersare included in the tests on this strip. Noteworthy, the pHvalues of urines, in contrast to blood, can vary quite a lotbetween individuals. But to date, no data about possible pH-dependent effects on the metabolome and prevention strate-gies by buffering are available. Monitoring urine pH duringcollection is, to the best of our knowledge, only used in routineHCl-acidified urine analysis of catecholamines and some oth-er compounds, but not in biomedical metabolomics projects.
Other than previously mentioned limitations, various types ofurine samples need special considerations with respect to pre-analytical issues, which will be discussed in the followingchapters.
Urine sampling need pre-tests to circumventanalytical limitations
Urine samples, whether they are spot urine or 24-h collectionurine, are collected in containers of different size made fromplastic, and the same is true for urine collected in drainagebags from in-patients. Pediatric and newborn samples are col-lected in special soft plastic bags with hypoallergenic skinadhesive. As mentioned above (Collection tubes may intro-duce chemical noise), the type and quality of plastic used byvarious brands can differ. Therefore, two major pre-analyticalpitfalls should be checked before the start of a study. The firstis the adsorption of urinary metabolites to the plastic surface,in particular during 24-h urine or drainage bag collection (bothassociated with a rather long exposure time to the plastic sur-face), and the second, the release of interfering compoundslike plasticizer into the sample. Furthermore, it is not uncom-mon to clean and reuse 24-h urine collection containers, so therisk of remaining detergents and subsequent contamination ofthe next urine sample should be considered.
Urine specimen types and their strengths andlimitations
Urine is collected in the bladder before excretion. As a conse-quence, the type of the analyzed urine specimen leads to dif-ferences in the composition of the urinary metabolite profile ofan individual. The types other than spot urine, which is
collected randomly, are first morning urine (MU), secondMU, 24-h collection urine, and drainage bag urine as a specialkind of collection urine. Each type has its specific character-istics comprising pros and cons for metabolomics analyses, aswell as the need for specific pre-analytical considerations. Forspot urine, which is collected randomly, as well as for first andsecond morning urine, it is imperative to collect midstreamurine. Otherwise, a mass of metabolic active epithelial cellsfrom the genital surface will reach the urine sample tube, evenwhen collected from healthy donors, the urine will be contam-inated (Fig. 3C).
Midstream first MU is the urine excreted directly after get-ting up. It contains all metabolites collected in the bladderovernight. Therefore, the metabolite pattern in first MU mayalso reflect nutrition on the previous day, particularly of theevening [61]. It can be seen as a kind of collection urine.
Second MU, usually collected still in the fasted state be-tween 7 and 10 am, stands for the next excretion after firstMU. In the metabolome of this type of specimen, the nutritioneffects of previous day are greatly reduced [61]. Given that thestudy subjects are well-instructed midstream, second MU is amore standardized sample material than the first MU.Normalized to urinary creatinine concentration, it is also themost common sample material used for quantitative analysisin Clinical Chemistry. But second MU is not the sample ma-terial of choice for quantitative clinical routine analysis, whichis 24-h collection urine.
The collection container for 24-h urine should be ofadequate size, usually 3 l or more, as well as allowingUV-light protection of the sample. The concentrationmeasured in 24-h collection period and in drainage bagurines can be directly related to the volume of urine col-lected. Consequently, the quantification is more reliablethan the creatinine-normalized quantification in secondMU, assuming that there is no collection error by thepatient. Hence, collection urine would also be most suit-able for metabolomics analysis. However, apart from sev-eral advantages, there are also disadvantages that argueagainst the use of collection urine for metabolomics (seealso Cooling during collection and transportation pre-serves the metabolome). Effects and variabilities on themetabolite pattern caused by food intake are unavoidableand urinary markers for milk, cheese, meat, fish, and othernutrition have been described in metabolomics studies[62–64]. For 24-h collection urine, the study participantor patient is responsible for not missing any urine volumeand for keeping the urine collector cool during this longperiod. Overall, the 24-h collection period is cumbersomeand error-prone. Four most common errors are (a) notemptying the bladder before starting the collection period,(b) not emptying the bladder before the end of the 24-hcollection period, (c) forgetting to collect one or moreurine voids, and (d) forgetting to cool the container during
5578 Lehmann R.

the collection period. Other potential problems can becaused by detergents remaining in the collection containerafter cleaning, and by the patient, e.g., estimating the vol-ume of a forgotten urine fraction and adding the respec-tive volume of water into the 24-h collection container.For urines collected in drainage bags, cooling during theperiod of sampling is almost impossible, which entail forthis sample material the limitation to use only cell-freesamples for metabolomics investigations.
In general, all types of urine samples have their strengthsand weaknesses. For metabolomics studies, I would recom-mend midstream second MU collected after an overnight fast(until sample collection, only drinking of water is allowed)(Table 2). Based on the direct and possibly strong effects ofthe diet on the previous day in an ideal study 20 h beforesample collection, a standardized vegetarian diet should bestarted to harmonize the diet effect in the study group [61],which, however, is hardly feasible in daily practice.
Cooling during collection and transportationpreserves the metabolome
The collection of urine is not only performed in the clinic butalso at home. In both situations, as well as during longer sam-ple transportation, temperature is a relevant pre-analytical fac-tor. Rotter et al. investigated, using a targeted approach cov-ering 63 metabolites, the stability of this metabolite profile inpooled morning urine of 6 healthy female individuals undervarious storage conditions between 2 and 24 h [65]. At roomtemperature (20 °C), no change in the concentration of 49metabolites within 24 h was observed. However, a decreaseof 30 to 60% was detected for some metabolites, namely ar-ginine, methionine, serine valine, leucine/isoleucine, and hex-ose. Cooling with a cold pack for one day (9 °C) still showed40% decrease of branched-chain amino acids as well as argi-nine, and an increase of C6:1-carnitine by 16% [65]. In anNMR-driven study investigating non-pooled spot urine sam-ples from eleven healthy individuals, Budde et al. reportedonly minor, non-relevant changes in terms of inter-individualdifferences after a 24-h exposure at 10 °C, and no changeswithin 10-h exposure [66]. Other metabolomics studies con-firmed only negligible alterations in urine samples after 24 h at4 °C compared to the observed inter-individual variabilities[30, 67, 68]. In pooled urines, even after 72 h at 4 °C, alter-ations in the metabolome were very small [69].When tested atroom temperature, Roux et al. demonstrated after 12 h signif-icant changes in 7% of the 280 metabolites in pooled urines ina non-targeted approach [69]. Before drawing general conclu-sions from the described findings, it is important to note thatonly urines from healthy individuals were studied but noturines containing enzymes, cellular, as well as other com-pounds (see Fig. 3C). Furthermore, the enclosed metaboliteprofiles were quite different.
An alternative strategy to cooling is the addition of stabi-lizers such as borate or thymol into the sample container toreduce or inhibit the growth of bacteria and fungi, as well asmetabolic activity of other cells [70]. To the best of our knowl-edge, however, this strategy is not widely used (at least inhospitals for diagnostic routine purposes). Wang et al. report-ed effective stabilization of a metabolite profile of 158 urinarymetabolites by thymol, while the addition of boric acid causedalterations of the metabolome (n = 20 participants) detected byLC-MS [71]. Additionally, Lauridsen et al. tested other inhib-itors and demonstrated that the use of 0.1% sodium azide isnot critical for NMR spectra; however, 1% sodium fluorideled to shifts [67].
In summary, during the 24-h urine collection period, aswell as during transportation of any type of urine, it is prefer-able to keep samples at 4 °C to largely reduce enzyme activ-ities, cellular metabolism in general, and microbiologicalgrowth. The addition of bacteriostatic agents to urine collec-tors as well as pH adjustment before collection is not commonand should be verified before application.
Freezing and storage of urine
Space for long-term sample storage is always limited.Consequently, at least in clinical area, there is still debate onwhether urine can be stored at −20 °C in a less costly manner.In a comparison of metabolite profiles in urine samples frozenimmediately after collection, no difference in NMR spectrawas observed between storage at −25 and −80 °C after 26weeks [67]. In a sophisticated LC-MS approach applying re-versed-phase and hydrophilic interaction chromatography,only minor differences in a pattern of more than 5000 featureswere detected in bovine urine stored at −20 °C or −80 °C for144 days [72]. Ultrafiltration with a cutoff filter of 10 kDa wasperformed before storage; hence, the pooled bovine urinesamples were absolutely free from cells and almost free fromproteins [72]. Ultrafiltration of urine could be an efficient buttime-consuming and expensive way to stabilize urinarymetabolomes.
Freeze-drying of urine and subsequent storage at −20 °C or−80 °C is another option to preserve sample quality [72]. At−20 °C, the metabolite profile of > 5000 features in freeze-dried samples was nearly stable over the 144 days studied[72]. At −80 °C, no difference was observed between freeze-dried and non-freeze-dried samples [72]. When using freeze-dried samples, care should be taken during resuspension ofmetabolites before high-resolution analysis.
To sum up, a weakness of pre-analytical reports is that allstability studies were performed exclusively on urines fromhealthy individuals. This limits the general applicability of thedata obtained to all types of biomedical studies. It should beconsidered that depending on disease states or even impropersampling of midstream morning urine from healthy subjects,
5579From bedside to bench—practical considerations to avoid pre-analytical pitfalls and assess sample quality...

various cellular and enzymatic active compounds may bepresent in the urine (see Fig. 3C). This might alter the metab-olome during collection period, transportation, or even afterstorage. In addition, some of the perfect conditions describedfor preserving the urine metabolome, like immediate urinefreezing [67] or ultrafiltration [72], are difficult to apply incommon biomedical studies conducted outside a research in-stitute in a clinical surrounding. To be on the safe side, pre-tests adapted to the individual situation of each biomedicalstudy are advisable before long-term storage of urine.
Cerebrospinal fluid (CSF)
Although the sample material is not easy to collect, CSF is ofgreat interest for (bio)analytical chemists to study (patho)-physiology of the central nervous system and to identify di-agnostic biomarkers through metabolomics and lipidomicsanalysis, which is reflected in numerous reports (Fig. 2). Theaccessibility for sampling CSF via the spinal canal is muchmore challenging for physicians than blood sampling. An ac-cidental admixture of blood due to injury of a capillary duringpuncture occurs regularly. Normal CSF is colorless, water-clear, with almost no cells (< 5 cells per μl), and the proteinconcentration is very low (below 500 mg/l) [25]. In simpleterms, CSF is an ultrafiltrate of blood and the filter is theblood-brain barrier (BBB). However, the BBB is much morethan a filter; it is a selective barrier. It allows only diffusion ofwater and various hydrophobic compounds and performs se-lective transportation of other molecules needed for the func-tion of the brain. Various disease states lead to alterations inthe function and permeability of the BBB. The most commonare infectious/inflammatory diseases. In these situations, thecell count in CSF can change dramatically, increasing up toseveral thousand leukocytes/μl. Metabolically active bacteria,yeasts, tumor cells, erythrocytes, leukocytes, and some othercells can be also found in CSF samples under pathologicalconditions. These cells may alter the CSF metabolome aftersample collection, depending on the type of cells, their num-ber, and their metabolic activity.
For routine diagnostics as well as for metabolomics/lipidomics investigations of CSF, it is mandatory to collectCSF and blood in pairs at the same time. International guide-lines recommend centrifugation of CSF (2000×g at 4 °C) andblood within 2 h after collection [73]. Collection of pairs is anessential requirement, because alterations in the concentrationof metabolites in CSF may occur due to changes in blood inthe systemic circulation without pathophysiological changesin the central nervous system. By calculating CSF/serum orCSF/plasma quotients, misinterpretation of metabolomics andlipidomics data caused by such situations can be avoided.
Although normal CSF is like an ultrafiltrate from blood,pre-analytical considerations, particularly when studying
pathological liquor samples, are important. Haijes et al. inves-tigated recently various aspects that may alter the CSF metab-olome after collection [74]. Centrifuged individual CSFbiobank samples from a dementia cohort were pooled andanalyzed for > 1800 features by direct-infusion MS. Theyfound that storage of centrifuged (i.e., cell-free) CSF at roomtemperature (18–22 °C) for up to 8 h is acceptable [74]. Anincreased number of leukocytes in pathological CSF lead toalterations of metabolite and protein levels in uncentrifugedsamples already after 30 min at room temperature [75].Cooling of centrifuged CSF below 8 °C for up to 72 h showedonly minor effects on metabolite levels, as did storage at −20°C for 2 months [74]. In a profile of 36 amines, the levels of 31were stable for up to 2 h when refrigerated immediately afterCSF collection [76]. Furthermore, up to three freeze-and-thawcycles of centrifuged CSF resulted in a relatively unaffectedmetabolome [74]. Regarding patient preparation, Saito et al.reported recently that postprandial state had lower impact on130 hydrophilic metabolites and 340 lipids in CSF of ninehealthy subjects than inter-individual variations [77]. Lessthan 10% of CSF metabolites show significant changes. Thisled the authors to conclude that metabolites and lipids in CSFare not directly associated with food intake [77].
In summary, cooling and timely centrifugation is the easi-est, but most effective way to stabilize the metabolome andlipidome of CSF (Table 2). Once the cellular compounds areremoved, CSF is quite stable, even for a longer period of time,even at room temperature. However, based on the pathologi-cal state of a patient, such as cerebral hemorrhage or dysfunc-tion of the BBB, a high variability in the sample compositionassociated with potential negative pre-analytical effects onmetabolomes is possible and should be respected.
Study participants
Preparation of sophisticated questionnaires andinstructions to avoid pre-analytical shortcomings
Outliers or high variations of metabolomics and lipidomicsresults in biomedical profiling projects are a challenge for dataevaluation and interpretation. Many of them could easily beprevented as they occur before the collection of samples.Common causes are either vague or incomplete instructionsof study participants about correct preparation in the periodbefore sample collection or misunderstandings between in-structor and study participant.
Clear and comprehensive guidelines and checklists for theinstruction of study participants, which are jointly prepared byall involved scientists, can help to avoid or minimize outliersand subsequent large data variabilities (Table 1). Additionally,comprehensive but not excessive questionnaires may also beuseful in this context. For instance, a look in the
5580 Lehmann R.

corresponding questionnaire may explain detected outliersand can also provide reasonable justification to exclude outlierdata from further evaluation.
Central question for creating a guide for metabolome andlipidomics study participants or questionnaire is simply whatfactors or activities can influence the metabolome andlipidome in body fluids or tissues. Such factors that affectmetabolome can be divided in two sections, uninfluenceableones like sex [78–80], age [78–80], and ethnicity [81, 82], andinfluenceable ones such as the time of day of sample collec-tion [83–86], physical activity, pre-/postprandial state [87].Table 1 provides a summary of suggested general points thatshould be considered. Three aspects could represent importantpitfalls and are discussed in the following paragraphs.
Aspect #1 (questionnaire): Individual needs and prefer-ences of study subjects are manifold and can significantly alterthe metabolome and lipidome. Therefore, this should be care-fully asked and documented, as for example, dietary supple-ments (vitamins, lipids (fish oil), iron, etc.), drugs, special ortrendy diets (gluten-free, vegan, paleo, etc.), smoking, dailyamount of tea or coffee, and alcohol consumption (Table 1).Particularly, detailed questions about dietary supplementsneed to be included because they are usually not perceivedas a kind of “medication” affecting human metabolism. Thismeans that supplement intake is usually not reported whenstudy subjects are asked only about medication intake. Yet,fish oil capsules or flavonoid-rich supplement as an examplemay heavily affect distinct metabolites/lipids, or modify met-abolic pathways as well as the inflammatory status and othermechanisms in the body [88, 89]. The same is likely to be truefor minerals, plant extracts, vitamin pills, amino acid or pro-tein shakes, and many others.
In general, it is quite difficult to find participants/patientswho do not take anything, i.e., at younger age, people con-sume regularly mainly food supplements and > 45 years ofage medications (often in combinations with supplements).Consequently, it is almost impossible to assemble a studycohort or select samples from a biobank with metabolomesand lipidomes free of any xenobiotic “side effects.” Therefore,informative entries in questionnaires accessible for(bio)analytical chemists are highly relevant.
Aspect #2 (participant instruction): The vast majority ofbiomedical metabolomics or lipidomics studies prefer theanalysis of samples collected in the fasted state (Table 1).Hence, a clear instruction of study participants about fastingprior sample collection is important. A common fasting periodis usually not less than 12 h, which can be most easilyachieved by overnight fasting. “Fasting” is usually understoodas “[...] not eating for a defined period of time […],” butdrinking is allowed. What kind of beverage is allowed in themorning? It should be considered that people are often un-aware that drinking only one cup of milk-sweetened coffee,tea, or sweetened beverage after getting up in the morning on
the day of the study changes the composition of the metabo-lome [29, 90]. Drinking only pure water without any addi-tives, like artificial flavors or others, in the morning is ratheruncommon but the only acceptable drink before collection ofbody fluids in the fasted state. Pure tea or coffee should also beexcluded [90–92].
Subjects should also be instructed to avoid all kinds ofextreme and unaccustomed metabolic and physiological chal-lenges (e.g., stress (being late), unusual physical activity,prolonged starvation, unaccustomed exercise, or food ex-cesses) on the day or days before sample collection.
Aspect #3 (scheduling): The time of day of sample collec-tion is another factor that may have major effects on the me-tabolome or lipidome of interest (Table 1). Not only diet andnutritional state [93, 94], but also circadian effects on themetabolome in mice and humans [83–85] and the humanlipidome [86] should be taken into consideration. About13% of studied human plasma lipidome exhibited partiallyopposed circadian rhythmicity, most pronounced for the clas-ses of phosphatidylcholines, diacylglycerols, and triacylglyc-erols [86]. The group of H.R. Ueda reported the quantificationof circadian oscillating metabolites in human and mouseblood and in several mouse organs [83–85]. The human studywas strictly controlled for confounding effects of activity lev-el, light, temperature, sleep, and food intake [84].Consequently, the time point of sample collection should bekept consistent within a study (Table 1). Circadian oscillationshould also be kept in mind as a cause for discrepancies be-tween findings from different sites in multi-center studies orfrom studies in different literatures.
Usually, it is not a problem to perform the sample collec-tion in the morning, ideally between 7 and 10 a.m. after a 12-hfasting period. But, in studies recruiting tens of thousands ofsubjects at different sites, it is quite difficult to collect allsamples at the same-day time due to logistical reasons. In suchmulti-center studies, like national cohort studies, accurate doc-umentation of the time of sample collection and the metabolicstatus of the participant is essential. Samples collected post-prandial and/or not between 7 and 10 a.m. should be excludedfrom metabolomics and lipidomics investigations; otherwise,outliers and high variability in the data are guaranteed.
Apparently healthy, asymptomatic individualschallenge the compilation of healthy control groups
A comparison of the achieved disease-related lipid or metab-olite profile with a healthy control group is one of the first andalso decision-making steps in most biomedical targeted andnon-targeted biomarker studies in animals and humans. It isusually the basis for discussing whether or not to proceed withfurther profiling investigations. However, the compilation of ahealthy cohort can be quite challenging since asymptomatic,apparently healthy individuals need to be identified and
5581From bedside to bench—practical considerations to avoid pre-analytical pitfalls and assess sample quality...

excluded. Otherwise, there is a very high risk for the detectionof misleading biomarker instead of disease-specific markers[95]. What might cause this to happen?
In humans, many diseases remain undiagnosed for yearsbecause the affected individuals are largely asymptomatic;i.e., they feel and seem to be apparently healthy. Examplesinclude kidney and liver diseases, but also the widespreadmetabolic disease of type 2 diabetes with more than430,000,000 affected subjects worldwide (half of them is notaware of having diabetes). A hallmark of many asymptomaticchronic diseases, as well as mild infectious diseases, is low-grade inflammation. In such cases, blood levels of the mostcommon and sensitive inflammation marker C-reactive pro-tein (CRP) are already slightly above the reference range.Ideally, CRP should be measured by a high-sensitive CRPassay in plasma or serum (known as hsCRP).
Undiagnosed, largely asymptomatic diseases can signifi-cantly alter the metabolome and lipidome, as recently shownin an elegant study by Pietzner et al. [95]. The authors exam-ined urine and plasma samples frommore than 900 apparentlyhealthy individuals with slightly altered routine markers ofinflammation in blood (CRP, white blood cell count, fibrino-gen). Subjects with a CRP > 10 mg/l, reflecting acute inflam-mation, were excluded from the study. In a pattern of around600 metabolites in each specimen, a significant association ofinflammatory state was detected with almost 12% of all plas-ma metabolites and 4% in spot urine [95]. Consequences ofthe findings of Pietzner et al are (a) unnoticed, low-gradeinflammation in apparently healthy humans can bias the me-tabolome in blood and urine; (b) the described CRP-associat-ed metabolites could be suitable tools to identify subjects withsubclinical inflammation in metabolomics data; and (c) thedetection of these “inflammatory biomarkers” in another con-text in human metabolomics project can be a hint to be cau-tious in data interpretation, particularly to title these metabo-lites as specific biomarkers for particular diseases. In the worstcase, uncontrolled health conditions may lead to a controlgroup dominated by apparently healthy humans with low-grade inflammation (or other asymptomatic diseases). Thiscan result in the discovery of biomarkers reflecting differentstages of inflammation, rather than the intended specificmarkers related to the actual research question of the project.
The simplest but already very informative way to obtainseveral information on the health status of each study partici-pant are the above-described urine test strips (see also intro-duction to Urine), ideally combined with the determination ofhsCRP in blood. More detailed, but still easily obtained, areother common organ-specific blood tests, like creatinine forkidney function, gamma glutamyl transferase (γ-GT) for liver,and thyroid-stimulating hormone (TSH) for thyroid function.Ideal records about the individual behind each sample wouldcontain a standard routine laboratory profile combined withdata from a medical checkup, which is, however, time-
consuming as well as cost-intensive. Therefore, these profilesare not widely used.Whenever possible, (bio)analytical chem-ists should have access to the anonymized health state data inthe phase before sample preparation for high-resolution anal-yses begins. This information could be used either to verifythe suitability of the sample set selected by a medical doctor ora biobank, or to self-select samples that are best suited to theintention of the respective metabolomics project.
To conclude, the phase before sample collection, whichcompromises the instruction of study participants, their habits,and recent activities, can bias the metabolome and lipidomeand thus the outcome of a profiling study before a sample iseven collected, prepared, or analyzed. Strong differences inmetabolism and therefore in the metabolome can be expectedbased on time of day of sample collection, stress, pre- orpostprandial state, intake of dietary supplements, unaccus-tomed physical activity before sample collection, life stylefactors (e.g., caffeine, alcohol, smoking), trendy diets, xeno-biotics, drugs (see Table 1). The availability of routine labo-ratory records, completed questionnaires, etc., as basic infor-mation of all study participants is desirable.
Conclusions
The quality of biomedical samples is of enormous importancefor reliable and conclusive findings in lipidomics and metabo-lomics studies. The most critical steps that affect sample qual-ity are identified to occur not in the laboratory of(bio)analytical chemists, but in the pre-analytical phase beforesample collection, when metabolically active cells in blood,urine, or CSF may alter the lipidome or metabolome ex vivo.This means, crucial for good sample quality are the apparentlysimple steps from collection of body fluid to storage of thealiquots in the freezer. Since all these steps are well known (aswell as possible pitfalls), the generation of generally applica-ble SOPs is possible. However, each sample collection andsample handling site in a hospital or a multi-center study hasits own characteristics and limitations in terms of perfect sam-ple processing. Therefore, one of the biggest challenges for(bio)analytical chemists to achieve the best possible samplequality is to find a balance between demands for perfect sam-ple quality and the capabilities at the site of sample collection.This always involves compromises regarding perfect samplequality. But it is the important base for the generation of fea-sible SOPs that enable highly reproducible sample collectionand handling at all sites (for suggestions, see Table 2), andsubsequent successful, valid high-resolution metabolomicsand lipidomics investigations.
Unfortunately, a generally applied and accepted strategy toverify and document the sample quality in biomedical profil-ing projects by quantifying quality biomarkers in randomsamples is still missing. In the future, it would be desirable
5582 Lehmann R.

to agree on biomarkers for the assessment of body fluid qual-ity in high-resolution metabolomics and lipidomics ap-proaches, and to document the quality grade, e.g., in the sup-plement of publications, as it is already a well-establishedstandard for the analytical accuracy.
Funding Open Access funding enabled and organized by Projekt DEAL.
Declarations
Conflict of interest The author declares no competing interests.
Open Access This article is licensed under a Creative CommonsAttribution 4.0 International License, which permits use, sharing, adap-tation, distribution and reproduction in any medium or format, as long asyou give appropriate credit to the original author(s) and the source, pro-vide a link to the Creative Commons licence, and indicate if changes weremade. The images or other third party material in this article are includedin the article's Creative Commons licence, unless indicated otherwise in acredit line to the material. If material is not included in the article'sCreative Commons licence and your intended use is not permitted bystatutory regulation or exceeds the permitted use, you will need to obtainpermission directly from the copyright holder. To view a copy of thislicence, visit http://creativecommons.org/licenses/by/4.0/.
References
1. Carraro P, Zago T, Plebani M. Exploring the initial steps of thetesting process: frequency and nature of pre-preanalytic errors.Clin Chem. 2012;58(3):638–42.
2. Lippi G, Guidi GC, Mattiuzzi C, Plebani M. Preanalytical variabil-ity: the dark side of the moon in laboratory testing. Clin Chem LabMed. 2006;44(4):358–65.
3. Szecsi PB, Odum L. Error tracking in a clinical biochemistry labo-ratory. Clin Chem Lab Med. 2009;47(10):1253–7.
4. Züllig T, Trötzmüller M, Köfeler HC. Lipidomics from samplepreparation to data analysis: a primer. Anal Bioanal Chem.2020;412(10):2191–209.
5. Vuckovic D. Current trends and challenges in sample preparationfor global metabolomics using liquid chromatography-mass spec-trometry. Anal Bioanal Chem. 2012;403(6):1523–48.
6. Dunn WB, Broadhurst D, Begley P, Zelena E, Francis-McIntyre S,Anderson N, et al. Procedures for large-scale metabolic profiling ofserum and plasma using gas chromatography and liquid chroma-tography coupled to mass spectrometry. Nat Protoc. 2011;6(7):1060–83.
7. Yin P, Peter A, Franken H, Zhao X, Neukamm SS, Rosenbaum L,et al. Preanalytical aspects and sample quality assessment in meta-bolomics studies of human blood. Clin Chem. 2013;59(5):833–45.
8. Paglia G, Del Greco FM, Sigurdsson BB, Rainer J, Volani C, HicksAA, et al. Influence of collection tubes during quantitative targetedmetabolomics studies in human blood samples. Clinica chimicaacta; international journal of clinical chemistry. 2018;486:320–8.
9. Allard L, Bowen RAR. Preanalytical error: improper gel barrierformation in a serum separator tube despite appropriate centrifuga-tion condition. Clinica chimica acta; international journal of clinicalchemistry. 2021;516:69–70.
10. Bowen RA, Remaley AT. Interferences from blood collection tubecomponents on clinical chemistry assays. Biochemia Medica.2014;24(1):31–44.
11. Liu X, Hoene M, Yin P, Fritsche L, Plomgaard P, Hansen JS, et al.Quality control of serum and plasma by quantification of (4E,14Z)-sphingadienine-C18-1-phosphate uncovers common preanalyticalerrors during handling of whole blood. Clin Chem. 2018;64(5):810–9.
12. Wang Y, Carter BD, Gapstur SM, McCullough ML, Gaudet MM,Stevens VL. Reproducibility of non-fasting plasma metabolomicsmeasurements across processing delays. Metabolomics.2018;14(10):129.
13. Jain M, Kennedy AD, Elsea SH, Miller MJ. Analytes related toerythrocyte metabolism are reliable biomarkers for preanalyticalerror due to delayed plasma processing in metabolomics studies.Clinica chimica acta; international journal of clinical chemistry.2017;466:105–11.
14. Koch E, Mainka M, Dalle C, Ostermann AI, Rund KM, Kutzner L,et al. Stability of oxylipins during plasma generation and long-termstorage. Talanta. 2020;217:121074.
15. Liu X, Hoene M, Xiaolin W, Yin P, Häring HU, Xu GW, et al.Serum or plasma, what is the difference? Investigations to facilitatethe sample material selection decision making process for metabo-lomics studies and beyond. Anal Chim Acta. 2018;1037:293–300.
16. Kirwan JA, Brennan L, Broadhurst D, Fiehn O, Cascante M, DunnWB, et al. Preanalytical processing and biobanking procedures ofbiological samples for metabolomics research: a white paper, com-mun i t y pe r spec t i v e ( f o r “Pr ec i s i on Med i c ine andPharmacometabolomics Task Group”-The Metabolomics SocietyInitiative). Clin Chem. 2018;64(8):1158–82.
17. Kamlage B, Maldonado SG, Bethan B, Peter E, Schmitz O,Liebenberg V, et al. Quality markers addressing preanalytical var-iations of blood and plasma processing identified by broad andtargeted metabolite profiling. Clin Chem. 2014;60(2):399–412.
18. Bernini P, Bertini I, Luchinat C, Nincheri P, Staderini S, Turano P.Standard operating procedures for pre-analytical handling of bloodand urine for metabolomic studies and biobanks. J Biomol NMR.2011;49(3-4):231–43.
19. Hahnefeld L, Gurke R, Thomas D, Schreiber Y, Schäfer SMG,Trautmann S, et al. Implementation of lipidomics in clinical routine:can fluoride/citrate blood sampling tubes improve preanalytical sta-bility? Talanta. 2020;209:120593.
20. Jonasdottir HS, Brouwers H, Toes REM, Ioan-Facsinay A, GieraM. Effects of anticoagulants and storage conditions on clinicaloxylipid levels in human plasma. Biochim Biophys Acta MolCell Biol Lipids. 2018;1863(12):1511–22.
21. Ammerlaan W, Trezzi JP, Lescuyer P, Mathay C, Hiller K, BetsouF. Method validation for preparing serum and plasma samples fromhuman blood for downstream proteomic, metabolomic, and circu-lating nucleic acid-based applications. Biopreserv Biobank.2014;12(4):269–80.
22. Lippi G, Blanckaert N, Bonini P, Green S, Kitchen S, Palicka V,et al. Haemolysis: an overview of the leading cause of unsuitablespecimens in clinical laboratories. Clin Chem Lab Med.2008;46(6):764–72.
23. Marques-Garcia F. Methods for hemolysis interference study inlaboratory medicine - a critical review. Ejifcc. 2020;31(1):85–97.
24. Guder WG, Naraynan S, Wisser H, Zwata B. Samples: from thepatient to the laboratory. 3rd ed. Weinheim, Germany: Wiley-VCHVerlag GmbH & Co. KGaA; 2003.
25. Lehmann R. Chapter 3 - pre-analytics in biomedical metabolomics.In: Adamski J, editor. Metabolomics for biomedical research:Academic Press; 2020. p. 33-56.
26. Wedge DC, Allwood JW, Dunn W, Vaughan AA, Simpson K,Brown M, et al. Is serum or plasma more appropriate forintersubject comparisons in metabolomic studies? An assessment
5583From bedside to bench—practical considerations to avoid pre-analytical pitfalls and assess sample quality...

in patients with small-cell lung cancer. Anal Chem. 2011;83(17):6689–97.
27. Yu Z, Kastenmuller G, He Y, Belcredi P, Moller G, Prehn C, et al.Differences between human plasma and serum metabolite profiles.PLoS One. 2011;6(7):e21230.
28. Wolrab D, ChocholouškováM, Jirásko R, Peterka O,Mužáková V,Študentová H, et al. Determination of one year stability of lipidplasma profile and comparison of blood collection tubes usingUHPSFC/MS and HILIC-UHPLC/MS. Anal Chim Acta.2020;1137:74–84.
29. Allard E, Backstrom D, Danielsson R, Sjoberg PJ, Bergquist J.Comparing capillary electrophoresis-mass spectrometry finger-prints of urine samples obtained after intake of coffee, tea, or water.Anal Chem. 2008;80(23):8946–55.
30. Dunn WB, Broadhurst D, Ellis DI, Brown M, Halsall A, O’HaganS, et al. A GC-TOF-MS study of the stability of serum and urinemetabolomes during the UK Biobank sample collection and prep-aration protocols. Int J Epidemiol. 2008;37(Suppl 1):i23–30.
31. Santos Ferreira DL, Maple HJ, Goodwin M, Brand JS, Yip V, MinJL, et al. The effect of pre-analytical conditions on blood metabo-lomics in epidemiological studies. Metabolites. 2019;9(4):64.
32. Barri T, Dragsted LO. UPLC-ESI-QTOF/MS and multivariate dataanalysis for blood plasma and serum metabolomics: effect of ex-perimental artefacts and anticoagulant. Anal Chim Acta. 2013;768:118–28.
33. Teahan O, Gamble S, Holmes E, Waxman J, Nicholson JK, BevanC, et al. Impact of analytical bias in metabonomic studies of humanblood serum and plasma. Anal Chem. 2006;78(13):4307–18.
34. LescheD, Geyer R, Lienhard D, Nakas CT, Diserens G, VermathenP, et al. Does centrifugation matter? Centrifugal force and spinningtime alter the plasma metabolome. Metabolomics. 2016;12(10):159.
35. Moretti F, Birarelli M, Carducci C, Pontecorvi A, Antonozzi I.Simultaneous high-performance liquid chromatographic determina-tion of amino acids in a dried blood spot as a neonatal screeningtest. J Chromatogr. 1990;511:131–6.
36. Drolet J, Tolstikov V, Williams BA, Greenwood BP, Hill C,Vishnudas VK, et al. Integrated metabolomics assessment of hu-man dried blood spots and urine strips. Metabolites. 2017;7(3):35.
37. Palmer EA, Cooper HJ, Dunn WB. Investigation of the 12-monthstability of dried blood and urine spots applying untargetedUHPLC-MS metabolomic assays. Anal Chem. 2019;91(22):14306–13.
38. Strnadová KA, Holub M, Mühl A, Heinze G, Ratschmann R,Mascher H, et al. Long-term stability of amino acids andacylcarnitines in dried blood spots. Clin Chem. 2007;53(4):717–22.
39. Fingerhut R, Ensenauer R, Röschinger W, Arnecke R, OlgemöllerB, Roscher AA. Stability of acylcarnitines and free carnitine indried blood samples: implications for retrospective diagnosis ofinborn errors of metabolism and neonatal screening for carnitinetransporter deficiency. Anal Chem. 2009;81(9):3571–5.
40. Volani C, Caprioli G, Calderisi G, Sigurdsson BB, Rainer J,Gentilini I, et al. Pre-analytic evaluation of volumetric absorptivemicrosampling and integration in a mass spectrometry-based meta-bolomics workflow. Anal Bioanal Chem. 2017;409(26):6263–76.
41. Anton G, Wilson R, Yu ZH, Prehn C, Zukunft S, Adamski J, et al.Pre-analytical sample quality: metabolite ratios as an intrinsic mark-er for prolonged room temperature exposure of serum samples.PLoS One. 2015;10(3):e0121495.
42. Shurubor YI, Matson WR, Willett WC, Hankinson SE, Kristal BS.Biological variability dominates and influences analytical variancein HPLC-ECD studies of the human plasma metabolome. BMCClin Pathol. 2007;7:9.
43. Yang W, Chen Y, Xi C, Zhang R, Song Y, Zhan Q, et al. LC-MS/MS-based plasma metabonomics delineate the effect of
metabolites’ stability on reliability of potential biomarkers. AnalChem. 2013;85(5):2606–10.
44. Pinto J, Domingues MR, Galhano E, Pita C, Almeida Mdo C,Carreira IM, et al. Human plasma stability during handling andstorage: impact on NMR metabolomics. Analyst. 2014;139(5):1168–77.
45. Breier M, Wahl S, Prehn C, Fugmann M, Ferrari U, Weise M, et al.Targeted metabolomics identifies reliable and stable metabolites inhuman serum and plasma samples. PLoS One. 2014;9(2):e89728.
46. Ghini V, Quaglio D, Luchinat C, Turano P. NMR for sample qual-ity assessment in metabolomics. New Biotechnol. 2019;52:25–34.
47. Trezzi JP, Bulla A, Bellora C, Rose M, Lescuyer P, Kiehntopf M,et al. LacaScore: a novel plasma sample quality control tool basedon ascorbic acid and lactic acid levels. Metabolomics. 2016;12:96.
48. Baranowski M, Charmas M, Dlugolecka B, Gorski J. Exercise in-creases plasma levels of sphingoid base-1 phosphates in humans.Acta Physiol (Oxford). 2011;203(3):373–80.
49. Yatomi Y. Plasma sphingosine 1-phosphate metabolism and anal-ysis. Biochim Biophys Acta. 2008;1780(3):606–11.
50. Nixon GF. Sphingolipids in inflammation: pathological implica-tions and potential therapeutic targets. Br J Pharmacol.2009;158(4):982–93.
51. Pottala JV, Espeland MA, Polreis J, Robinson J, Harris WS.Correcting the effects of -20 degrees C storage and aliquot size onerythrocyte fatty acid content in the Women's Health Initiative.Lipids. 2012;47(9):835–46.
52. Metherel AH, Aristizabal Henao JJ, Stark KD. EPA and DHAlevels in whole blood decrease more rapidly when stored at -20degrees C as compared with room temperature, 4 and -75 degreesC. Lipids. 2013;48(11):1079–91.
53. Gonzales GB, De Saeger S. Elastic net regularized regression fortime-series analysis of plasma metabolome stability under sub-op-timal freezing condition. Sci Rep. 2018;8(1):3659.
54. Culp-Hill R, Reisz JA, Hansen KC, D’Alessandro A. Investigationof the effects of storage and freezing on mixes of heavy-labeledmetabolite and amino acid standards. Rapid Commun MassSpectrom. 2017;31(23):2030–4.
55. Haid M, Muschet C, Wahl S, Romisch-Margl W, Prehn C, MollerG, et al. Long-term stability of human plasma metabolites duringstorage at -80 degrees C. J Proteome Res. 2018;17(1):203–11.
56. Wagner-Golbs A, Neuber S, Kamlage B, Christiansen N, Bethan B,Rennefahrt U, et al. Effects of long-term storage at -80 °C on thehuman plasma metabolome. Metabolites. 2019;9(5):99.
57. Fliniaux O, Gaillard G, Lion A, Cailleu D, Mesnard F, Betsou F.Influence of common preanalytical variations on the metabolic pro-file of serum samples in biobanks. J Biomol NMR. 2011;51(4):457–65.
58. Goodman K, Mitchell M, Evans AM, Miller LAD, Ford L,Wittmann B, et al. Assessment of the effects of repeated freezethawing and extended bench top processing of plasma samplesusing untargeted metabolomics. Metabolomics. 2021;17(3):31.
59. Helmschrodt C, Becker S, Thiery J, Ceglarek U. Preanalytical stan-dardization for reactive oxygen species derived oxysterol analysisin human plasma by liquid chromatography-tandem mass spec-trometry. Biochem Biophys Res Commun. 2014;446(3):726–30.
60. Pizarro C, Arenzana-Rámila I, Pérez-del-Notario N, Pérez-MatuteP, González-Sáiz JM. Thawing as a critical pre-analytical step in thelipidomic profiling of plasma samples: new standardized protocol.Anal Chim Acta. 2016;912:1–9.
61. Liu X, Yin P, Shao Y, Wang Z, Wang B, Lehmann R, et al. Whichis the urine sample material of choice for metabolomics-drivenbiomarker studies? Anal Chim Acta. 2020;1105:120–7.
62. Munger LH, Trimigno A, Picone G, Freiburghaus C, Pimentel G,Burton KJ, et al. Identification of urinary food intake biomarkers formilk, cheese, and soy-based drink by untargeted GC-MS and NMRin healthy humans. J Proteome Res. 2017;16(9):3321–35.
5584 Lehmann R.

63. Khodorova NV, Rutledge DN, Oberli M, Mathiron D, Marcelo P,Benamouzig R, et al. Urinary metabolomics profiles associated tobovine meat ingestion in humans. Mol Nutr Food Res. 2019;63(1):e1700834.
64. Cheung W, Keski-Rahkonen P, Assi N, Ferrari P, Freisling H,Rinaldi S, et al. A metabolomic study of biomarkers of meat andfish intake. Am J Clin Nutr. 2017;105(3):600–8.
65. RotterM, Brandmaier S, Prehn C, Adam J, Rabstein S, Gawrych K,et al. Stability of targeted metabolite profiles of urine samples underdifferent storage conditions. Metabolomics. 2017;13(1):4.
66. Budde K, Gok ON, Pietzner M, Meisinger C, Leitzmann M, NauckM, et al. Quality assurance in the pre-analytical phase of humanurine samples by (1)HNMR spectroscopy. Arch BiochemBiophys.2016;589:10–7.
67. Lauridsen M, Hansen SH, Jaroszewski JW, Cornett C. Humanurine as test material in 1HNMR-based metabonomics: recommen-dations for sample preparation and storage. Anal Chem.2007;79(3):1181–6.
68. Lenz EM, Bright J, Wilson ID, Morgan SR, Nash AF. A 1HNMR-based metabonomic study of urine and plasma samples obtainedfrom healthy human subjects. J Pharm Biomed Anal. 2003;33(5):1103–15.
69. Roux A, Thevenot EA, Seguin F, Olivier MF, Junot C. Impact ofcollection conditions on the metabolite content of human urinesamples as analyzed by liquid chromatography coupled to massspectrometry and nuclear magnetic resonance spectroscopy.Metabolomics. 2015;11(5):1095–105.
70. Meers PD, Chow CK. Bacteriostatic and bactericidal actions ofboric acid against bacteria and fungi commonly found in urine. JClin Pathol. 1990;43(6):484–7.
71. Wang X, Gu H, Palma-Duran SA, Fierro A, Jasbi P, Shi X, et al.Influence of storage conditions and preservatives on metabolitefingerprints in urine. Metabolites. 2019;9(10):203.
72. Laparre J, Kaabia Z, MooneyM, Buckley T, SherryM, Le Bizec B,et al. Impact of storage conditions on the urinary metabolomicsfingerprint. Anal Chim Acta. 2017;951:99–107.
73. Teunissen CE, Petzold A, Bennett JL, Berven FS, Brundin L,Comabella M, et al. A consensus protocol for the standardizationof cerebrospinal fluid collection and biobanking. Neurology.2009;73(22):1914–22.
74. Haijes HA, Willemse EAJ, Gerrits J, van der Flier WM, TeunissenCE, Verhoeven-Duif NM, et al. Assessing the pre-analytical stabil-ity of small-molecule metabolites in cerebrospinal fluid using di-rect-infusion metabolomics. Metabolites. 2019;9(10):236.
75. Rosenling T, SlimCL, Christin C, Coulier L, Shi S, StoopMP, et al.The effect of preanalytical factors on stability of the proteome andselected metabolites in cerebrospinal fluid (CSF). J Proteome Res.2009;8(12):5511–22.
76. Noga MJ, Zielman R, van Dongen RM, Bos S, Harms A, TerwindtGM, et al. Strategies to assess and optimize stability of endogenousamines during cerebrospinal fluid sampling. Metabolomics.2018;14(4):44.
77. Saito K, Hattori K, Andou T, Satomi Y, Gotou M, Kobayashi H,et al. Characterization of postprandial effects on CSF metabolo-mics: a pilot study with parallel comparison to plasma.Metabolites. 2020;10(5):185.
78. Trabado S, Al-Salameh A, Croixmarie V, Masson P, Corruble E,Fève B, et al. The human plasma-metabolome: reference values in800 French healthy volunteers; impact of cholesterol, gender andage. PLoS One. 2017;12(3):e0173615.
79. Darst BF, Koscik RL, Hogan KJ, Johnson SC, Engelman CD.Longitudinal plasma metabolomics of aging and sex. Aging.2019;11(4):1262–82.
80. Beyene HB, Olshansky G, AA TS, Giles C, Huynh K, Cinel M,et al. High-coverage plasma lipidomics reveals novel sex-specificlipidomic fingerprints of age and BMI: evidence from two largepopulation cohort studies. PLoS Biol. 2020;18(9):e3000870.
81. Wu ZE, Fraser K, Kruger MC, Sequeira IR, Yip W, Lu LW, et al.Metabolomic signatures for visceral adiposity and dysglycaemia inAsian Chinese and Caucasian European adults: the cross-sectionalTOFI_Asia study. Nutr Metab. 2020;17(1):95.
82. Holmes E, Loo RL, Stamler J, Bictash M, Yap IK, Chan Q, et al.Human metabolic phenotype diversity and its association with dietand blood pressure. Nature. 2008;453(7193):396–400.
83. Minami Y, Kasukawa T, Kakazu Y, Iigo M, Sugimoto M, Ikeda S,et al. Measurement of internal body time by blood metabolomics.Proc Natl Acad Sci U S A. 2009;106(24):9890–5.
84. Kasukawa T, Sugimoto M, Hida A, Minami Y, Mori M, Honma S,et al. Human blood metabolite timetable indicates internal bodytime. Proc Natl Acad Sci U S A. 2012;109(37):15036–41.
85. Dallmann R, Viola AU, Tarokh L, Cajochen C, Brown SA. Thehuman circadian metabolome. Proc Natl Acad Sci U S A.2012;109(7):2625–9.
86. Chua EC, Shui G, Lee IT, Lau P, Tan LC, Yeo SC, et al. Extensivediversity in circadian regulation of plasma lipids and evidence fordifferent circadian metabolic phenotypes in humans. Proc NatlAcad Sci U S A. 2013;110(35):14468–73.
87. Karimpour M, Surowiec I, Wu J, Gouveia-Figueira S, Pinto R,Trygg J, et al. Postprandial metabolomics: a pilot mass spectrome-try and NMR study of the human plasma metabolome in responseto a challenge meal. Anal Chim Acta. 2016;908:121–31.
88. Cao J, Schwichtenberg KA, Hanson NQ, Tsai MY. Incorporationand clearance of omega-3 fatty acids in erythrocyte membranes andplasma phospholipids. Clin Chem. 2006;52(12):2265–72.
89. Nieman DC, Ramamoorthy S, Kay CD, Goodman CL, Capps CR,Shue ZL, et al. Influence of ingesting a flavonoid-rich supplementon the metabolome and concentration of urine phenolics in over-weight/obese women. J Proteome Res. 2017;16(8):2924–35.
90. Rothwell JA, Madrid-Gambin F, Garcia-Aloy M, Andres-LacuevaC, Logue C, Gallagher AM, et al. Biomarkers of intake for coffee,tea, and sweetened beverages. Genes Nutr. 2018;13:15.
91. Van Dorsten FA, Daykin CA, Mulder TP, Van Duynhoven JP.Metabonomics approach to determine metabolic differences be-tween green tea and black tea consumption. J Agric Food Chem.2006;54(18):6929–38.
92. Spencer JP. Metabolism of tea flavonoids in the gastrointestinaltract. J Nutr. 2003;133(10):3255S–61S.
93. Bar N, Korem T,Weissbrod O, Zeevi D, Rothschild D, Leviatan S,et al. A reference map of potential determinants for the humanserum metabolome. Nature. 2020;588(7836):135–40.
94. Eriksen R, Perez IG, Posma JM, Haid M, Sharma S, Prehn C, et al.Dietary metabolite profiling brings new insight into the relationshipbetween nutrition and metabolic risk: an IMI DIRECT study.EBioMedicine. 2020;58:102932.
95. Pietzner M, Kaul A, Henning AK, Kastenmuller G, Artati A, LerchMM, et al. Comprehensive metabolic profiling of chronic low-grade inflammation among generally healthy individuals. BMCMed. 2017;15(1):210.
Publisher’s note Springer Nature remains neutral with regard to jurisdic-tional claims in published maps and institutional affiliations.
5585From bedside to bench—practical considerations to avoid pre-analytical pitfalls and assess sample quality...