Embed Size (px)
Citation preview
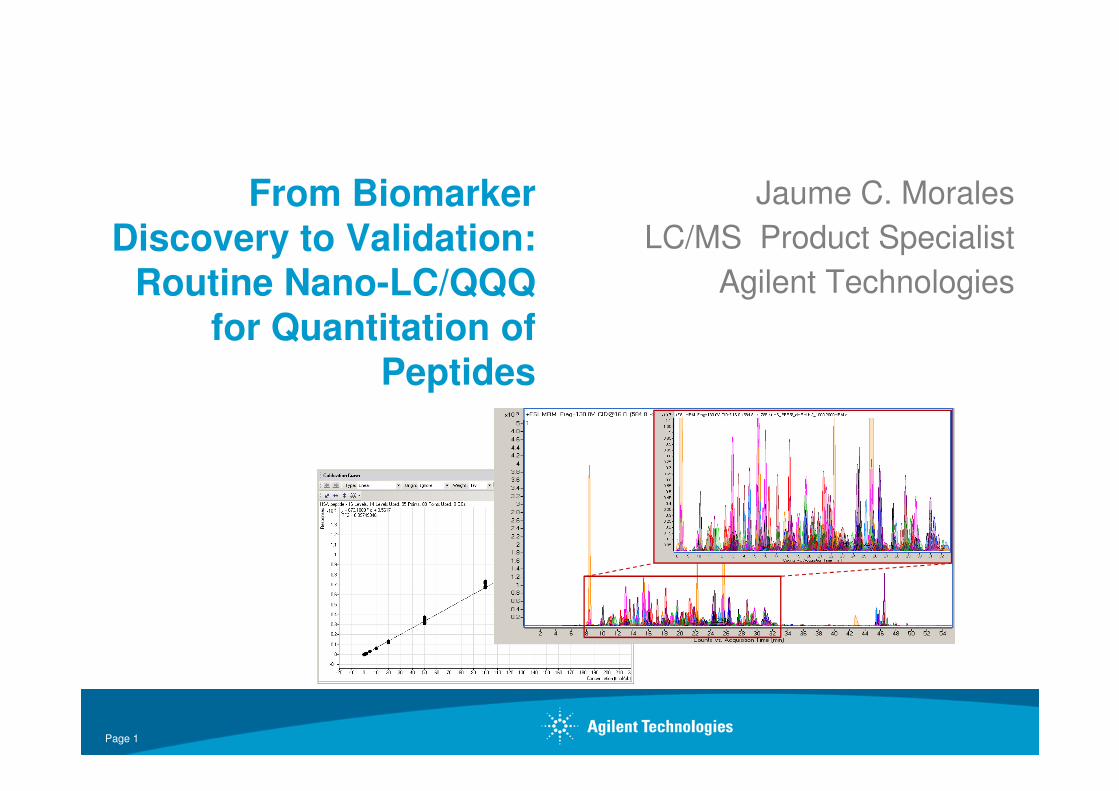
Jaume C. Morales
LC/MS Product Specialist
Agilent Technologies
From Biomarker Discovery to Validation:
Routine Nano-LC/QQQ for Quantitation of
Peptides
Page 1
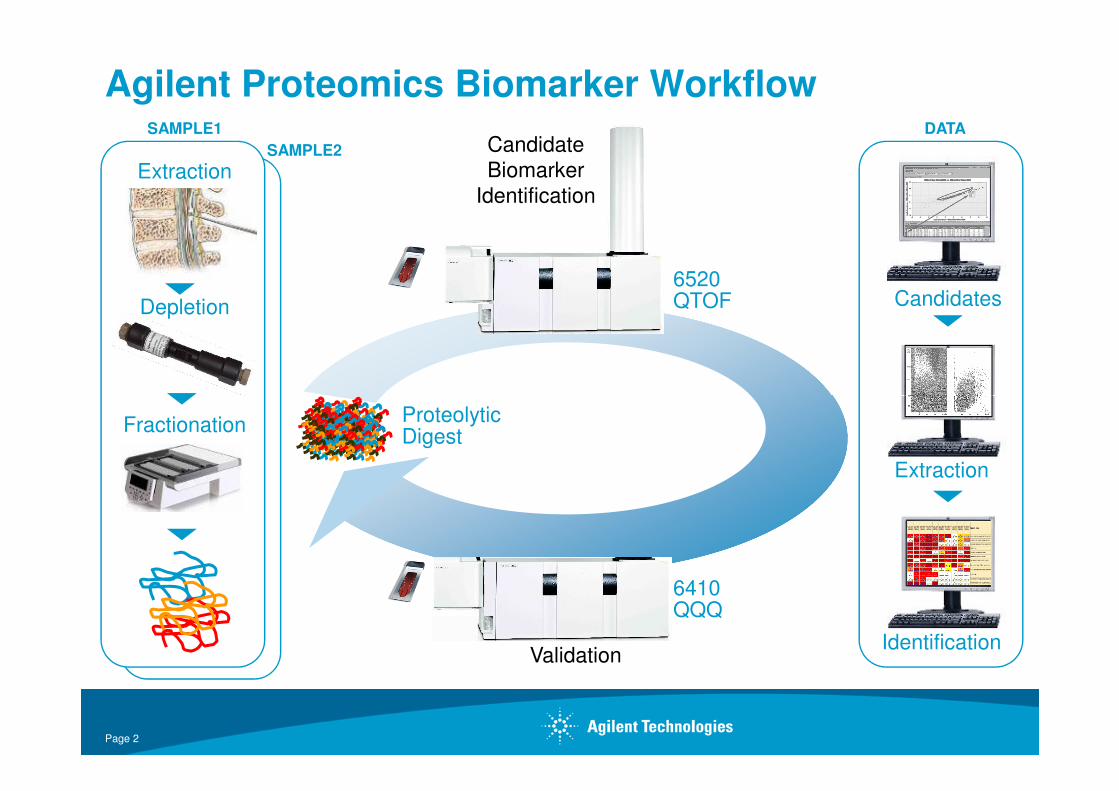
Agilent Proteomics Biomarker Workflow
Candidates
Extraction
Depletion
6520 QTOF
Candidate
Biomarker
Identification
SAMPLE1 DATA
SAMPLE2
Page 2
Proteolytic Digest
Fractionation
Extraction
Identification
6410 QQQ
Validation
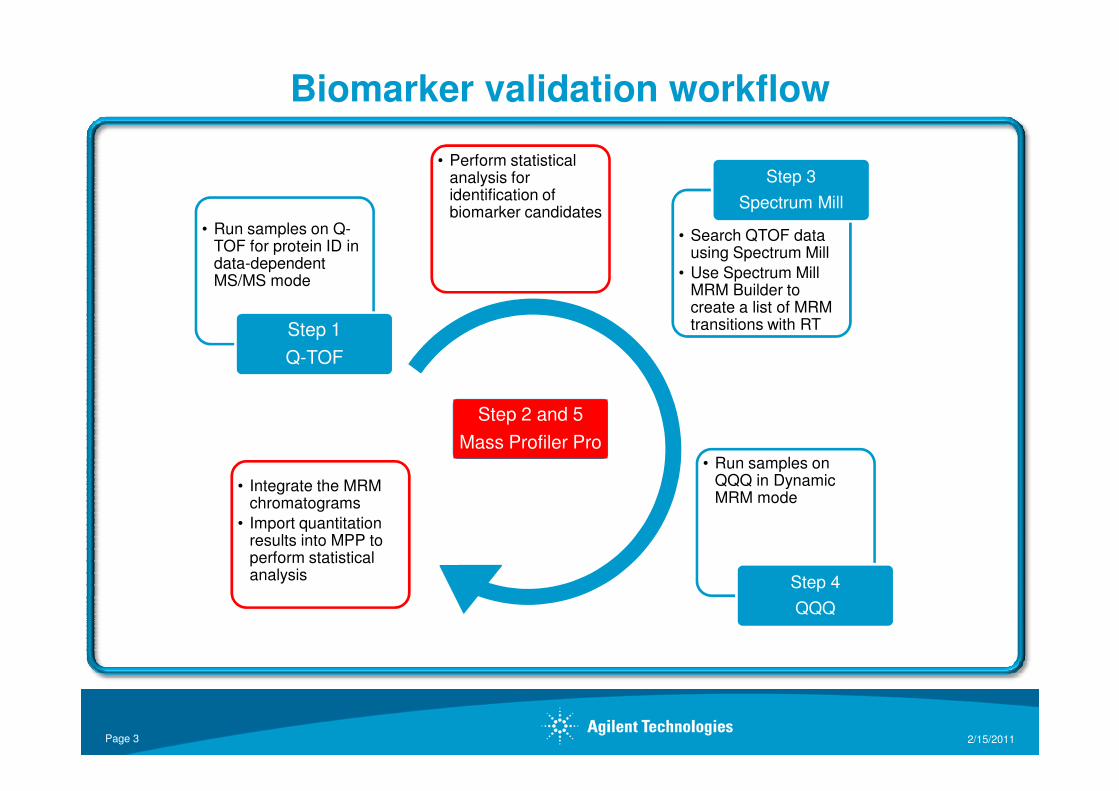
• Perform statistical analysis for identification of biomarker candidates
Biomarker validation workflow
• Run samples on Q-TOF for protein ID in data-dependent MS/MS mode
Step 1
Q-TOF
• Search QTOF data using Spectrum Mill
• Use Spectrum Mill MRM Builder to create a list of MRM transitions with RT
Step 3
Spectrum Mill
Step 2 and 5
Mass Profiler Pro• Run samples on
QQQ in Dynamic MRM mode
Step 4
QQQ
• Integrate the MRM chromatograms
• Import quantitation results into MPP to perform statistical analysis
2/15/2011Page 3
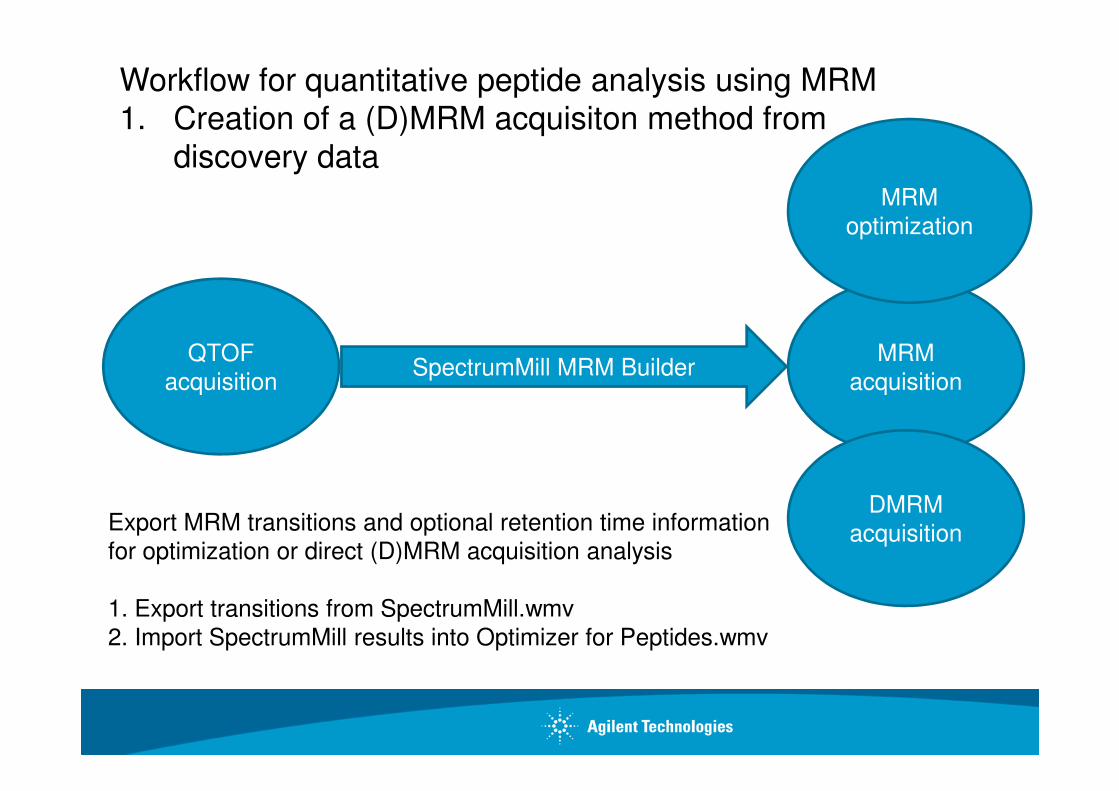
MRM
acquisition
QTOF
acquisition
MRM
optimization
Workflow for quantitative peptide analysis using MRM
1. Creation of a (D)MRM acquisiton method from
discovery data
SpectrumMill MRM Builder
DMRM
acquisitionExport MRM transitions and optional retention time information
for optimization or direct (D)MRM acquisition analysis
1. Export transitions from SpectrumMill.wmv
2. Import SpectrumMill results into Optimizer for Peptides.wmv
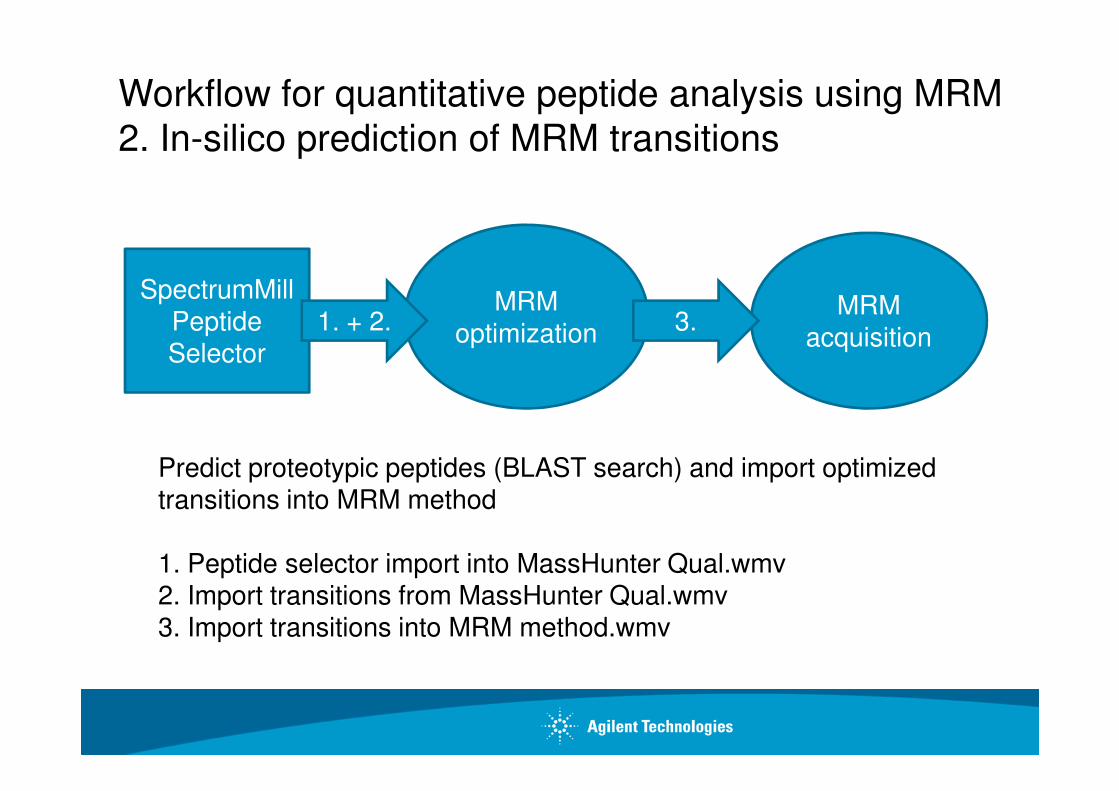
MRM acquisition
MRM optimization
Workflow for quantitative peptide analysis using MRM
2. In-silico prediction of MRM transitions
SpectrumMillPeptide Selector
1. + 2. 3.
Predict proteotypic peptides (BLAST search) and import optimized transitions into MRM method
1. Peptide selector import into MassHunter Qual.wmv2. Import transitions from MassHunter Qual.wmv3. Import transitions into MRM method.wmv
DMRM acquisition
MRM acquisiton
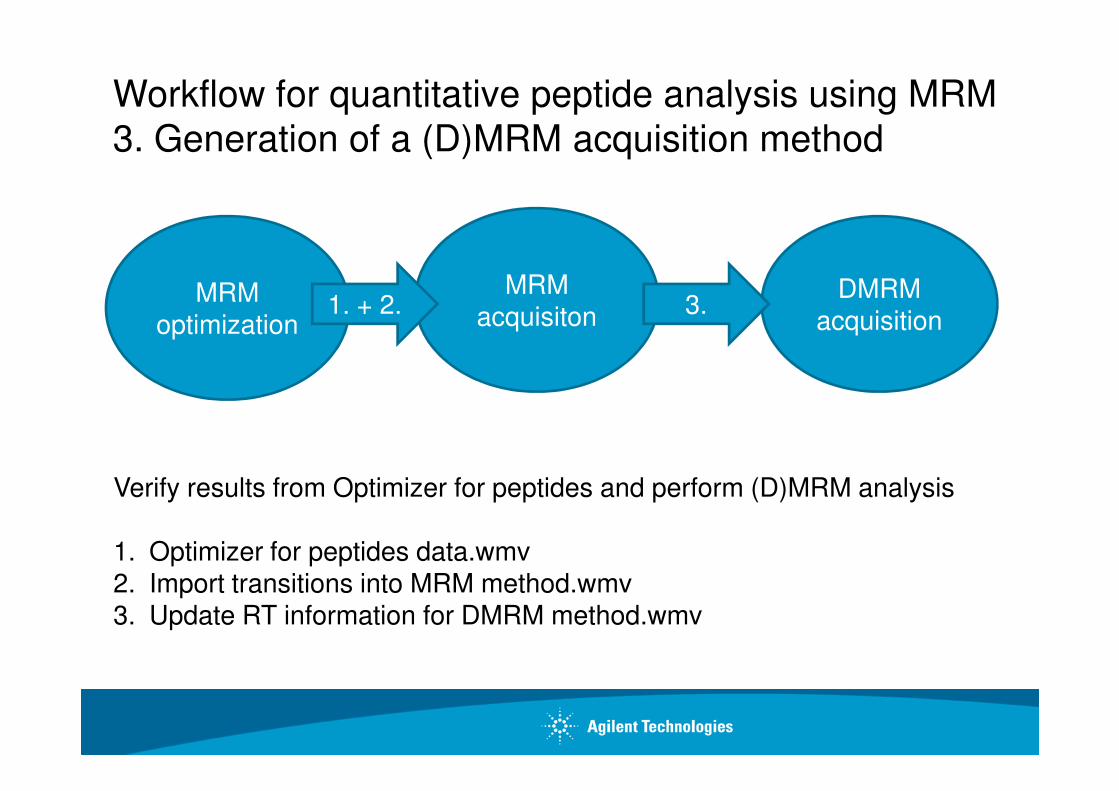
Workflow for quantitative peptide analysis using MRM
3. Generation of a (D)MRM acquisition method
3.MRM optimization
1. + 2.
Verify results from Optimizer for peptides and perform (D)MRM analysis
1. Optimizer for peptides data.wmv2. Import transitions into MRM method.wmv3. Update RT information for DMRM method.wmv
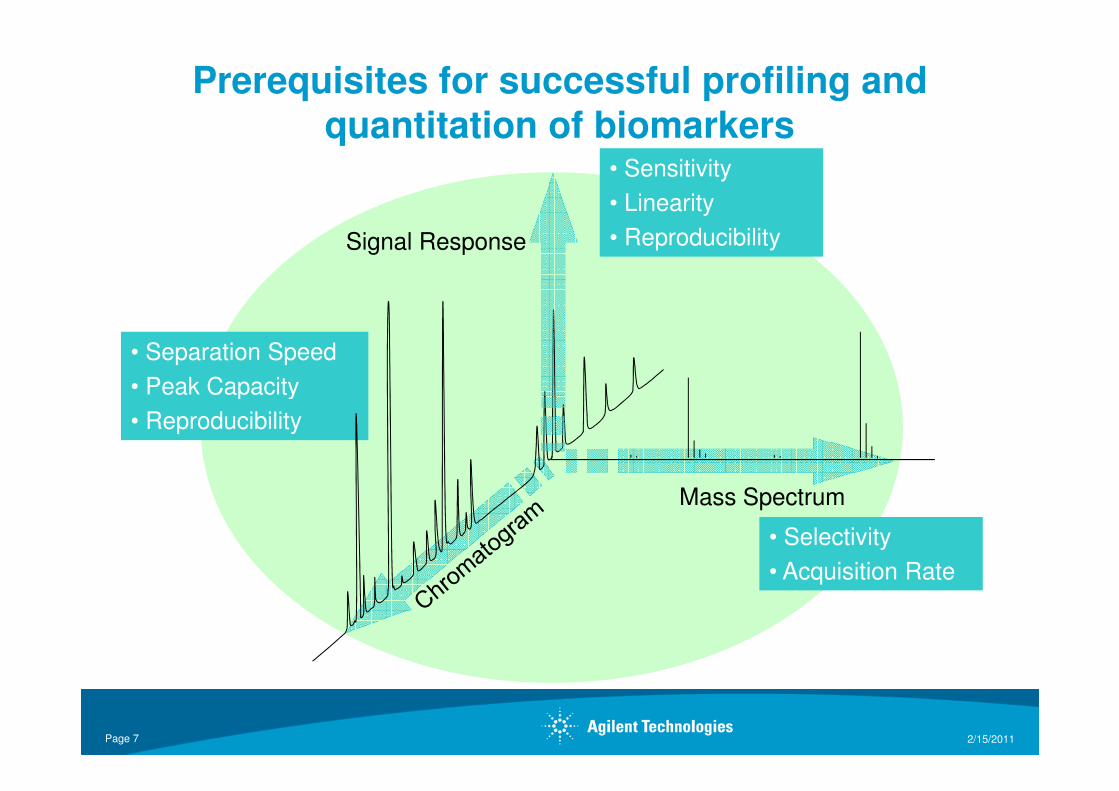
Prerequisites for successful profiling and quantitation of biomarkers
Signal Response
• Sensitivity
• Linearity
• Reproducibility
• Separation Speed
• Peak Capacity
Mass Spectrum
• Selectivity
• Acquisition Rate
• Peak Capacity
• Reproducibility
Page 7 2/15/2011
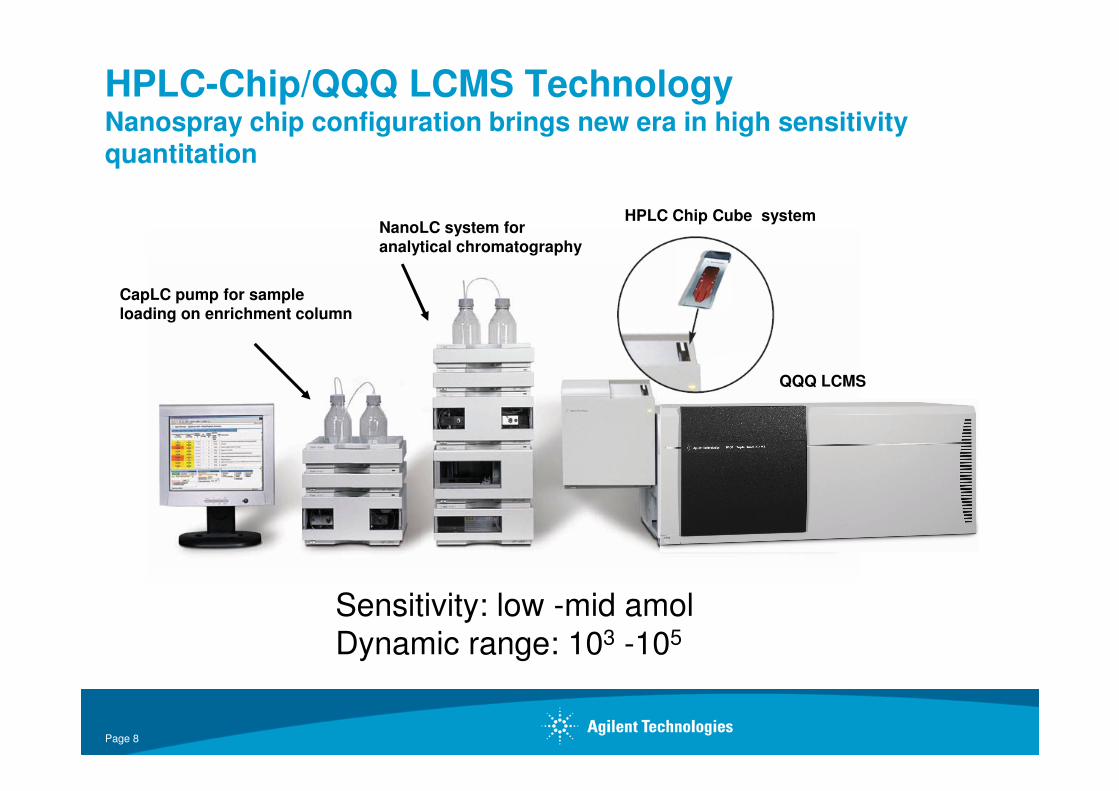
HPLC-Chip/QQQ LCMS TechnologyNanospray chip configuration brings new era in high sensitivity quantitation
NanoLC system foranalytical chromatography
HPLC Chip Cube system
QQQ LCMS
CapLC pump for sampleloading on enrichment column
Page 8
Sensitivity: low -mid amol
Dynamic range: 103 -105
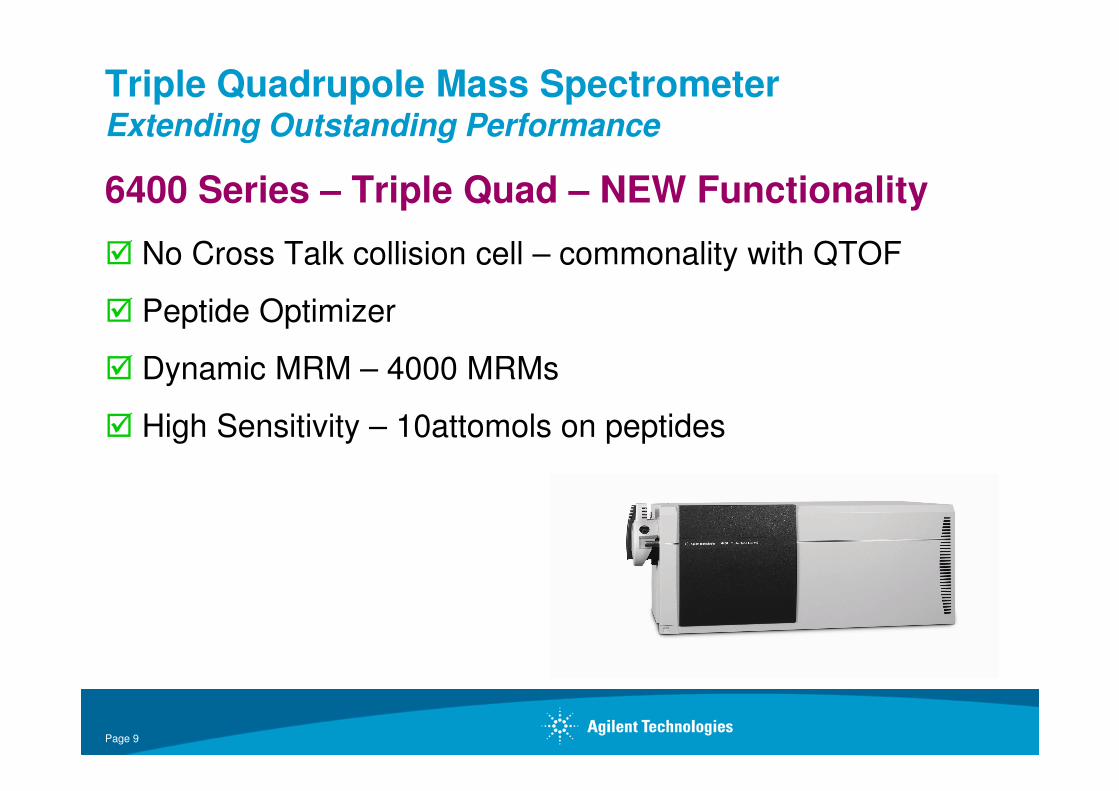
Triple Quadrupole Mass SpectrometerExtending Outstanding Performance
6400 Series – Triple Quad – NEW Functionality
� No Cross Talk collision cell – commonality with QTOF
� Peptide Optimizer
� Dynamic MRM – 4000 MRMs
Page 9
� High Sensitivity – 10attomols on peptides
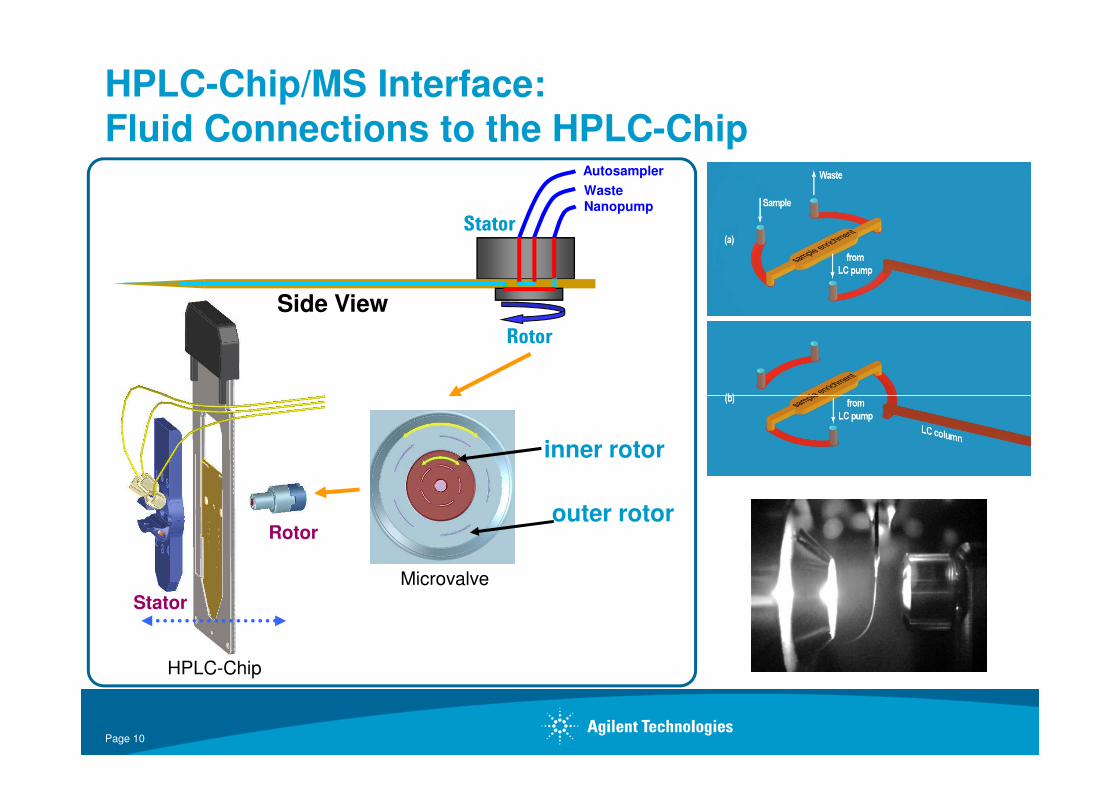
HPLC-Chip/MS Interface:Fluid Connections to the HPLC-Chip
Stator
Rotor
Side View
Nanopump
Autosampler
Waste
Page 10
Rotor
Stator
inner rotor
outer rotor
Microvalve
HPLC-Chip
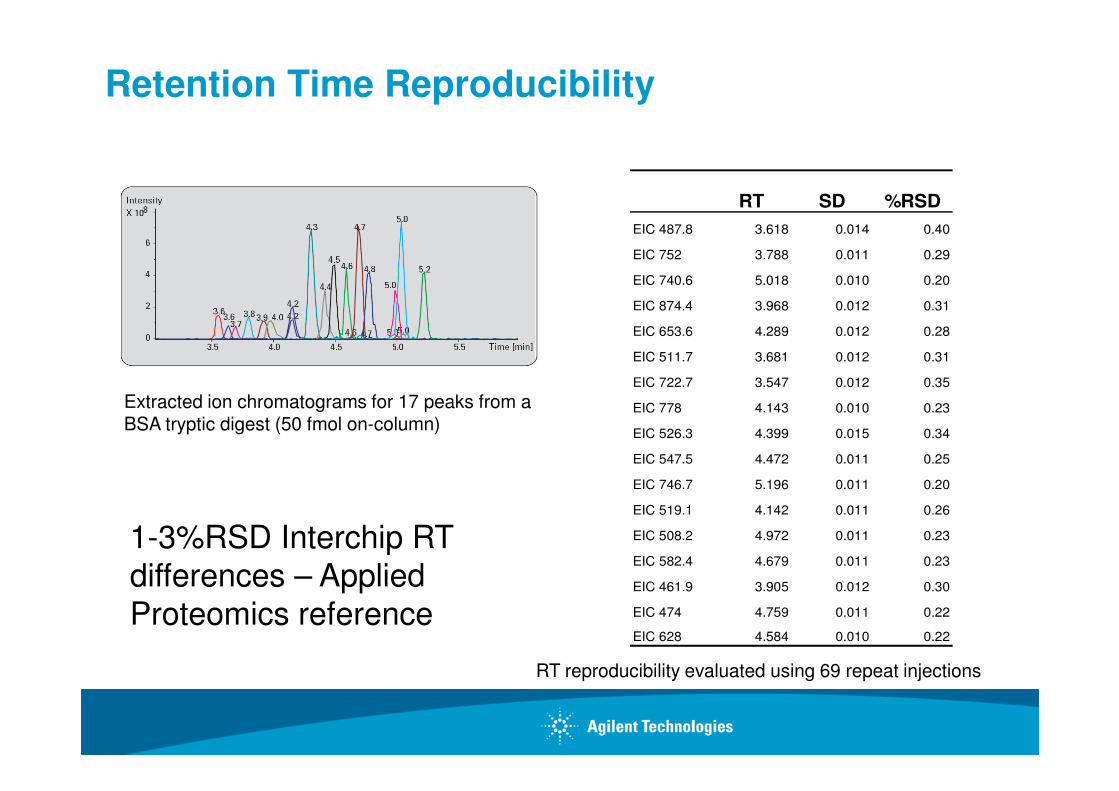
Retention Time Reproducibility
RT SD %RSD
EIC 487.8 3.618 0.014 0.40
EIC 752 3.788 0.011 0.29
EIC 740.6 5.018 0.010 0.20
EIC 874.4 3.968 0.012 0.31
EIC 653.6 4.289 0.012 0.28
EIC 511.7 3.681 0.012 0.31
EIC 722.7 3.547 0.012 0.35
Extracted ion chromatograms for 17 peaks from a EIC 778 4.143 0.010 0.23
EIC 526.3 4.399 0.015 0.34
EIC 547.5 4.472 0.011 0.25
EIC 746.7 5.196 0.011 0.20
EIC 519.1 4.142 0.011 0.26
EIC 508.2 4.972 0.011 0.23
EIC 582.4 4.679 0.011 0.23
EIC 461.9 3.905 0.012 0.30
EIC 474 4.759 0.011 0.22
EIC 628 4.584 0.010 0.22
Extracted ion chromatograms for 17 peaks from a BSA tryptic digest (50 fmol on-column)
RT reproducibility evaluated using 69 repeat injections
1-3%RSD Interchip RT
differences – Applied
Proteomics reference

Ion Intensity Reproducibility
Scatter plot of ions intensities
3,5
4
4,5
5
5,5
log
in
div
idu
al in
ten
sit
y
Replicate 1
Replicate 2
Replicate 3
Replicate 4
Replicate 5
1
Scatter plot of intensities: Run 1 vs, Run 10
� 234 ions were monitored over 5 replicate runs
� ~ 94 % of all ions show less than 20% variation in intensity across all 5 replicates.
� HPLC-Chip/TOF
N =234
Data courtesy of Dr. Pierre Thibault University of Montréal Immunology and Cancer Research Institute
2,5
3
2,5 3 3,5 4 4,5 5 5,5
log average intensity
Replicate 5
2
1 2 Data courtesy of Dr. H. Zhang, X.J. Li and Dr. R. Aebersold, Institut für Molekulare Systembiologie, Switzerland
� 5000 glycopetides monitored over 10 replicate runs.
� HPLC-Chip/TOF

Rapid Nanoflow LC/MS – 3 Minute Analysis21 MRM Transitions From 7 Peptides

MRM Optimizer for QQQ
Programa que permite encontrar los méjores valores de
Fragmentor y/o Energía de colisión
para aquellas transiciones que nos interesan en base a su abundancia.
Es necesario especificar la m/z de precursor y product ion.
Peptide Optimizer for QQQPeptide Optimizer for QQQ
Caso particular del MRM optimizer.
Las transiciones se especifican tan sólo detallando el péptido.
El péptido escogido puede provenir de SM Peptide Selector
o bien de MH Qual

¿Que es diferente en Peptide Optimizer?
Secuencia de péptidos en lugar de fórmulas químicas
Precursor generalmente +2 y/o +3 de estado de carga
El espectro MS/MS muestra varios product ions
Algunos product ions tienen m/z > precursor m/z
Es predecible la fragmentación de los deseados iones “b” y “y”
aunque algunos product ions pueden presentar también
multicarga
Típicamente se buscan 2 -3 péptidos por proteína y 2-3
transiciones por péptido.

Desarrollo y Optimización de métodos SRM para Péptidos
Selección de transiciones basada en
• Observaciones de MS/MS durante el descubrimiento ó
predicciones de iones “b” y “y”.
• Predicción de exclusividad de la secuencia peptídica en la base
de datos.de datos.
Optimización de las transiciones
• El parámetro más importante en QQQ es la energía de colisión.
• Debe seleccionar las transiciones que ofrezcan una mayor
relación S/N y menor interferencias en la matriz.

MRM Method Optimizer for Peptides
Ejecutar Optimizer: Importar las secuencias de péptidos, luego ver las predicciones de fragmentos b/y y seleccionar iones para la optimización.
Run 1 (MRM): Optimiza la CE en modo MRM utilizando la fórmula del Q-TOFcomo punto de partida, en un sólo análisis.
Ventajas:
• Reduce considerablemente la cantidad de muestra utilizada. • Reduce considerablemente la cantidad de muestra utilizada.
• Puede optimizar en más de una carga para el mismo péptido.
• Pre-selección de iones b/y (incluyendo multicarga)
• El único límite está en el numero total de transiciones por inyección de optimización. El propio software nos da información basado en la anchura de los picos y Cycle Time. Conviene adquirir ≥10 puntos por pico.

Enter Sequences and Select b/y Ions For Optimization

Results of Peptide Optimization
Precursor
Peptide sequence
19
Abundance of each transition allows customer to choose best transitions for the final method
Optimized product ions

� Comparison of MRM and Dynamic MRM
Time (min) 1 2 3 4 5 6 7 8 9 10 11 12 13 14 15 16 17 18 19 20 21 22 23 24 25
Compounds (10/block)
Cycle Time (sec)
MRM
50 80
0.5 0.8 1
Time Segment 1 Time Segment 2 Time Segment 3 Time Segment 4
0.7
100 70
Dynamic MRM
Page 20
Cycle Time (sec)
Max Coincident
Cycle Time (sec) 0.4 0.4 0.4 0.4
20 40 40
Dynamic MRM
0.5 0.8 1
30
0.7
• 2 x shorter cycle times supports narrow chromatographic peaks, more analytes or longer dwell per
analyte.

Dynamic MRM – what happens?
Increases
Sensitivity
Improves cycle
time
Page 21
4 ions – not 11 7 ions - not 11
Provides better
chromatographic
definition

Dynamic MRM: Retention Time Based Scheduling of MRM for Optimal Sensitivity

Absolute Protein Quantification in the
Context of Non-clinical Drug Safety Evaluation
UCD Conway Institute
University college Dublin
And
Agilent Technologies
Page 23
Vehicle Low Dose High Dose
Day 2,4,15 Day 2,4,15 Day 2,4,15 Day -3/-4, 1/2, 3/4, 12/13
Histopathology
Transcriptomics
Proteomics
Histopathology
Transcriptomics
Proteomics
Transcriptomics
Proteomics
Metabonomics
Clinical Biochemistry
Metabonomics
Clinical Biochemistry
VehicleVehicle Low DoseLow Dose High DoseHigh Dose
Day 2,4,15 Day 2,4,15 Day 2,4,15 Day -3/-4, 1/2, 3/4, 12/13
Histopathology
Transcriptomics
Proteomics
Histopathology
Transcriptomics
Proteomics
Transcriptomics
Proteomics
Metabonomics
Clinical Biochemistry
Metabonomics
Clinical Biochemistry
Collins B. C. et al. ASMS 2008 MPQ 477

Experimental Design
Rat liver lysate were prepared from
rats treated with troglitazone or
vehicle control
Peptides and MRM transitions were
selected using Peptide Selector in
Catalase was selected based on
previous 2D-DIGE data
1 mg of soluble protein extract was
Page 24
selected using Peptide Selector in
Spectrum Mill and 13C, 15N labeled
peptides were synthesized
1 mg of soluble protein extract was
reduced, alkylated, acetone
precipitated and trypsin digested
The liver digest were spiked with the isotope-labeled peptides
and analyzed by Agilent 6410 QQQ system

Using Spectrum Mill Peptide Selector for Optimising MRM Transitions
Chemically reactive residues
(Cys = C, Met = M, Trp = W)
Peptides adjacent to multiple cleavage site
Chemically unstable residues (Asp-Gly
Page 25
Chemically unstable residues (Asp-Gly = D-G; Asn-Gly = N-G; N-term Glu = E; N-term Asn = N)
Eliminate “LC-incompatible” peptides
Uniqueness

Spectrum Mill – Peptide Selector
Page 26

Peptide Selector – Catalase Results
Page 27

Catalase Peptide LAQ – Peptide Selector
Page 28

Catalase Peptide EAE – Peptide Selector
Page 29

External Calibration on Catalase PeptidesLinearity : five order of magnitude
External quantitation curve of catalase peptide L*AQEDPDYGLR from 78 amol to 7800 fmol
78aMol
78fMol
780 fMol
0.9965
Page 30
RSD < 6%

Catalase Quantitation Results
Page 31

Quantitation of protein phosphorylation using
MRM
Erk1 protein was quantified
from depleted human serum.
+3 PO4
Peptide MRMLorne
Page 32
Erk1
intact
protein+2 PO4
+3 PO4
+4 PO4

Selection of MRM transitions
TY: IADPEHDHTGFLTEYVATR
y5
b14
t202: IADPEHDHTGFLTEYVATR
y16
y5
P
Precursor ion Product ions
TY
545.3 615.3 782.5
[M+3H] 3+ y5 b142+
t202
753.3 615.3 979.9
Page 33
t202y204:
P
IADPEHDHTGFLTEYVATR
y16
y5
P
y204: IADPEHDHTGFLTEYVATR
y16
y5
P
y5 t202
[M+2H] 2+ y5 y162+
y204
753.3 979.9 695.3
[M+2H] 2+ y162+ y5
t202y204
780.0 647.6 695.3
[M+2H] 2+ y163+-H3PO4 y5

Chromatographic Separation of the Four Peptide Standards allowed the selection of the same Q1 and Q3 transitions for two different peptides
4x10
3.5
4
4.5
5
5.5
6
+ MRM (545.29999 -> 615.29688) mix500f-r001.d
TY
t202t202y204
Page 34
0
0.5
1
1.5
2
2.5
3
Counts vs. Acquisition Time (min)
9.5 10 10.5 11 11.5 12 12.5 13 13.5 14 14.5 15 15.5 16 16.5 17 17.5 18 18.5 19 19.5
y204

Y434y13 - 5 Levels, 5 Levels Used, 15 Points, 15 Points Used, 0 QCs
T432tY434y13 - 5 Levels, 5 Levels Used, 15 Points, 15 Points Used, 0 QCs
Concentration (fmol/ul)
-25 0 25 50 75 100 125 150 175 200 225 250 275 300 325 350 375 400 425 450 475 500 525
Relative Responses 1x10
-0.2
0
0.2
0.4
0.6
0.8
1
1.2
1.4
1.6
1.8
2
2.2
2.4
2.6
2.8
3
3.2
3.4
3.6
3.8
4y = 0.0764 * x + 0.2516R^2 = 0.99673108
t202y204
R2 =0.9967Relative Responses
TY13 - 5 Levels, 5 Levels Used, 15 Points, 15 Points Used, 0 QCs
Concentration (fmol/ul)
-25 0 25 50 75 100 125 150 175 200 225 250 275 300 325 350 375 400 425 450 475 500 525
Relative Responses 2x10
-0.1
0
0.1
0.2
0.3
0.4
0.5
0.6
0.7
0.8
0.9
1
1.1
1.2
1.3
1.4
1.5
1.6
1.7
1.8
1.9
y = 0.3630 * x + 0.0337R^2 = 0.99816859
TY
R2 =0.9981Relative Responses
T432t13 - 5 Levels, 5 Levels Used, 15 Points, 15 Points Used, 0 QCs
0.5fm
2.5fm
5fm
0.5fm2.5fm
5fm
Page 35
Y434y13 - 5 Levels, 5 Levels Used, 15 Points, 15 Points Used, 0 QCs
Concentration (fmol/ul)
-25 0 25 50 75 100 125 150 175 200 225 250 275 300 325 350 375 400 425 450 475 500 525
Relative Responses 2x10
-0.1
0
0.1
0.2
0.3
0.4
0.5
0.6
0.7
0.8
0.9
1
1.1
1.2
1.3
1.4
1.5
1.6
1.7
1.8
y = 0.3447 * x + 0.1682R^2 = 0.99564716
y204
R2 =0.9956
Relative Responses
T432t13 - 5 Levels, 5 Levels Used, 15 Points, 15 Points Used, 0 QCs
Concentration (fmol/ul)
-25 0 25 50 75 100 125 150 175 200 225 250 275 300 325 350 375 400 425 450 475 500 525
Relative Responses 1x10
-0.5
0
0.5
1
1.5
2
2.5
3
3.5
4
4.5
5
5.5
y = 0.1069 * x + 0.2840R^2 = 0.99593214
t202
R2 =0.9959
Relative Responses
0.5f
m
2.5f
m
5f
m
0.5fm
2.5fm
5fm

Quantitation of the degree of phosphorylation at T202 and Y204 in active Erk1 protein
peptide% Molar
ratioRSD (n=9)
TY 20% 0.13
t202 25% 0.15
Page 36
y204 21% 0.12
t202y204 34% 0.08
In this batch of active Erk1 sample, 59% of T202
and 55% of Y204 were phosphorylated

Peroxidase in Human PlasmaFrom Discovery Mode to Validation Step
Page 37

Step-2
Spectrum Mill • Import the MRM list
Step
Mass Prof
Biomarker validation workflow
Discovery phase to Validation : MRM Selector
Page 38
• Run samples on Q-TOF for protein ID in data-dependent MS/MS mode.
Step-1
Q-TOF
• Search QTOF data using Spectrum Mill
• Use Spectrum Mill MRM Selector to create a list of MRM transitions with RT
Spectrum Mill • Import the MRM list into QQQ Acquisition software
• Run samples on QQQ in Dynamic MRM mode
Step-3
QQQ
• Integrate the MRM chromatograms
• Import quantitation results into MPP to perform statistical analysis
Mass Prof

Depleted Human Plasma Sample analysis
Replicate LC/MS runs
HPLC – Chip / QTOFSpiked with 0,0.5 and 5fmol
per 0.5ug plasma
Page 39
Data Dependent
Protein IDs from
Spectrum Mill

MRM SelectorGenerates MRM method from discovery QTOF data
Page 40

Dynamic MRM
Page 41

Dynamic MRMOverlaid 2000 MRM chromatograms acquired in a single run using Dynamic MRM
Page 42

Sensitivity : Peroxidase in plasma matrix (per 0.5ug)
M A B
matrix 5fmol 500amole
Page 43
# MRM
RT window
(min)
Cycle time (ms)
Min. dwell (ms)
Max. # concurrent
MRM
%RSDArea
RSDRT
(min)
443 2 1000 16.5 50 2.5 0.038
443 1 1000 29.83 30 3.2 0.016
2000 2 1000 2.75 160 4.5 0.030
3293 1 1050 2.18 185 4.7 0.025
Reproducibility
of MS response
and RT

Mass Profiler ProfessionalStatistical Processing of MRM Data
Four peptides from
peroxidase were
highlighted in green.
The mean of 443 MRM
abundances is
displayed (black) to
show the peptides from
Page 44
All Samples
B1 B2 B3 A1 A2 A3 M1 M2
show the peptides from
plasma did not vary
from sample to sample.

Principle Component AnalysisMatrix and 2 different peroxidase levels
Samples at
Page 45
Samples at
different
peroxidase
concentrations
were correctly
grouped
together.

Hierarchical Clusteringcomparing different peroxidase concns.
A condition was generated
with peroxidase
concentration color-coded
on the tree branches, along
with the peptide features
labeled on each row. The
Page 46
M1 M2 A1 A2 A3 B1 B2 B3
labeled on each row. The
heat map is colored from
blue to red, where blue is
low abundance and red is
high abundance. The full
view of all the features is on
the left. The zoom view is
on the right.