Embed Size (px)
Citation preview

FROM CAUSE TO IMPACT: MODELLING DETERMINANTS AND EFFECTS OF OBESITY May 2, 2017 Sahara Graf Andrea Feigl OECD FCAN meeting

Obesity rates will continue to rise
0%
5%
10%
15%
20%
25%
30%
35%
40%
45%
50%
1970 1980 1990 2000 2010 2020 2030
Ra
te o
f o
be
sit
y
Year
USA
Canada
Italy
Obesity will continue to rise in the OECD, with especially strong rates of increase in the US, England, Canada and Switzerland
Switzerland
Spain
Korea
Mexico
England
Note: Obesity defined as BMI≥30kg/m². OECD projections assume that BMI will continue to rise as a linear function of time. Source: OECD analysis of national health survey data.
Obesity projections in the OECD
France

Source: Department of Health (UK). Tackling obesities: future choices (2007)

- The causal chains leading to obesity are complex and interlinked - Complex problems warrant complex solutions and analysis

Inequalities of fruit and vegetable
consumption are significant in most countries
0
0.2
0.4
0.6
0.8
1
1.2
1.4
1.6
1.8
2
Australia Canada Chile England France Hungary Italy Korea Mexico Spain USA
Re
lati
ve
in
de
x o
f in
eq
ua
lity
Men Women
Notes: Data refer to ages 18-64 except in Canada (15-64). Upper confidence interval truncated for Korea (2.2) Source: OECD analysis of health survey data.
Relative index of inequality by level of education
• Prevalence of low consumption is higher in those with a lower level of education
• Australia: prevalence is nearly 40% higher in women with a low level of education
• Inequalities are higher for women than for men overall
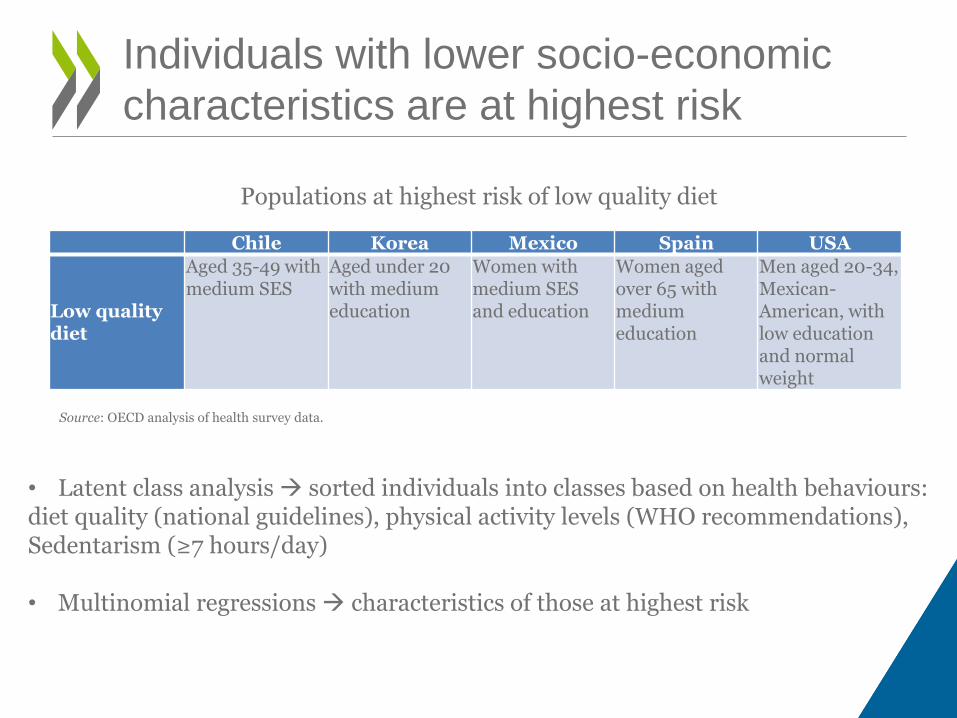
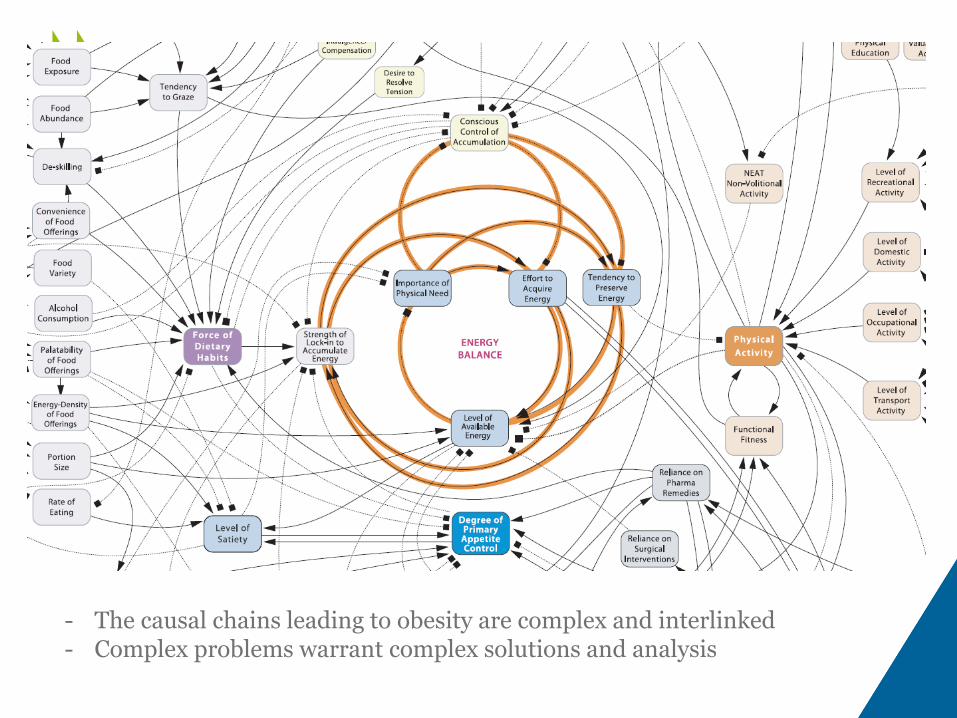
Individuals with lower socio-economic
characteristics are at highest risk
Populations at highest risk of low quality diet
Source: OECD analysis of health survey data.
Chile Korea Mexico Spain USA
Low quality diet
Aged 35-49 with medium SES
Aged under 20 with medium education
Women with medium SES and education
Women aged over 65 with medium education
Men aged 20-34, Mexican-American, with low education and normal weight
• Latent class analysis sorted individuals into classes based on health behaviours: diet quality (national guidelines), physical activity levels (WHO recommendations), Sedentarism (≥7 hours/day) • Multinomial regressions characteristics of those at highest risk

Modelling Scenarios and Policies
Price policies
Regulation/ enforcement
Education Healthcare
Diet, Physical activity, Obesity
Self-regul. advertisement
Mass media campaigns
Physician counselling
Compulsory food labelling
Physic/diet counselling
Either Risk (PA, Diet, Alcohol)
Fiscal measures to change price
(tax/subsid)
Regulation advertisement
School-based programmes
Worksite interventions
Alcohol consumption
Minimum pricing
Drink drive enforcement
Brief Intervention
Limit opening hours
Drug / psychos therapy
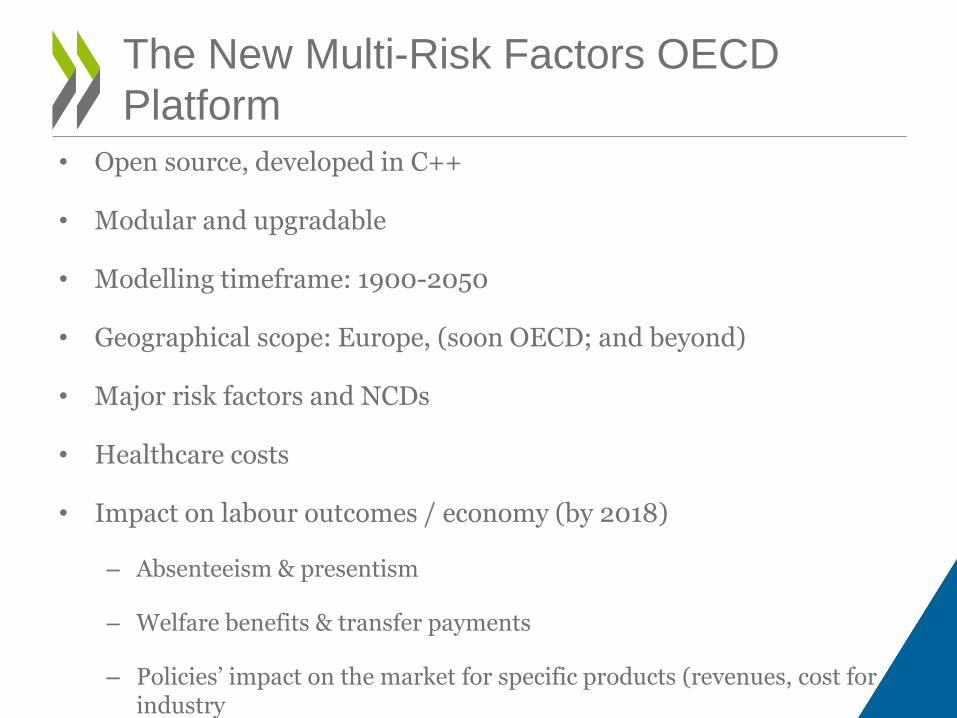
The New Multi-Risk Factors OECD
Platform
• Open source, developed in C++
• Modular and upgradable
• Modelling timeframe: 1900-2050
• Geographical scope: Europe, (soon OECD; and beyond)
• Major risk factors and NCDs
• Healthcare costs
• Impact on labour outcomes / economy (by 2018)
– Absenteeism & presentism
– Welfare benefits & transfer payments
– Policies’ impact on the market for specific products (revenues, cost for industry
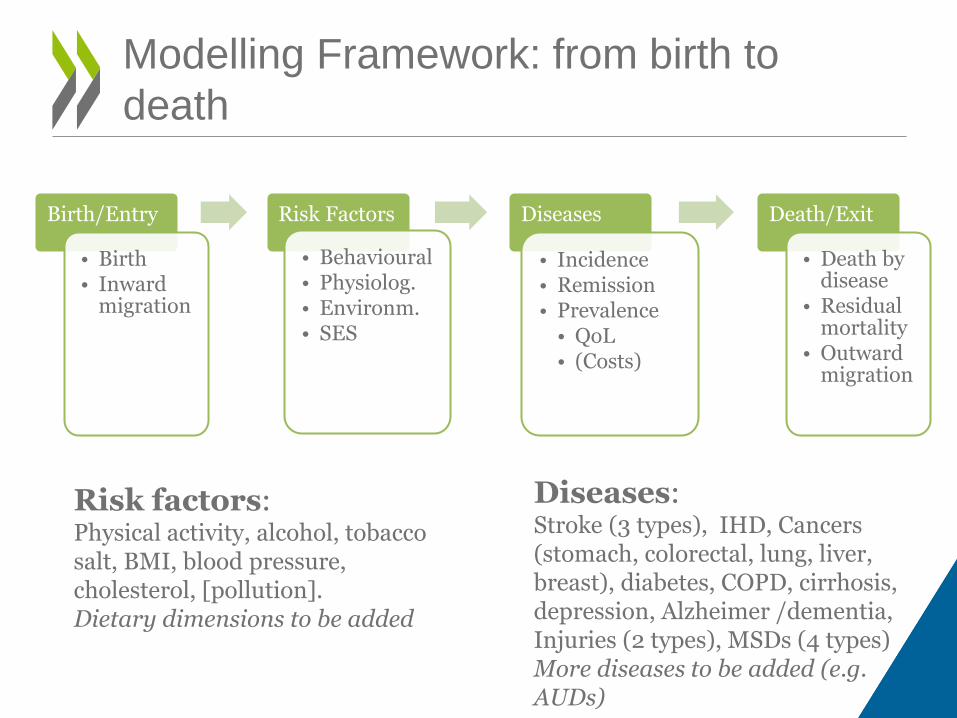
Modelling Framework: from birth to
death
Birth/Entry
• Birth • Inward
migration
Risk Factors
• Behavioural • Physiolog. • Environm. • SES
Diseases
• Incidence • Remission • Prevalence
• QoL • (Costs)
Death/Exit
• Death by disease
• Residual mortality
• Outward migration
Risk factors: Physical activity, alcohol, tobacco salt, BMI, blood pressure, cholesterol, [pollution]. Dietary dimensions to be added
Diseases: Stroke (3 types), IHD, Cancers (stomach, colorectal, lung, liver, breast), diabetes, COPD, cirrhosis, depression, Alzheimer /dementia, Injuries (2 types), MSDs (4 types) More diseases to be added (e.g. AUDs)

Considerations for food reformulation:
labelling and content
BMI reduction:
- Food reformulation
- Salt reduction
- Portion size changes
- Nutrition labeling
- Vending machine content replacement
- Product diversification (i.e. diet sodas,
flavored waters)
- Added Sugar reduction
Weaker evidence on: - Revenue impact for higher alcohol taxes
11

• Adding to the knowledge – information for OECD countries
• How consumers react – behavioural economics
• Bridging the gap with the private sector
Next steps/ collaboration

Additional Slides

0
20
40
60
80
100
120
140
160
180
Hea
lth
ou
tco
mes
Age group
life years(thousands)
DALYs(thousands)
-800
-700
-600
-500
-400
-300
-200
-100
0
100
200
costs(million$PPP)
SSB taxation impact in South Africa
Health impact Impact on health expenditure
Source: OECD analysis, forthcoming

• The interventions applies the SSB tax as designed by the South African National Treasury, an increase of R2.21 per litre or R0.0221 per gram of sugar on a litre over 4g/100ml, equivalent to a 12% effective tax rate at current prices and sugar content of soft drinks and concentrates (National Treasury, 2017). The tax is assumed to pass through to customers as in the baseline scenario of Manyema et al (2014). It is also assumed that the SSB industry does not put in place any intervention to reformulate SSBs. Reformulation by the industry would lead to smaller consumption changes but greater mean BMI changes.
• The own-price elasticity for SSB consumption is -0.77 meaning the 12% effective tax rate reduces SSB consumption by approximately 9%. It is assumed that a tax increase translates almost immediately into an increase in the price of SSBs. The price increase on SSBs increases fruit juice consumption by 6% (cross-price elasticity = 0.53) and diet drink consumption by 5% (cross-price elasticity = 0.44) (National Treasury, 2017).

Effectiveness of various nutrition interventions

The Economic Impact of Tackling Obesity:
Effectiveness and Cost-Effectiveness
0 10 20 30 40
Effect of food labels in selecting and healthier option
GDA
Traffic light
Other food labels
Increase (%) in people selecting a healthier option
Overall
Source: Cecchini & Warin, Ob Rev 2015