Embed Size (px)
Citation preview
1
FROM DATA MINING TO
KNOWLEDGE MINING:
SYMBOLIC DATA ANALYSIS
AND THE SODAS SOFTWARE
E. Diday
University of Paris IX Dauphine
and INRIA
AIM
FROM HUDGE DATA IN AN ECONOMIC WAY
-Extract new knowledge
-Summarize
-Concatenate
-Solve confidentiality
-Explain correlation
HOW? By working on HIGHER LEVEL UNITS as
“classes”, “categories” or ”concepts“ necessary described by
more complex data extending Data Mining to Knowledge
Mining.
2
OUTLINE
1) THE MAIN IDEA:
FIRST AND SECOND ORDER OBJECTS.
2)THE INPUT OF A SYMBOLIC DATA ANALYSIS:
SYMBOLIC DATA TABLE.
3) MAIN SOURCES OF SYMBOLIC DATA: FROM
DATA BASES, FROM CATEGORICAL VARIABLES.
4) MAIN OUTPUT OF SYMBOLIC DATA ANALYSIS
ALGORITHMS: SYMBOLIC DESCRIPTIONS AND
SYMBOLIC OBJECTS.
5) THE MAIN STEPS OF A SDA.
6) SOME TOOLS OF SYMBOLIC DATA ANALYSIS
7) SYNTHETICAL VIEW OF THE SODAS SOFTWARE
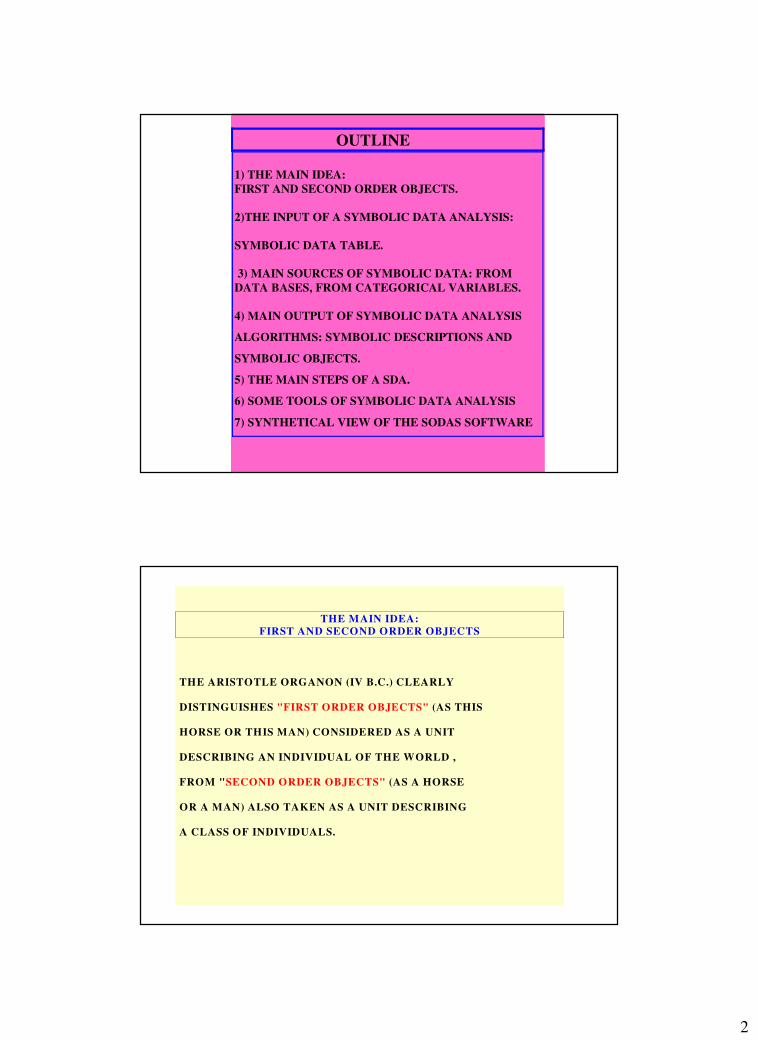
THE MAIN IDEA:
FIRST AND SECOND ORDER OBJECTS
THE ARISTOTLE ORGANON (IV B.C.) CLEARLY
DISTINGUISHES "FIRST ORDER OBJECTS" (AS THIS
HORSE OR THIS MAN) CONSIDERED AS A UNIT
DESCRIBING AN INDIVIDUAL OF THE WORLD ,
FROM "SECOND ORDER OBJECTS" (AS A HORSE
OR A MAN) ALSO TAKEN AS A UNIT DESCRIBING
A CLASS OF INDIVIDUALS.
3
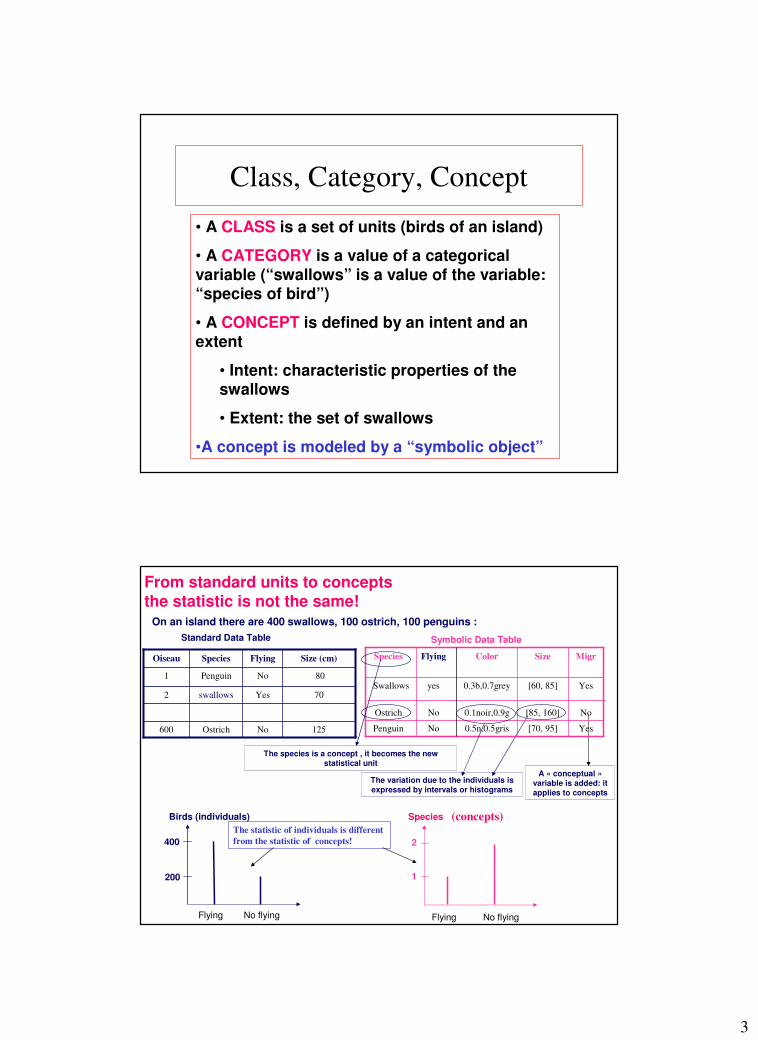
Class, Category, Concept
• A CLASS is a set of units (birds of an island)
• A CATEGORY is a value of a categorical variable (“swallows” is a value of the variable: “species of bird”)
• A CONCEPT is defined by an intent and an extent
• Intent: characteristic properties of the swallows
• Extent: the set of swallows
•A concept is modeled by a “symbolic object”
From standard units to concepts the statistic is not the same!
On an island there are 400 swallows, 100 ostrich, 100 penguins :
Standard Data Table Symbolic Data Table
A « conceptual »variable is added: itapplies to concepts
125NoOstrich600
swallows
Penguin
Species
70Yes2
80No1
Size (cm)FlyingOiseau
0.5n,0.5gris
0.1noir,0.9g
0.3b,0.7grey
Color
Yes
No
Yes
MigrSizeFlyingSpecies
[70, 95]NoPenguin
[85, 160]NoOstrich
[60, 85]yesSwallows
The variation due to the individuals isexpressed by intervals or histograms
Birds (individuals)
Flying No flying
1
2
Species
Flying No flying
400
200
The species is a concept , it becomes the new statistical unit
The statistic of individuals is different
from the statistic of concepts!
(concepts)
4
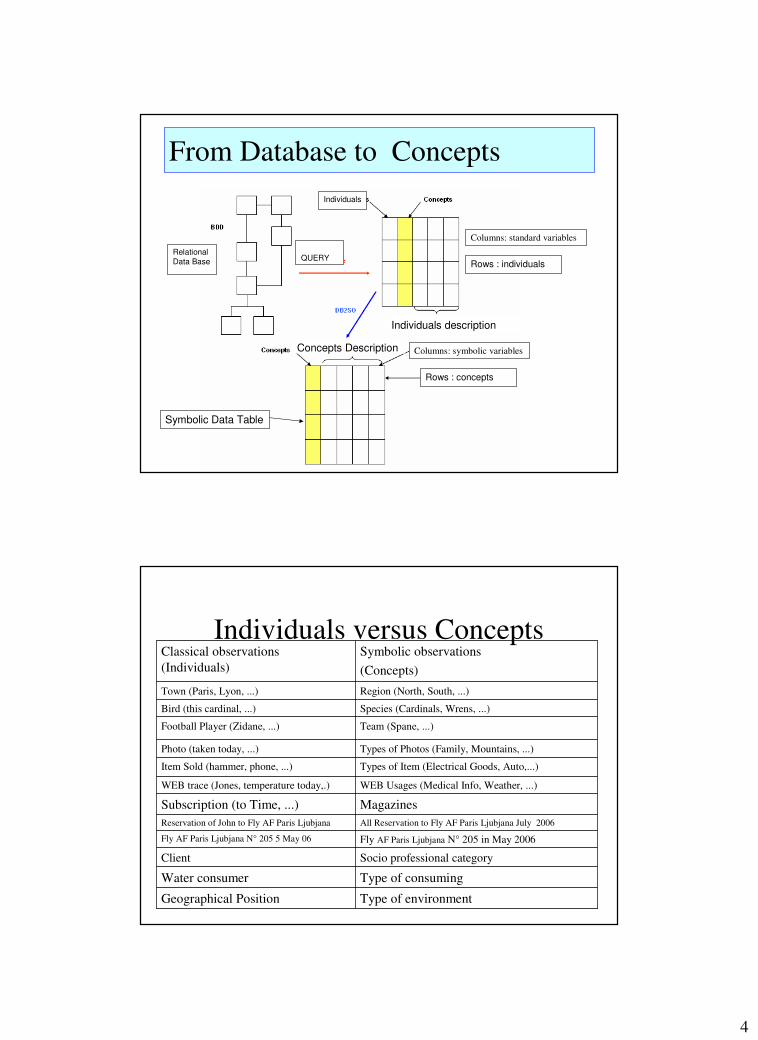
From Database to Concepts
QUERY
Rows : concepts
Relational
Data Base
Individuals
Concepts Description
Symbolic Data Table
Individuals description
Columns: symbolic variables
Columns: standard variables
Rows : individuals
Individuals versus Concepts
Type of environmentGeographical Position
Type of consumingWater consumer
Socio professional categoryClient
Fly AF Paris Ljubjana N° 205 in May 2006Fly AF Paris Ljubjana N° 205 5 May 06
All Reservation to Fly AF Paris Ljubjana July 2006Reservation of John to Fly AF Paris Ljubjana
MagazinesSubscription (to Time, ...)
WEB Usages (Medical Info, Weather, ...)WEB trace (Jones, temperature today,.)
Types of Item (Electrical Goods, Auto,...)Item Sold (hammer, phone, ...)
Types of Photos (Family, Mountains, ...)Photo (taken today, ...)
Team (Spane, ...)Football Player (Zidane, ...)
Species (Cardinals, Wrens, ...)Bird (this cardinal, ...)
Region (North, South, ...)Town (Paris, Lyon, ...)
Symbolic observations
(Concepts)
Classical observations
(Individuals)
5
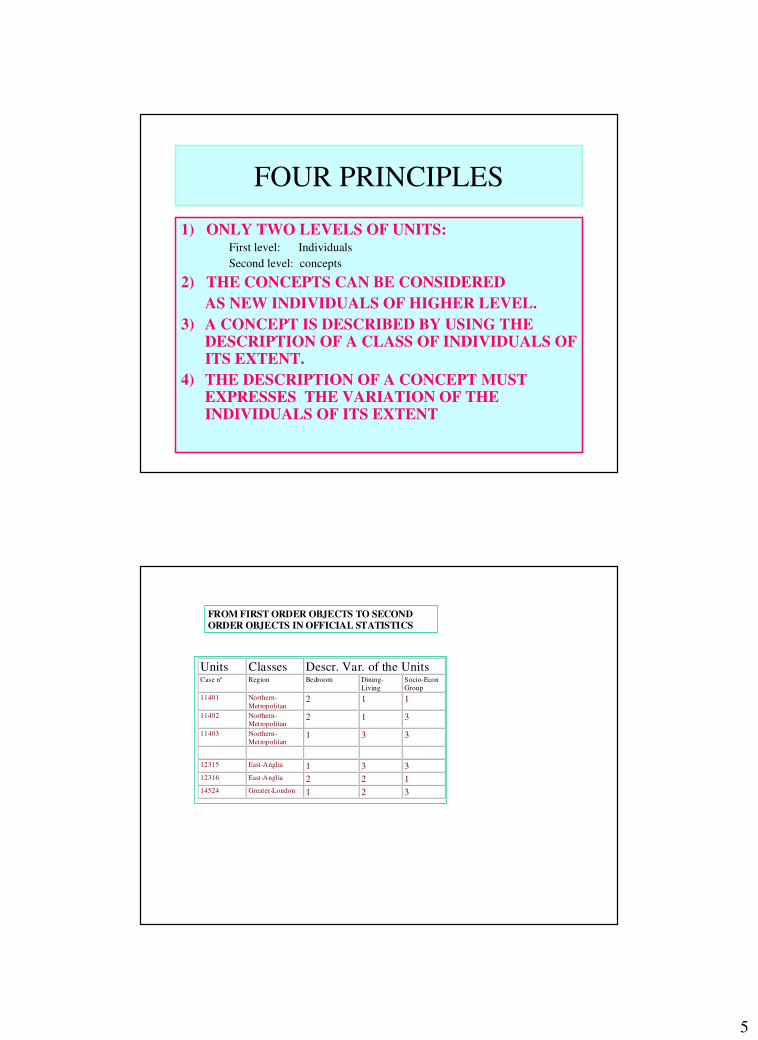
FOUR PRINCIPLES
1) ONLY TWO LEVELS OF UNITS:First level: Individuals
Second level: concepts
2) THE CONCEPTS CAN BE CONSIDERED
AS NEW INDIVIDUALS OF HIGHER LEVEL.
3) A CONCEPT IS DESCRIBED BY USING THE DESCRIPTION OF A CLASS OF INDIVIDUALS OF ITS EXTENT.
4) THE DESCRIPTION OF A CONCEPT MUST EXPRESSES THE VARIATION OF THE INDIVIDUALS OF ITS EXTENT
Units Classes Descr. Var. of the UnitsCase n° Region Bedroom Dining-
Living
Socio-Econ
Group
11401 Northern-
Metropolitan2 1 1
11402 Northern-
Metropolitan2 1 3
11403 Northern-
Metropolitan1 3 3
12315 East-Anglia 1 3 3
12316 East-Anglia 2 2 1
14524 Greater-London 1 2 3
FROM FIRST ORDER OBJECTS TO SECONDORDER OBJECTS IN OFFICIAL STATISTICS
6
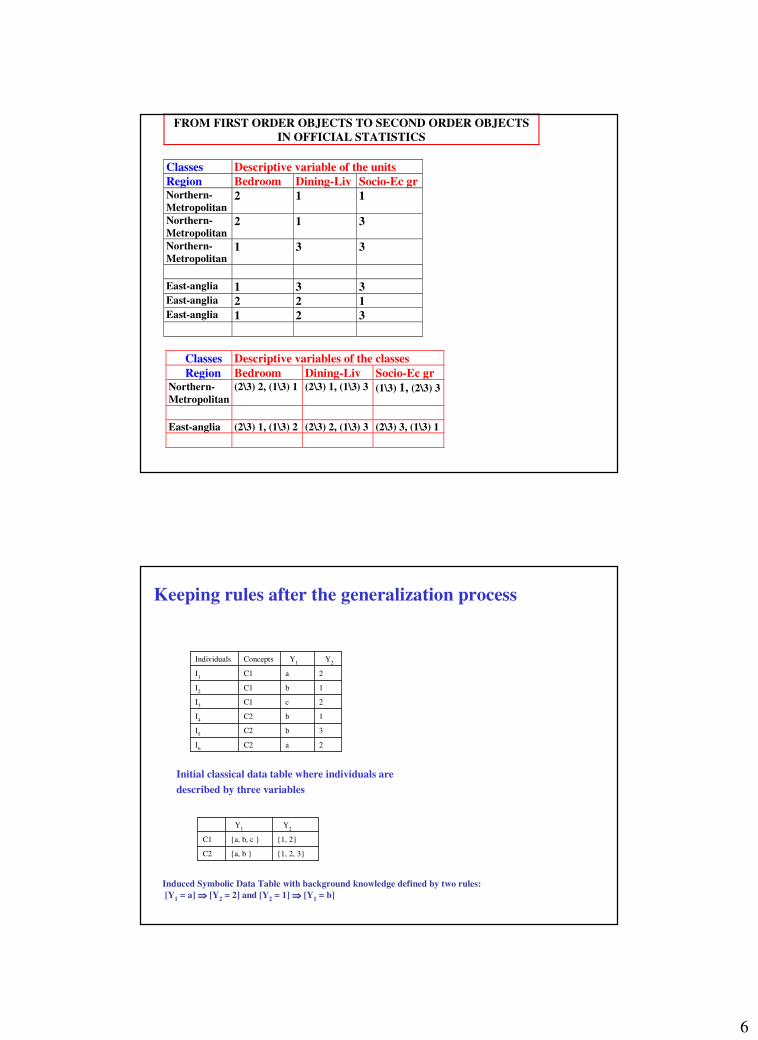
FROM FIRST ORDER OBJECTS TO SECOND ORDER OBJECTS
IN OFFICIAL STATISTICS
Classes Descriptive variable of the units
Region Bedroom Dining-Liv Socio-Ec grNorthern-
Metropolitan2 1 1
Northern-
Metropolitan2 1 3
Northern-
Metropolitan1 3 3
East-anglia 1 3 3East-anglia 2 2 1East-anglia 1 2 3
Classes Descriptive variables of the classes
Region Bedroom Dining-Liv Socio-Ec grNorthern-
Metropolitan
(2\3) 2, (1\3) 1 (2\3) 1, (1\3) 3 (1\3) 1, (2\3) 3
East-anglia (2\3) 1, (1\3) 2 (2\3) 2, (1\3) 3 (2\3) 3, (1\3) 1
2aC2I6
3bC2I5
1bC2I4
2cC1I3
1bC1I2
2aC1I1
Y2
Y1
ConceptsIndividuals
Initial classical data table where individuals are
described by three variables
Keeping rules after the generalization process
1, 2, 3a, b C2
1, 2a, b, c C1
Y2
Y1
Induced Symbolic Data Table with background knowledge defined by two rules:
[Y1 = a] ⇒⇒⇒⇒ [Y2 = 2] and [Y2 = 1] ⇒⇒⇒⇒ [Y1 = b]
7
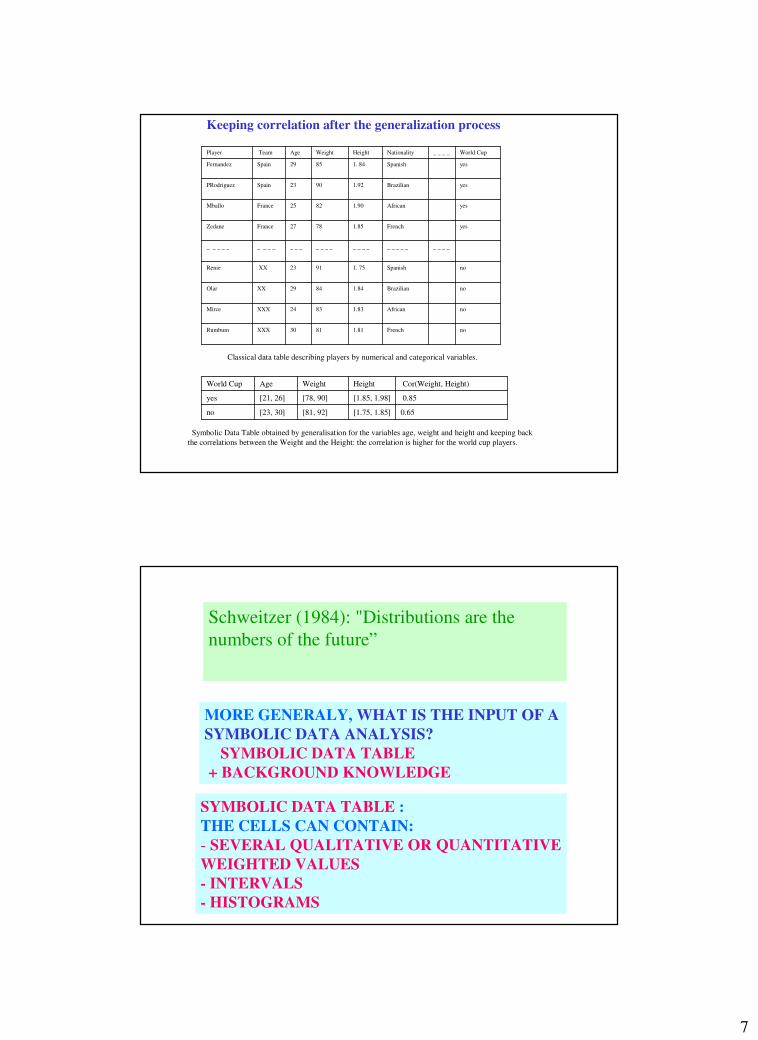
noFrench1.818130XXXRumbum
noAfrican1.838324XXXMirce
noBrazilian1.848429XXOlar
noSpanish1. 759123XXRenie
_ _ _ _ _ _ _ _ _ _ _ _ _ _ _ _ _ _ _ _ _ _ _ _ _ _ _ _ _
yesFrench1.857827FranceZedane
yesAfrican1.908225FranceMballo
yesBrazilian1.929023SpainPRodriguez
yesSpanish1. 848529SpainFernandez
World Cup_ _ _ _ NationalityHeightWeightAgeTeam Player
Classical data table describing players by numerical and categorical variables.
0.65[1.75, 1.85][81, 92][23, 30]no
0.85[1.85, 1.98][78, 90][21, 26]yes
Cor(Weight, Height) HeightWeightAgeWorld Cup
Symbolic Data Table obtained by generalisation for the variables age, weight and height and keeping back
the correlations between the Weight and the Height: the correlation is higher for the world cup players.
Keeping correlation after the generalization process
MORE GENERALY, WHAT IS THE INPUT OF A
SYMBOLIC DATA ANALYSIS?
SYMBOLIC DATA TABLE
+ BACKGROUND KNOWLEDGE
Schweitzer (1984): "Distributions are the
numbers of the future”
SYMBOLIC DATA TABLE :
THE CELLS CAN CONTAIN:
- SEVERAL QUALITATIVE OR QUANTITATIVE
WEIGHTED VALUES
- INTERVALS
- HISTOGRAMS
8
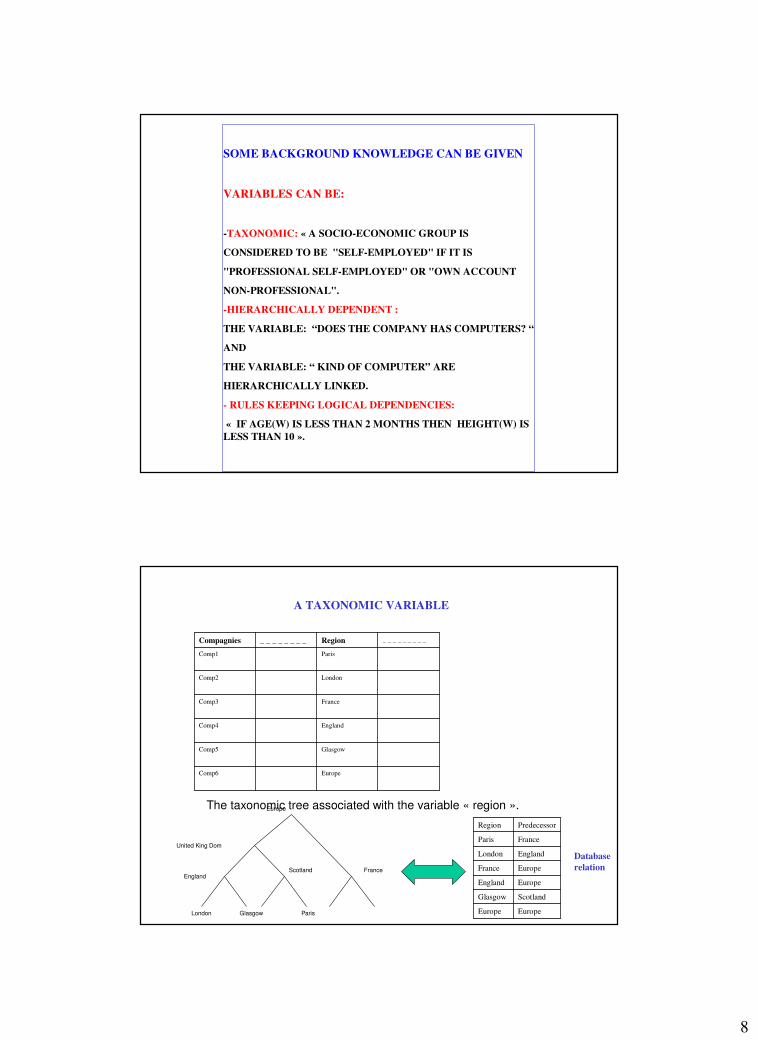
SOME BACKGROUND KNOWLEDGE CAN BE GIVEN
VARIABLES CAN BE:
-TAXONOMIC: « A SOCIO-ECONOMIC GROUP IS
CONSIDERED TO BE "SELF-EMPLOYED" IF IT IS
"PROFESSIONAL SELF-EMPLOYED" OR "OWN ACCOUNT
NON-PROFESSIONAL".
-HIERARCHICALLY DEPENDENT :
THE VARIABLE: “DOES THE COMPANY HAS COMPUTERS? “
AND
THE VARIABLE: “ KIND OF COMPUTER” ARE
HIERARCHICALLY LINKED.
- RULES KEEPING LOGICAL DEPENDENCIES:
« IF AGE(W) IS LESS THAN 2 MONTHS THEN HEIGHT(W) IS
LESS THAN 10 ».
EuropeComp6
Glasgow Comp5
EnglandComp4
FranceComp3
LondonComp2
Paris Comp1
_ _ _ _ _ _ _ _ _Region_ _ _ _ _ _ _ _Compagnies
A TAXONOMIC VARIABLE
Europe
United King Dom
EnglandScotland France
London Glasgow Paris
The taxonomic tree associated with the variable « region ».
EuropeEurope
ScotlandGlasgow
EuropeEngland
EuropeFrance
EnglandLondon
FranceParis
PredecessorRegion
Database
relation
9
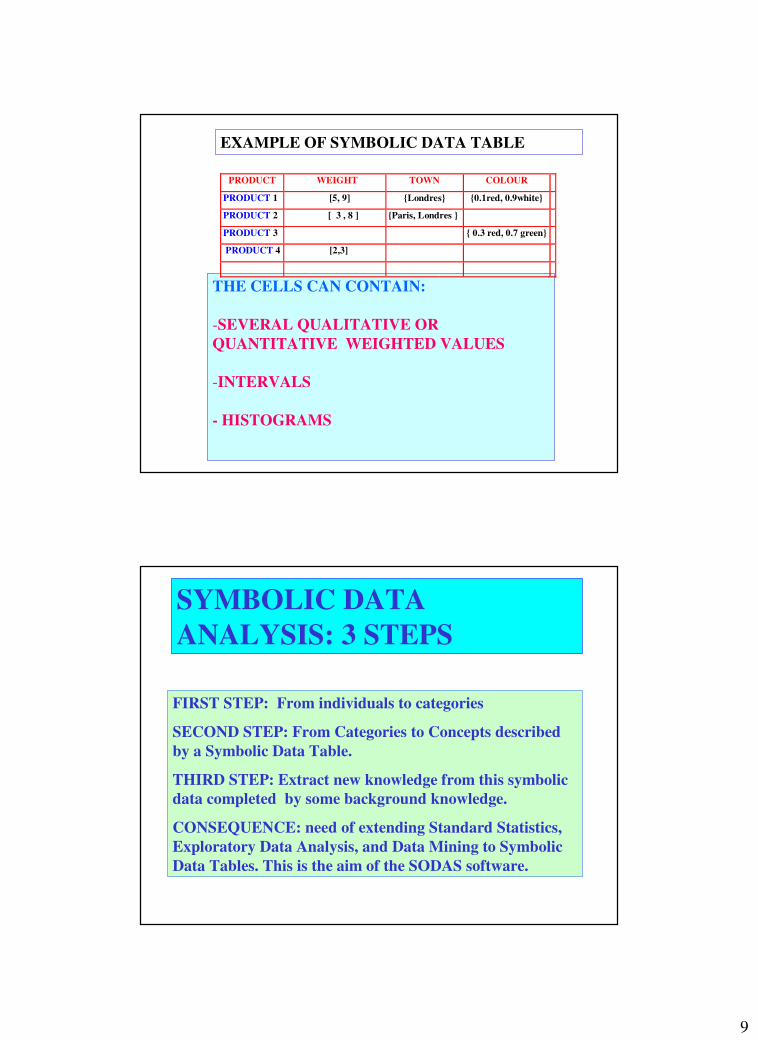
EXAMPLE OF SYMBOLIC DATA TABLE
THE CELLS CAN CONTAIN:
-SEVERAL QUALITATIVE OR
QUANTITATIVE WEIGHTED VALUES
-INTERVALS
- HISTOGRAMS
PRODUCT WEIGHT TOWN COLOUR
PRODUCT 1 [5, 9] Londres 0.1red, 0.9white
PRODUCT 2 [ 3 , 8 ] Paris, Londres
PRODUCT 3 0.3 red, 0.7 green
PRODUCT 4 [2,3]
SYMBOLIC DATA
ANALYSIS: 3 STEPS
FIRST STEP: From individuals to categories
SECOND STEP: From Categories to Concepts described
by a Symbolic Data Table.
THIRD STEP: Extract new knowledge from this symbolic
data completed by some background knowledge.
CONSEQUENCE: need of extending Standard Statistics,
Exploratory Data Analysis, and Data Mining to Symbolic
Data Tables. This is the aim of the SODAS software.
10
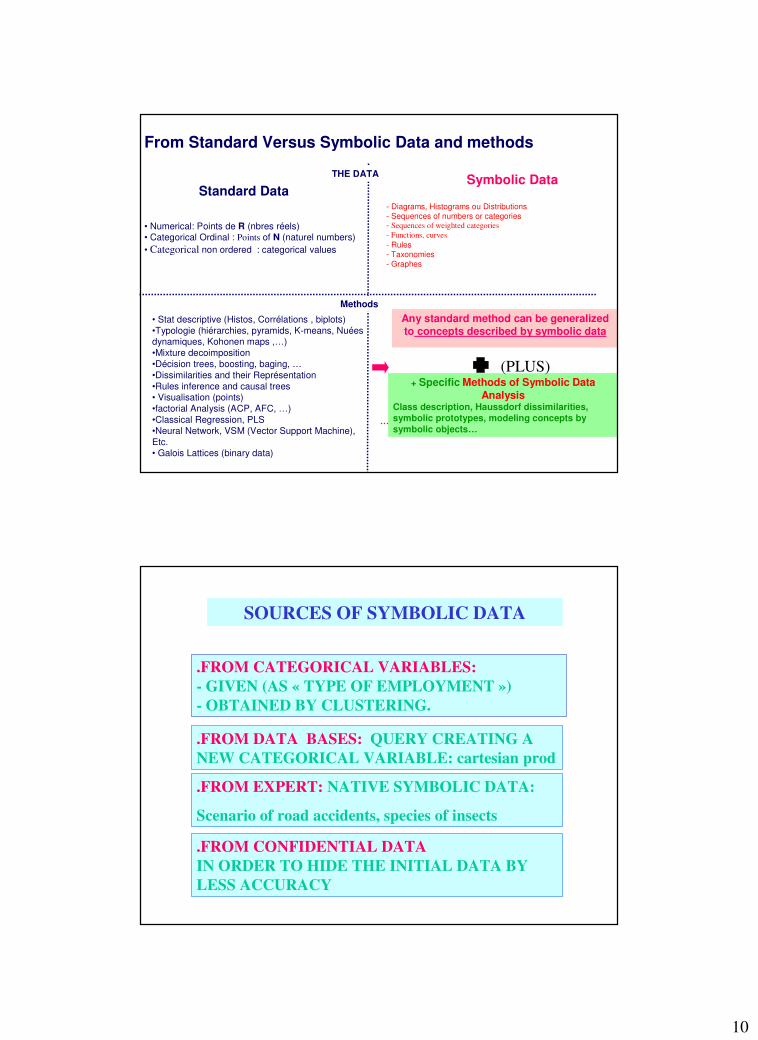
From Standard Versus Symbolic Data and methods
Standard DataSymbolic Data
THE DATA
• Numerical: Points de R (nbres réels) • Categorical Ordinal : Points of N (naturel numbers)
• Categorical non ordered : categorical values
- Diagrams, Histograms ou Distributions
- Sequences of numbers or categories- Sequences of weighted categories
- Functions, curves
- Rules
- Taxonomies
- Graphes
Methods
• Stat descriptive (Histos, Corrélations , biplots)
•Typologie (hiérarchies, pyramids, K-means, Nuées dynamiques, Kohonen maps ,…)
•Mixture decoimposition
•Décision trees, boosting, baging, …
•Dissimilarities and their Représentation
•Rules inference and causal trees• Visualisation (points)
•factorial Analysis (ACP, AFC, …)
•Classical Regression, PLS
•Neural Network, VSM (Vector Support Machine),
Etc. • Galois Lattices (binary data)
Any standard method can be generalizedto concepts described by symbolic data
+ Specific Methods of Symbolic Data
AnalysisClass description, Haussdorf dissimilarities,
symbolic prototypes, modeling concepts by
symbolic objects…
(PLUS)
SOURCES OF SYMBOLIC DATA
.FROM DATA BASES: QUERY CREATING A
NEW CATEGORICAL VARIABLE: cartesian prod
.FROM CATEGORICAL VARIABLES:
- GIVEN (AS « TYPE OF EMPLOYMENT »)
- OBTAINED BY CLUSTERING.
.FROM EXPERT: NATIVE SYMBOLIC DATA:
Scenario of road accidents, species of insects
.FROM CONFIDENTIAL DATA
IN ORDER TO HIDE THE INITIAL DATA BY
LESS ACCURACY
11
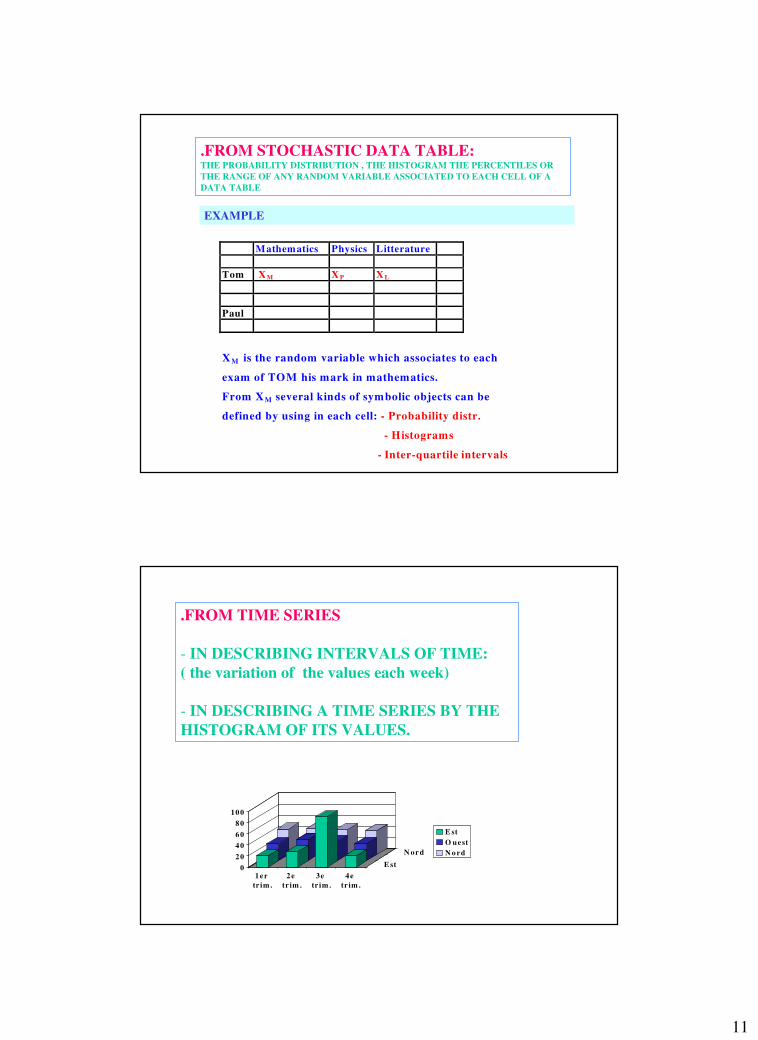
.FROM STOCHASTIC DATA TABLE:THE PROBABILITY DISTRIBUTION , THE HISTOGRAM THE PERCENTILES OR
THE RANGE OF ANY RANDOM VARIABLE ASSOCIATED TO EACH CELL OF A
DATA TABLE
Mathematics Physics Litterature
Tom XM X P X L
Paul
XM is the random variable which associates to each
exam of TOM his mark in mathematics.
From XM several kinds of symbolic objects can be
defined by using in each cell: - Probability distr.
- Histograms
- Inter-quartile intervals
EXAMPLE
.FROM TIME SERIES
- IN DESCRIBING INTERVALS OF TIME:
( the variation of the values each week)
- IN DESCRIBING A TIME SERIES BY THE
HISTOGRAM OF ITS VALUES.
0
2 0
4 0
6 0
8 0
10 0
1 er
tr im .
2 e
tr im .
3e
tr im .
4 e
tr im .
E st
N or d
E st
O uest
N o rd
12
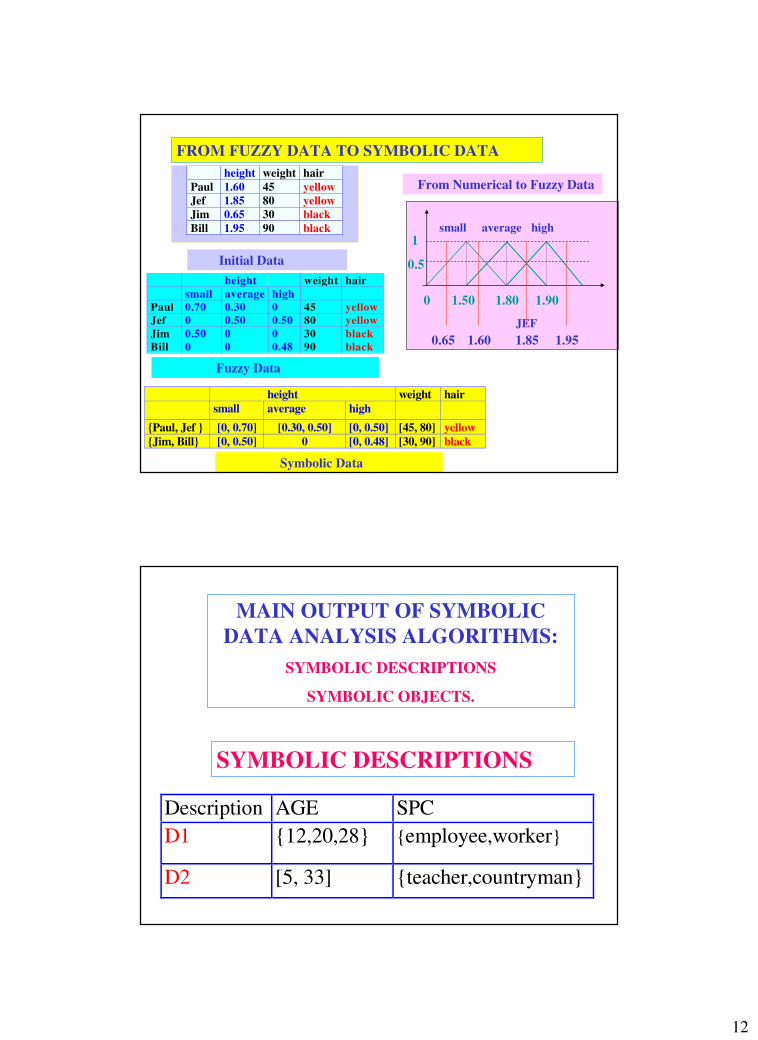
FROM FUZZY DATA TO SYMBOLIC DATA
height weight hair
Paul 1.60 45 yellow
Jef 1.85 80 yellow
Jim 0.65 30 black
Bill 1.95 90 black
height weight hair
small average high
Paul 0.70 0.30 0 45 yellow
Jef 0 0.50 0.50 80 yellow
Jim 0.50 0 0 30 black
Bill 0 0 0.48 90 black
height weight hair
small average high
Paul, Jef [0, 0.70] [0.30, 0.50] [0, 0.50] [45, 80] yellow
Jim, Bill [0, 0.50] 0 [0, 0.48] [30, 90] black
Symbolic Data
Fuzzy Data
0.5
small average high1
1.500 1.80 1.90
0.65 1.60 1.85 1.95
From Numerical to Fuzzy Data
Initial Data
JEF
MAIN OUTPUT OF SYMBOLIC
DATA ANALYSIS ALGORITHMS:
SYMBOLIC DESCRIPTIONS
SYMBOLIC OBJECTS.
SYMBOLIC DESCRIPTIONS
Description AGE SPC
D1 12,20,28 employee,worker
D2 [5, 33] teacher,countryman
13
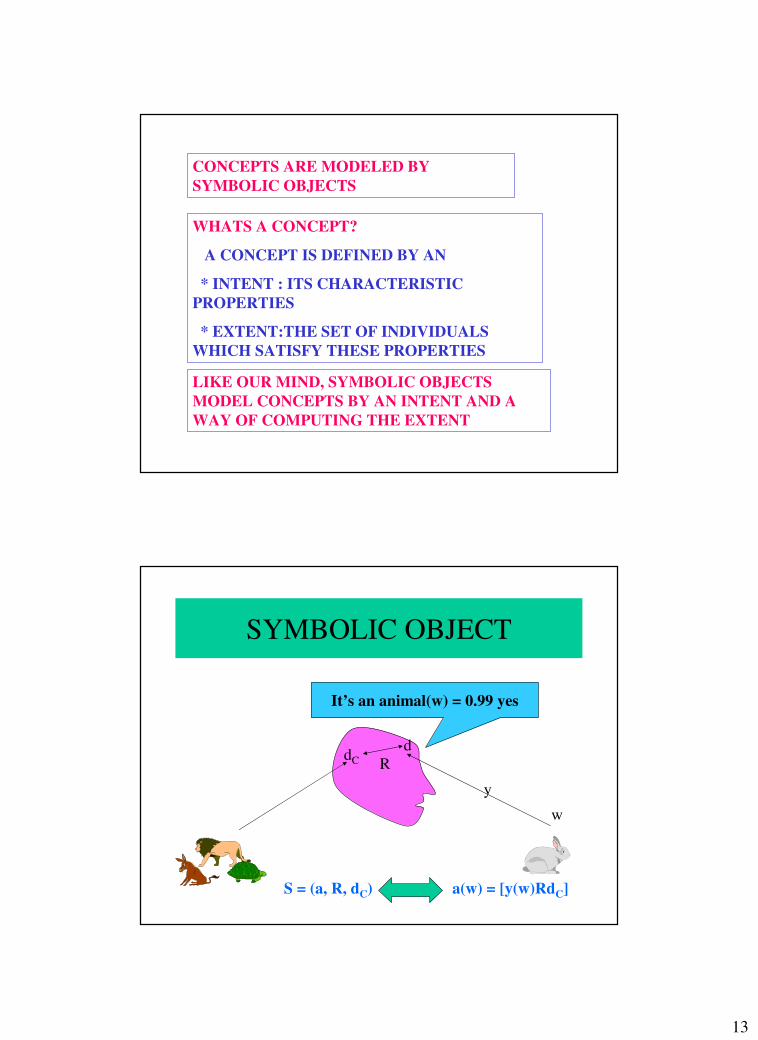
CONCEPTS ARE MODELED BY
SYMBOLIC OBJECTS
WHATS A CONCEPT?
A CONCEPT IS DEFINED BY AN
* INTENT : ITS CHARACTERISTIC
PROPERTIES
* EXTENT:THE SET OF INDIVIDUALS
WHICH SATISFY THESE PROPERTIES
LIKE OUR MIND, SYMBOLIC OBJECTS
MODEL CONCEPTS BY AN INTENT AND A
WAY OF COMPUTING THE EXTENT
SYMBOLIC OBJECT
It’s an animal(w) = 0.99 yes
d
y
dC
w
R
S = (a, R, dC) a(w) = [y(w)RdC]
14
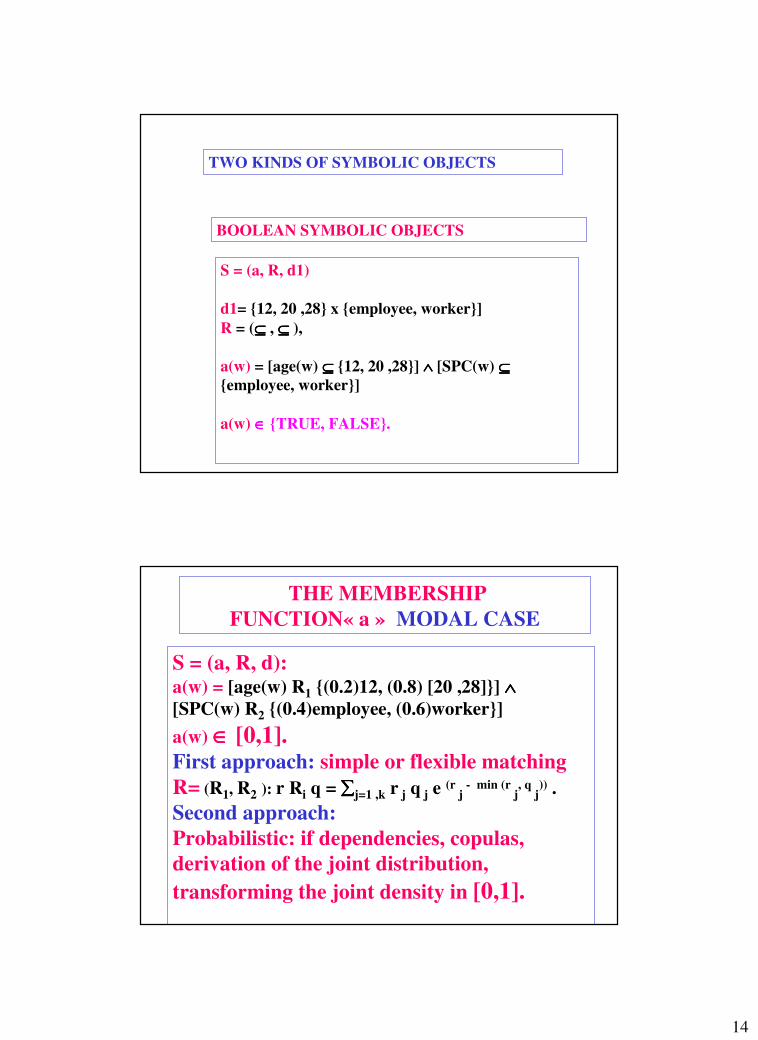
TWO KINDS OF SYMBOLIC OBJECTS
BOOLEAN SYMBOLIC OBJECTS
S = (a, R, d1)
d1= 12, 20 ,28 x employee, worker]
R = (⊆⊆⊆⊆ , ⊆⊆⊆⊆ ),
a(w) = [age(w) ⊆⊆⊆⊆ 12, 20 ,28] ∧∧∧∧ [SPC(w) ⊆⊆⊆⊆employee, worker]
a(w) ∈∈∈∈ TRUE, FALSE.
S = (a, R, d):a(w) = [age(w) R1 (0.2)12, (0.8) [20 ,28]] ∧∧∧∧[SPC(w) R2 (0.4)employee, (0.6)worker]
a(w) ∈∈∈∈ [0,1].First approach: simple or flexible matching
R= (R1, R2 ): r Ri q = ∑∑∑∑j=1 ,k r j q j e (r j- min (r
j, q
j)) .
Second approach:
Probabilistic: if dependencies, copulas,
derivation of the joint distribution,
transforming the joint density in [0,1].
THE MEMBERSHIP
FUNCTION« a » MODAL CASE
15
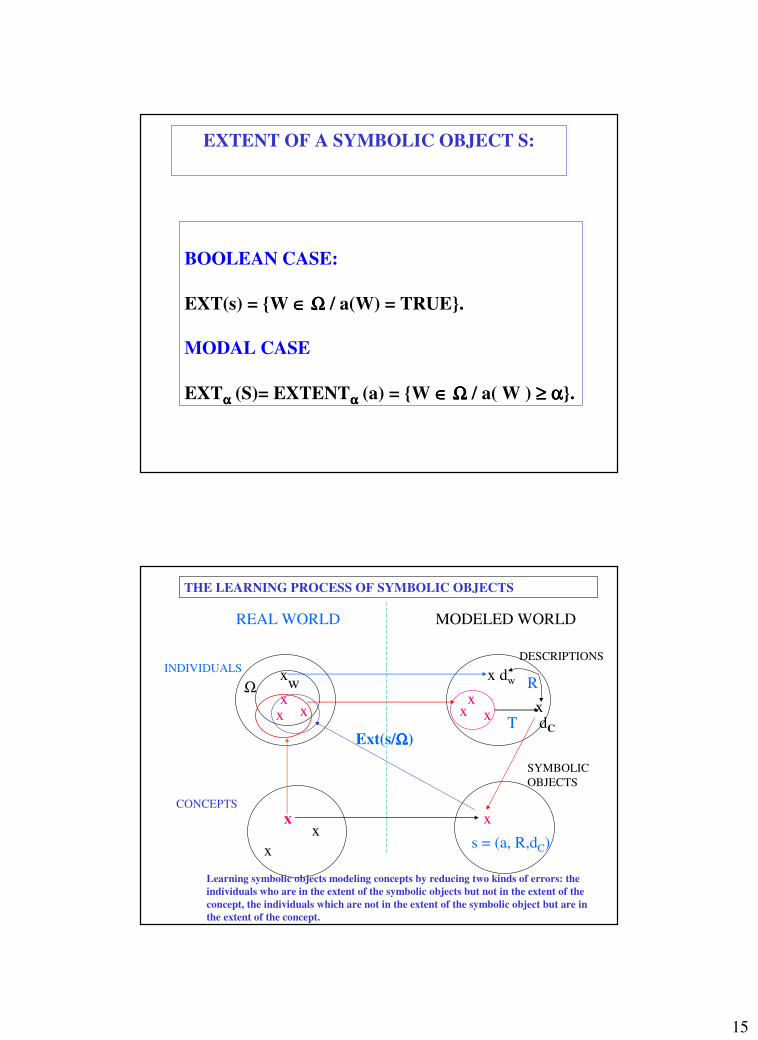
BOOLEAN CASE:
EXT(s) = W ∈∈∈∈ ΩΩΩΩ / a(W) = TRUE.
MODAL CASE
EXTαααα (S)= EXTENTαααα (a) = W ∈∈∈∈ ΩΩΩΩ / a( W ) ≥≥≥≥ αααα.
EXTENT OF A SYMBOLIC OBJECT S:
REAL WORLD
xx
x
MODELED WORLD
INDIVIDUALS
CONCEPTS
DESCRIPTIONS
SYMBOLIC
OBJECTS
x dw
xx x
x
s = (a, R,dC)
dC
xx
xx
xwΩ
Ext(s/ΩΩΩΩ)T
R
THE LEARNING PROCESS OF SYMBOLIC OBJECTS
Learning symbolic objects modeling concepts by reducing two kinds of errors: the
individuals who are in the extent of the symbolic objects but not in the extent of the
concept, the individuals which are not in the extent of the symbolic object but are in
the extent of the concept.
16
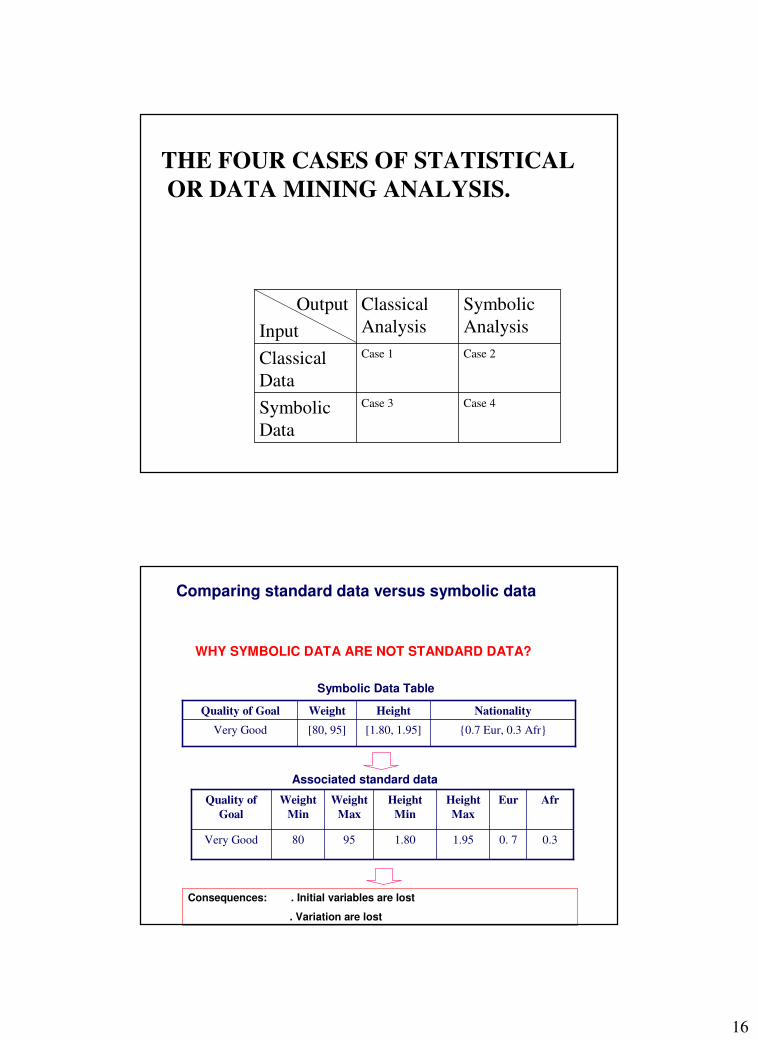
Case 4Case 3Symbolic
Data
Case 2Case 1Classical
Data
Symbolic
Analysis
Classical
Analysis
Output
Input
THE FOUR CASES OF STATISTICAL
OR DATA MINING ANALYSIS.
WHY SYMBOLIC DATA ARE NOT STANDARD DATA?
Comparing standard data versus symbolic data
[80, 95]
Weight
0.7 Eur, 0.3 Afr[1.80, 1.95]Very Good
NationalityHeightQuality of Goal
0.3
Afr
Very Good
Quality of
Goal
95
Weight
Max
80
Weight
Min
0. 71.951.80
EurHeight
Max
Height
Min
Symbolic Data Table
Associated standard data
Consequences: . Initial variables are lost
. Variation are lost
17
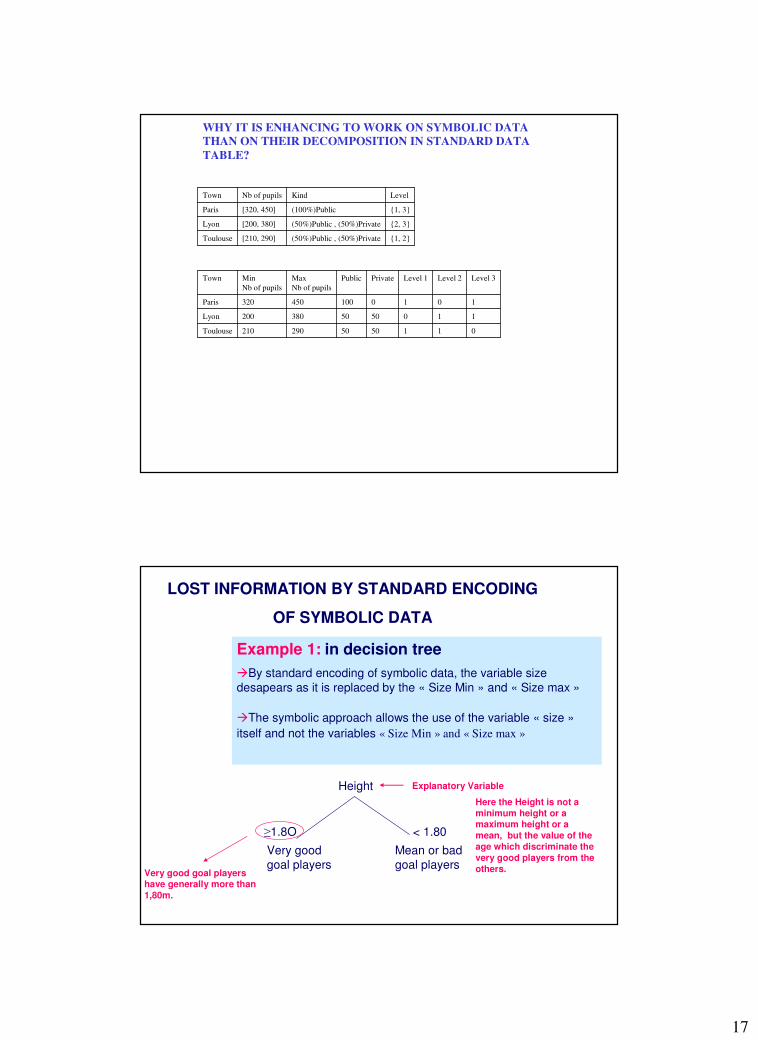
1, 2(50%)Public , (50%)Private[210, 290]Toulouse
2, 3(50%)Public , (50%)Private[200, 380]Lyon
1, 3(100%)Public[320, 450]Paris
LevelKindNb of pupilsTown
0115050290210Toulouse
1105050380200Lyon
1010100450320Paris
Level 3Level 2Level 1PrivatePublicMax
Nb of pupils
Min
Nb of pupils
Town
WHY IT IS ENHANCING TO WORK ON SYMBOLIC DATA
THAN ON THEIR DECOMPOSITION IN STANDARD DATA
TABLE?
≥1.8O < 1.80
Height
Very good
goal players
Mean or bad
goal players
LOST INFORMATION BY STANDARD ENCODING
OF SYMBOLIC DATA
Example 1: in decision tree
By standard encoding of symbolic data, the variable size
desapears as it is replaced by the « Size Min » and « Size max »
The symbolic approach allows the use of the variable « size »
itself and not the variables « Size Min » and « Size max »
Explanatory Variable
Very good goal playershave generally more than
1,80m.
Here the Height is not a
minimum height or a maximum height or a
mean, but the value of the
age which discriminate the
very good players from the
others.
18
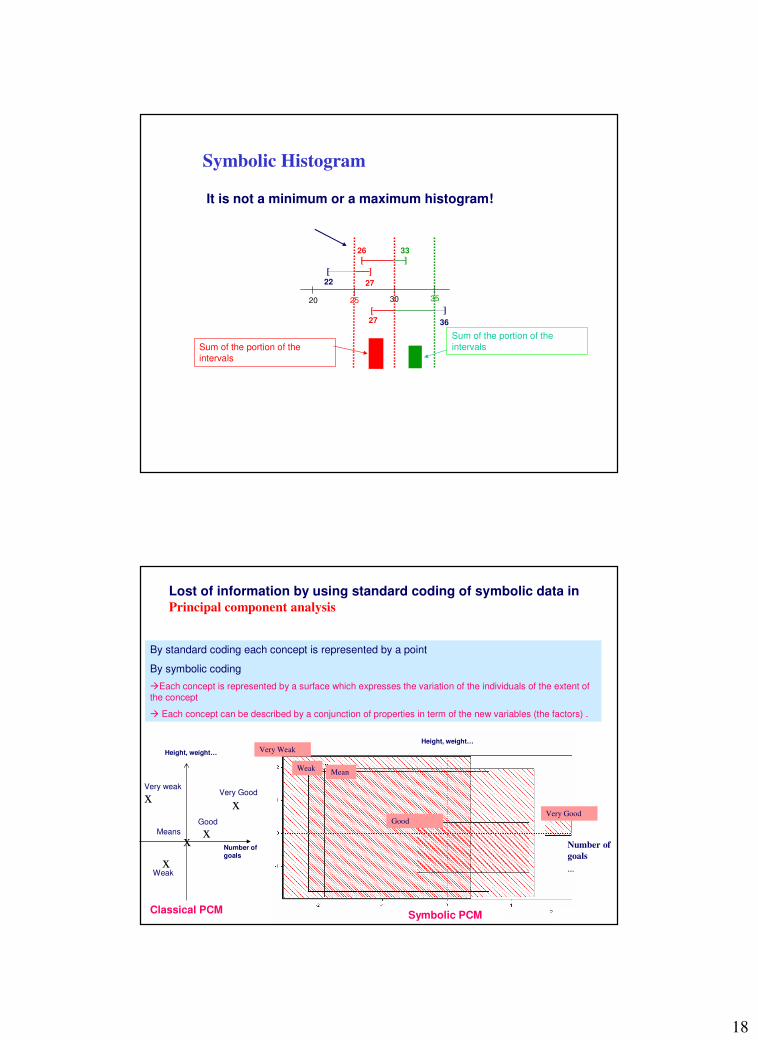
20 25 30 35
[22 27
]
[26
]33
[27 36
]
Sum of the portion of the
intervals
It is not a minimum or a maximum histogram!
Symbolic Histogram
Sum of the portion of the
intervals
x
x
x
x
x
Classical PCM
Number of
goals
…
Symbolic PCM
Lost of information by using standard coding of symbolic data in
Principal component analysis
By standard coding each concept is represented by a point
By symbolic coding
Each concept is represented by a surface which expresses the variation of the individuals of the extent of
the concept
Each concept can be described by a conjunction of properties in term of the new variables (the factors) .
Very Good
Good
Means
Very weak
Weak
Height, weight…
Number ofgoals
Very GoodGood
Very Weak
WeakMean
Height, weight…
19
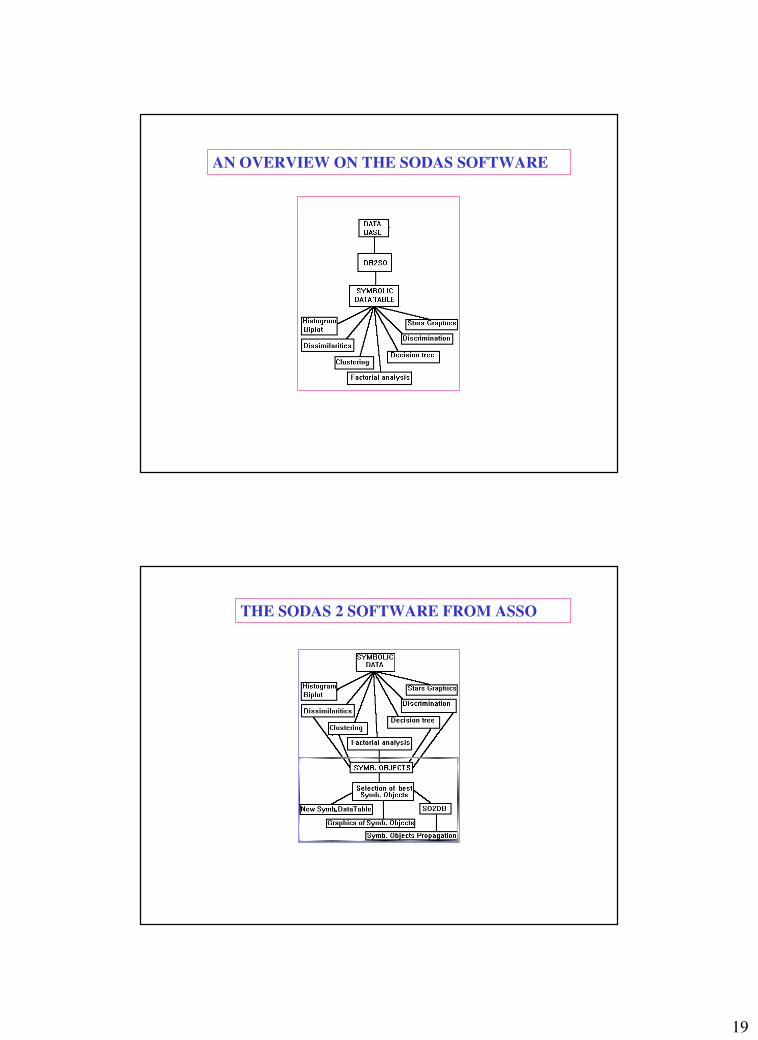
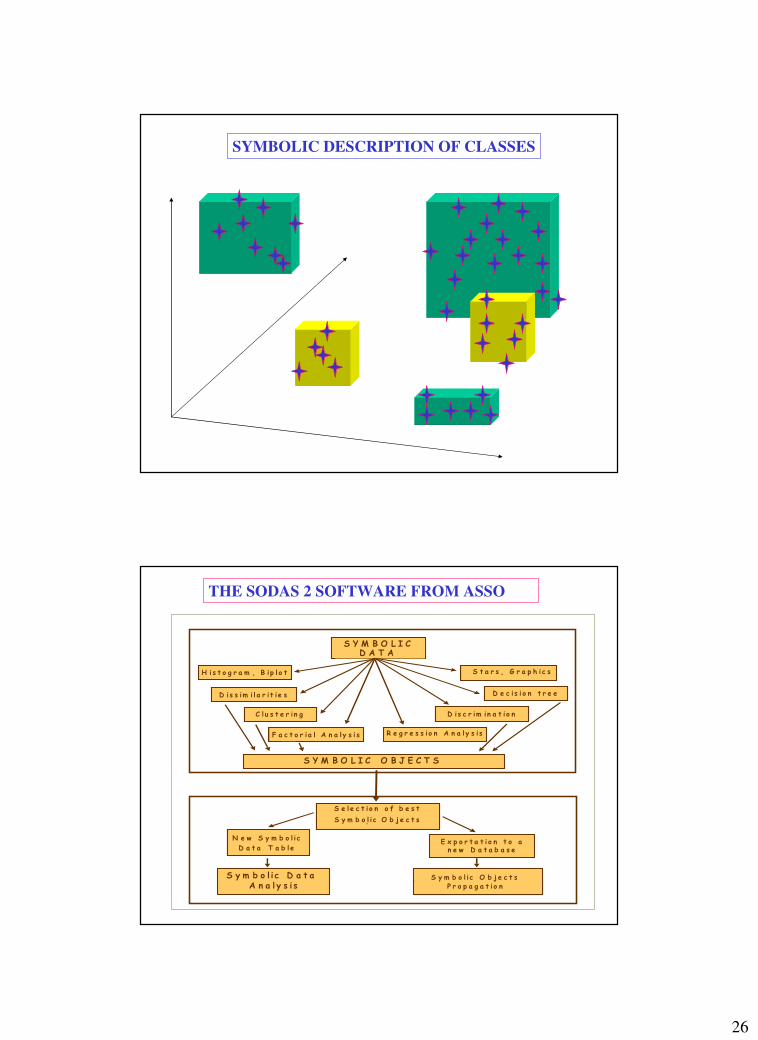
AN OVERVIEW ON THE SODAS SOFTWARE
THE SODAS 2 SOFTWARE FROM ASSO
20
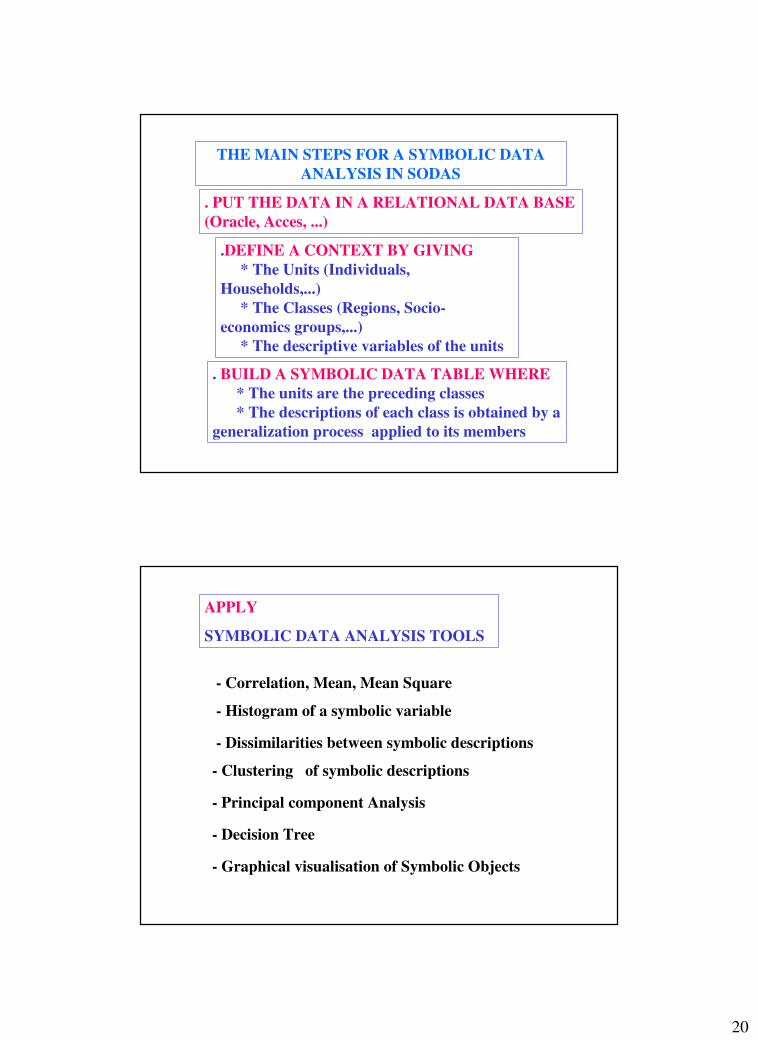
THE MAIN STEPS FOR A SYMBOLIC DATA
ANALYSIS IN SODAS
. PUT THE DATA IN A RELATIONAL DATA BASE
(Oracle, Acces, ...)
.DEFINE A CONTEXT BY GIVING
* The Units (Individuals,
Households,...)
* The Classes (Regions, Socio-
economics groups,...)
* The descriptive variables of the units
. BUILD A SYMBOLIC DATA TABLE WHERE
* The units are the preceding classes
* The descriptions of each class is obtained by a
generalization process applied to its members
- Histogram of a symbolic variable
- Dissimilarities between symbolic descriptions
- Clustering of symbolic descriptions
- Principal component Analysis
- Decision Tree
APPLY
SYMBOLIC DATA ANALYSIS TOOLS
- Correlation, Mean, Mean Square
- Graphical visualisation of Symbolic Objects
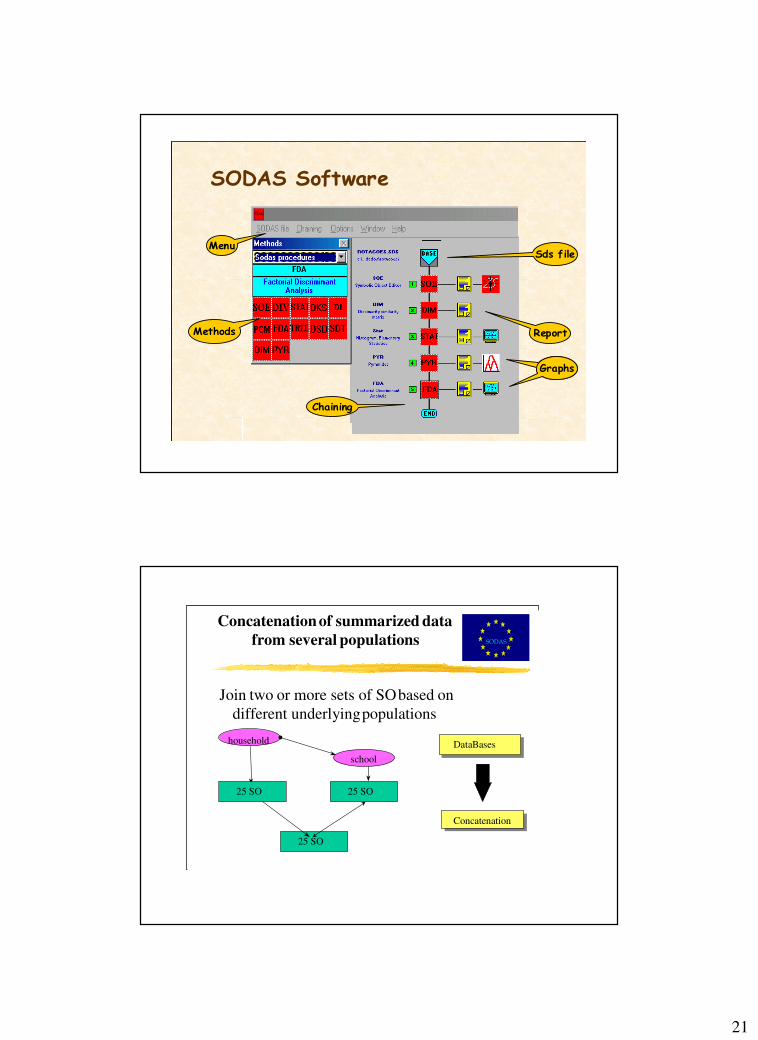
21
SODAS Software
Chaining
Sds file
Report
GraphGraphs
Menu
Methods
SODAS
Concatenationof summarized data
from several populations
Join two or more sets of SObased on
different underlyingpopulations
household
school
25 SO 25 SO
25 SO
DataBases
Concatenation
22
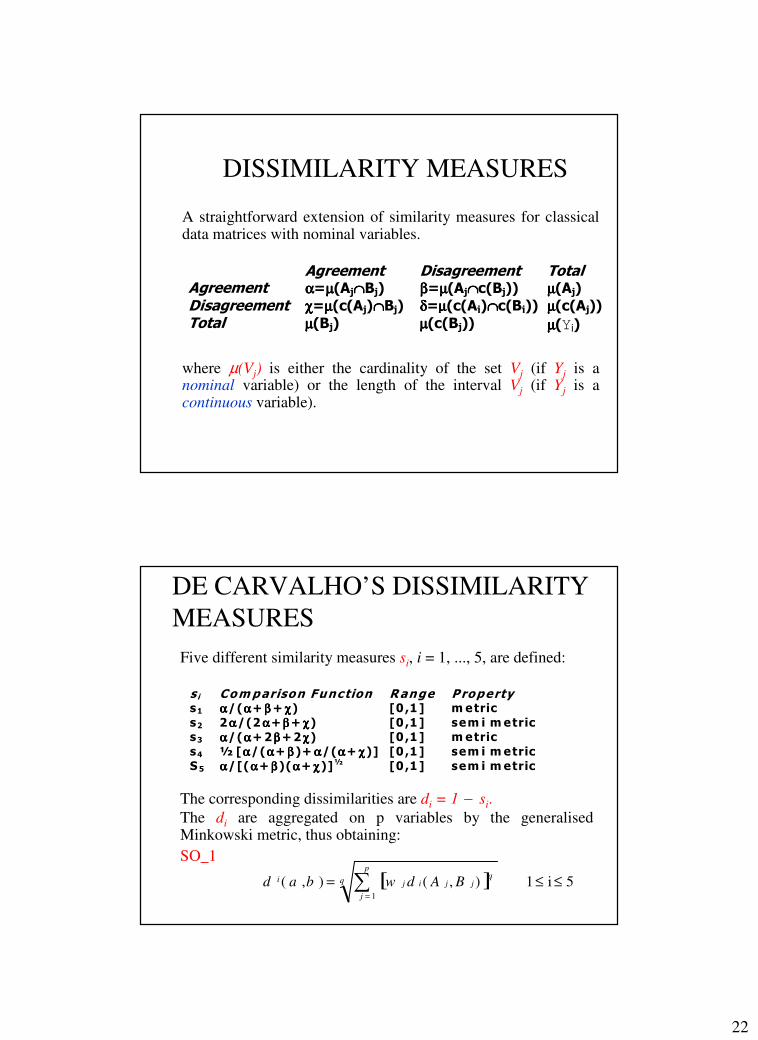
DISSIMILARITY MEASURES
A straightforward extension of similarity measures for classicaldata matrices with nominal variables.
where µ(Vj) is either the cardinality of the set Vj (if Yj is a nominal variable) or the length of the interval Vj (if Yj is a continuous variable).
Agreement Disagreement TotalAgreement αααα=µµµµ(Aj∩∩∩∩Bj) ββββ=µµµµ(Aj∩∩∩∩c(Bj)) µµµµ(Aj)
Disagreement χχχχ=µµµµ(c(Aj)∩∩∩∩Bj) δδδδ=µµµµ(c(Aj)∩∩∩∩c(Bj)) µµµµ(c(Aj))
Total µµµµ(Bj) µµµµ(c(Bj)) µµµµ(Yi)
Five different similarity measures si, i = 1, ..., 5, are defined:
The corresponding dissimilarities are di = 1 − si.
The di are aggregated on p variables by the generalisedMinkowski metric, thus obtaining:
SO_1
[ ] 5i1 ),(),(1
≤≤= ∑=
q
p
j
qjjij
i BAdwbad
s i Comparison Function Range Propertys1 αααα/(αααα+ ββββ + χχχχ) [0 ,1] m etric
s2 2αααα/(2 αααα+ ββββ+ χχχχ) [0 ,1] sem i m etric
s3 αααα/(αααα+2 ββββ+2 χχχχ) [0 ,1] m etric
s4 ½ [αααα/(αααα+ ββββ )+ αααα/(αααα+ χχχχ)] [0 ,1] sem i m etric
S 5 αααα/[(αααα+ ββββ )(αααα+ χχχχ)]½ [0 ,1] sem i m etric
DE CARVALHO’S DISSIMILARITY
MEASURES
23
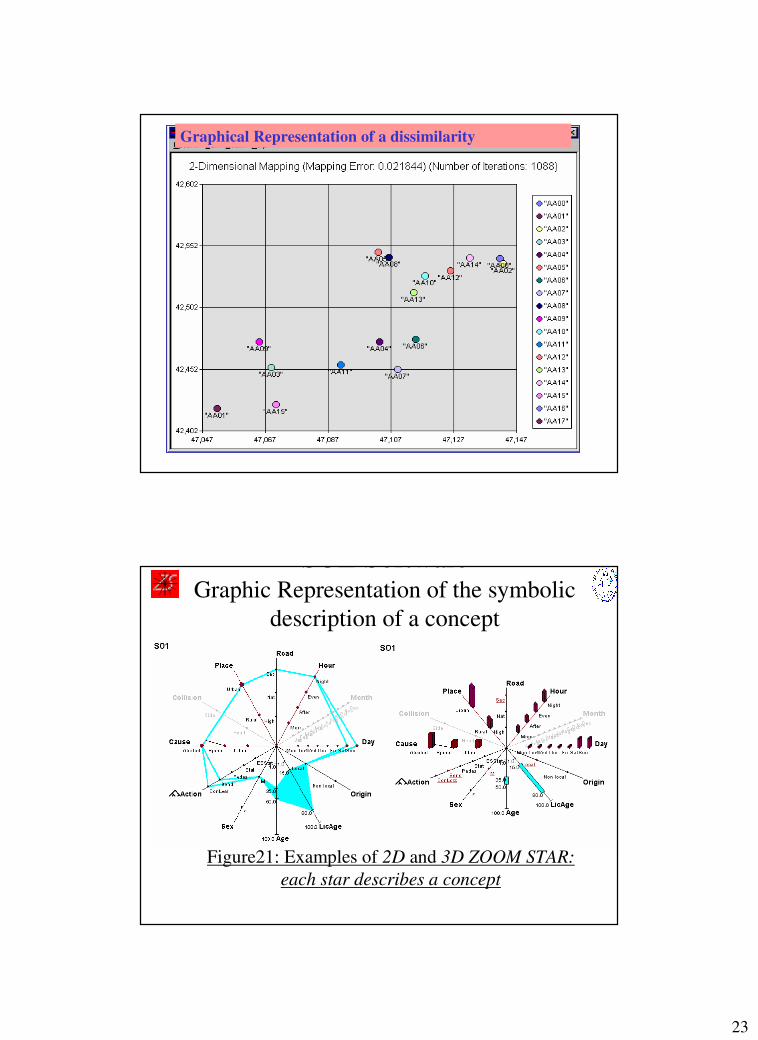
Graphical Representation of a dissimilarity
Figure21: Examples of 2D and 3D ZOOM STAR:
each star describes a concept
SOE SoftwareGraphic Representation of the symbolic
description of a concept
24
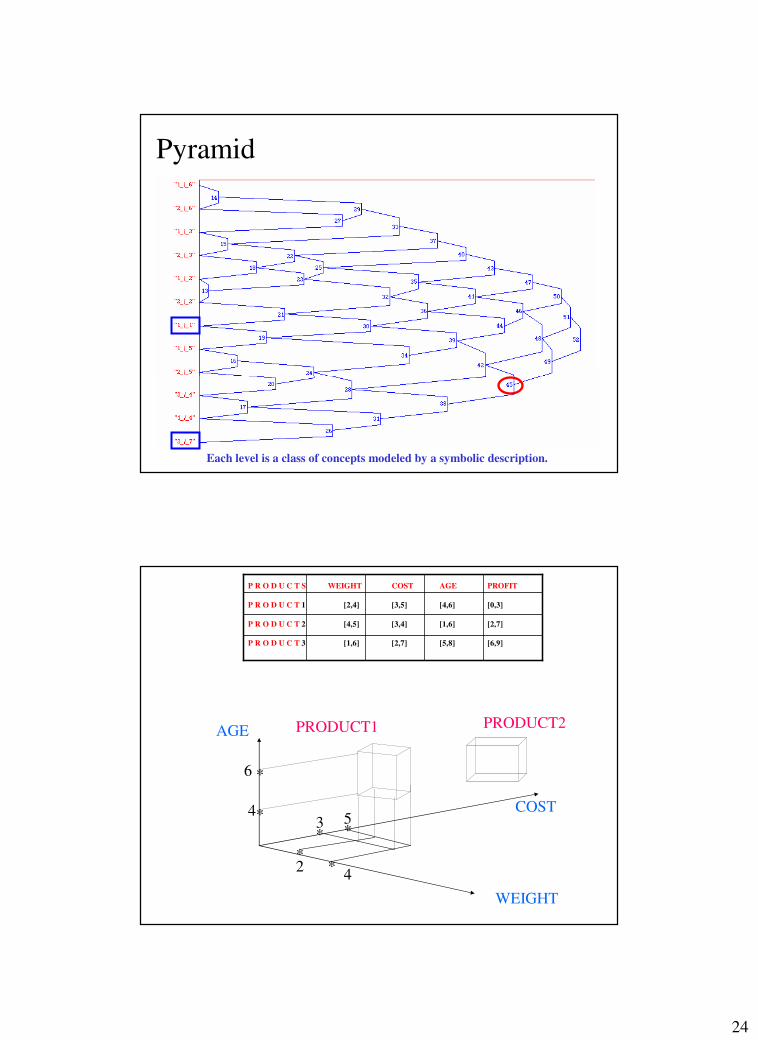
Pyramid
Each level is a class of concepts modeled by a symbolic description.
PRODUCT2
WEIGHT
*2
4*
3 5* *
*
*4
6
PRODUCT1AGE
COST
P R O D U C T S WEIGHT COST AGE PROFIT
P R O D U C T 1 [2,4] [3,5] [4,6] [0,3]
P R O D U C T 2 [4,5] [3,4] [1,6] [2,7]
P R O D U C T 3 [1,6] [2,7] [5,8] [6,9]
25
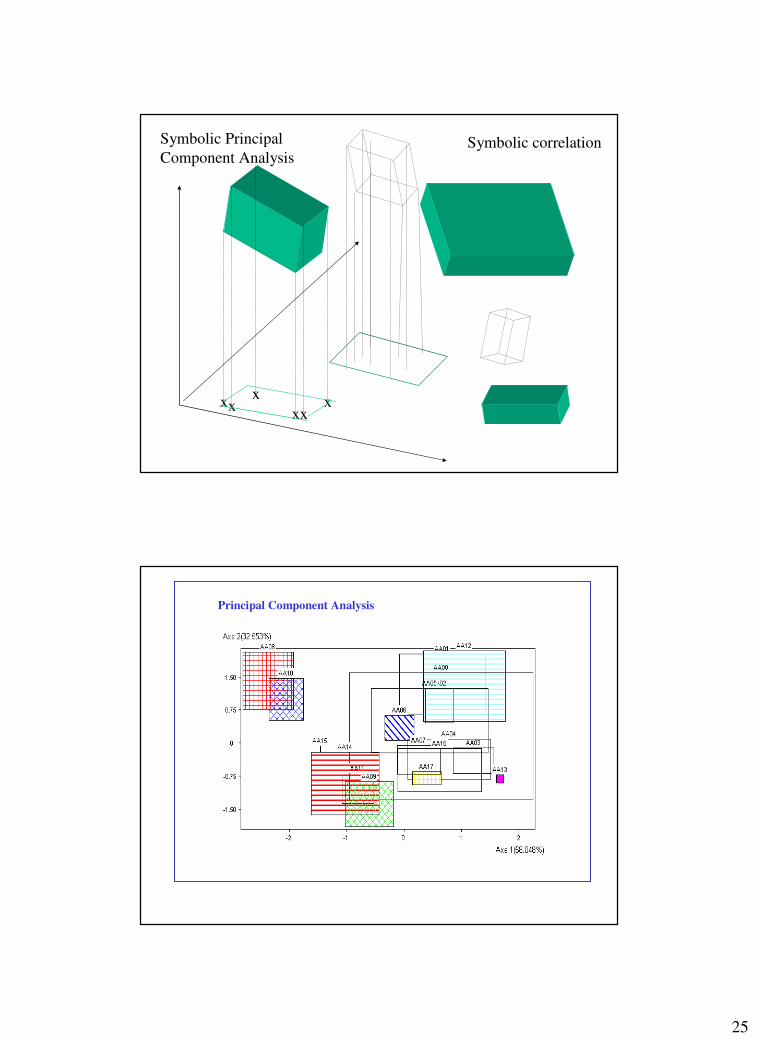
x
xxxx
x
Symbolic Principal
Component AnalysisSymbolic correlation
Principal Component Analysis
26
SYMBOLIC DESCRIPTION OF CLASSES
S Y M B. O B J E C T S
S Y M B O L I CD A T A
S Y M B O L I CD A T A
S Y M B. O B J E C T S
H is t o g r a mH i s t o g r a mH i s t o g r a m , B ip l o t S t a r s , G r a p h i c s
D is s im i l a r i t i e s
C l u s t e r i n g D is c r im in a t i o n
D e c i s io nt r e eD e c i s io nt r e eD e c i s i o n t r e e
S Y M B O L I C O B J E C T S
S e le c t i o no f b e s tS y m b. O b j e c t sS e le c t i o no f b e s tS y m b. O b j e c t s
S e le c t i o n o f b e s t
S y m b o l i c. O b j e c t s
N e wS y m bN e wS y m bN e w S y m b o l i c
D a t a T a b le
G r a p h i c s o fS y m bS y m b o l i c D a t a A n a l y s i s
S y m b o l i c O b j e c t s P r o p a g a t i o n
F a c t o r i a lF a c t o r ia l A n a ly s i s F a c t o r ia lR e g r e s s i o n A n a ly s i s
E x p o r t a t i o n t o an e w D a t a b a s e
THE SODAS 2 SOFTWARE FROM ASSO
27
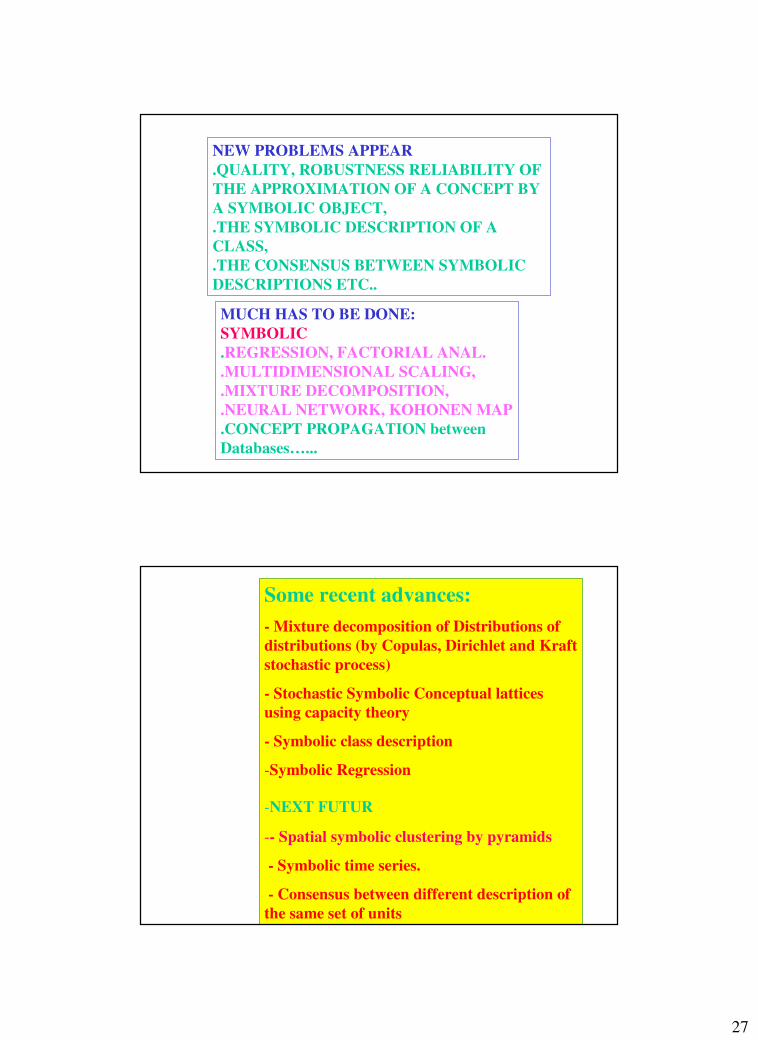
NEW PROBLEMS APPEAR
.QUALITY, ROBUSTNESS RELIABILITY OF
THE APPROXIMATION OF A CONCEPT BY
A SYMBOLIC OBJECT,
.THE SYMBOLIC DESCRIPTION OF A
CLASS,
.THE CONSENSUS BETWEEN SYMBOLIC
DESCRIPTIONS ETC..
MUCH HAS TO BE DONE:
SYMBOLIC
.REGRESSION, FACTORIAL ANAL.
.MULTIDIMENSIONAL SCALING,
.MIXTURE DECOMPOSITION,
.NEURAL NETWORK, KOHONEN MAP
.CONCEPT PROPAGATION between
Databases…...
Some recent advances:
- Mixture decomposition of Distributions of
distributions (by Copulas, Dirichlet and Kraft
stochastic process)
- Stochastic Symbolic Conceptual lattices
using capacity theory
- Symbolic class description
-Symbolic Regression
-NEXT FUTUR
-- Spatial symbolic clustering by pyramids
- Symbolic time series.
- Consensus between different description of
the same set of units
28
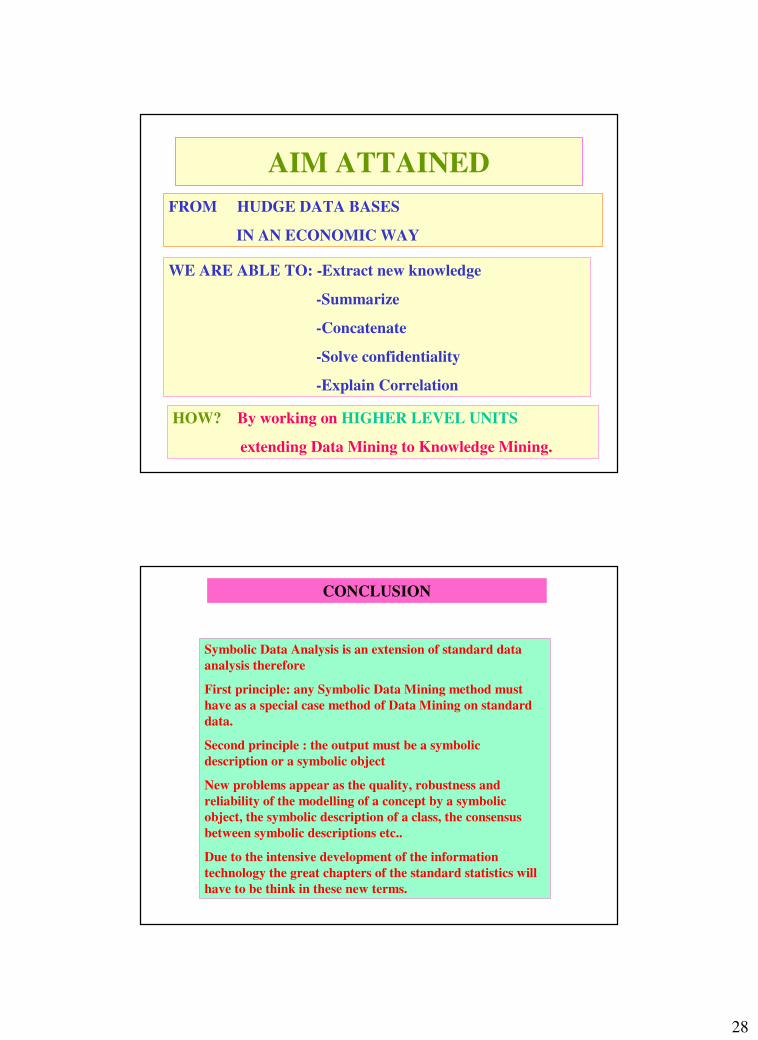
AIM ATTAINED
FROM HUDGE DATA BASES
IN AN ECONOMIC WAY
WE ARE ABLE TO: -Extract new knowledge
-Summarize
-Concatenate
-Solve confidentiality
-Explain Correlation
HOW? By working on HIGHER LEVEL UNITS
extending Data Mining to Knowledge Mining.
CONCLUSION
Symbolic Data Analysis is an extension of standard data
analysis therefore
First principle: any Symbolic Data Mining method must
have as a special case method of Data Mining on standard
data.
Second principle : the output must be a symbolic
description or a symbolic object
New problems appear as the quality, robustness and
reliability of the modelling of a concept by a symbolic
object, the symbolic description of a class, the consensus
between symbolic descriptions etc..
Due to the intensive development of the information
technology the great chapters of the standard statistics will
have to be think in these new terms.
29
References
SPRINGER, 2000 :
“Analysis of Symbolic Data”
H.H., Bock, E. Diday, Editors . 450 pages.
JASA (Journal of the American Statistical Association)
“From the Statistic of Data to the Statistic of Knowledge:
Symbolic Data Analysis” Billard, Diday June, 2003 .
Electronic Journal of S. D. A.: ESDA
E. Diday, R. Verde, Y. Lechevallier editors
WILEY 2006: To be published
SYMBOLIC DATA ANALYSIS AND THE SODAS SOFTWARE Diday, Noirhomme (editors)
SYMBOLIC DATA ANALYSIS : conceptual statistics and data mining Billard , Diday
Download SODAS with documentation and examples :
www.ceremade.dauphine.frthen LISE, then SODAS