Embed Size (px)
Citation preview
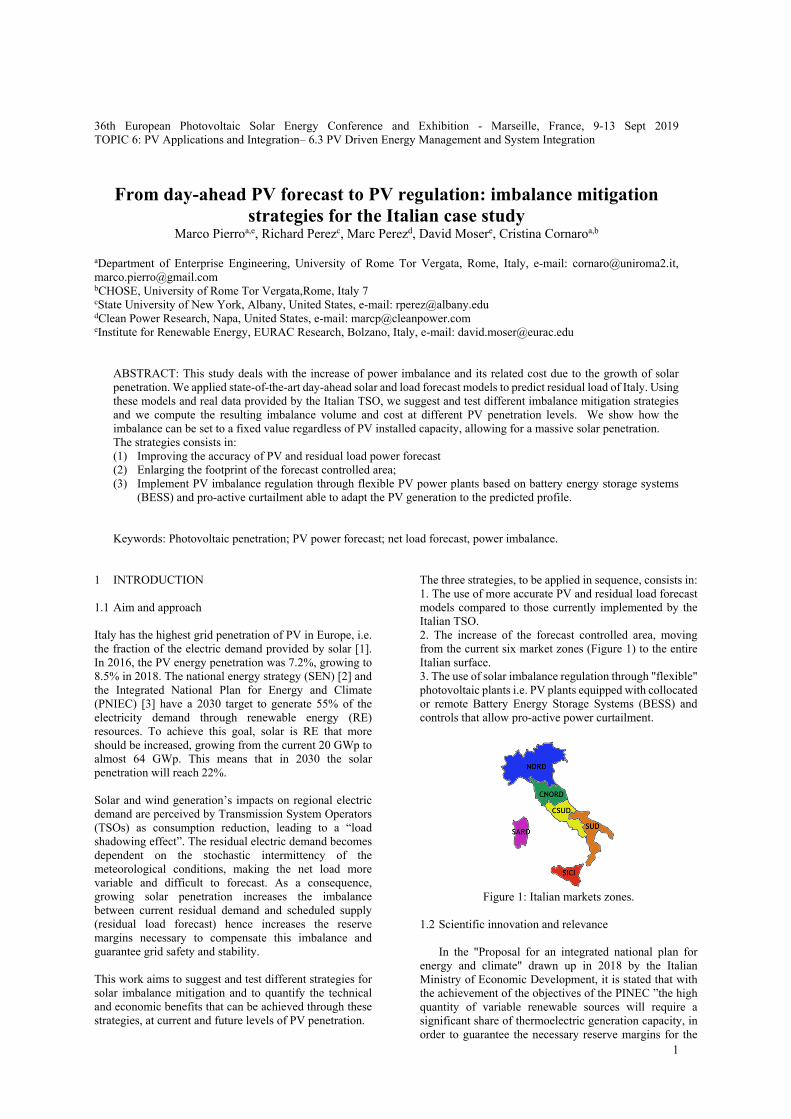
36th European Photovoltaic Solar Energy Conference and Exhibition - Marseille, France, 9-13 Sept 2019 TOPIC 6: PV Applications and Integration– 6.3 PV Driven Energy Management and System Integration
From day-ahead PV forecast to PV regulation: imbalance mitigation
strategies for the Italian case study Marco Pierroa,e, Richard Perezc, Marc Perezd, David Mosere, Cristina Cornaroa,b
aDepartment of Enterprise Engineering, University of Rome Tor Vergata, Rome, Italy, e-mail: [email protected], [email protected] bCHOSE, University of Rome Tor Vergata,Rome, Italy 7 cState University of New York, Albany, United States, e-mail: [email protected] dClean Power Research, Napa, United States, e-mail: [email protected] eInstitute for Renewable Energy, EURAC Research, Bolzano, Italy, e-mail: [email protected]
ABSTRACT: This study deals with the increase of power imbalance and its related cost due to the growth of solar penetration. We applied state-of-the-art day-ahead solar and load forecast models to predict residual load of Italy. Using these models and real data provided by the Italian TSO, we suggest and test different imbalance mitigation strategies and we compute the resulting imbalance volume and cost at different PV penetration levels. We show how the imbalance can be set to a fixed value regardless of PV installed capacity, allowing for a massive solar penetration. The strategies consists in: (1) Improving the accuracy of PV and residual load power forecast (2) Enlarging the footprint of the forecast controlled area; (3) Implement PV imbalance regulation through flexible PV power plants based on battery energy storage systems
(BESS) and pro-active curtailment able to adapt the PV generation to the predicted profile. Keywords: Photovoltaic penetration; PV power forecast; net load forecast, power imbalance.
1 INTRODUCTION 1.1 Aim and approach Italy has the highest grid penetration of PV in Europe, i.e. the fraction of the electric demand provided by solar [1]. In 2016, the PV energy penetration was 7.2%, growing to 8.5% in 2018. The national energy strategy (SEN) [2] and the Integrated National Plan for Energy and Climate (PNIEC) [3] have a 2030 target to generate 55% of the electricity demand through renewable energy (RE) resources. To achieve this goal, solar is RE that more should be increased, growing from the current 20 GWp to almost 64 GWp. This means that in 2030 the solar penetration will reach 22%. Solar and wind generation’s impacts on regional electric demand are perceived by Transmission System Operators (TSOs) as consumption reduction, leading to a “load shadowing effect”. The residual electric demand becomes dependent on the stochastic intermittency of the meteorological conditions, making the net load more variable and difficult to forecast. As a consequence, growing solar penetration increases the imbalance between current residual demand and scheduled supply (residual load forecast) hence increases the reserve margins necessary to compensate this imbalance and guarantee grid safety and stability. This work aims to suggest and test different strategies for solar imbalance mitigation and to quantify the technical and economic benefits that can be achieved through these strategies, at current and future levels of PV penetration.
The three strategies, to be applied in sequence, consists in: 1. The use of more accurate PV and residual load forecast models compared to those currently implemented by the Italian TSO. 2. The increase of the forecast controlled area, moving from the current six market zones (Figure 1) to the entire Italian surface. 3. The use of solar imbalance regulation through "flexible" photovoltaic plants i.e. PV plants equipped with collocated or remote Battery Energy Storage Systems (BESS) and controls that allow pro-active power curtailment.
Figure 1: Italian markets zones.
1.2 Scientific innovation and relevance
In the "Proposal for an integrated national plan for energy and climate" drawn up in 2018 by the Italian Ministry of Economic Development, it is stated that with the achievement of the objectives of the PINEC ”the high quantity of variable renewable sources will require a significant share of thermoelectric generation capacity, in order to guarantee the necessary reserve margins for the
1

safe operation of the system”. The relevance of this work is exactly to suggest and test strategies to limit the imbalance due to the solar penetration so that operating reserves should not be increased. Furthermore, the Italian legislation does not allow wind and solar power plants to participate to the balancing regulation process. This study clearly demonstrates that highly flexible PV plants, managed by Distributed System Operators or Aggregators but directly controlled by the TSO, can play an active role in the correction of the solar imbalance of the whole Italy. Indeed, we show that TSO-controlled utility scale PV plants are capable to completely remove the effect of the PV penetration on the Italian imbalance. Moreover, in Italy the major imbalance costs (mainly due to load and distributed VRE forecast errors) are borne by ratepayers i.e. they are socialized. We show that the imbalance costs resulting from the proposed strategies are always below the current socialized costs, even when a notable BESS capacity for flexible PV regulation should be installed.
2 DATA In the study, we use real electricity consumption, PV and wind power, hourly data together with day-head and balancing energy prices (all provided by the Italian TSO) as well as satellite-derived and day-ahead irradiance forecasts for the year 2016. We further assume a reasonable PV growth scenario and a realistic "learning curve" for the costs of battery storage (Figure 2).
Figure 2: Scenario of grow of the PV capacity in Italy and; learning curve of lithium battery. The PV growth scenario embeds the objective of the PINEC to 2030 with 62 GWp installed (22% penetration) as well as the achievement in 2060 of 130 GWp (39% penetration) i.e. the maximum potential installable on buildings in Italy [4]. The evolution of the costs of lithium batteries ("learning curve") was derived from the reports [5] and [6]. 3 METHODOLOGY The power supply for the next day is computed by the day-ahead forecast of the net load:
𝑃𝑃𝑛𝑛𝑛𝑛𝑛𝑛𝑛𝑛𝑛𝑛𝑛𝑛𝑛𝑛𝑓𝑓𝑛𝑛𝑓𝑓 = 𝑃𝑃𝑛𝑛𝑛𝑛𝑛𝑛𝑛𝑛
𝑓𝑓𝑛𝑛𝑓𝑓 − 𝑃𝑃𝑤𝑤𝑤𝑤𝑛𝑛𝑛𝑛𝑓𝑓𝑛𝑛𝑓𝑓 − 𝑃𝑃𝑛𝑛(𝑃𝑃𝑃𝑃𝑃𝑃
𝑓𝑓𝑛𝑛𝑓𝑓/𝑃𝑃𝑛𝑛) (1)
where 𝑃𝑃𝑛𝑛𝑛𝑛𝑛𝑛𝑛𝑛𝑛𝑛𝑛𝑛𝑛𝑛𝑓𝑓𝑛𝑛𝑓𝑓 ,𝑃𝑃𝑛𝑛𝑛𝑛𝑛𝑛𝑛𝑛
𝑓𝑓𝑛𝑛𝑓𝑓 ,𝑃𝑃𝑤𝑤𝑤𝑤𝑛𝑛𝑛𝑛𝑓𝑓𝑛𝑛𝑓𝑓 , 𝑃𝑃𝑃𝑃𝑃𝑃
𝑓𝑓𝑛𝑛𝑓𝑓 , are respectively the net load, the load, the wind and solar generation. 𝑃𝑃𝑛𝑛 is the PV capacity. To assess the benefit of the developed strategies, we first
compare the imbalance volumes and costs resulting from our net load forecast for each market zones to the imbalance volumes and costs obtained with the current Italian TSO forecast models for the year 2016 (strategy #1). We further apply our model to forecast the net-load for the entire country (strategy #2), i.e., enlarging the forecast controlled area from individual market zones to the entire Italian grid. Then, we consider the case of using flexible plants for solar imbalance regulation (strategy #3). Finally, we compute the imbalance volume and costs that can be achieved by our models as well as by the solar regulation process at the PV penetration levels reported in Figure 2. In subsection 3.1, we briefly describe the forecast models used to test the first two strategies. In subsection 3.2, we introduce the concept of flexible PV system showing how it can be used in the imbalance regulation process. 3.1 day-ahead net load forecast models 1. TSO forecast models The TSO predicts day head load with an Analog Ensemble technique using historical data, rescaled by a trend factor. Then, this prediction is corrected with semi-empirical coefficients that take into account the variation of the cloud cover and the mean daily air temperature of the current hour with respect to the past hours, included in the ensemble. The TSO wind forecast model is based on a Neural Network model that uses wind and temperature NWP to predict the generation of some reference wind plants. Then, these predictions are extended to all the Italian wind fleet by a linear spatial interpolation. A similar approach is used for the PV power forecast [7]. 2. Developed forecast models Load and wind forecasts are produced with Seasonal Autoregressive Moving Average models (SARIMA). The load forecast model is a SARIMA time series based on the strong partial autocorrelation between the current load and the one hour and one week lag values with a weekly seasonality [8]. The wind forecast model is a SARIMA time series based on the strong partial autocorrelation between the current and the one and two lag hours wind generation values. The PV power prediction we apply is based on a sophisticated upscaling method. This embeds day-ahead GHI and ground temperature predictions. The upscaling method is a hybrid approach that coupled a “physical” PV power forecast model [9] with a machine learning approach based on ensemble of artificial neural networks [10]. In the paper, we refer to this model as “state of art” since its forecast accuracy is comparable with the forecast accuracy of other methods, reported in the literature (for instance [11, 12, 13]). 3.2 Flexible PV plants for solar imbalance regulation Flexible solar power plants are PV plants equipped with BESS and remotely controllable inverters that can curtail PV power generation on demand. Both storage and curtailment can shape PV generation (injected in to the grid) to match the predicted profile, thereby reducing solar imbalance. When the PV forecast is underestimated, the PV generation that exceeds the prediction is curtailed or used to recharge the storage while when the forecast is overestimated the battery can provide
2

the additional power to match the predicted value. On one hand, the storage capacity may not be enough to correct all the over forecast events and residual solar imbalances between the current and predicted PV generation cannot be avoided. On the other hand, the forecasts can purpose-built underestimated using a quantile trajectory (𝑃𝑃(𝑋𝑋)) with X lower than 50%, hence decreasing the probability of over prediction that cannot be fully corrected by BESS power injection but increasing the curtailment. Therefore, the imbalance reduction that can be reached using flexible PV solar regulation depends both on the storage capacity and on the chosen level of under forecast/curtailment. For, example Figure 3 shows how the PV imbalance (forecast errors – RMSE -) can be halve by solar regulation or using flexible PV with 0.36 hours of storage and a P(50) forecast trajectory (curtailment of 3.8% of PV generation) or using flexible PV with no storage and a P(10) forecast trajectory (curtailment of 13.4% of PV generation).
Figure 3: day-ahead Italian PV power forecast (a); day-ahead Italian PV power forecast with solar regulation using 0.36 hours of storage and a P(50) quantile forecast trajectory (b); day-ahead Italian PV power forecast with solar regulation using 0 hours of storage and a P(10) quantile forecast trajectory (c). Flexible PV systems can be sized to provide regulation
services at lower costs than the combined cycle power plants (currently used for imbalance regulation).
The only conditions for a cost-effective solar regulation are: 1. Utility scale flexible PV plants should be used; 2. These plants should be controlled directly by the TSO that uses pro-active curtailment and BESS power injection to correct the Italian PV power forecast errors; 3. The TSO should use a suitable quantile forecast trajectory according to the BESS costs. In this way the BESS investment and the solar regulation costs can be strongly contained; 4. The Battery storage should be recharged during the night so that the whole BESS capacity will be available for the next day regulation process. At the end of each day, the state of the charge of the storage is known, thus the night recharging profile can be perfectly scheduled and provided by low reactive thermoelectric or predictable RE plants. 4 METRICS Table 1 reports the metrics used to evaluate the imbalance volumes and costs [14] and PV power imbalance. Where, 𝑒𝑒ℎ𝑁𝑁𝑁𝑁 is the net load forecast errors (imbalance) 𝛿𝛿ℎ is a Boolean function equal to 1 if 𝑒𝑒ℎ𝑁𝑁𝑁𝑁 > 0 and 0 if 𝑒𝑒ℎ𝑁𝑁𝑁𝑁 ≤0; 𝑃𝑃𝐷𝐷𝐷𝐷 is the energy price on the day-ahead market and 𝑃𝑃𝐵𝐵↑, 𝑃𝑃𝐵𝐵↓ are the energy prices for upward and downward regulation on the balancing energy market; 𝑒𝑒ℎ𝑃𝑃𝑃𝑃 is the PV power forecast error. The value 𝑛𝑛ℎ, is the # of hours in a year in the case of net-load forecast and the # of sun hours in the case of PV forecast.
Table 1: matrics used for imbalance volume and costs evaluation.
Name Acronym and formulae
Imbalance
volume
[TWh/yr]
𝐼𝐼𝐼𝐼𝐼𝐼𝑣𝑣𝑛𝑛𝑛𝑛 = ��𝑒𝑒ℎ𝑁𝑁𝑁𝑁�𝑛𝑛ℎ
ℎ=1
Imbalance
costs [M€/yr]
𝐼𝐼𝐼𝐼𝐼𝐼𝑐𝑐𝑛𝑛𝑐𝑐𝑛𝑛 = �[𝛿𝛿ℎ ∗ 𝐼𝐼𝑚𝑚𝑚𝑚{𝑃𝑃𝐷𝐷𝐷𝐷 ,𝑃𝑃𝐵𝐵↑} ∗ �𝑒𝑒ℎ𝑁𝑁𝑁𝑁�𝑛𝑛ℎ
ℎ=1
+ (1 − 𝛿𝛿ℎ)
∗ 𝐼𝐼𝑚𝑚𝑛𝑛{𝑃𝑃𝐷𝐷𝐷𝐷 ,𝑃𝑃𝐵𝐵↓} ∗ �𝑒𝑒ℎ𝑁𝑁𝑁𝑁�]
PV power
imbalance
[% of Pn]
𝑀𝑀𝑀𝑀𝑀𝑀 = �∑ |𝑒𝑒ℎ𝑃𝑃𝑃𝑃|𝑛𝑛ℎℎ=1
𝑛𝑛� /𝑃𝑃𝑛𝑛
5 RESULTS 5.1 Imbalance at current levels of PV penetration Figure 4 shows the technical and economic benefits in reducing the Italian imbalance that can be achieved by the first two strategies. Improving the PV forecast accuracy (strategy #1) could lead to an imbalance volumes and costs reduction of 12.6% and
3

17.6% with respect to the 17.3 TWh/yr and 1213 M€/yr obtained by the TSO forecast during the year 2016 [14]. Increasing in the forecast "footprint" from the market zones to the whole country (strategy #2) reduces the solar variability and consequently improve the accuracy of the PV forecasts (smoothing effect). In the Italian case, the smoothing effect can reduce the imbalance volume and cost of 27.4% and 30.5% respectively.
Figure 4: Imbalance volume and costs at 2016 PV penetration achieved by the TSO net load forecast and by the developed “state of the art” forecasts of the PV generation of the Italian market zones (strategy #1) and of the whole country (strategy #2). The aim of the third strategy is to use the flexible PV regulation to fix the imbalance volume to 12.2 TWh/yr, hence to reach the 29.5% of imbalance reduction. To achieve this target, the flexible PV systems were cost - optimally sized. Thus, it was chosen the forecast quantile and the corresponding BESS capacity that minimize the BESS investment, and the costs of residual imbalance, recharging storage and curtailing PV. At the 7% of PV penetration and BESS cost of 600 $/kWh (Figure 2), the minimum imbalance costs can be reached just curtailing all the PV generation that exceeds the P50 forecast without the need of any energy storage (Figure 5a). In this way, the solar induced imbalance will decrease from the 2.4% of the “state of the art” forecast to 1.25% of Pn (Figure 5b) and the 4.4% of the Italian solar generation will be curtailed (Figure 5c). Applying solar regulation to reach the target imbalance of 12.2 TWh/yr requires the capability to curtail every PV plant of the Italian fleet and this is not an easy task. Nevertheless, the required flexibility of solar generation could be also achieved by only controlling “relevant” PV plants: i.e., plants greater than 10 MWp and aggregated of medium size plants (greater than 1 MWp). These flexible solar generators must be dedicated to the grid regulation process and controlled directly by the Italian TSO that uses a fraction of their production to compensate the forecast errors of the entire Italian solar generation. From Figure 5c appears that using a P50 the maximum power that should be curtailed is 0.19 MW per MWp of installed capacity. To be able to curtail this power and correct the Italian PV forecast error the capacity of the flexible PV systems dedicated to solar regulation should be at least 0.19 of the Italian PV capacity (19 GWp). Thus, to achieve the target imbalance of 12.2 TWh/yr at the current penetration level, 3.7 GWp of flexible PV systems should be dedicated to solar regulation. The energy curtailment of these flexible plants will be sensibly higher than the energy curtailment reported in Figure 5c, since they have to regulate not only their
imbalance but also the imbalance of the entire Italian distributed PV fleet (that is not flexible). It can be easily computed that the 19% of the energy generated by this 3.7 GWp of flexible systems (corresponding to the 4.4% of the entire Italian solar generation) would be operationally curtailed by the Italian TSO to match the predicted total PV generation profile for Italy. Considering that no storage has to be installed, the imbalance costs of using this optimized solar regulation (that include the curtailed energy of this 3.7 GWp of flexible PV systems) will be 778 M€/yr. Thus, the strategy #3 can lead to a reduction of imbalance volume and cost of 29.5% and 38% respectively.
Figure 5: Net-load imbalance costs for each forecast quantile (a); mean PV imbalance (MAE) of each quantile forecast (b); energy curtailment of the Italian solar generation required for each quantile forecast (c) at 7% of solar penetration and BESS cost of 600 $/kWh. It should be remarked, that to reach the imbalance target between 2016-2020, the Italian TSO just need to turn in to flexible 3.7 GWp of 4.1 GWp PV plants (> 1 MW) that are already installed and then by controlling the smart inverters to operate pro-active curtailment without the need of any storage installation. 5.2 Imbalance at future levels of PV penetration We compute the imbalance volumes and costs due to the increase of the solar penetration through equation 1, using the “state of the art” forecast and the solar capacity reported in Figure 2. Then, for each BESS cost of the learning curve in Figure 2, we find the cost-optimal size of the flexible PV systems needed to fix the imbalance volume to the target
4

value of 12.2 TWh/yr. Thus, for each year (corresponding to a specific BESS cost) we compute the flexible PV / storage capacities for solar regulation that leads to the minimum imbalance costs (Figure 6a). Figure 6b reports the new flexible PV and the additional BESS capacities needed to reach the target capacities of Figure 6a. We observe that the storage capacity reaches a maximum in 2030. This means that most of the BESS capacities must be installed before this year while in the following years a repowering/revamping of batteries will be more than enough. On the other hand, the scenario reported in Figure 6a shows that the flexible PV capacity dedicated to the solar regulation should continuously increase during the years. It should be remarked that, from 2025 onward, the TSO should use a strong under forecast (P20) that implies the curtailment of the 25% of the energy generated by the flexible plants dedicated to solar regulation.
Figure 6: Flexible PV and BESS capacities of the PV plants that should be used for solar imbalance regulation to limit the net load imbalance at 12.2 TWh/yr: target capacity values (a), new capacity value that should be installed to reach the target (b). In brackets, the energy curtailment of the flexible plants dedicated to solar regulation is reported. Figure 7 summarize the main results of this study. Figure 7a shows the impact of solar penetration on the imbalance and the effects of the proposed strategies. With “state of the art” forecasts applied within each market zone the imbalance would increase from the current 4.9% of the annual load to 6.5% in 2030 and 12.6% in 2060. This alarming imbalance growth can be strongly limited by enlarging the PV forecast footprint from individual market zones to the entire country. This would reduce the imbalance volumes to 4.9% in 2030 and to 7.7% in 2060. Finally, if the flexible PV solar regulation strategy is applied, the imbalance volumes can be limited to 4% regardless of solar penetration. In practice, flexible plants would be managed to correct solar forecast errors to maintain the imbalance at low fixed level at any possible PV penetration value. Figure 7b reports the imbalance costs that the proposed strategies could achieve. Commensurately to the imbalance volumes, community-borne imbalance costs increase dramatically with solar penetration. The first two strategies (state-of-the-art forecast and enlargement of forecast zones to the entire country) reduces these costs by
15.6% in 2016, by 22.3% in 2030, and by 34% in 2060. The third strategy (solar regulation via flexible PV) reduces these costs by 25% in 2016, by 25% in 2030, and by 56% in 2060. Importantly, the imbalance costs of the solar regulation strategy embed the cost of curtailment as well as storage investment and exploitation costs. For this reason, flexible PV imbalance costs do exceed the imbalance costs achieved with the second strategy in 2025 and 2030, when the majority of the storage would have been installed. In any case, the solar regulation imbalance costs are always lower than the 2016 costs derived by the use of the TSO net load forecast model.
Figure 7: Imbalance volumes (a) and costs scenario (b) (in bracket the percentage of imbalance with respect the load). 4 CONCLUSIONS The Integrated National Plan for Energy and Climate (PNIEC 2018) requires that the PV capacity should grow from the current 20 GWp to 62 GWp at 2030. In this work, we propose and test three strategies to limit the alarming imbalance growth induced by a massive solar generation. We demonstrated that the accuracy of the net load forecast model currently used by the Italian TSO can be improved by a more accurate, state-of-the-art PV power forecast method (strategy #1). We also showed how the expansion of the transmission grid to manage the power generation from individual zones to the entire country would not only reduce congestions and constraints on production capacity between the market zones (as required by the National Energy Strategy plan) but also remarkably increases the PV power forecast accuracy hence decrease the net load forecast errors (strategy #2). As a result, this two-pronged strategies could effectively limit the imbalance impact of PV generation by reducing imbalance volumes and costs at current and future solar penetration levels. We also demonstrated how flexible PV plants directly controlled by the Italian TSO can effectively provide services for solar imbalance regulation at affordable costs (these services are currently provided mainly by combined
5

cycle power plants - CCGT-). We have assumed that flexible PV plants would include utility-scale systems with capacity greater than 10 MWp as well as ensemble of medium scale plants with capacity greater than 1 MWp managed by Aggregators. This third strategy can eliminate the effect on the Italian imbalance of the solar induced imbalance resulting from increased PV penetration. We showed how these flexible PV plants (used for solar regulation) can be cost-optimally dimensioned to limit the imbalance volume to a target value regardless the PV installed capacity. Applying the proposed strategies will eliminate the need to improve the TSO spinning reserve with new CCGT just by converting GWp of PV into flexible PV and we will limit the “socialized” imbalance costs below the current one, even at high solar penetration levels. 5 ACKNOWLEDGMENT Marco Pierro thanks the Institute for Renewable Energy, Eurac Research, Bolzano, Italy for supporting his Phd. David Moser thanks the financial support from the ERDF Project INTEGRIDS FESR1042 (Province of Südtirol). Thank you to IDEAM S.r.l. for providing the NWP data. 6 REFERENCES [1] D. Sandbag, "Agora Energiewende and Sandbag
(2019): The European Power Sector in 2018. Up-to-date analysis on the electricity transition.," 2019.
[2] Ministry of Enviroment, "SEN (Strategia Energetica Nazionale)," 2017. [Online]. Available: http://www.minambiente.it/sites/default/files/archivio/allegati/testo-integrale-sen-2017.pdf.
[3] Monitry of the Economic Development, "PINEC (Piano nazionale integrato per l’Energia e il Clima: inviata la proposta a Bruxelles)," 2018. [Online]. Available: https://www.mise.gov.it/images/stories/documenti/Proposta_di_Piano_Nazionale_Integrato_per_Energia_e_il_Clima_Italiano.pdf.
[4] IEA, "Report IEA –PVPS T7-4: Potential for Building Integrated Photovoltaics. http://www.iea-pvps.org/index.php?id=9&eID=dam_frontend_push&docID=394," 2002.
[5] IRENA, "Electricity storage and renewables: Costs and markets to 2030," 2017.
[6] NREL, " Annual Technology Baseline. Golden, CO:," 2016.
[7] Terna Spa, 2016. [Online]. Available: download.terna.it/terna/0000/0732/38.PDF.
[8] M. Pierro, M. De Felice, E. Maggioni, A. Perotto, F. Spada, D. Moser and C. Cornaro, "Photovoltaic generation forecast for power transmission scheduling: A real case study," Solar Energy , vol. 174, p. 976–990, 2018.
[9] M. Pierro, M. De Felice, E. Maggioni, A. Perotto, F. Spada, D. Moser and C. Cornaro, "Deterministic and Stochastic Approaches for Day-Ahead Solar Power Forecasting," Journal of Solar Energy Engineering, vol. 139 (2) , p. 021010, 2016b.
[10] M. Pierro, M. De Felice, E. Maggioni, D. Moser, A. Perotto, F. Spada and C. Cornaro, "Data-driven upscaling methods for regional photovoltaic power
estimation and forecast using satellite and numerical weather prediction data," Solar Energy, vol. 158, pp. 1026-1038, 2017.
[11] E. Lorenz, T. Scheidsteger and J. Hurka , "Regional PV power prediction for improved grid integration," Progress in Photovoltaics: Research and Applications, vol. 19, pp. 757-771, 2011.
[12] J. Fonseca, T. Oozeki, H. Ohtake, K. Shimose and T. K. Takashima, “Regional forecasts and smoothing effect of photovoltaic power generation in Japan: An approach with principal component analysis,” Renewable Energy, no. 68, pp. 403-413, 2014.
[13] J. Fonseca, T. Oozeki, H. Ohtake, T. Takashima and K. Ogimoto, "Regional forecasts of photovoltaic power generation according to different data availability scenarios: a study of four methods.," Progress in Photovoltaics: Research and Applications, vol. 23 (10), pp. 1203-1218, 2015.
[14] Terna Spa., "https://www.terna.it/it-it/sistemaelettrico/dispacciamento/datiesercizio/rapportomensile.aspx/Rapporto_mensile sul sistema elettico_gennaio2017," 2017(a). [Online].
6