Embed Size (px)
Citation preview

From End-of-Pipe Technology to Clean Technology: Effects of Environmental Regulation on Technological Change in the Chlor-Alkali
Industry in Japan and Western Europe
PROEFSCHRIFT
ter verkrijging van de graad van doctor aan de Universiteit Maastricht,
op gezag van de Rector Magnificus, Prof. dr. A.C. Nieuwenhuijzen Kruseman volgens het besluit van het College van Decanen, in het openbaar te verdedigen
op donderdag 8 mei 2003 om 14.00 uur
Masaru Yarime

Promotor:
Prof. Dr. L.K. Mytelka
Beoordelingscommissie:
Prof. Dr. R. Cowan (voorzitter)
Dr. R. Kemp
Professor W.E. Steinmueller (SPRU, University of Sussex)
The following institution sponsored this PhD thesis research:
United Nations University Institute for New Technologies,
Maastricht, The Netherlands

Acknowledgement
Writing this Ph.D. dissertation was a long process, and its completion owes a great deal to
many people. I would like to express my gratitude to all the people working at the United
Nations University Institute for New Technologies (UNU/INTECH) and Maastricht
Economic Research Institute on Innovation and Technology (MERIT) in Maastricht. I’m
particularly grateful to Professor Lynn Mytelka, who provided me with valuable guidance and
warm encouragement without which I could not have completed this dissertation. I appreciate
very much comments and suggestions of Dr. Anthony Bartzokas, which improved this
dissertation greatly. I would also like to thank Ms. Corien Gijsbers for her help kindly given
to me in various occasions since I first came to Maastricht in 1995. Professor Yasunori Baba
of the University of Tokyo introduced me to the economics of technological change when I
was a senior student of chemical engineering. I’m grateful to him for having orientated me to
this exciting field. In the process of writing this dissertation, different institutions provided
me with financial support. I gratefully acknowledge the Graduate Scholarship of Matsuo
Foundation, Ph.D. Fellowship of the United Nations University Institute of Advanced Studies
(UNU/IAS), and the Huygens Scholarship of the Netherlands Organization for International
Cooperation in Higher Education (NUFFIC). Finally, I would like to thank my family for
having encouraged and supported me during the long course of my learning in Japan, the
United States, and Europe.
3


Table of Contents
LIST OF FIGURES ................................................................................................................. 8
LIST OF TABLES ................................................................................................................. 11
1. INTRODUCTION.......................................................................................................... 17
1.1 PROBLEM AND RESEARCH METHODS ........................................................................ 17
1.2 OUTLINE OF THE THESIS............................................................................................ 23
2. ANALYTICAL FRAMEWORK FOR THE EFFECTS OF ENVIRONMENTAL
REGULATION ON TECHNOLOGICAL CHANGE........................................................ 28
2.1 PREVIOUS STUDIES OF THE EFFECTS OF ENVIRONMENTAL REGULATION ON
TECHNOLOGICAL CHANGE .................................................................................................... 28
2.1.1 Theoretical Models............................................................................................... 28
2.1.2 Empirical Studies ................................................................................................. 42
2.2 TECHNOLOGIES FOR DEALING WITH EMISSIONS FROM CHEMICAL INDUSTRIES......... 46
2.2.1 End-of-Pipe Technology....................................................................................... 48
2.2.2 Clean Technology................................................................................................. 51
2.3 DIVERGING EFFECTS OF ENVIRONMENTAL REGULATIONS ON TECHNOLOGICAL
CHANGE ................................................................................................................................ 56
2.3.1 Environmental Policy Making under Uncertainty ............................................... 56
2.3.2 Choice between the End-of-Pipe Technology and the Clean Technology ........... 59
2.3.3 Technological Progress through R&D and Learning.......................................... 64
2.4 CONCLUSION............................................................................................................. 75
APPENDIX.............................................................................................................................. 78
3. TECHNOLOGICAL BACKGROUND OF THE CHLOR-ALKALI INDUSTRY. 81
3.1 PRODUCTION OF CHLOR-ALKALI PRODUCTS............................................................. 81
3.1.1 Chlorine and Caustic Soda .................................................................................. 81
3.1.2 Production............................................................................................................ 85
3.2 THREE DOMINANT TECHNOLOGIES FOR CHLOR-ALKALI PRODUCTION: MERCURY
PROCESS, DIAPHRAGM PROCESS, AND ION EXCHANGE MEMBRANE PROCESS ...................... 87
5

3.3 TECHNOLOGICAL CHANGE PRIOR TO THE EFFECTS OF ENVIRONMENTAL
REGULATIONS ....................................................................................................................... 91
3.3.1 Development of the Mercury Process .................................................................. 91
3.3.2 Development of the Diaphragm Process.............................................................. 99
3.3.3 Diffusion of the Mercury Process in Western Europe and Japan...................... 106
3.4 CONCLUSION........................................................................................................... 120
APPENDIX............................................................................................................................ 121
4. ENVIRONMENTAL REGULATION AND TECHNOLOGICAL CHANGE IN
THE JAPANESE CHLOR-ALKALI INDUSTRY ........................................................... 123
4.1 REGULATORY DECISION ON THE PHASE OUT OF THE MERCURY PROCESS............... 123
4.2 CONVERSION OF THE MERCURY PROCESS TO THE DIAPHRAGM PROCESS................ 127
4.3 INTERRUPTION OF THE PROCESS CONVERSION SCHEDULE AND EVALUATION OF THE
ION EXCHANGE MEMBRANE PROCESS................................................................................. 135
4.4 TECHNOLOGICAL DEVELOPMENT OF THE ION EXCHANGE MEMBRANE PROCESS .... 138
4.4.1 Characteristics of the Ion Exchange Membrane Process .................................. 138
4.4.2 Patents on Technologies for Chlor-Alkali Production....................................... 145
4.4.3 Technological Developments of the Ion Exchange Membrane Process by
Innovative Companies in Japan ..................................................................................... 151
4.5 MODIFICATION OF REGULATORY SCHEDULE AND ADOPTION OF THE ION EXCHANGE
MEMBRANE PROCESS .......................................................................................................... 184
4.6 COSTLY TRANSITION FROM THE MERCURY PROCESS TO THE DIAPHRAGM PROCESS
AND THEN TO THE ION EXCHANGE MEMBRANE PROCESS.................................................... 189
4.7 CONCLUSION........................................................................................................... 194
APPENDIX............................................................................................................................ 197
5. ENVIRONMENTAL REGULATION AND TECHNOLOGICAL CHANGE IN
THE WESTERN EUROPEAN CHLOR-ALKALI INDUSTRY .................................... 215
5.1 IMPOSITION OF EMISSION STANDARDS ON MERCURY ............................................. 215
5.1.1 Paris Commission .............................................................................................. 215
5.1.2 European Community......................................................................................... 225
5.2 REDUCTION OF MERCURY EMISSIONS WITH END-OF-PIPE TECHNOLOGIES ............. 233
5.2.1 Patents on Chlor-Alkali Production Technologies ............................................ 233
6

5.2.2 Development of End-of-Pipe Technologies for the Reduction of Mercury
Emissions........................................................................................................................ 240
5.2.3 Continued Use of the Mercury Process with End-of-Pipe Technologies........... 250
5.3 DELAYED DEVELOPMENT OF TECHNOLOGIES FOR THE ION EXCHANGE MEMBRANE
PROCESS.............................................................................................................................. 253
5.4 SLOW DIFFUSION OF THE ION EXCHANGE MEMBRANE PROCESS............................. 269
5.4.1 Availability of Information on the Ion Exchange Membrane Process............... 269
5.4.2 Profitability of the Adoption of the Ion Exchange Membrane Process ............. 272
5.4.3 Long Lifetime of Chlor-Alkali Plants Based on the Mercury Process............... 281
5.5 CONCLUSION........................................................................................................... 289
APPENDIX............................................................................................................................ 294
6. SUMMARY AND CONCLUSION............................................................................. 319
APPENDIX. EFFECTS OF ENVIRONMENTAL REGULATION ON
TECHNOLOGICAL CHANGE OF THE CHEMICAL PROCESSES FOR CHLOR-
ALKALI PRODUCTION.................................................................................................... 334
A.1 LEBLANC PROCESS ....................................................................................................... 334
A.1.1 Hydrogen Chloride Emissions.............................................................................. 337
A.1.2 Tank Waste............................................................................................................ 340
A.1.3 Nitrogen Oxides Emissions................................................................................... 342
A.1.4 Improvement of the Leblanc Process through End-of-Pipe Technologies ........... 343
A.2 AMMONIA SODA PROCESS ............................................................................................ 344
A.3 CONCLUDING REMARK................................................................................................. 351
REFERENCES ..................................................................................................................... 353
SAMENVATTING............................................................................................................... 398
CURRICULUM VITAE ...................................................................................................... 403
7

List of Figures
FIGURE 2-1 ALLOCATION OF R&D BETWEEN POLLUTION ABATEMENT TECHNOLOGY AND
OUTPUT PRODUCTION TECHNOLOGY ................................................................................ 30
FIGURE 2-2 INCENTIVES TO INNOVATE WITHOUT DIFFUSION, FOLLOWED BY POLICY
ADJUSTMENT..................................................................................................................... 32
FIGURE 2-3 INCENTIVES TO INNOVATE WITH DIFFUSION AND POLICY ADJUSTMENT ................ 34
FIGURE 2-4 INCENTIVES TO INNOVATION WITH THE POSSIBILITY OF IMITATION AND NO POLICY
ADJUSTMENT..................................................................................................................... 39
FIGURE 2-5 END-OF-PIPE TECHNOLOGY AND CLEAN TECHNOLOGY APPLIED IN CHEMICAL
PROCESS INDUSTRIES ........................................................................................................ 47
FIGURE 2-6 POLLUTION ABATEMENT COSTS WITH END-OF-PIPE AND CLEAN TECHNOLOGIES . 60
FIGURE 2-7 POLLUTION ABATEMENT COSTS WITH IMPROVEMENTS IN THE END-OF-PIPE
TECHNOLOGY AND THE CLEAN TECHNOLOGY .................................................................. 66
FIGURE 2-8 OPERATING COSTS WITH THE END-OF-PIPE TECHNOLOGY AND THE CLEAN
TECHNOLOGY.................................................................................................................... 68
FIGURE 2-9 PRODUCTION COSTS WITH THE END-OF-PIPE TECHNOLOGY AND THE CLEAN
TECHNOLOGY.................................................................................................................... 70
FIGURE 2-10 COST SAVING WITH THE PROCESS CONVERSION FROM THE ORIGINAL
TECHNOLOGY EQUIPPED WITH THE END-OF-PIPE TECHNOLOGY TO THE EFFICIENT CLEAN
TECHNOLOGY.................................................................................................................... 73
FIGURE 2-11 DIVERGING EFFECTS OF ENVIRONMENTAL REGULATIONS ON TECHNOLOGICAL
CHANGE ............................................................................................................................ 75
FIGURE 3-1 EVOLUTION OF PRODUCTION TECHNOLOGIES IN THE CHLOR-ALKALI INDUSTRY .. 88
FIGURE 3-2 SHARES OF THE MERCURY, DIAPHRAGM, AND ION EXCHANGE MEMBRANE
PROCESSES IN WESTERN EUROPE, THE UNITED STATES, AND JAPAN IN 1998 ................... 90
FIGURE 3-3 FLOW DIAGRAM OF THE MERCURY PROCESS ......................................................... 92
FIGURE 3-4 MERCURY ELECTROLYZER AND AMALGAM DECOMPOSER..................................... 94
FIGURE 3-5 FLOW DIAGRAM OF THE DIAPHRAGM PROCESS.................................................... 100
FIGURE 3-6 DIAPHRAGM ELECTROLYZER................................................................................ 102
FIGURE 3-7 SHARES OF THE MERCURY AND THE DIAPHRAGM PROCESSES IN WESTERN EUROPE,
THE UNITED STATES, AND JAPAN IN 1972 ....................................................................... 119
8

FIGURE 4-1 FLOW DIAGRAM OF THE ION EXCHANGE MEMBRANE PROCESS ........................... 140
FIGURE 4-2 ION EXCHANGE MEMBRANE ELECTROLYZER....................................................... 142
FIGURE 4-3 JAPANESE PATENTS SUCCESSFULLY APPLIED FOR BY JAPAN COMPANIES ON THE
MERCURY, DIAPHRAGM, AND ION EXCHANGE MEMBRANE PROCESSES ......................... 147
FIGURE 4-4 R&D EXPENDITURES AND PERSONNEL FOR THE ION EXCHANGE MEMBRANE
PROCESS AT ASAHI CHEMICAL INDUSTRY....................................................................... 155
FIGURE 4-5 R&D PERSONNEL FOR THE ION EXCHANGE MEMBRANE PROCESS AT ASAHI GLASS
........................................................................................................................................ 160
FIGURE 4-6 TECHNOLOGICAL DEVELOPMENTS OF CHLOR-ALKALI PRODUCTION PROCESSES BY
JAPANESE COMPANIES .................................................................................................... 174
FIGURE 4-7 SUPPLY OF THE DIAPHRAGM AND THE ION EXCHANGE MEMBRANE PROCESSES BY
JAPANESE FIRMS ............................................................................................................. 177
FIGURE 4-8 ENERGY CONSUMPTION OF THE MERCURY, DIAPHRAGM, AND ION EXCHANGE
MEMBRANE PROCESSES .................................................................................................. 182
FIGURE 4-9 PRODUCTION CAPACITIES OF THE MERCURY, DIAPHRAGM, AND ION EXCHANGE
MEMBRANE PROCESSES IN THE JAPANESE CHLOR-ALKALI INDUSTRY............................ 188
FIGURE 4-10 OPERATING PERIOD OF THE DIAPHRAGM PROCESS AT CHLOR-ALKALI PLANTS IN
JAPAN.............................................................................................................................. 190
FIGURE 5-1 US PATENTS SUCCESSFULLY APPLIED BY WESTERN EUROPEAN FIRMS ON THE
MERCURY AND ION EXCHANGE MEMBRANE PROCESSES ................................................ 236
FIGURE 5-2 US PATENTS SUCCESSFULLY APPLIED FOR BY JAPANESE COMPANIES ON
TECHNOLOGIES RELATED TO THE MERCURY PROCESS AND THE ION EXCHANGE
MEMBRANE PROCESS...................................................................................................... 237
FIGURE 5-3 END-OF-PIPE TECHNOLOGIES DEVELOPED TO REDUCE MERCURY EMISSIONS..... 249
FIGURE 5-4 MERCURY EMISSIONS TO WATER, PRODUCTS, AND AIR FROM CHLOR-ALKALI
PLANTS IN WESTERN EUROPE ......................................................................................... 250
FIGURE 5-5 PRODUCTION CAPACITIES BASED ON THE MERCURY, DIAPHRAGM, AND ION
EXCHANGE MEMBRANE PROCESSES IN THE WESTERN EUROPEAN CHLOR-ALKALI
INDUSTRY........................................................................................................................ 252
FIGURE 5-6 TECHNOLOGICAL DEVELOPMENTS BY COMPANIES IN WESTERN EUROPE ............ 263
FIGURE 5-7 SUPPLY OF THE MERCURY AND THE ION EXCHANGE MEMBRANE PROCESSES BY
WESTERN EUROPEAN FIRMS ........................................................................................... 265
9

FIGURE 5-8 SUPPLY OF THE ION EXCHANGE MEMBRANE PROCESS BY JAPANESE AND WESTERN
EUROPEAN FIRMS............................................................................................................ 268
FIGURE 5-9 COST SAVING FROM THE CONVERSION FROM THE MERCURY PROCESS TO THE ION
EXCHANGE MEMBRANE PROCESS AND ANNUALIZED INVESTMENT COST....................... 280
FIGURE 5-10 OPERATING PERIOD OF THE MERCURY PROCESS BEFORE ITS CONVERSION TO THE
ION EXCHANGE MEMBRANE PROCESS IN THE WESTERN EUROPEAN CHLOR-ALKALI
INDUSTRY........................................................................................................................ 282
FIGURE 5-11 OPERATING PERIOD OF THE EXISTING CHLOR-ALKALI PLANTS BASED ON THE
MERCURY PROCESS IN WESTERN EUROPE ...................................................................... 284
FIGURE 5-12 INSTALLATION OF THE MERCURY, DIAPHRAGM, AND ION EXCHANGE MEMBRANE
PROCESSES IN THE WORLD.............................................................................................. 287
FIGURE 5-13 SHARES OF THE MERCURY, DIAPHRAGM, AND ION EXCHANGE MEMBRANE
PROCESSES IN THE WORLD.............................................................................................. 288
FIGURE 6-1 DIVERGING IMPACTS OF ENVIRONMENTAL REGULATIONS ON TECHNOLOGICAL
CHANGE IN THE CHLOR-ALKALI INDUSTRY IN JAPAN AND WESTERN EUROPE ............... 323
10

List of Tables
TABLE 3-1 APPLICATIONS OF CHLORINE IN JAPAN.................................................................... 81
TABLE 3-2 APPLICATIONS OF CHLORINE IN WESTERN EUROPE................................................. 82
TABLE 3-3 APPLICATIONS OF CAUSTIC SODA IN JAPAN ............................................................ 83
TABLE 3-4 APPLICATIONS OF CAUSTIC SODA IN WESTERN EUROPE ......................................... 84
TABLE 3-5 CHLOR-ALKALI PRODUCTION CAPACITIES IN THE WORLD...................................... 85
TABLE 3-6 CHLOR-ALKALI PRODUCTION CAPACITIES IN WESTERN EUROPE............................ 85
TABLE 3-7 CHLOR-ALKALI PLANTS IN WESTERN EUROPE AND JAPAN ..................................... 86
TABLE 3-8 MAJOR TECHNOLOGIES OF THE MERCURY PROCESS IN THE EARLY 1970S .............. 98
TABLE 3-9 MAJOR TECHNOLOGIES OF THE DIAPHRAGM PROCESS IN THE EARLY 1970S......... 105
TABLE 3-10 CHLOR-ALKALI PRODUCTION PROCESSES IN WESTERN EUROPE IN 1957............ 107
TABLE 3-11 CHLOR-ALKALI PRODUCTION PROCESSES IN WESTERN EUROPE IN 1972............ 108
TABLE 3-12 SHARES OF THE CHLOR-ALKALI PRODUCTION PROCESSES IN WESTERN EUROPEAN
COUNTRIES IN 1972......................................................................................................... 108
TABLE 3-13 CHLOR-ALKALI PRODUCTION PROCESSES IN THE UNITED STATES IN 1946......... 109
TABLE 3-14 TRENDS IN THE SHARES OF THE CHLOR-ALKALI PRODUCTION PROCESSES IN THE
UNITED STATES............................................................................................................... 110
TABLE 3-15 CHLOR-ALKALI PRODUCTION PROCESSES IN THE UNITED STATES IN 1965......... 111
TABLE 3-16 CHLOR-ALKALI PRODUCTION PROCESSES IN JAPAN IN 1949............................... 112
TABLE 3-17 SHARES OF THE CHLOR-ALKALI PRODUCTION PROCESSES IN JAPAN................... 112
TABLE 3-18 CHLOR-ALKALI PRODUCTION TECHNOLOGIES IN JAPAN IN 1972 ........................ 113
TABLE 3-19 WORLD PRODUCTION OF MERCURY IN THE MIDDLE OF THE 1960S ..................... 115
TABLE 3-20 WORLD PRODUCTION OF ASBESTOS IN THE LATE 1930S ..................................... 115
TABLE 3-21 IMPORTS, EXPORTS, PRODUCTION, AND CONSUMPTION OF ASBESTOS IN THE
UNITED STATES IN THE LATE 1930S................................................................................ 116
TABLE 3-22 PRODUCTION OF SALT IN WEST GERMANY AND THE UNITED STATES IN THE EARLY
1950S .............................................................................................................................. 117
TABLE 3-23 WORLD PRODUCTION OF RAYON......................................................................... 118
TABLE 3-24 SHARES OF CHLOR-ALKALI PRODUCTION CAPACITIES BASED ON THE MERCURY,
DIAPHRAGM, AND ION EXCHANGE MEMBRANE PROCESS IN WESTERN EUROPE, THE
UNITED STATES, AND JAPAN IN 1998 .............................................................................. 121
11
TABLE 3-25 SHARES OF CHLOR-ALKALI PRODUCTION CAPACITIES BASED ON THE MERCURY
AND THE DIAPHRAGM PROCESSES IN WESTERN EUROPE, THE UNITED STATES, AND JAPAN
IN 1972............................................................................................................................ 122
TABLE 4-1 CHRONOLOGY OF ENVIRONMENTAL REGULATIONS ON MERCURY EMISSIONS FROM
CHLOR-ALKALI PLANTS IN JAPAN................................................................................... 125
TABLE 4-2 MEMBERS OF THE COMMITTEE FOR THE PROMOTION OF PROCESS CONVERSIONS IN
THE SODA INDUSTRY....................................................................................................... 127
TABLE 4-3 TAX REDUCTIONS FOR THE PROCESS CONVERSION IN THE CHLOR-ALKALI INDUSTRY
........................................................................................................................................ 128
TABLE 4-4 TECHNOLOGIES FOR THE DIAPHRAGM PROCESS ADOPTED DURING THE FIRST PHASE
OF THE PROCESS CONVERSION PROGRAM ....................................................................... 130
TABLE 4-5 QUALITY OF CAUSTIC SODA PRODUCED WITH THE MERCURY PROCESS AND THE
DIAPHRAGM PROCESS ..................................................................................................... 132
TABLE 4-6 ELECTRICITY PRICES IN JAPAN .............................................................................. 133
TABLE 4-7 EXCHANGE OF CAUSTIC SODA BETWEEN THE MERCURY PROCESS AND DIAPHRAGM
PROCESS OPERATORS...................................................................................................... 134
TABLE 4-8 MEMBERS OF THE EXPERT COMMITTEE FOR TECHNICAL EVALUATION OF THE ION
EXCHANGE MEMBRANE PROCESS ................................................................................... 136
TABLE 4-9 JAPANESE PATENTS SUCCESSFULLY APPLIED BY JAPANESE COMPANIES ON THE
DIAPHRAGM PROCESS AND THE ION EXCHANGE MEMBRANE PROCESS (I)...................... 149
TABLE 4-10 JAPANESE PATENTS SUCCESSFULLY APPLIED BY JAPANESE COMPANIES ON THE
DIAPHRAGM PROCESS AND THE ION EXCHANGE MEMBRANE PROCESS (II) .................... 149
TABLE 4-11 CHRONOLOGY OF TECHNOLOGICAL DEVELOPMENTS RELATED TO THE ION
EXCHANGE MEMBRANE PROCESS AT ASAHI CHEMICAL INDUSTRY ................................ 154
TABLE 4-12 CHRONOLOGY OF TECHNOLOGICAL DEVELOPMENTS RELATED TO THE ION
EXCHANGE MEMBRANE PROCESS AT ASAHI GLASS........................................................ 158
TABLE 4-13 CHRONOLOGY OF TECHNOLOGICAL DEVELOPMENTS RELATED TO THE ION
EXCHANGE MEMBRANE PROCESS AT TOKUYAMA SODA................................................. 162
TABLE 4-14 CHRONOLOGY OF TECHNOLOGICAL DEVELOPMENTS RELATED TO THE ION
EXCHANGE MEMBRANE PROCESS AT CEC...................................................................... 166
TABLE 4-15 TECHNOLOGIES FOR CHLOR-ALKALI PRODUCTION DEVELOPED BY INNOVATIVE
COMPANIES IN JAPAN...................................................................................................... 170
TABLE 4-16 USE OF ION EXCHANGE MEMBRANES FOR SALT PRODUCTION IN JAPAN ............. 172
12

TABLE 4-17 SUPPLY OF THE DIAPHRAGM AND ION EXCHANGE MEMBRANE PROCESSES BY
INNOVATIVE COMPANIES IN JAPAN ................................................................................. 178
TABLE 4-18 ELECTRIC POWER CONSUMPTION OF THE ION EXCHANGE MEMBRANE PROCESS
TECHNOLOGIES DEVELOPED BY JAPANESE COMPANIES.................................................. 180
TABLE 4-19 ADOPTION OF THE ION EXCHANGE MEMBRANE PROCESS BY CHLOR-ALKALI
PRODUCERS IN JAPAN...................................................................................................... 185
TABLE 4-20 INVESTMENT COSTS FOR THE PROCESS CONVERSION IN THE JAPANESE CHLOR-
ALKALI INDUSTRY .......................................................................................................... 191
TABLE 4-21 SOURCES OF INVESTMENT CAPITAL FOR THE FIRST PHASE OF THE PROCESS
CONVERSION................................................................................................................... 193
TABLE 4-22 LIST OF CHLOR-ALKALI PLANTS IN JAPAN .......................................................... 199
TABLE 4-23 JAPANESE PATENTS ON THE MERCURY, DIAPHRAGM, AND ION EXCHANGE
MEMBRANE PROCESSES GRANTED TO JAPANESE FIRMS ................................................. 200
TABLE 4-24 ENERGY CONSUMPTION OF THE MERCURY, DIAPHRAGM, AND ION EXCHANGE
MEMBRANE PROCESSES .................................................................................................. 201
TABLE 4-25 PRODUCTION CAPACITIES OF THE MERCURY PROCESS, DIAPHRAGM PROCESS, AND
ION EXCHANGE MEMBRANE PROCESS IN THE JAPANESE CHLOR-ALKALI INDUSTRY...... 201
TABLE 4-26 SUPPLY OF THE DIAPHRAGM AND ION EXCHANGE MEMBRANE PROCESSES BY
JAPANESE FIRMS ............................................................................................................. 202
TABLE 4-27 SUPPLY LIST OF THE ION EXCHANGE MEMBRANE PROCESS BY ASAHI CHEMICAL
INDUSTRY........................................................................................................................ 203
TABLE 4-28 SUPPLY LIST OF THE ION EXCHANGE MEMBRANE PROCESS BY ASAHI GLASS .... 205
TABLE 4-29 SUPPLY LIST OF THE ION EXCHANGE MEMBRANE PROCESS BY TOKUYAMA SODA
........................................................................................................................................ 208
TABLE 4-30 SUPPLY LIST OF THE DIAPHRAGM PROCESS BY CEC........................................... 208
TABLE 4-31 SUPPLY LIST OF THE CME ION EXCHANGE MEMBRANE PROCESS BY CEC......... 209
TABLE 4-32 SUPPLY LIST OF THE MBC ION EXCHANGE MEMBRANE PROCESS BY CEC......... 211
TABLE 4-33 SUPPLY LIST OF THE BITAC ION EXCHANGE MEMBRANE PROCESS BY CEC...... 212
TABLE 4-34 OPERATING PERIOD OF THE DIAPHRAGM PROCESS AT CHLOR-ALKALI PLANTS IN
JAPAN.............................................................................................................................. 213
TABLE 5-1 EMISSIONS OF MERCURY IN EUROPEAN COUNTRIES IN THE 1970S ........................ 218
13
TABLE 5-2 PARCOM DECISION 80/2 ON LIMIT VALUES FOR MERCURY EMISSIONS IN WATER
FROM EXISTING AND NEW BRINE RECIRCULATION CHLORALKALI PLANTS (EXIT OF THE
PURIFICATION PLANT)...................................................................................................... 220
TABLE 5-3 PARCOM DECISION 81/1 ON LIMIT VALUES FOR EXISTING WASTE BRINE CHLOR-
ALKALI PLANTS............................................................................................................... 221
TABLE 5-4 PARCOM DECISION 81/2 ON LIMIT VALUES FOR EXISTING BRINE RECIRCULATION
CHLOR-ALKALI PLANTS (EXIT OF THE FACTORY SITE) .................................................... 222
TABLE 5-5 PARCOM RECOMMENDATION 85/1 ON LIMIT VALUES FOR MERCURY EMISSIONS IN
WATER FROM EXISTING BRINE RECIRCULATION CHLOR-ALKALI PLANTS (EXIT OF
FACTORY SITE) ................................................................................................................ 222
TABLE 5-6 PARCOM DECISION 82/1 ON NEW CHLORALKALI PLANTS USING MERCURY CELLS
........................................................................................................................................ 225
TABLE 5-7 LIMIT VALUES FOR MERCURY DISCHARGES BY THE CHLOR-ALKALI INDUSTRY IN
THE COUNCIL DIRECTIVE 82/176/EEC............................................................................ 227
TABLE 5-8 QUALITY OBJECTIVES FOR MERCURY DISCHARGES BY THE CHLOR-ALKALI
INDUSTRY IN THE COUNCIL DIRECTIVE 82/176/EEC ...................................................... 228
TABLE 5-9 ENVIRONMENTAL REGULATIONS ON MERCURY EMISSIONS FROM THE CHLOR-
ALKALI PLANTS IN WESTERN EUROPE ............................................................................ 231
TABLE 5-10 US PATENTS SUCCESSFULLY APPLIED BY WESTERN EUROPEAN COMPANIES ON
TECHNOLOGIES RELATED TO THE MERCURY PROCESS AND THE ION EXCHANGE
MEMBRANE PROCESS...................................................................................................... 239
TABLE 5-11 US PATENTS SUCCESSFULLY APPLIED BY COMPANIES IN THE WESTERN EUROPEAN
CHLOR-ALKALI INDUSTRY ON TECHNOLOGIES RELATED TO THE MERCURY PROCESS ... 241
TABLE 5-12 TECHNOLOGICAL DEVELOPMENT OF THE ION EXCHANGE MEMBRANE PROCESS AT
ICI .................................................................................................................................. 255
TABLE 5-13 TECHNOLOGICAL DEVELOPMENT OF THE ION EXCHANGE MEMBRANE PROCESS AT
UHDE .............................................................................................................................. 257
TABLE 5-14 TECHNOLOGICAL DEVELOPMENT OF THE ION EXCHANGE MEMBRANE PROCESS AT
DE NORA......................................................................................................................... 259
TABLE 5-15 TECHNOLOGIES DEVELOPED BY COMPANIES IN WESTERN EUROPE..................... 261
TABLE 5-16 SUPPLY OF THE MERCURY AND THE ION EXCHANGE MEMBRANE PROCESSES BY
INNOVATIVE COMPANIES IN WESTERN EUROPE .............................................................. 266
14

TABLE 5-17 PRESENTATIONS ON CHLOR-ALKALI PRODUCTION PROCESSES AT THE LONDON
INTERNATIONAL CHLORINE SYMPOSIUMS....................................................................... 270
TABLE 5-18 PARTICIPANTS IN THE LONDON INTERNATIONAL CHLORINE SYMPOSIUMS.......... 270
TABLE 5-19 LIST OF CHLOR-ALKALI PLANTS IN WESTERN EUROPE ....................................... 296
TABLE 5-20 CHLOR-ALKALI PLANTS IN WESTERN EUROPE WITHIN AND OUTSIDE THE
CATCHMENT AREA OF THE PARIS CONVENTION.............................................................. 298
TABLE 5-21 US PATENTS SUCCESSFULLY APPLIED BY WESTERN EUROPEAN COMPANIES ON
TECHNOLOGIES RELATED TO THE MERCURY PROCESS AND THE ION EXCHANGE
MEMBRANE PROCESS...................................................................................................... 299
TABLE 5-22 US PATENTS SUCCESSFULLY APPLIED FOR BY JAPANESE COMPANIES ON
TECHNOLOGIES RELATED TO THE MERCURY PROCESS AND THE ION EXCHANGE
MEMBRANE PROCESS...................................................................................................... 300
TABLE 5-23 MERCURY EMISSIONS TO WATER, PRODUCTS, AND AIR FROM CHLOR-ALKALI
PLANTS IN WESTERN EUROPE ......................................................................................... 301
TABLE 5-24 MERCURY EMISSIONS FROM INDIVIDUAL CHLOR-ALKALI PLANTS IN WESTERN
EUROPE IN 1999 .............................................................................................................. 302
TABLE 5-25 CHLOR-ALKALI PRODUCTION CAPACITIES BASED ON THE MERCURY PROCESS AND
THE NON-MERCURY PROCESSES IN WESTERN EUROPE................................................... 304
TABLE 5-26 INSTALLATIONS OF THE MERCURY AND THE ION EXCHANGE MEMBRANE
PROCESSES BY WESTERN EUROPEAN FIRMS ................................................................... 304
TABLE 5-27 SUPPLY OF THE ION EXCHANGE MEMBRANE PROCESS BY JAPANESE AND WESTERN
EUROPEAN FIRMS............................................................................................................ 305
TABLE 5-28 SUPPLY LIST OF THE ION EXCHANGE MEMBRANE PROCESS BY ICI..................... 306
TABLE 5-29 SUPPLY LIST OF THE ION EXCHANGE MEMBRANE PROCESS BY UHDE................. 308
TABLE 5-30 SUPPLY LIST OF THE ION EXCHANGE MEMBRANE PROCESS BY DE NORA........... 310
TABLE 5-31 NUMBER OF CELL ELEMENTS OF ELECTROLYZERS.............................................. 312
TABLE 5-32 COST SAVING FROM THE CONVERSION OF THE MERCURY PROCESS TO THE ION
EXCHANGE MEMBRANE PROCESS IN WESTERN EUROPE ................................................. 312
TABLE 5-33 START-UP YEAR OF THE MERCURY PROCESS AND THE ION EXCHANGE MEMBRANE
PROCESS IN WESTERN EUROPE ....................................................................................... 313
TABLE 5-34 OPERATING YEARS OF THE EXISTING CHLOR-ALKALI PLANTS BASED ON THE
MERCURY PROCESS IN WESTERN EUROPE ...................................................................... 315
15

TABLE 5-35 INSTALLATION OF THE MERCURY, DIAPHRAGM, AND ION EXCHANGE MEMBRANE
PROCESSES IN THE WORLD.............................................................................................. 317
TABLE 5-36 SHARES OF THE MERCURY, DIAPHRAGM, AND ION EXCHANGE MEMBRANE
PROCESSES IN THE WORLD.............................................................................................. 318
16

1. Introduction
1.1 Problem and Research Methods
Our standard of living has improved significantly through the development of a wide range of
industries in the past years. Along with numerous products useful in our life, the intensive
industrial development has at the same time produced undesirable emissions, which have
begun to impose serious burdens on the natural environment. Metals, for instance, have been
used so pervasively that currently there are few industrial operations which do not discharge
metal-containing emissions into the air, water, or soil. According to one estimate, world-wide
industrial emissions of nickel (Ni), cadmium (Cd), copper (Cu), zinc (Zn), and lead (Pb) into
the atmosphere averaged approximately 240, 380, 1,800, 17,000, and 22,000 tonnes per year,
respectively, between 1850 and 1900 (Nriagu, 1979). From the beginning of this century to
the 1980s, emissions of such toxic metals increased almost exponentially, roughly in parallel
to the rate of industrial growth. In the period between 1900 and 1980 the atmospheric
emission rates for Cu, Zn, Cd, Pb, and Ni rose by 6-, 8-, 8-, 9-, and 51-fold, respectively
(Nriagu, 1994).
As the natural environment does not possess an infinite carrying capacity, the current
industrial input rates are increasingly interfering with the limited capabilities of ecosystems to
cope with pollution. Responding to the serious concern on the ongoing contamination of air,
water, and soil with pollutants such as non-degradable toxic metals, regulations and policies
have been introduced by governments around the world for the aim of reducing emissions
from industrial activities. We could observe some sign of decline in emissions rates in recent
years, reflecting the efforts devoted for pollution abatement, particularly in countries located
in the industrialized world.
There is a growing concern, however, about negative impacts of increasingly tightened
environmental regulations on industry (Jaffe, Peterson, Portney, and Stavins, 1995). It is
argued that stringent environmental regulations will force firms to invest a considerable
amount of financial resources for compliance and that as a result their competitiveness will be
lost against those in countries where lax regulations are implemented. In other words,
environmental restrictions impose significant costs, slow productivity, and thereby hinder the
ability of companies to compete in international markets (Palmer, Oates, and Portney, 1995).
Theoretical analysis is often employed to show that environmental regulations should reduce
17

productivity by requiring firms to spend additional resources for pollution abatement and
control without increasing production output.
On the opposite side, an increasing number of people claim that stringent environmental
regulations will enhance the competitive position of firms. For example, they argue that the
ever-increasing stringency of environmental regulations will encourage firms to conduct more
research and development (R&D) activities and, consequently, produce more innovation in
the long run (Porter and van der Linde, 1995a). That is, the necessity to comply with
environmental policy will prompt companies to re-examine their products and production
processes carefully and in the end will lead to technological improvements. Spurred by
stringent environmental regulations, companies will go beyond mere compliance with
regulations and may succeed in creating radically new technologies. That means that
regulation-induced R&D activities could lead to an innovation which has not discovered
previously. Successful cases, many of which are those in the U.S., are cited to claim that
stringent environmental regulations actually encourage innovation in industry (Porter and van
der Linde, 1995b). Their views are conflicting, and the debate still continues. A careful
analysis is required to fully evaluate technological impacts of environmental regulation. What
would be particularly important is to examine the nature and characteristics of technological
change and to incorporate it into the analysis.
Recently, the World Commission on Environment and Development has publicly
addressed the concept of “sustainable development.” The Commission’s report, Our Common
Future, defined the concept as “development that meets the needs of the present without
compromising the ability of future generations to meet their own needs” (World Commission
on Environmental and Development, 1987). The idea of sustainability has become one of the
most important principles in guiding our thinking about our long-term relationship with the
environment. We are now urged to take a balanced and integrated approach to the
achievement of both environmental protection and economic development in the future. As
stressed by the Organisation for Economic Co-operation and Development (1997), full
development and extensive utilization of appropriate technologies in industry will be the key
to achieving sustainable development. What we need to consider now is to formulate
environmental regulations in such a way as to encourage innovations on technologies that
have the potential to reduce excessive environmental burdens while securing sound economic
development.
18
Our empirical study is conducted to examine how environmental regulations affect the
course and character of technological change through innovative activities of industry. As we
can see in empirical studies conducted previously, it is very difficult to measure the
stringency of environmental regulations and its effects on subsequent innovations at aggregate
levels. To overcome the problems of previous empirical studies due to their aggregate nature
and to understand well the nature of the relationship between environmental regulation and
innovation, a detailed case study is conducted at a micro-level in this research. It is expected
to shed complementary light on the question of how environmental regulations influence
firms’ activities with regard to the development and adoption of new technologies. It does so
by conducting interviews with companies and policy makers as well as analyzing detailed
data on patents and technological processes.
While previous empirical studies mainly deal with the effects of environmental
regulation either on the invention or the diffusion of new technologies, this research examines
the whole process of innovation, which covers the technological situation prior to the
introduction of environmental regulations, the development of new technologies by
innovators, and their adoption by themselves and other firms. Closely examining
environmental regulations relevant to the case, our study aims at assessing their dynamic
impacts on companies’ R&D and adoption of technologies in the entire process of innovation.
A historical approach is thus taken in the empirical study. It covers the technological situation
before the introduction of environmental regulations, the contents and schedules of the
regulations and their modifications, companies’ R&D activities, and adoptions of new
technologies, which cannot be analyzed separately when we aim at understanding fully the
linkages with one another.
According to the Industrial Pollution Projection System developed by the World Bank
(Hettige, Martin, Singh, and Wheeler, 1994), the most pollution-intensive sectors in terms of
toxic waste per dollar of output are “chemical process industries” in a broad sense, which
include, among others, the chlor-alkali, fertilizers, pesticides, plastics, paper, and metals
industries. In contrast to “physical process industries” such as the machinery and automobile
industries, in which the assembling process plays a crucial role, the chemical process
industries depend critically on chemical reactions to produce main products, and that means
that by-products are created almost inevitably in the production processes. Thus, practically
speaking, the chemical process industries should be given a prime emphasis in our efforts to
reduce pollutants emitted into the environment. And research on these industries is expected
19
to reveal cases in which the effects of environmental regulations on technological change can
be observed more clearly, compared with less pollution-intensive industries. Accordingly, we
pay close attention to the chemical process industries in this analysis. As a sector that belongs
to the chemical process industries, the chlor-alkali industry is the focus of our case study.
This sector is chosen because it is known to emit a large amount of mercury as an effluent
while mercury has been the focus of serious public concerns and intensive environmental
policies for a long time.
When we analyze process technologies for pollution abatement in chemical process
industries, we make extensive use of chemical reaction equations. By doing this, we can
clearly classify green innovation into two categories. The first one is end-of-pipe technologies
which deal with emissions at the end of the production facilities without any change in the
chemical reactions producing the main products. The second category is clean technologies
which eliminate undesirable by-products from within the production processes by replacing
the current chemical reactions with different routes.
To make an assessment of the impacts of newly introduced environmental regulations
on innovation, it is necessary to know the initial conditions of the technological situation. For
this purpose, we examine what kinds of technologies had been developed by which
companies prior to the introduction of environmental regulations. The trajectory of
technological changes is traced by identifying which parts of technologies have been actually
modified, in a similar vein to the morphological analysis used by Foray and Grübler (1990).
Examination of chemical reactions equations involved in production processes helps us
follow the direction and timing of technological change in detail. We also look at data on the
types of technologies that had been developed and adopted in order to identify which
companies had gained innovative experience and capabilities before environmental
regulations started to influence technological outcomes.
As we will see later, in the case of the chlor-alkali industry, basically there are three
types of production processes, namely, the mercury process, the diaphragm process, and the
ion exchange membrane process. The mercury process had been predominantly developed
and adopted in Western Europe and Japan by the time of the early 1970s, just before
environmental regulations on mercury emissions were imposed on the chlor-alkali industry.
In other words, similar technological conditions existed initially in Western Europe and Japan.
Since then, while many of the chlor-alkali manufacturers in Western Europe have continued
to use the mercury process, whose mercury emissions have been mainly treated with end-of-
20

pipe technologies, the ion exchange membrane process has become the dominant production
method in the Japanese chlor-alkali industry. Thus, we make a comparison between Japan and
Western Europe as a case study appropriate for examining the effects of environmental
regulation on technological change, in the sense that we can observe how environmental
regulations have contributed to the divergence of initially similar technological situations to
different outcomes1.
Our empirical study examines how environmental regulations on mercury emissions
have influenced innovative activities of firms and consequent technological change in the
chlor-alkali industry in Japan and Western Europe. We first look at the environmental
regulations on mercury emissions from chlor-alkali plants. Considering the difficulties in
making quantitative assessment of the stringency of different regulations, we closely look at
the details of the regulations related to mercury emissions. We trace the chronology of
different regulatory approaches to the same issue in the two regions, while taking into account
institutional aspects of the formation and implementation of environmental regulations and
other related public policies. Official documents of regulatory bodies are surveyed, and
interviews are conducted with public authorities and industry associations in each region to
obtain detailed information.
Then we make an in-depth investigation into companies’ technological responses to
environmental regulations. We examine how and when companies conducted innovative
activities for what kinds of technology, end-of-pipe technologies or clean technologies, in
particular. Interviews are conducted with innovative companies in the chlor-alkali industry in
each region to obtain information on the timing and extent of their R&D activities. It is not
easy, however, to secure detailed data on R&D activities specifically linked to particular
technologies. Particularly in our case, we are interested in differentiating R&D between end-
of-pipe technologies for the mercury process and clean technologies, including the diaphragm
process and the ion exchange membrane process for chlor-alkali production. Furthermore, the
use of R&D measures is not always satisfactory as a proxy for a wide range of technical
activities (Freeman, 1994; Griliches, 1990). Thus we also examine the outputs of
technological activities conducted by companies.
1 As the diaphragm process has been the dominant production process in the US chlor-alkali industry, its initial technological conditions were different from those of the Western European or Japanese chlor-alkali industry, and thus we do not examine in detail the US case in this research.
21

As an indicator of innovative outputs, patenting activity is analyzed in our study. Using
the data on patents as a measurement of innovation generally poses several difficulties. Firstly,
it has been reported that the propensity to apply for patents varies widely across industries
(Levin, Klevorick, Nelson, and Winter, 1987). Patenting is relatively unimportant in the
automobile industry, for instance, whereas many innovations tend to be patented in the
chemical industry. In our study, the focus is placed on innovations in one sector, namely, the
chlor-alkali industry, and hence the inter-industry variations of the propensity to patent do not
matter. Moreover, since the chlor-alkali industry is a branch of the chemical industry, to
which the importance of patents is generally considered to be high, we reasonably expect that
patent data would capture many of the relevant innovations made in the industry. Secondly,
the propensity to patent might change across time. For example, it is said that recently the
ratio of patents to R&D expenditures has fallen in many industrialized countries. Here we are
interested in comparing the relative importance in R&D between end-of-pipe technologies for
the mercury process and clean technologies, which include the diaphragm process and the ion
exchange membrane process, but not necessarily the absolute number of patent applications
on each process. As we expect that a change in the tendency to patent across time affects
different types of chlor-alkali technologies in the same way, the temporal variations of the
propensity to patent will not pose a serious problem. We use data on successful patent
applications, instead of that on all patent applications, because the quantity of patent
applications would be influenced by the strategies of companies and we are interested in
equalizing the quality of patents used as an indicator of technological outputs.
While we assume that patent data captures the extent of R&D activities made in the
chlor-alkali industry reasonably well, patents do not necessarily reflect the degree of
technological progress exactly. Hence other data on the trends in the performance of various
technologies are also collected from other sources. We make an extensive use of reports
published in scientific, technical, and trade journals as well as papers presented at seminars
and conferences. That contributes to increasing our understanding of technological aspects of
each process in detail.
Then the diffusion of new technologies is discussed by examining factors that would
affect their adoption by companies. Basically, we consider two prime factors relevant to
technological diffusion, namely, the availability of information on new technologies and the
profitability of their adoption (Stoneman and David, 1986). The information availability is
examined by analyzing reports presented at conferences organized by industry associations
22

and technical organizations and papers published in trade journals. The profitability of new
technologies is evaluated by using data on the construction cost and the operating cost of the
new technologies, compared with the old technology. We then examine the age of the plants
based on the old technology as it crucially affects the timing of making investments for
replacing the existing technology with new technologies. Detailed data on the existing and
new processes are obtained from engineering firms which supply production technologies as
well as chlor-alkali manufacturers in the two regions.
1.2 Outline of the Thesis
In Chapter 2, we first review theoretical and empirical research previously conducted on
effects of environmental regulation on technological change. Our criticism focuses on the way
in which technological change for pollution abatement is dealt with in previous studies. In
particular, they did not pay sufficient attention to the distinction between end-of-pipe
technologies and clean technologies, an aspect which would be crucial in analyzing
technological impacts of environmental regulation. Theoretical models mostly assume
pollution abatement technologies that reduce emissions incrementally while the marginal
pollution abatement cost is increasing. Effectively, that means that the technologies assumed
in the models are basically of the end-of-pipe type. On the other hand, the possibility of
eliminating emissions from within the production process by using clean technologies has
been mostly ignored. Since clean technologies do not produce emissions in the first place, the
marginal analysis of the pollution abatement cost curve, which is extensively used in
theoretical models, becomes inappropriate when we take into account the existence of clean
technologies.
Empirical studies mostly did not pay attention the distinction between different types of
technology either when examining impacts of environmental regulation on technological
change. As many of the previous empirical work examined patents at aggregate levels as the
indicator of innovations, they either focused on equipment of the end-of-pipe type such as
scrubbers and filters, or included all the innovations observed. That is because it is very
difficult to identify clearly the range of clean technologies which could be relevant for their
analyses without detailed information on specific production processes. Without taking clean
technologies into account, the group of end-of-pipe technologies will limit too narrowly the
range of technological change for pollution abatement. On the other hand, if we include all
23

types of innovation, the group will contain technologies which have little connection with
environmental aspects and be too broad to be appropriately defined as a range of green
innovations. We argue that it is important to examine the nature and character of technologies
in detail for an accurate analysis of green innovation.
Then we move on to show that there are basically two types of technology, namely,
end-of-pipe technologies and clean technologies, to deal with emissions formed by industrial
activities. End-of-pipe technologies are aimed at reducing emissions at the end of the
production facilities, without changing the reactions which produce the main product. Clean
technologies, on the other hand, are defined as those which replace the main reactions with
different ones, effectively eliminating undesirable by-products from within the production
processes. It is end-of-pipe technologies that have been mostly developed in the past to
reduce emissions from industrial processes. Since end-of-pipe technologies treat pollutants at
the end of the pipe for emissions without affecting the main production process, it is relatively
easy to adopt and operate them, and various types of the end-of-pipe equipment have been
widely adopted in industry. While end-of-pipe technologies only increase the production costs
because additional costs are required to install them at the end of the manufacturing facilities,
clean technologies, which are aimed at avoiding the formation of pollutants from the
beginning by altering the whole facilities, could improve the main production process and
potentially reduce the manufacturing cost in the long run.
Incorporating this technological distinction between the end-of-pipe technology and the
clean technology, our analytical framework is developed for the effects of environmental
regulations on technological change. We argue that different environmental regulations could
lead to diverging types of technological change. Relatively weak environmental regulations
will encourage the adoption of end-of-pipe technologies, which are likely to be much less
expensive than clean technologies, at least initially. That in turn will induce more investment
in the existing production technology, whose emissions can be expected to be reduced by
adopting end-of-pipe technologies. That will make the transition to clean technologies a slow
process even when the clean technologies later become more efficient in production, because
more plants will have already been built with the old technology by that time, and there will
be strong incentives to maintain these existing plants until the end of their lifetimes unless the
clean technologies are extremely efficient.
On the other hand, regulations which are stringent enough cannot be complied with just
by installing end-of-pipe technologies. That effectively will demand abandoning the existing
24

production technologies, and, as a consequence, R&D activities for innovation on clean
technologies will be encouraged. As there are normally multiple options for clean
technologies, however, a rigidly fixed regulatory schedule will induce companies to make
premature decisions on alternative technologies, which may not be the most appropriate
choice from a long-term perspective. Replacement of these technologies with the one which
has turned out to be the best in the end will be costly.
With this analytical framework, we conduct our empirical study of the chlor-alkali
industry. In Chapter 3, we look at the history of technological evolution in the chlor-alkali
industry, which has a history of more than one hundred years. Since the beginning of the 19th
century, the production technologies used in the chlor-alkali industry have experienced
several major innovations, including chemical and electrolytic processes. Among the
electrolytic production processes, we see that the mercury process had become the dominant
production process in Western Europe and Japan by the early 1970s, before environmental
regulations on mercury emissions started to be imposed in the two regions. We observe that
several firms in Western Europe and Japan had developed advanced technologies for the
mercury process, and these technologies accounted for the majority of those used by the
operators of mercury-based chlor-alkali plants in the two regions. That suggests that there
were equally innovative companies in both regions on chlor-alkali production technologies
prior to the introduction of environmental regulations, which means that the initial
technological conditions in this industry were similar in Western Europe and Japan.
Since environmental regulations were imposed for reducing mercury emissions from
chlor-alkali plants in the early 1970s, however, diverging paths of technological change have
emerged in Japan and Western Europe. The remaining chapters intend to investigate how
different environmental policies have contributed to the different technological outcomes
between the two regions. We examine the Japanese case in Chapter 4. In Japan the
government imposed a strict regulatory mandate on the chlor-alkali industry to phase out the
existing plants based on the mercury process in a very short period of time. That stringent
policy gave a spur to innovative companies to develop alternative clean technologies. The
regulatory approach, which was initially fixed in a rigid schedule, resulted in inducing many
of the chlor-alkali producers to adopt the diaphragm process, as its performance was
relatively well established at that time, compared with that of the still-infant ion exchange
membrane process. The diaphragm process, however, later turned out to be an inefficient
technology, while the ion exchange membrane process was in the process of rapid
25

improvement. Based on incoming information on the situation of technological developments
from the industry, the government interrupted the implementation of the original regulation
for a while to assess the extent of progress in developing the ion exchange membrane process.
Following an evaluation by experts of the industrial feasibility of the ion exchange membrane
process, the regulatory schedule was subsequently modified to allow more time for process
conversion. That change in the schedule allowed the remaining mercury process plants to be
converted directly to the ion exchange membrane process, which has since progressed to
become the best technology among the alternatives, economically as well as environmentally.
On the other hand, those mercury-based plants which had adopted the diaphragm process
earlier had to be converted again to the ion exchange membrane process. That has made a
substantial amount of investment in plants abandoned well before the end of their physical
lifetime.
The case of technological change in the chlor-alkali industry in Western Europe is
examined in Chapter 5. Less stringent regulations were adopted in Western Europe, where
emission standards were imposed on chlor-alkali plants to reduce their mercury emissions.
Most of the companies in the industry have chosen end-of-pipe technologies, an option which
was much cheaper and more certain than making investment to develop new clean
technologies with unclear performance. Various types of end-of-pipe equipment were
developed and adopted to reduce mercury emissions to such an extent that regulatory
requirements were complied with by most of the mercury process operators. During the
following period, many chlor-alkali plants were constructed, relying on the well-established
mercury process equipped with end-of-pipe technologies for pollution abatement. Since these
plants have not yet reached the end of their physical lifetime, which normally is forty years or
longer, chlor-alkali producers in Western Europe have strong incentives to continue to use
mercury-based plants, although the ion exchange membrane process has become the most
efficient production technology and has been adopted in other countries, including many
industrializing countries. In short, relatively weak regulations adopted in Western Europe
promoted considerable progress in end-of-pipe technologies to reduce mercury emissions, but
resulted in discouraging the development of the ion exchange membrane process, a prime
example of the clean technology, even though there were several companies that were
innovative on chlor-alkali production technologies. As the mercury process, equipped with
end-of-pipe technologies to reduce mercury emissions, has continued to be used in many
26

chlor-alkali plants, the diffusion of the efficient ion exchange membrane process has been
slow and limited.
Finally, Chapter 6 gives the summary and conclusion of our research. Relatively weak
regulations, whose introduction is intended to improve the environmental performance of
industrial activities, would encourage innovations on end-of-pipe technologies, and that in
effect could work to prolong the life of existing production processes which are in fact getting
obsolescent. Stringent regulations, while promoting innovative activities on clean
technologies, could induce premature decisions to choose inappropriate technologies. Only
when the schedule of implementing stringent regulations maintains a certain degree of
flexibility, allowing enough time and experiment for technological progress, will the
possibility be secured that efficient clean technologies are fully developed and widely adopted
in industry. With our finding of the diverging effects of environmental regulations on
technological change, we discuss implications for corporate strategies, policy making, and
institutional setups in our attempt to make a transition from end-of-pipe technology to clean
technology.
27

2. Analytical Framework for the Effects of Environmental
Regulation on Technological Change
2.1 Previous Studies of the Effects of Environmental Regulation on
Technological Change
2.1.1 Theoretical Models
Traditionally, the theoretical foundations for correcting environmental problems have been
based on the theory of externalities (e.g. Baumol and Oates, 1988)2. With no prices to provide
the proper incentives for reducing polluting activities, the inevitable result is that excessive
burdens will be imposed on the absorptive capacity of the environment. The obvious solution
to this problem is to place an appropriate price, the so-called Pigouvian tax, on polluting
activities so that the social costs are fully internalized. A set of Pigouvian taxes equal to
marginal social damage then can produce an optimal outcome. This approach essentially
focuses on the static efficiency of the problem without paying due attention to the dynamic
nature of environmental issues, particularly the effects of technological change. It is assumed
that necessary technologies already exist and are readily available to anybody who wants to
adopt them and that he or she can smoothly adjust the emission level, depending on economic
incentives provided by tax or tradable emission permits.
Environmental degradation, however, is usually a long-term process, in which
technological change could potentially produce effects of several orders of magnitude larger
than the gains and losses calculated in a static framework. Technologies necessary for
reducing emissions may not exist, and, even when they exist, their characteristics and
performance may not be stable or well established. As Orr (1976) put it, “(w)hat is missing
was the view that environmental policy is fundamentally the need to establish a framework
that provides continuous and detailed technological adaptation to the impacts on the
environment of growth, change in product mix, and change in process technology” (p. 442).
This crucial aspect has begun to be addressed in recent studies which examine the effects of
environmental regulation on technological change. The new approaches take into account the
decisions made by firms on their investment for the development and adoption of
2 There are also other approaches to solving environmental problems. Coase (1960) proposed to assign liability for damages and let parties bargain to mutual benefit to eliminate excessive pollution. This approach, significant
28

technologies to deal with pollution. These activities essentially take place in a dynamic
context, making the traditional arguments exclusively focused on the static efficiency
seriously inadequate. We examine in the following section these previous theoretical models
on the effects of environmental policy on the development and adoption of new technology
for pollution abatement.
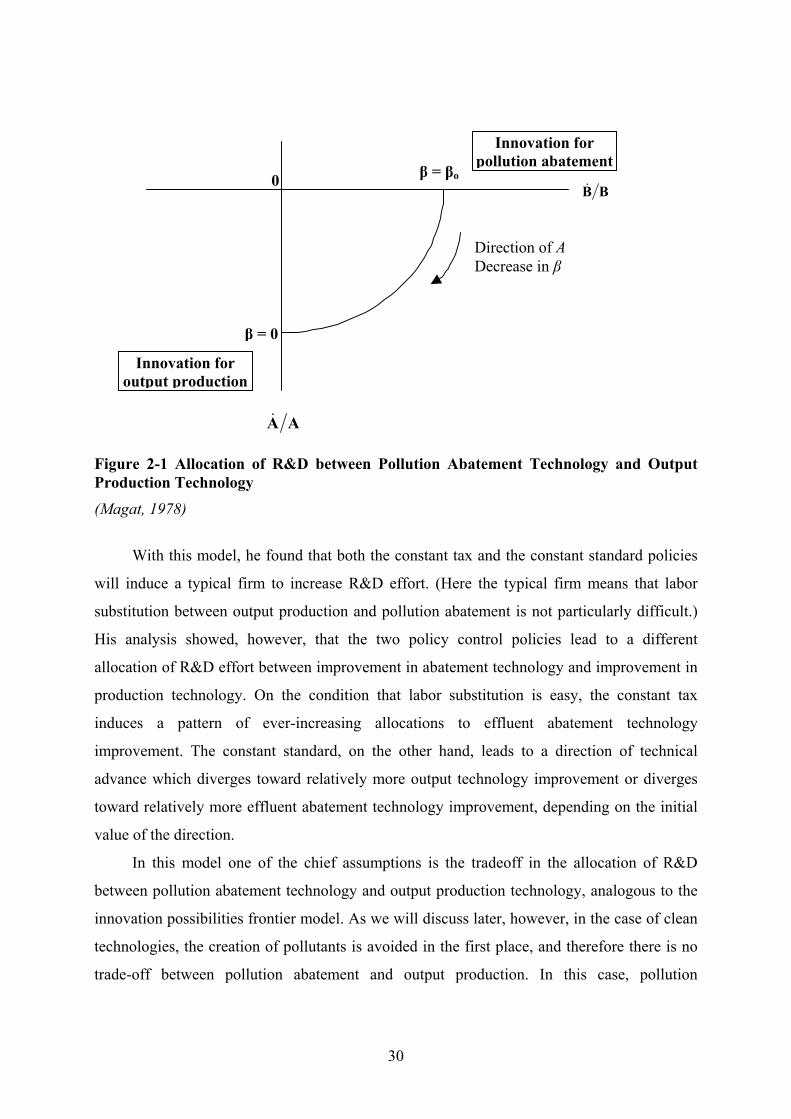
Magat (1978) extended the static comparison of effluent taxes and effluent standards to
a dynamic world in which firms invest resources in improving their abatement technology as
well as their production technology. He employed a simple model of production in which a
firm employs one variable input, labor, (at rate L) to produce its output (at rate y) and a
pollutant (at discharge rate x). This joint production relation is represented by the production
function
L = g(Ay, Bx). (2-1)
Technical change occurs through product augmentation, where Ay and Bx represent the
effective output rate and the effective effluent rate, respectively, with the augmentation
parameters A and B respectively measuring the levels of the output production and effluent
abatement components of the technology. It is assumed that employing more of the input L
either raises the output rate y, lowers the pollution rate x, or some combination of these two
effects. Technological advance occurs through expenditures M by a firm which produces a
combination of output technology innovation and effluent abatement technology innovation.
The parameter β measures the allocation of effective R&D effort between the two types of
technological advance, that is, the bias or direction of technological change. For a given
expenditure M on R&D, the tradeoff between output technology innovation AA& and
abatement technology innovation BB& occurs along a smooth innovation-possibilities frontier,
and increases in R&D spending M shift out the frontier. A graphic illustration is given in
Figure 2-1.
as a theoretical possibility, requires a strong assumption of low transaction costs to achieve an efficient outcome, however. See Farrell (1987) for more detailed discussions on this approach.
29
AA&
β = βo
β = 0
BB&0
Direction of ADecrease in β
Innovation forpollution abatement
Innovation foroutput production
Figure 2-1 Allocation of R&D between Pollution Abatement Technology and Output Production Technology
(Magat, 1978)
With this model, he found that both the constant tax and the constant standard policies
will induce a typical firm to increase R&D effort. (Here the typical firm means that labor
substitution between output production and pollution abatement is not particularly difficult.)
His analysis showed, however, that the two policy control policies lead to a different
allocation of R&D effort between improvement in abatement technology and improvement in
production technology. On the condition that labor substitution is easy, the constant tax
induces a pattern of ever-increasing allocations to effluent abatement technology
improvement. The constant standard, on the other hand, leads to a direction of technical
advance which diverges toward relatively more output technology improvement or diverges
toward relatively more effluent abatement technology improvement, depending on the initial
value of the direction.
In this model one of the chief assumptions is the tradeoff in the allocation of R&D
between pollution abatement technology and output production technology, analogous to the
innovation possibilities frontier model. As we will discuss later, however, in the case of clean
technologies, the creation of pollutants is avoided in the first place, and therefore there is no
trade-off between pollution abatement and output production. In this case, pollution
30

abatement technology is not necessary, and all the R&D resources will be allocated to
improve the efficiency in output production technology, implying that Magat’s model is not
appropriate for the analysis of clean technologies.
There are other theoretical studies which focused on the marginal analysis of pollution
abatement. Downing and White (1986) constructed a simple model of pollution control
innovation by a profit-maximizing polluter who is subject to pollution control policies,
including direct regulation as well as economic instruments3. A graphic illustration of the
model is given in Figure 2-2. The marginal cost curve of abatement and the marginal damage
curve of pollution are represented by MC and MD, respectively. Their analysis assumes that
the control authority has perfect information on the costs of reducing emissions as well as on
the benefits of improving environmental quality. Furthermore, it is assumed that the authority
reacts immediately to the new innovation, which in turn is fully expected by companies.
3 Here we consider effluent fees or taxes as representing instruments based on economic incentives. Other economic instruments, notably tradable emission permits, are not examined, as the implementation of emission permits trading is rather difficult because of high transaction costs, particularly when there are many small emitters. Potential sources of transaction costs would be searching and information, bargaining and decision, and monitoring and enforcement (Stavins, 1995). In this context, see also Marin (1991) for a criticism and Milliman and Prince (1992) for their reply.
31

Percentage of Emission Reduction
O 100
B
E
C D
P1
MC MC’
MD
A
FP2
G
L
MK
H
I
J
Figure 2-2 Incentives to Innovate without Diffusion, followed by Policy Adjustment
(Downing and White, 1986)
We first consider the case in which the polluter (and the innovation) is a small enough part of
the overall pollution problem so that none of the important marginal conditions are changed
by the innovation. The benefit to the polluter from the innovation (MC -> MC’) under the
effluent fee at P1 is area OAE, the same as the social benefits from the innovation, and the
polluter will adopt the innovation when the initial cost of investment for abatement X is less
than OAE. On the other hand, under the direct regulation at C, the benefit to the polluter from
the innovation is area OAB, which is smaller than OAE:
OAB < OAE. (2-2)
Thus the methods relying on effluent fees are better than direct controls in encouraging
innovation4.
4 Jung, Krutilla, and Boyd (1996) evaluated the incentive effects of policy instruments for innovation at the industry level, taking into account firm heterogeneity. Their results suggest, consistent with the firm-level analysis, that incentive-based instruments provide more incentives than performance standards.
32

When marginal conditions are changed by the innovation, the results remain the same as
long as the policy maker does not make any adjustments. In the case where the pollution
control authority makes the socially appropriate adjustments (ratcheting), the effluent fee is
reduced from P1 to P2 or the emission standard is raised from C to G. The benefit from the
innovation under the effluent fee system is area (OAHJ – OFIJ), that is, OAHIF, whereas the
innovation benefit under direct regulation is area (OAC – OFG), which is equivalent to (OAB
– BFGC). Since OAHIF is larger than OAB and hence is larger than (OAB – BFGC)
OAHIF > (OAB – BFGC), (2-3)
the benefit from the innovation is larger under the effluent system than under direct regulation.
Indeed, the innovation benefit under direct regulation could conceivably be negative. This
model basically suggests, in line with other studies adopting similar approaches (Wenders,
1975; Zerbe, 1970), that the effluent fee system will provide more incentives to innovate than
direct regulation.
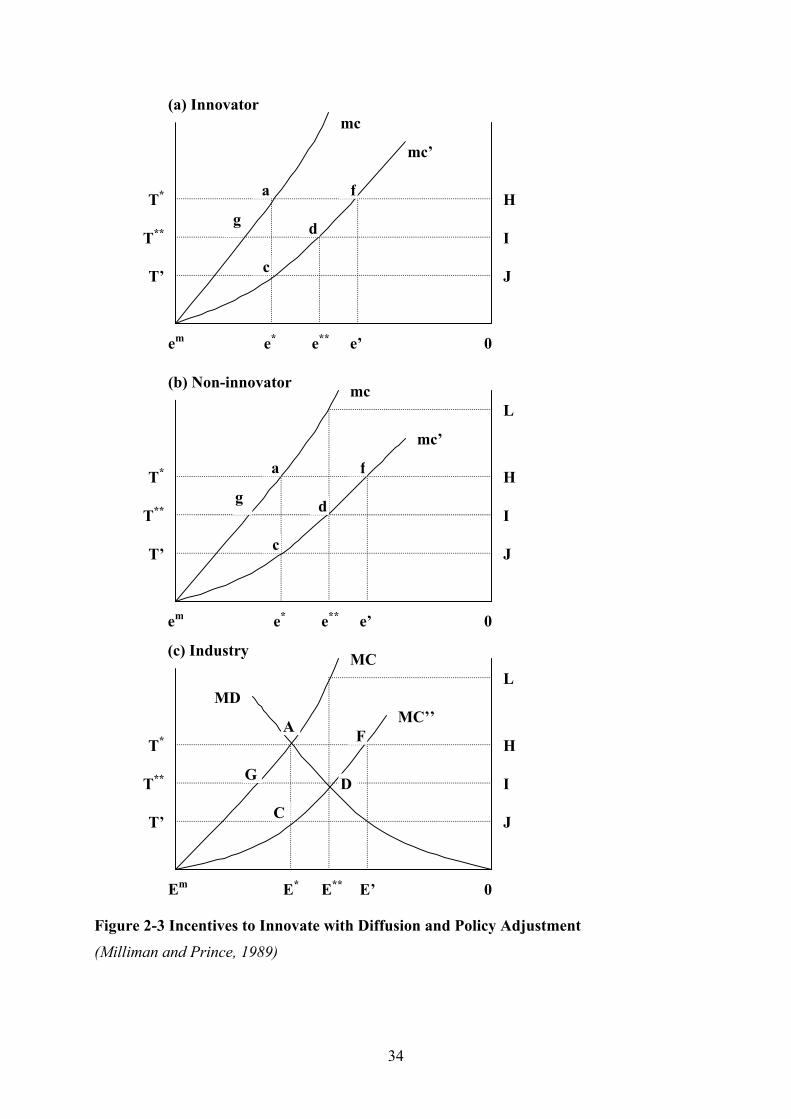
While Downing and White (1986) assumed that the innovation is specific to the
innovating polluter and cannot be transferred to any other polluter, Milliman and Prince
(1989) extended their model by considering the possibility of the adoption of the innovation
by other companies. Now there are three steps involved in the entire process of technological
change: invention of a new technology; diffusion of the new technology across firms; and
optimal agency reaction to adjust pollution controls in response to the innovation. They
examined firm incentives for technological change under various policy instruments,
including direct controls and economic instruments such as emission subsidies, emission
taxes, free marketable permits, and auctioned marketable permits. The model is illustrated in
Figure 2-3.
33
(a) Innovatormc
mc’
em e* e** e’
T’
T**
T* a
c
dg
f
(b) Non-innovator mc
mc’
(c) Industry
em
Em
MC
MC’’MD
T’
T**
T*
e* e** e’
E* E** E’
T’
T**
T*
H
I
J
L
H
I
J
0
0
L
H
I
J
0
a f
g d
c
A
C
G
F
D
Figure 2-3 Incentives to Innovate with Diffusion and Policy Adjustment
(Milliman and Prince, 1989)
34

A large number N of identical firms in a competitive industry are each discharging a
homogeneous emission into the environment. The public regulator intends to reduce these
emissions to the optimal rate of E* per time period at the industry level (Figure 2-3c) either by
imposing a direct emission control of e* per time period on each firm (Figure 2-3a and Figure
2-3b), where Ne* = E* (Figure 2-3c), or by establishing a per unit tax equating T* on firm
emissions. A single firm develops an innovation which shifts its marginal cost curve from mc
to mc’ (Figure 2-3a). Initially, the aggregate curve MC remains unchanged due to the small
size of the firm relative to the entire industry. This is different from the case of Downing and
White (1986) in Figure 2-2, where the marginal cost curve MC shifts to MC’ after innovation.
Widespread diffusion, however, shifts mc to mc’ for many non-innovating firms (Figure 2-3b),
thus eventually shifting MC to MC’’ (Figure 2-3c). This necessitates control adjustment to
restore efficiency, that is, optimal agency response, either by reducing allowed emission
levels to e** per firm under direct controls (E** in industry) or by lowering the tax rate from T*
to T** under emission taxes. It is assumed that the regulator possesses perfect information on
current abatement technology, but lags in perceiving a discovery, and that political pressures
prevent the regulator from imposing optimal agency response prior to the completion of
diffusion.
Firm incentives to promote a particular step, namely, innovation, diffusion, or optimal
agency response, are determined by the induced changes in firm abatement costs. Now firm
abatement costs are in three forms: the direct cost of abatement (equipment expenses,
operating costs); the associated transfer losses (payments made by the firm, such as emission
taxes); and the associated transfer gains (payments made to the firm, such as patent royalties).
Without any patent on the innovation, diffusion generates no additional innovator gains under
direct controls and emission taxes because the innovator lacks a method for capturing rents
enjoyed by the copying firms. Hence the innovator gains from the entire process of
technological change for non-patented discoveries are the same as in the case of Downing and
White (1986); that is, the innovation changes marginal conditions and the control authority
adjusts properly, namely, emaHId under emission taxes and emac – e*cde** under direct
controls. We can see that emission taxes clearly generate abatement cost reductions for non-
patented technologies.
A patent, however, could allow the innovator to capture some of the gains enjoyed by
copying firms. Milliman and Prince (1989) incorporated this aspect into their model by
assuming that the innovator captures a set percentage z (0 < z ≤ 1) of all cost reductions
35

accruing to non-innovators from patent use, including any beneficial changes in transfer gains
or losses. Non-innovator gains from the adoption of the innovation per firm, which are to be
divided between the innovating firm and non-innovating firms, are emac under direct controls
and emaf under emission taxes. Hence innovator royalties under the two policy instruments
are the percentage z times industry-wide non-innovator gains, or z(N – 1)emac and z(N –
1)emaf, respectively. After control adjustments by the regulator, innovator royalties become
z(N – 1)emkd under direct control and z(N – 1)emgd under emission taxes. Royalties increase
under direct controls because, with control adjustment, costs without patent access rise emae*
to emke** (Figure 2-3b). Under emission taxes, on the other hand, royalties decrease because
abatement costs without patent access decline with control adjustment. Initially, area emaf
(Figure 2-3b) is subject to capture by the innovator with tax rate T*; after the lower tax rate
T** is implemented, the smaller area emgd becomes subject to capture.
In sum, innovator gains from the entire process of technological change for patented
discoveries are gains for non-patented technology plus royalties, that is, emac – e*cde** + z(N
– 1)emkd under direct controls and emaHId + z(N – 1)emgd under emission taxes. We can see
that the more firms there are in the industry, that is, a larger N, the more royalties the
innovator receives and hence the more innovator gains. While the abatement cost reductions
under direct controls are smaller than those under emission taxes, that is,
emac – e*cde** < emaHId, (2-4)
royalties are larger in the former case than in the latter case, that is,
z(N – 1)emkd > z(N – 1)emgd. (2-5)
Therefore, we cannot unambiguously tell whether direct controls or emission taxes create
more innovation benefits for patented technologies. When the innovator can capture all of the
benefits accruing to the adoption of the innovation by non-innovating firms, that is, z = 1, the
innovator gains from the total process of technological change under direct controls are
emac – e*cde** + (N – 1)emkd
= Nemkd – (e*cde** + cakd)
= Nemkd – e*ake**. (2-6)
That means that the innovator gains from the total process under direct controls consist of the
benefits to all N firms of adopting the innovation minus the cost of reducing emissions from
e* to e** by the innovator, which would not have been required if it were not for the regulatory
adjustment following the diffusion of the innovation. Similarly, with z = 1, the total innovator
gains under emission taxes are
36

emaHId + (N – 1)emgd
= Nemgd + emaHID – emgd
= Nemgd + gaHI. (2-7)
This means that under emission taxes the total innovator gains consist of the benefits to all N
firms of adopting the innovation plus the reduction in the abatement cost by the innovator
following the reduction in the tax rate from T* to T**. To see the difference in the total
benefits under the two policy instruments, we have
(Nemkd – e*ake**) – (Nemgd + gaHI)
= Ngkd – e*ake** – gaHI. (2-8)
We can see that when there are many firms in the industry, that is, N is large, the value could
conceivably be positive. In other words, total innovator gains could be larger under direct
controls than under emission taxes, a result which is in contrast to the case where the
innovation cannot be patented.
They also considered the case in which the innovator is an outside supplier firm. Since
the supplier is not discharging emissions, no private gains are forthcoming from innovation
itself; only diffusion and optimal agency response are relevant. Here too it is assumed that the
supplier firm can patent an innovation and captures a set percentage z (0 < z ≤ 1) of all private
gains accruing to industry firms from patent use. The total patent royalties with diffusion are
zEmAC under direct controls and zEmAF under emission taxes. With control adjustment,
royalties decline under emission taxes to zEmGD, but increase under direct controls to zEmKD.
Overall, outside innovator gains from the entire process of technological change are
unambiguously positive under all regimes, as they can earn patent royalties without paying
any direct costs or taxes. Direct controls, in particular, will encourage innovation by
increasing the stringency of the standard, thus increasing the innovation gains.
While Milliman and Prince (1989) assumed that the innovator can appropriate a fixed
fraction of the private gains to all the non-innovating firms in the industry from the new
technology, Fischer, Parry, and Pizer (1998) considered a case in which the royalty level for
the new technology is endogenously determined by the desire of the innovator to attract
payment from the marginal, non-innovating firms. Their model consists of a three-stage
process of innovation, diffusion, and emission abatement with a fixed number of n identical,
competitive firms, one of which is an innovator. First, the innovating firm decides how much
to invest in R&D to develop an emissions abatement technology. Then the other n – 1 firms
decide whether to adopt this technology in return for a royalty fee or to use an imitation
37

technology which is not completely equivalent to the original innovation. Finally, all firms
choose emissions abatement to minimize costs, given an emission tax. In this model it is
assumed that the rate of effluent taxes is fixed at the pre-innovation level; that is, there is no
policy adjustment following the innovation and its subsequent diffusion to other firms in the
industry.
Since firms reduce emissions until the tax rate equals marginal abatement costs,
abatement per firm increases as marginal costs shift down, depicted in by a0, aσ, and a1 with
the original technology, the imitation, and the patented technology, respectively. The
innovator gains the full abatement cost effect for itself, the area 0hj in the top panel (a). Non-
innovators, however, although they realize the same cost savings, are only willing to pay less
to adopt the patented technology. This area 0lj equals the benefit from using the patented
technology over the original technology, the area 0hj, less the benefit from using the imitation
over the old technology, the area 0hl; that is,
0hj – 0hl = 0lj. (2-9)
Overall, the innovator gets n times the abatement cost effect, 0hj, less (n – 1) times the
imitation effect, 0hl; that is,
n0hj – (n – 1)0hl
= n(0hj – 0hl) + 0hl
= n0lj + 0hl. (2-10)
When the imitation technology performs as well as the new, patented technology, that is, l
moves to j, the innovator gains become 0hj. That means that no firm would pay any royalties,
because the equivalent imitation technology is freely available, and the innovator gains are
limited to the reduction in its abatement costs only. On the other hand, when it is not possible
to adopt any imitation technology, that is, l reaches h, then the innovator gains become n0hj.
In this case the innovator can gain all the benefits through the reduction in abatement costs in
the industry. We obtain similar results in the case of emission standards, although the
innovator gains from diffusion are smaller than in the case of effluent taxes. In either case,
innovation gains which can be captured by the innovator through licenses are constrained by
the availability and performance of imitation technologies.
38

(a) Innovator
Ca(a,0)
Ca(a,k)
0
t h j
a0 a1
Abatement, a
i
(b) Non-Innovator
Ca(a,k)
Ca(a,σk)
Ca(a,0)
0 a0 aσ a1
t h
i
l j
Abatement, a
Emissions, e
Emissions, e
Figure 2-4 Incentives to Innovation with the Possibility of Imitation and No Policy Adjustment
(Fischer, Parry, and Pizer, 1998)
39

We can draw some implications from these models. First, when each firm develops its
specific technology and there is no diffusion of new technologies to other firms, as long as the
reduction in pollution emissions is so small that policy is not adjusted to a new, socially
appropriate level, innovation benefits under emission taxes are larger than those under
command-and-control approaches. In other words, emission taxes will encourage more
innovation than command-and-control approaches. When the effects of new technologies are
large enough as to prompt policy makers to adjust the control regulation, effluent taxes are
again better in inducing innovation than direct control approaches. That is because, while the
post-innovation policy adjustment is to raise the effluent standard level under direct control
approaches, it is to lower the tax level under emission taxes, which will increase benefits
accruing to innovation.
In cases where diffusion of innovation takes place, as long as innovation is patentable,
royalties through adoption of innovation by other firms will increase innovation benefits to
the innovator. When there is no adjustment of regulation, innovation benefits will be higher
under emission taxes than under command-and-control instruments. If the innovation is
diffused thoroughly in the industry, followed by an appropriate policy change, innovation
benefits under command-and-control could be higher than under emission taxes. The reason is
that the policy adjustment required under command-and-control is to raise the emission
standard level, and that will increase the benefits of adopting the innovation by other firms,
which in turn will increase the royalty payments to the innovator, on the assumption that the
royalties are proportional to the benefits through the adoption of the innovation. On the other
hand, emission taxes will be lowered after the diffusion of the innovation, and that will reduce
the benefits to the adopters of the innovation, hence reducing the royalties to the innovator.
When imitation technologies are available, they will work to constrain the level of the
royalties to the innovator. As the performance of imitation technologies is better, the adopters
of the original innovation are willing to pay less to the innovator.
There are many criticisms to various aspects and assumptions contained in these
models 5 . Here our criticism focuses on the assumptions about technological change,
particularly the exclusive focus on the end-of-pipe technology for pollution abatement. As we
have discussed, Magat (1978) analyzed a case in which there is a tradeoff in R&D between
improvement in output production technology and improvement in pollution abatement
5 For a comprehensive critique of previous theoretical approaches, see Kemp (1995).
40

technology. Here the technology considered for pollution abatement is basically that of the
end-of-pipe type, and the possibility of developing clean technologies is not taken into
account. In our research, the focus is placed on a choice between the end-of-pipe technology
and the clean technology. As clean technologies, which do not require any pollution
abatement, could achieve improvement in output production as well at the same time, they do
not involve any tradeoff between improvement in output production and that in pollution
abatement. That is, when a clean technology is chosen, it is not necessary to conduct R&D on
end-of-pipe technology. Hence what will be of critical importance to firms is not to consider
the optimal combination of R&D efforts between pollution abatement and output production,
but rather to choose the end-of-pipe technology or the clean technology for the target of R&D.
Also, the marginal cost curve of pollution abatement, which has been commonly used in
theoretical models, basically means the use of end-of-pipe technologies. The previous models
we have discussed (Downing and White, 1986; Fischer, Parry, and Pizer, 1998; Milliman and
Prince, 1989) assume that the marginal cost of pollution abatement increases as emissions are
reduced. And it is also assumed that the scope for innovation is limited to those in which
marginal abatement costs are lowered. In other words, marginal abatement costs are
continuous and strictly increasing over a relevant region, and technology adoption is modeled
simply as a decline in marginal abatement costs. Effectively, these assumptions mean that
pollution abatement is implemented with end-of-pipe technologies. There is, however,
another type of technologies for dealing with emissions from the production process, namely,
clean technologies. In contrast to end-of-pipe technologies, clean technologies will eliminate
the creation of pollutants from within the production process by altering the chemical
reactions producing the main product. Since there is no pollution emission in the first place,
the marginal abatement cost curve becomes irrelevant for the analysis of clean technologies.
Later we will discuss the distinction between end-of-pipe and clean technologies in detail and
incorporate into our analytical framework the difference in the dynamic character of
technological improvement between the two types of green innovation. This point will have
crucial implications in considering the effects of environmental regulation on technological
change theoretically as well as empirically.
41

2.1.2 Empirical Studies
There are not so many empirical studies which examined the effects of environmental
regulation on innovation6. And most of the previous studies were conducted at aggregate
levels. As one of the influential studies in this area, Lanjouw and Mody (1996) used patent
data to investigate the extent of innovation which occurred in the 1970s and 1980s. They
found that the ratio of water pollution patents to total US patents was flat in the early 1970s
and rose in the late 1970s to a new plateau, paralleling pollution control expenditures with a
two- to three-year lag. And similarly the dramatic fall in water pollution control expenditure
during the early 1980s was followed by a dip in patenting. The same pattern was also
observed in industrial air pollution. Based on these findings, they suggest that certain
plausible connections exist between environmental regulation and innovation.
In similar vein, Bhanagar and Cohen (1999) studied how environmental patent
applications by U.S. manufacturing industries responded to environmental regulation during
the period of 1983 through 1992. They found that environmental innovation, as measured by
the number of successful environmental patent applications, responded to increases in
pollution abatement expenditures. They also used government monitoring activities as a
proxy for the stringency of environmental regulation and found that increased monitoring and
enforcement activities related to existing regulations did not provide incentives to innovate.
Ratnayake (1999) took a broader view of innovation, looking at R&D in addition to
patents. He examined whether environmental regulations enhance or hinder R&D
expenditures, using the data for eight major U.S. industries for the period from 1982 to 1992.
His findings suggest no strong evidence to support the view that environmental regulations,
measured by pollution abatement costs, have any significant impact on R&D expenditures on
pollution abatement technologies.
Jaffe and Palmer (1997) looked at aggregate innovative activities rather than just
environmental technologies. Using panel data on U.S. industries from the middle of the 1970s
to the early 1990s, they found that lagged environmental compliance expenditures, which is
used as an indicator of the regulatory stringency, have a significant positive effect on total
private expenditures on R&D. However, they could not find any evidence that industries’
inventive outputs, measured by successful total patent applications, were related to the
6 Relatively speaking, more research has been done on the diffusion of environmentally beneficial technologies, particularly those of the end-of-pipe type. For example, Kemp (1998) made a careful study of the diffusion of
42

compliance costs. They suggest that their finding might imply that incremental R&D activity
induced by environmental regulations is not productive or produces results that accomplish
only regulatory compliance but that do not come out as patentable innovations.
Overall, these studies produced mixed results on the impact of environmental
regulations on innovation. These results require a careful examination, and here we focus our
attention to the ways in which the stringency of environmental regulation and the extent of
innovation are measured. In these studies, the stringency of environmental regulations is
mostly measured by pollution abatement costs and expenditures (PACE)7. While this is not
unreasonable, as there is no direct way to measure and compare the stringency of
environmental regulations between different industries and countries, we can point out several
problems in adopting PACE for that purpose. First, the use of them assumes that high PACE
is the result of large efforts made by industries to reduce pollution, therefore reflecting strict
environmental regulations. That is, the measurement of PACE is a type of input-oriented
indicator of environmental regulation, which are based on input efforts devoted to
environmental protection (van Beers and van den Bergh, 1997). Regulatory compliance
expenditures as a measure of environmental regulatory burden on industry, however, fall
short of providing an exogenous measure of regulatory burden, because the level of these
costs also depends on the ability of an industry in reacting to regulations. For example, an
innovative, competitive industry may respond to environmental regulations in a more efficient,
cheaper way than a less innovative industry, and hence the former may spend less for
compliance, independent of the stringency of environmental regulations.
Furthermore, there are no precise definition of PACE and no simple way to measure it
accurately. For example, an investment in energy-saving equipment, which is itself
environmentally friendly technology, may have been carried out as a part of normal, profit-
maximizing business behavior. Especially in the case of clean technologies, it is difficult to
establish what portion of the total investment expenditures should be allocated to pollution
biological waste-water treatment technologies in the food and beverage industry in the Netherlands. Here the focus of our discussion is placed on previous studies of the development side of technological change. 7 Gray and Shadbegian (1993; 1995) also use the PACE data to examine the impact of environmental regulation on manufacturing productivity at the plat level. There are other approaches to the measurement. In Tobey (1990) the degree of the stringency of environmental policy is measured on a scale from one (tolerant) to seven (strict). Gray and Shadbegian (1998) created indices, incorporating the membership rate in major conservation organizations and the percent voting Democratic in Congressional elections to capture differences in political support for regulatory stringency. Qualitative indices of regulatory stringency are also used, such as the Conservation Foundation Index, the Fund for Renewable Energy and the Environment (FREE) Index, and the
43

abatement and control. Methodologies of their measurement are diverse across countries,
which will make international comparisons difficult8.
Instead of input-oriented indicators like the PACE, output-oriented indicators are also
used to measure the stringency of environmental regulations. Output-oriented indicators are
generally based on the concrete data of environmental situations, such as pollutant emissions
data 9 . The logic supporting this approach is that better environmental quality has been
achieved as a result of stricter environmental regulations. Although these output-oriented
indicators, unlike the input-oriented indicators, take into account the results of compensating
financial support from the government, they also have some limitations. One of the problems
is that high quality of the environment is not necessarily due to the imposition of strict
environmental regulations. Natural environmental conditions or other social factors might
have produced the current situation without any effect of such regulations. Although the
aggregate nature of these studies makes it almost inevitable to use the PACE incurred by
firms to measure the stringency of environmental regulations, it is an indicator which is
indirect at most and could be even misleading. We need other ways to deal with
environmental regulations more directly.
The analysis of innovation for environmental protection also needs to be treated with
caution. Lanjouw and Mody (1996) used patents on pollution control technology to examine
the connections between environmental regulation and innovation. Their patent data cover
nine environmental fields, namely, industrial and vehicular air pollution, waste pollution,
hazardous and solid waste disposal, incineration and recycling of waste, oil spill clean-up, and
alternative energy. Relevant patents were identified by determining the International Patent
Classification (IPC) classes corresponding to various types of environmentally responsive
innovation. For example, the IPC classes which are considered to include patents on
technologies dealing with industrial air pollution are as follows: chemical purification of
waste gases (B01D-53/34), chemical purification of waste gases by catalytic conversion
(B01D-53/36), purifying/modifying gases containing carbon monoxide (C10K-1/3), adding
materials to fuels or fires to reduce smoke (C10L-3), burning uncombusted material… (F23B-
Green Index, which was complied by simply adding up the number of statutes from environmental laws (Levinson, 1996). 8 A number of issues related to the concept of PACE and the treatment of its statistical estimation are discussed in Schmalensee (1994). 9 Xing and Kolstad (1995), for example, adopted sulfur dioxide (SO2) as a variable to reflect the overall level of environmental regulations when they examined the impact of environmental regulations on foreign direct investment.
44

5), removing solid residues, i.e., soot blowers (F23J-3), and …devices for treating smoke or
fumes (F23J-15). These IPC classes were identified by using three keywords, namely, “treat,”
“scrub,” and “remove.” Similarly, Bhanagar and Cohen (1999) used successful environmental
patent applications as a proxy for environmental innovation. Those patents counted as
environmental patents involve hazardous or toxic waste destruction or containment, recycling
or reusing waste, acid rain prevention, solid waste disposal, alternative energy sources, air
pollution prevention, and water pollution prevention. As we can see from these lists, most of
the technologies identified as environmental technologies are equipment installed at the end
of the main process to remove or reduce emissions. That is, these studies basically looked at
end-of-pipe technologies when they examined the technological effects of environmental
regulations. The possibility of technologies for eliminating pollution from within the
production process by changing the main chemical reaction, that is, clean technologies, is
mostly missing from their consideration of innovations related to environmental protection.
Jaffe and Palmer (1997), on the other hand, used data on the whole R&D expenditures
and patent applications in industries to examine the full extent of innovation. That is, their
research covers not only technologies for environmental protection, which would include
clean technologies as well as end-of-pipe technologies, but also technologies related to
products and production processes in general. While this approach does not fail to capture
innovations potentially influenced by environmental regulation in any way, many innovations
which are not related to considerations for environmental protection are also included in the
data set. Thus this method of technological measurement would not be entirely appropriate
for the analysis of the effects of environmental regulation on technological change.
In sum, their results seem to suggest that increased stringency in environmental
regulation encourages patent applications for environmental technologies, mainly those of the
end-of-pipe type, but does not influence applications for patents on technologies in general.
On the other hand, more stringent regulation seems to raise R&D expenditures in general, but
not those on technologies designed for pollution abatement and control, which are basically
end-of-pipe technologies. As these findings are mixed at aggregate levels, an in-depth
analysis is necessary to thoroughly investigate the relationship between environmental
regulation and technological change. In particular, attention needs to be paid to the crucial
aspect of technological characteristics, that is, the distinction between end-of-pipe
technologies and clean technologies. While technologies of the former type are relatively easy
to find, those of the latter are particularly difficult to identify at aggregate levels, as they do
45

not produce pollutant emissions in the first place and require detailed knowledge and
observation. In the following sections, we will examine the difference between end-of-pipe
technologies and clean technologies and, based on that, discuss our framework for the
analysis of effects of environmental regulation on technological change.
2.2 Technologies for Dealing with Emissions from Chemical Industries
Here we analyze technologies for dealing with emissions from the chemical process industries,
which are considered to be among the most pollution-intensive sectors, by explicitly
considering chemical reaction equations10. In the chemical process industries, production
processes basically consist of four components, namely, the reaction system, separation
system, recycling system, and waste treatment system (Mizsey, 1994)11. A production process
used in the chemical process industries normally start with input materials Ia and Ib and
produce main product M and by-product B
Ia + Ib -> M + B.
It can be schematically drawn as in Figure 2-5.
10 Technological trends in pollution-intensive industries, including, other than those mentioned above, the iron and steel, petroleum refining, and textile industries, are discussed in more detail in Bartzokas and Yarime (1997). 11 In addition, the reaction system normally involves the heat exchange system for the provision of energy. Energy-consumption wastes, including flue gas and ash from fuel combustion, are emitted from the heat exchange system. For making our discussion simple, we do not consider this type of waste here.
46

Inputs Ia + IbReactionSystem
SeparationSystem Main Product M
By-product B
TreatmentSystem
RecyclingSystem
Residues
End-of-PipeTechnology
Clean Technology
Other ProductionProcesses
Figure 2-5 End-of-Pipe Technology and Clean Technology Applied in Chemical Process Industries
The types of technological change designed for environmental protection can be
different, depending on the source of pollution, that is, the main product M* or by-product
B*12. When the main product M* causes disruptions on the environment, the product itself
needs to be changed. Among the examples are the chlorofluorocarbons (CFCs), which have
been replaced by substitute chemical substances, following the international agreement on the
phase-out of their production and use13. When the by-product B* of a manufacturing process
is the source of pollution, there are, broadly speaking, two types of technological change to
deal with them, that is, the end-of-pipe technology and the clean technology 14 . Since
traditionally the source of environmental disruption in the chemical process industries has
12 The asterisk denotes that the substance is a pollutant or a hazardous material. 13 Technological change for the main product is discussed in more detail in Appendix. 14 Depending on the focus of analysis, other ways of classification would be possible. Green and Irwin (1996), for example, suggest that environmental technologies can be divided into four categories: (1) end-of-pipe treatment; (2) end-of-pipe recovery for use in the same process or for use elsewhere; (3) efficiency improvements in the production process (waste minimization) and substitution of process materials; and (4) radical redesign of the production process.
47
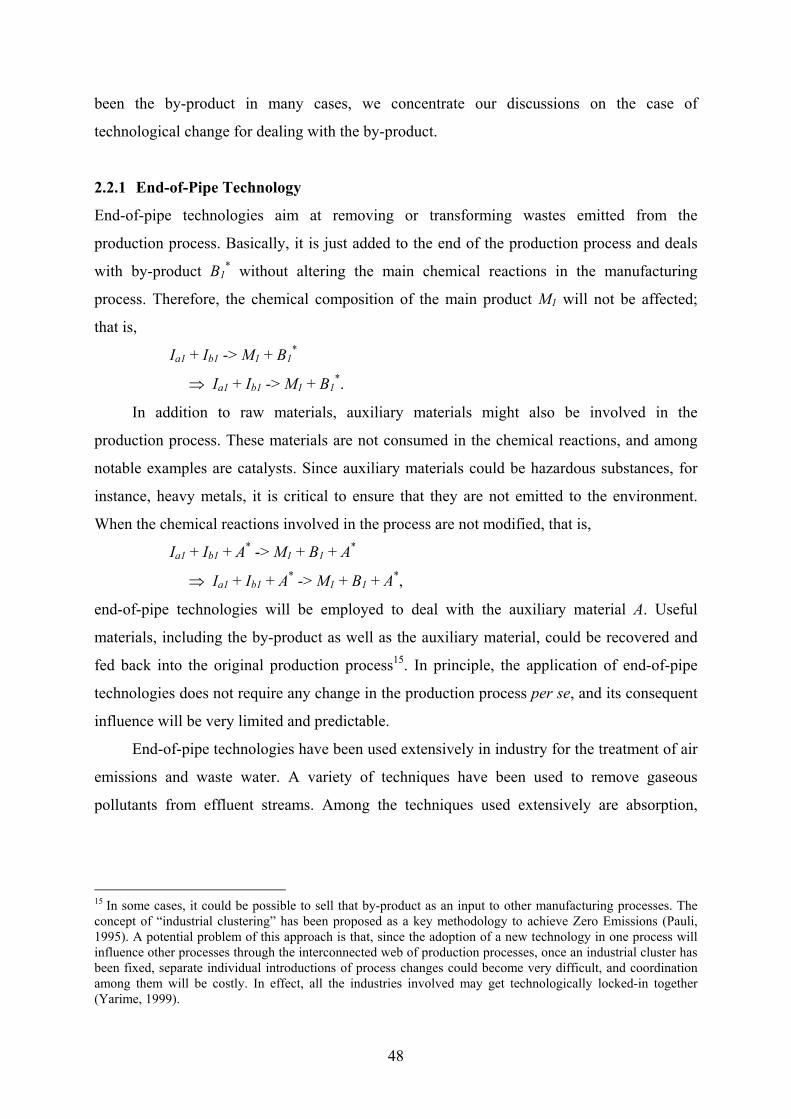
been the by-product in many cases, we concentrate our discussions on the case of
technological change for dealing with the by-product.
2.2.1 End-of-Pipe Technology
End-of-pipe technologies aim at removing or transforming wastes emitted from the
production process. Basically, it is just added to the end of the production process and deals
with by-product B1* without altering the main chemical reactions in the manufacturing
process. Therefore, the chemical composition of the main product M1 will not be affected;
that is,
Ia1 + Ib1 -> M1 + B1*
⇒ Ia1 + Ib1 -> M1 + B1*.
In addition to raw materials, auxiliary materials might also be involved in the
production process. These materials are not consumed in the chemical reactions, and among
notable examples are catalysts. Since auxiliary materials could be hazardous substances, for
instance, heavy metals, it is critical to ensure that they are not emitted to the environment.
When the chemical reactions involved in the process are not modified, that is,
Ia1 + Ib1 + A* -> M1 + B1 + A*
⇒ Ia1 + Ib1 + A* -> M1 + B1 + A*,
end-of-pipe technologies will be employed to deal with the auxiliary material A. Useful
materials, including the by-product as well as the auxiliary material, could be recovered and
fed back into the original production process15. In principle, the application of end-of-pipe
technologies does not require any change in the production process per se, and its consequent
influence will be very limited and predictable.
End-of-pipe technologies have been used extensively in industry for the treatment of air
emissions and waste water. A variety of techniques have been used to remove gaseous
pollutants from effluent streams. Among the techniques used extensively are absorption,
15 In some cases, it could be possible to sell that by-product as an input to other manufacturing processes. The concept of “industrial clustering” has been proposed as a key methodology to achieve Zero Emissions (Pauli, 1995). A potential problem of this approach is that, since the adoption of a new technology in one process will influence other processes through the interconnected web of production processes, once an industrial cluster has been fixed, separate individual introductions of process changes could become very difficult, and coordination among them will be costly. In effect, all the industries involved may get technologically locked-in together (Yarime, 1999).
48

adsorption, condensation, incineration, and selective diffusion through membrane 16 . For
removal of particles from gaseous effluents, there are several classes of control equipment.
They are chambers, cyclones, electrostatic precipitators, filters, and scrubbers17. Industrial
waste waters may contain toxic constituents such as heavy metals, or hazardous dissolved or
immiscible solvents. There are also a number of end-of-pipe technologies have been adopted
to deal with them18.
An example of the use of end-of-pipe technologies can be seen in the production of
nitric acid (HNO3). The chief environmental problem of nitric acid plant operation is the
discharge of nitrogen oxides (NOx), which consists of nitric oxide (NO) and nitrogen dioxide
(NO2), from the vent stack (European Fertilizers Manufacturers' Association, 1995). In the
oxidation section of nitric acid plants, ammonia is reacted with air on catalysts, forming nitric
oxide and water (H2O) according to the main equation:
4NH3 + 5O2 -> 4NO + 6H2O.
Nitric oxide is oxidized further to nitrogen dioxide as the combustion gases are cooled,
according to the equation:
2NO + O2 <-> 2NO2*.
16 Absorption is commonly used for devices such as columns containing packing or regularly spaced plates, open spray chambers and towers, and combinations of sprayed and packed chambers. Industrial applications of adsorption include odor control and the removal of volatile solvents such as benzene, ethanol, and trichloroethylene from effluent streams. Condensation is carried out in a device which appropriately cools the gas stream to remove condensed liquid. Incineration involves the combustion of unwanted chemicals at high temperature to convert them to harmless products such as carbon dioxide and water and is an important process for the treatment of toxic chemicals, where virtually complete removal is necessary. Selective diffusion processes through membrane have been applied for removing gases such as carbon dioxide, hydrogen sulfide, and hydrogen from natural gas (Flagan and Seinfeld, 1988). 17 Mechanical collectors such as settling chambers and cyclones are typically suitable for relatively large particles and are often used as precleaners for the more efficient final control devices. Electrostatic precipitators are one of the most widely adopted particulate control devices, routinely used for fly ash removal from power plant flue gases as well as for the collection of particles and acid mists in the chemical and metallurgical process industries. The filtration of particles from gas streams is a major class of particulate air pollution control devices, and fabric filters are frequently used to remove solid particles from industrial gases, whereby the dusty gas flows through fabric bags and the particles accumulate on the cloth, and, in particular, to treat combustion gases from coal-fired boilers. Scrubbers are wet collection devices in which small particles can be removed from the gas flow by collision with water droplets, with the possibility of simultaneously removing soluble gaseous pollutants (Flagan and Seinfeld, 1988). The handling and disposal of large volumes of scrubbing liquids must be undertaken, however. 18 Liquid waste streams with a high suspended solids content have been cleaned up by solids removal in clarifiers, thickeners, and liquid cyclones and by accelerated settling by inclined settlers. Dissolved air flotation techniques have been used to deal with waste streams with very finely divided solids in suspension. Final de-watering of the sludges obtained can be carried out on a continuous filter or a centrifuge, and the separated solids can be burned or discarded to landfill. Liquid waste streams containing an insoluble liquid, such as those which arise from extraction processes, from steam ejectors operating on solvent distillation systems, or from the loss of heat exchange fluid from a heat exchanger, are phase-separated with a simple settler prior to final
49

The absorption of the nitrogen oxide to water and its reaction to nitric acid take place
according to the equation19:
3NO2 + H2O <-> 2HNO3 + NO*.
Here the main product is nitric acid (HNO3), whose production is the purpose of this
industrial process, and the by-product are nitric acid (NO) and nitrogen dioxide (NO2), which
together comprise harmful nitrogen oxides (NOx).
There are two types of end-of-pipe technologies for NOx control. One type of
technology is non-selective catalytic reduction (NSCR), and the other is selective catalytic
reduction (SCR). In the NSCR process, NOx and free oxygen in the waste gas reacts with
hydrogen, natural gas, or naphtha over a platinum, rhodium, or palladium catalyst, reducing
NOx to nitrogen and water. In the SCR process, NOx in the tail gas reacts with ammonia and
only to a lesser extent with oxygen over a catalyst, which can be vanadium pentoxide,
platinum, iron/chromium oxides, or zeolites. In either case, the tail gas is preheated and mixed
with the reactant gas, and the mixture is passed into a reactor containing the catalyst bed.
Thus the main reactions producing nitric acid are not changed, and only these end-of-pipe
technologies are added to the main process.
These technologies of the end-of-pipe type are basically designed for installation at the
end of the production process, without altering the chemical reactions manufacturing the main
product. Technical principles and properties of this type of equipment have been well
understood in academic disciplines, particularly in chemical engineering, which deals with
how to design chemical reactors and equipment based on transport phenomena (Bird, Stewart,
and Lightfoot, 1960), thermodynamics (Smith and Van Ness, 1959), and chemical reaction
engineering (Levenspiel, 1962). And their feasibilities have been demonstrated through
traditional uses for pollution control in many industrial sectors. Thus the scope of R&D
activities for end-of-pipe technologies will be relatively limited, and the uncertainty
accompanied by this exploration for new equipment will not be so large. Compared with
modifying the whole production process, the installation of an end-pipe technology to the
existing production facilities will be relatively easy and cost much less, at least from a short-
term perspective.
disposal. The concentration of residual organics can be further reduced with an entrained or dissolved air flotation unit coupled with the initial separator (Hocking, 1998). 19 To make it easy to make a distinction between the main product and the by-product in chemical reactions, the main product is underlined with a straight line like M, and the by-product by a dotted line like B.
50

Just as end-of-pipe technologies do not affect the main process, being installed at the
end of the existing production facilities, however, their operating costs are simply added to
the output production costs, which will result in an increase in the total manufacturing costs.
While the operating costs of end-of-pipe technologies could decline, the output production
costs will not be changed, as R&D activity and learning experience on end-of-pipe
technologies will not improve the principal process producing the main product. Furthermore,
although there are some types of end-of-pipe technologies which are very effective in
reducing emissions, it will be extremely difficult, technically speaking, to completely
eliminate pollutant discharges with end-of-pipe technologies, and some of the materials will
be inevitably emitted to the environment. When the environmental regulation is so stringent
as to require total elimination, the adoption of end-of-pipe technologies is not sufficient, and
clean technologies will need to be developed and employed.
2.2.2 Clean Technology
The function of the clean technology is to eliminate the creation of pollutants from within the
production process20. In chemical process industries, this means that the chemical reactions
involved in producing the main product are modified. New routes of chemical reactions in
which the formation of pollutants is prevented in the first place had to be found, and
technologies which are feasible to implement them at the industrial level need to be
developed21. By changing the input materials from Ia1 and Ib1 to Ia2 and Ib2 (including the
possibility of using the same Ib1 instead), the environmentally undesirable by-product B1* can
be changed to another material B2; that is,
Ia1 + Ib1 -> M1 + B1*
⇒ Ia2 + Ib2 -> M1 + B2.
Various types of clean technologies have begun to be developed and utilized in industrial
production.
20 There are many ways of defining clean technology. Hanmer (1997) takes the term in a broad sense, incorporating technologies for pollutant and waste minimization, as well as energy and natural resource efficiency, applicable to various stages in the production, use, and disposable/reuse of products and to the provision of service. Jackson (1994) adopts a view that it is an operational approach to the development of the system of production and consumption, which incorporates a preventive approach to environmental protection. To address the qualitative difference from the end-of-pipe technology, we define the clean technology rather narrowly in this research. For a detailed discussion on various ways of defining the clean technology, see McMeekin and Green (1995).
51

For example, methyl methacrylate (MMA, CH2=C(CH3)COOCH3), which is an
important monomer in the plastic industry, is usually synthesized from propylene
(CH3CH=CH2) and benzene (C6H6) via acetone (CH3COCH3). This route, which is called the
acetone-cyanohydrin (ACH) route, also contains hazardous reagents such as hydrogen
cyanide (HCN) and sulfuric acid (H2SO4). The chemical reactions involved in this process are
given below (Ikeda, Tokutomi, and Nakajima, 1998):
C6H6 + CH3CH=CH2 + -> C6H5-CH(CH3)2
C6H5-CH(CH3)2 + O2 -> C6H5OH + CH3COCH3
CH3COCH3 + HCN -> (CH3)2C(OH)CN
(CH3)2C(OH)CN + H2SO4 -> CH2=C(CH3)CONH2·H2SO4
CH2=C(CH3)CONH2·H2SO4 + CH3OH -> CH2=C(CH3)COOCH3 + NH4HSO4.
The overall stoichiometry is as follows:
CH3CH=CH2 + C6H6 + O2 + HCN + H2SO4 + CH3OH
-> CH2=C(CH3)COOCH3 + C6H5OH + NH4HSO4*.
While phenol (C6H5OH) can be used for other purposes in different industrial sectors,
ammonium hydrosulfate (NH4HSO4) is formed as process waste, which has often been simply
dumped at sea.
In contrast, a new production path to MMA, the so-called ethylene route, is an example
of the clean technology. The route uses as inputs ethylene (CH2=CH2) and the synthesis gas,
which consists of carbon monoxide (CO) and hydrogen (H2). The chemical reactions involved
in the ethylene process are as follows (Suckling, 1994):
CH2=CH2 + CO + H2 -> CH3CH2CHO
CO + 2H2 -> CH3OH
CH3OH + 1/2O2 -> HCHO + H2O
CH3CH2CHO + HCHO -> CH2=C(CH3)CHO + H2O
CH2=C(CH3)CHO + 1/2O2 -> CH2=C(CH3)COOH
CH2=C(CH3)COOH + CH3OH -> CH2=C(CH3)COOCH3 + H2O.
The overall stoichiometry thus becomes:
CH2=CH2 + 3CO + 5H2 + O2 -> CH2=CCH3COOCH3 + 3H2O.
The by-product is only water (H2O), a harmless substance.
21 As a methodology for achieving this, Anastas and Warner (1998) propose “green chemistry,” which is defined as the utilization of a set of principles that reduces or eliminates the use or generation of hazardous substances in the design, manufacture and application of chemical products.
52

Another clean technology, the so-called C4 oxidation route, starts with isobutane
(CH2=CCH3CH3) as raw material. Isobutane is oxidized to form methacrylic acid and then to
MMA as is shown in the following chemical reactions (Ikeda, Tokutomi, and Nakajima,
1998):
CH2=C(CH3)2 + H2O -> (CH3)3COH
(CH3)3COH + O2 -> CH2=C(CH3)CHO + 2H2O
CH2=C(CH3)CHO + 1/2O2 -> CH2=C(CH3)COOH
CH2=C(CH3)COOH + CH3OH -> CH2=C(CH3)COOCH3 + H2O.
Therefore, the overall stoichiometry can be expressed as follows:
CH2=C(CH3)2 + 3/2O2 + CH3OH -> CH2=C(CH3)COOCH3 + 2H2O.
Again, water is the only by-product. The formation of the unwanted by-product ammonium
hydrosulfate is avoided by changing the chemical reactions producing the main product
MMA.
In many industrial processes, auxiliary materials are also used to produce the main
product. An auxiliary material A1 can enhance the rate of the principal reaction while it is not
changed itself during the reaction:
Ia1 + Ib1 + A1 -> M1 + B1 + A1.
One notable example is the use of catalysts. When a hazardous auxiliary substance A1* is used,
it is desirable to avoid its discharge to the environment. That could be achieved by replacing
it with another material A2; that is,
Ia1 + Ib1 + A1* -> M1 + B1 + A1
*
⇒ Ia1 + Ib1 + A2 -> M1 + B1 + A2.
In some cases, it might be necessary to change the input materials from Ia1 and Ib1 to different
substances Ia2 and Ib2, together with change in the auxiliary material. That would also affect
the by-product, changing B1 to B2:
Ia1 + Ib1 + A1* -> M1 + B1 + A1
*
⇒ Ia2 + Ib2 + A2 -> M1 + B2 + A2.
A tragic example of this case concerns emissions of mercury from the production
process of acetaldehyde (CH3CHO), which has been used as a starting material for making
many organic compounds. Initially, the industrial process for producing acetaldehyde, the so-
called acetylene process, started with acetylene (CH≡CH), whose production utilized calcium
carbide and coke produced from coal. The reactions involved were as follows (Heaton, 1996):
53

CaCO3 -> CaO + CO2
CaO + 3C -> CaC2 + CO
CaC2 + 2H2O -> CH≡CH + Ca(OH)2.
The acetylene was then reacted with water, using mercury (Hg) as a catalyst:
CH≡CH + H2O + Hg* -> CH3CHO + Hg*.
At the same time, a type of organic mercury, namely, dimethyl mercury, was also produced as
a by-product in the production process (Nishimura and Okamura, 2001). The waste waters
discharged by an acetaldehyde plant at the Minamata Bay in the southern part of Japan
contained traces of dimethyl mercury. This harmful substance was then ingested in the fish
diet of the inhabitants and eventually caused incidences of brain damage and death among
those who had fish in the region. Although the acetylene process had once accounted for two
thirds of the total national production of acetaldehyde, it was in the end abandoned
completely in Japan following this tragedy (Iijima, 1990a).
The acetylene process has been replaced by the Wacker process. In this process,
ethylene (CH2=CH2) is oxidized in aqueous solutions of palladium chloride (PdCl2) and
copper chloride (CuCl2) as is shown in the following chemical reactions (Gates, 1992):
CH2=CH2 + H2O + PdCl2 -> CH3CHO + Pd + 2HCl
Pd + 2CuCl2 -> PdCl2 + 2CuCl
2CuCl + 1/2O2 + 2HCl -> 2CuCl2 + H2O.
Summing these chemical reaction equations gives the simple stoichiometry of the ethylene
oxidation:
CH2=CH2 + 1/2O2 -> CH3CHO.
Here palladium chloride and copper chloride perform the function of catalysis, and the
acetaldehyde production does not rely on the toxic mercury, thus completely eliminating its
emissions to the environment. The ethylene process soon become an very efficient technology
economically and has completely replaced the acetylene process in the end (Nishino, 1998).
As we have seen, in contrast to end-of-pipe technologies, which are designed for just
being installed at the end of to the existing production facilities, clean technologies concern
the whole production process. Clean technologies involve fundamental changes in the main
chemical reactions for total elimination of pollutant emissions, a result which is very difficult
to achieve simply by treating emissions at the end of the production process. The
development of clean technologies demands careful and intensive research activities on novel
54

reactions, input materials, or catalysts. The performance of new clean technologies would be
lower initially, with higher costs of producing the main product by using them. The technical
performance could make a significant progress subsequently, depending on the extent of
R&D efforts and learning experiences, and the output production cost could be reduced in the
long run. That is not likely to happen in the case of end-of-pipe technologies, because they do
not make any change in the main production process, and their operation costs are simply
added to the output production cost.
On the other hand, as we have seen, there are usually multiple choices of clean
technologies which can replace the existing, pollution-laden technology. With a large degree
of uncertainty about technological and economic consequences of alternative technologies, it
is no easy task to choose one which will be the most appropriate from a long-term perspective.
Furthermore, as the chemical reactions are changed, so are the reaction conditions, including
temperature and pressure. That will require revisions and modifications of the size and shape
of plant and equipment and the materials used for their constructions. An important
implication of that is that the investment costs required for clean technologies will be much
larger than those for end-of-pipe technologies. Once a particular clean technology has been
established, it will be very costly to make a switch to another one later.
In sum, by using chemical reaction equations, we have classified pollution abatement
technologies used in the chemical process industries into two categories, namely, the end-of-
pipe technology and the clean technology. While end-of-pipe technologies have been
traditionally adopted and their technical properties have been relatively well established,
clean technologies are radically new innovations, affecting the entire production process, and
thus involve a large uncertainty in R&D as well as in future progress. And, as clean
technologies replace the whole production process, there exists multiplicity in technological
options, and the large investment required for installation gives the character of rigidity to
clean technologies. With this qualitative distinction between the end-of-pipe technology and
the clean technology, we will construct our analytical framework for the effects of
environmental regulation on technological change in the following sections. Then our
empirical study will examine the case of technological change observed in the chlor-alkali
industry in Japan and Western Europe in the subsequent chapters.
55
2.3 Diverging Effects of Environmental Regulations on Technological Change
2.3.1 Environmental Policy Making under Uncertainty
As we saw in many of the earlier theoretical models, the advantages of policy instruments
based on economic incentives have been often claimed by economists. These models are
mostly constructed on the condition of the certainty and completeness of information
possessed by the agents. The regulator is assumed to have complete information on the
marginal damage curve of pollution. In other words, public authorities have sufficient
capabilities to identify the mechanism of the behavior and reactions of the pollutants and then
to calculate accurately the damage caused by the pollution on the environment. According to
this information, the government is assumed to be able to set the proper level of the Pigouvian
tax upon the activities of the generator of an externality, which should be equal to the
marginal damage produced by that activity.
The amount of information necessary for the implementation of optimal policies,
however, will be prohibitively large. There is a significant amount of uncertainty involved in
identifying the sources of pollution and in understanding the scientific mechanisms of the
behavior of the polluting substances in the environment. And, as research activities continue
to generate new findings, scientific information itself will be subject to change22. It is unlikely
that we can expect, in a reasonable period of time, to have certain, full information
concerning the social cost of the damages. Thus it will be extremely difficult, if not
impossible, to estimate accurately the costs of the environmental damages imposed by
emissions, including increased illness, reduced recreational opportunities, impairment of
materials, and ecological impacts23. In the presence of such a large extent of uncertainty about
sources, mechanisms, and damages of environmental pollution, we cannot expect to be
completely sure whether the level of the emission tax is optimal or not24. There seems to be
22 This point is particularly true in the case of the potential impacts of the greenhouse gasses on climate change. More details on the progress in scientific knowledge can be seen in the reports made by the Working Group I of the Intergovernmental Panel on Climate Change (Houghton, Ding, Griggs, Noguer, van der Linden, Dai, Maskell, and Johnson, 2001; Houghton, Meira Filho, Callander, Harris, Kattenberg, and Maskell, 1996). 23 The contingent valuation method has been proposed by economists to estimate the damage done by spills of oil, chemicals, or other substances. It involves the use of sample surveys or questionnaires to elicit the willingness of respondents to pay for hypothetical projects or programs. See Portney (1994) for an overview of the technique and the debate surrounding it and Hanemann (1994) and Diamond and Hausman (1994) for cases for and against, respectively. 24 The choice between price and quantitative instruments in the presence of uncertainty about marginal damage function or marginal control cost has been discussed in terms of static efficiency in the absence of technical change. When the marginal damage function is uncertain, all instruments yield the same expected social surplus because firms respond to the policy choice along the cost curve, independent of the shape of the damage function. In the case of uncertainty about the marginal control cost, on the other hand, the choice of the optimal
56

no general way in which we can obtain the accurate and detailed information required to
implement the Pigouvian tax approach.
Instead, Baumol and Oates (1988) propose the environmental charges and standards
approach, that is, the use of pollution charges to achieve a predetermined set of standards for
environmental quality. They argue that, under appropriate conditions, the use of unit taxes is
the least-cost method for the achievement of specified targets. If the initial taxes do not
reduce the pollution in the environment sufficiently to satisfy the present acceptability
standards, public authorities will raise the tax rates, and some of the polluting firm will have
to modify their operations as tax rates are changed. This procedure will be repeated until the
level of emissions will be adjusted to meet the specified targets. A crucial problem of this
approach, as they acknowledge, is that such an iterative process will not be costless. Policy
makers need to keep monitoring the accurate level of pollutants in the environment and to
make necessary adjustments in the tax rates frequently. That approach will make the
administrative costs rather high25.
In practice, economic instruments have been used only to a minor degree, compared
with conventional, command-and-control instruments. Regarded as more practical and easier
to implement than the economic approaches, command-and-control instruments have been
adopted far more frequently in the past to combat various types of pollution26. For air and
water pollution control, all of the OECD countries have policies based on ambient
environmental standards, and all use specific source discharge standards to accomplish them
instrument depends on the relative slopes of the marginal damage and marginal cost functions. When the marginal damage curve is steeper than the marginal cost curve, quantitative instruments will be the better policy approach, and vice versa (Adar and Griffin, 1976; Fishelson, 1976; Weitzman, 1974). Mixtures of policy instruments are discussed by Roberts and Spence (1976). Mendelsohn (1984) shows that when innovation is possible, additional welfare loss is induced with price instruments, because firms overreact to the price instrument, producing too much or too little emission. 25 Cole and Grossman (1999) argue that where abatement costs are relatively low and monitoring costs are relatively high, command-and-control is likely to be at least as efficient (and effective) as effluent taxes. 26 Other factors could be considered for the predominance of command-and-control over market-based instruments: the training and experience of legislators may make them more comfortable with a direct standards approach than with market-based approaches; the time needed to learn about market-based instruments may represent significant opportunity costs; standards tend to hide the costs of pollution control while emphasizing the benefits; standards may offer greater opportunities for symbolic politics; and finally, at the level of the legislature, command-and-control standards offer legislators a greater degree of control over the distributional effects of environmental regulation (Keohane, Revesz, and Stavins, 1998). On the other hand, firms would be likely to prefer direct controls over emission taxes because emission standards serve as a barrier to entry for new firms, thus raising profits of existing firms (Dean and Brown, 1995). Taxes also require firms to pay not only abatement costs to reduce pollution to a specified level, but also costs of polluting up to that level (Buchanan and Tullock, 1975). For a unified framework for the political economy of environmental regulation, which views the outputs of environmental policy as emerging from a struggle between key interest groups, see Hahn (1990).
57

(Kopp, Portney, and DeWitt, 1990). According to a comprehensive survey of the use of
economic instruments in OECD member countries, the number of economic instruments,
defined narrowly to exclude subsidies, liability and administrative charges, was about 100,
which was equivalent to an average of seven per country (Organisation for Economic Co-
operation and Development, 1994). Many of these instruments were of little significance, and
only a small proportion could be categorized as economic instruments in the stricter sense of
measures which use financial incentives to encourage more appropriate environmental
behavior. Economic efficiency was seldom a stated goal of the economic instruments27, and
the principal objective of the charging systems appeared to raise revenues. Based on these
findings, the study concluded that the way in which environmental policies in OECD
countries achieved changes in polluting behavior and consequent improvements in the
environment was through measures of the command-and-control type. It is thus very difficult
for an empirical study to compare the effects of different economic instruments on
technological change in the same environmental issue.
Accordingly, in the subsequent discussions, we will focus on the analysis of the effects
of command-and-control approaches on technological change. Given the presence of
uncertainty concerning the estimation of damages on the environment due to pollutants, the
decisions on emission standards will be inevitably influenced by subjective evaluations of
what must be met for an acceptable environment 28 . It could be possible that different
standards are adopted for the reduction in emissions of an identical pollutant, depending on
historical, political, or social circumstances. For example, in one country, based on a very
high estimation of the social costs of the pollution, the polluting industry might be required to
completely eliminate emissions of the pollutant from the production process. In another
country, on the other hand, the estimation of the damage of the pollutant on the environment
might be lower, leading to the imposition of relatively weak standards on the same pollutant.
27 A notable exception is the emission trading systems, which have been adopted for pollution control over the past decade. The use of this type of instrument, however, has been largely confined to the United States (Stavins, 2000; United States Environmental Protection Agency, 2001), and other countries have little experience of implementing it. 28 An increasing number of science and technology studies suggest that, when there is a debate on the estimation of the damage caused by pollution, we cannot not always expect that the debate will be closed purely in an objective way. For case studies on how disputes in various issues concerning science and technology have been resolved or closed, see, for example, Brickman, Jasanoff, and Ilgen (1985), Engelhardt, Tristram, and Caplan (1987), and Nelkin (1992).
58
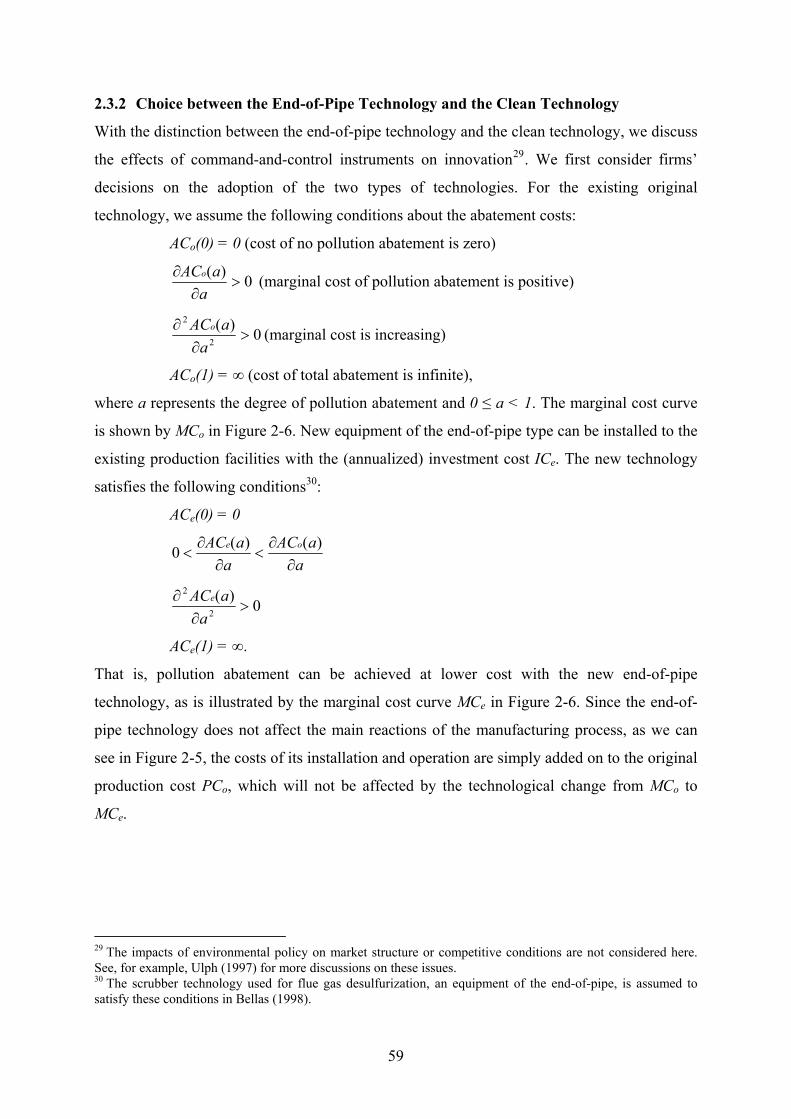
2.3.2 Choice between the End-of-Pipe Technology and the Clean Technology
With the distinction between the end-of-pipe technology and the clean technology, we discuss
the effects of command-and-control instruments on innovation29. We first consider firms’
decisions on the adoption of the two types of technologies. For the existing original
technology, we assume the following conditions about the abatement costs:
ACo(0) = 0 (cost of no pollution abatement is zero)
0)(>
∂∂
aaACo (marginal cost of pollution abatement is positive)
0)(2
2
>∂
∂a
aACo (marginal cost is increasing)
ACo(1) = ∞ (cost of total abatement is infinite),
where a represents the degree of pollution abatement and 0 ≤ a < 1. The marginal cost curve
is shown by MCo in Figure 2-6. New equipment of the end-of-pipe type can be installed to the
existing production facilities with the (annualized) investment cost ICe. The new technology
satisfies the following conditions30:
ACe(0) = 0
aaAC
aaAC oe
∂∂
<∂
∂<
)()(0
0)(2
2
>∂
∂a
aACe
ACe(1) = ∞.
That is, pollution abatement can be achieved at lower cost with the new end-of-pipe
technology, as is illustrated by the marginal cost curve MCe in Figure 2-6. Since the end-of-
pipe technology does not affect the main reactions of the manufacturing process, as we can
see in Figure 2-5, the costs of its installation and operation are simply added on to the original
production cost PCo, which will not be affected by the technological change from MCo to
MCe.
29 The impacts of environmental policy on market structure or competitive conditions are not considered here. See, for example, Ulph (1997) for more discussions on these issues. 30 The scrubber technology used for flue gas desulfurization, an equipment of the end-of-pipe, is assumed to satisfy these conditions in Bellas (1998).
59

Pollution Abatement
O 1
B
a1
MCoMCe
A E
a2
D
MCcC F G
Figure 2-6 Pollution Abatement Costs with End-of-Pipe and Clean Technologies
The clean technology, on the other hand, is a type of technology with which pollution is
eliminated from within the production process, meaning that pollutants do not form in the first
place. Hence the convex, strictly increasing marginal cost curve assumed for the end-of-pipe
technology becomes inappropriate for the analysis of the clean technology. Instead, the
marginal cost is zero over the whole region of pollution abatement:
ACc(0) = 0
0)(=
∂∂
aaACc .
That is, we can simply write
ACc = 0.
Hence, the marginal cost curve for the clean technology MCc does not depend on the level of
pollution abatement a, and is represented by the straight line OG. On the other hand, since the
clean technology involves radical modifications of the main production process, as Figure 2-5
60

shows, the output production cost PCc will be significantly affected, and the (annualized)
investment cost of its adoption ICc will be very large.
With the distinction between the end-of-pipe technology and the clean technology, we
first consider which technology firms will choose. Broadly speaking, there are two types of
theoretical approaches to the adoption of technologies, depending on what is considered as
the key factor in determining technological adoption, namely, information-based and profit-
based approaches (Karshenas and Stoneman, 1995). The first type of theoretical approach,
analogous to the epidemic or contagious models for the analysis of the spread of diseases,
emphasizes that technological diffusion results from the spread of information (Griliches,
1957). In the simplest models, the use of new technology is constrained by the number of
people who know the existence of that technology. As time proceeds, the experience of users
leads to the spreading of knowledge on the existence of that technology to non-users, who in
turn become users, leading to a further spread of information. In the case of process
technologies, however, it is very unlikely that manufacturers are unaware of their existence
for a long time, at least in industrialized countries, because normally information on
technologies are quickly available through trade journals, meetings, conferences and other
opportunities. Specialized engineering firms, in particular, are eager to provide detailed
information on their technological information to potential customers. While this is basically
an empirical question, we assume that manufacturers will adopt a technology when the
benefits from adoption is larger than the cost of adoption, that is, the profit-based approach
(David, 1975).
Thus we consider that firms will choose a technology which is less costly to adopt,
given the different nature and characteristics of the end-of-pipe technology and the clean
technology. As we have discussed, the end-of-pipe technology does not fundamentally
influence the main production process, and hence its output production cost will not be
affected, remaining the same as the original one PCo. The clean technology, on the other hand,
means that the main manufacturing process is significantly changed, and accordingly the
output production cost PCc will diverge from PCo. Since the clean technology is a newly
developed technology, it is likely that its output production cost is larger than that of the old
technology, at least initially, because otherwise it would have been already adopted. Hence
we assume that
PCc > PCo.
61

As for initial investment, the end-of-pipe technology is generally less complicated,
designed to be installed at the end of the manufacturing process, whereas the clean technology
changes the main process and requires the alteration of the whole production facilities. Hence
we can reasonably assume that the investment cost, which would not vary depending on the
degree of pollution abatement, is much larger for the clean technology than for the end-of-
pipe technology31. Thus we have
ICc > ICe.
Regarding the pollution abatement costs with the end-of-pipe technology, when an
emission standard a is introduced at a = a1 (Figure 2-6), we can see that the operating cost of
the equipment aimed exclusively at reducing emissions is area OBC. When a more stringent
emission standard a2 is imposed, then the cost necessary for operating the end-of-pipe
equipment for reducing emissions will be increased to OEF; that is, we have
ACe(a2) = OEF > OBC = ACe(a1) (a2 > a1).
The clean technology, on the other hand, does not produce any emissions, and thus there is no
cost specifically for reducing emissions. As the emission standard is raised, while the clean
technology will not be affected, the pollution abatement cost with the end-of-pipe technology
will be increased. Regarding the scale of the abatement cost, however, Robinson (1985)
reports that the operating cost of abatement equipment normally represents less than 2 percent
of the production costs in chemical process industries. Thus, as long as the emission standard
a is not extremely stringent, we expect that the operation cost of the end-of-pipe equipment
ACe(a) would be much smaller than the level of the output production cost:
PCo >> ACe(a).
With the output production costs PCo and PCc, investment costs ICe and ICc, and
pollution abatement cost ACe(a), we can see which technological choice can provide a less
costly measure for emission reduction. Given that the investment cost and the output
production are higher with the clean technology than with the end-of-pipe technology, unless
the emission standard is imposed at such a high level that the pollution abatement cost
becomes significantly large, we can reasonably expect that it is more costly to deal with
emissions with the clean technology than with the end-of-pipe technology; that is,
PCc + ICc – (PCo + ICe + ACe(a)) > 0.
31 Yanagioka (1993) reports that the cost of installing end-of-pipe equipment for dealing with emissions from electric power plants, whose sector is considered as one of the most polluting in industry, accounts for 20 per cent of the investment cost for the whole plant.
62

This implies that, facing a relatively weak regulation imposed on pollutant emissions,
companies will choose to adopt the end-of-pipe technology, rather than to newly introduce the
clean technology, at least while the development of the clean technology is still in its infancy.
Only when the emission standard is too stringent to be complied with by the end-of-pipe
technology, effectively demanding that the phase-out of the existing production technology is
necessary, companies will adopt the clean technology to eliminate emissions. Otherwise, it is
likely that the imposition of a moderate emission standard will create incentives for
companies to adopt the end-of-pipe technology, rather than the clean technology32.
Innovating firms, on the other hand, make a choice for their R&D investment between
the two types of technological measures for pollution abatement. In making that decision,
innovating firms consider the demands for the technologies they develop, because, as
discussed in the models of Milliman and Prince (1989) and Fischer, Parry, and Pizer (1998),
innovation gains to the innovating firms will be significantly influenced by how much of their
technologies will be adopted by other producers in the industry33. When the innovating firms
are those outside the industry, notably, specialized engineering firms34, the adoption of their
technologies by other firms is particularly important, because, as they are not involved in
production, there are no benefits from the reduction in production cost, and thus technology
licensing is the only source of revenues. As long as it is regarded that the clean technology is
more costly for pollution abatement than the end-of-pipe technology, polluting manufacturers
will choose the latter, not allowing the developers of the clean technology to recoup R&D
expenditures on it through its adoption by other firms. Expecting that, the innovating firms
will have little incentive to invest a large amount of resources in the clean technology, whose
development will take a long period of time with a large uncertainty in ultimate outcomes.
To sum up, pollution-emitting producers, under pressure to comply with emission
standards within a regulatory framework, will adopt end-of-pipe technologies as long as the
cost of pollution abatement with them is smaller than that with clean technologies. The
expectation that few innovation benefits can be gained from the development of clean
32 Here there is another choice to companies that that they simply do not comply with the regulation. This possibility, however, is increasingly difficult to take, at least in the industrialized countries, considering that, when it is disclosed to the public, potential negative effects on corporate image and reputation will be prohibitively high. 33 It is reported by Arora (1997) that in chemical process industries technology licensing is actually used by many innovating companies as an important means of generating revenue from process innovations. 34 The importance of innovation activities of process plant contractors is discussed in Hutcheson, Pearson, and Ball (1996).
63

technologies will in turn encourage innovating firms to concentrate their R&D efforts on end-
of-pipe technologies, rather than on clean technologies. Thus the development of clean
technologies will not be promoted, even when there is a possibility that these radically new
technologies will become
On the other hand, if the regulation imposed on pollutant emissions is so stringent that it
is extremely costly or technically impossible to achieve that target with the end-of-pipe
technology, then pollution-laden manufacturers will be prompted to adopt the clean
technology. In this case, innovating firms can be sure that there will be sufficient demands for
the clean technology to be adopted by manufactures in the industry and thus will be
encouraged to make investments for R&D on their new innovations. As the investment cost of
installing the clean technology and the production cost with it will be higher than with the
end-of-pipe technology, however, manufacturers have to incur larger expenditures for
pollution abatement, at least initially.
2.3.3 Technological Progress through R&D and Learning
In the previous section we have assumed that the performance of the two types of pollution
abatement technologies and hence the production costs with them are fixed. It is well known,
however, that technologies generally do not remain the same and will progress. In particular,
we can conceptually identify two mechanisms, namely, R&D activities and actual
experimentation of technologies, that is, technological learning, which will work to improve
the performance of technologies. The importance of R&D for technological progress has been
well illustrated in the history of industrial innovations, including those in the chemical
industry (for example, Freeman, 1982). Technological learning basically takes place in two
forms. The first is learning-by-doing (Arrow, 1962). It has been generally considered as a
form of leaning that takes place at the manufacturing stage after the product has been
designed, that is, after the R&D stage has been completed. Leaning at this stage consists of
reducing real labor costs per unit of output35. Learning-by-using (Rosenberg, 1982), on the
other hand, depends, not on the experience involved in producing the product, but on its
utilization by the final user, particularly in the case of capital goods. The performance
characteristics of a durable capital good often cannot be understood until after prolonged
experience with it, and many significant characteristics are revealed only after prolonged use,
35 For a historical review of various types of the learning curve, see Yelle (1979).
64
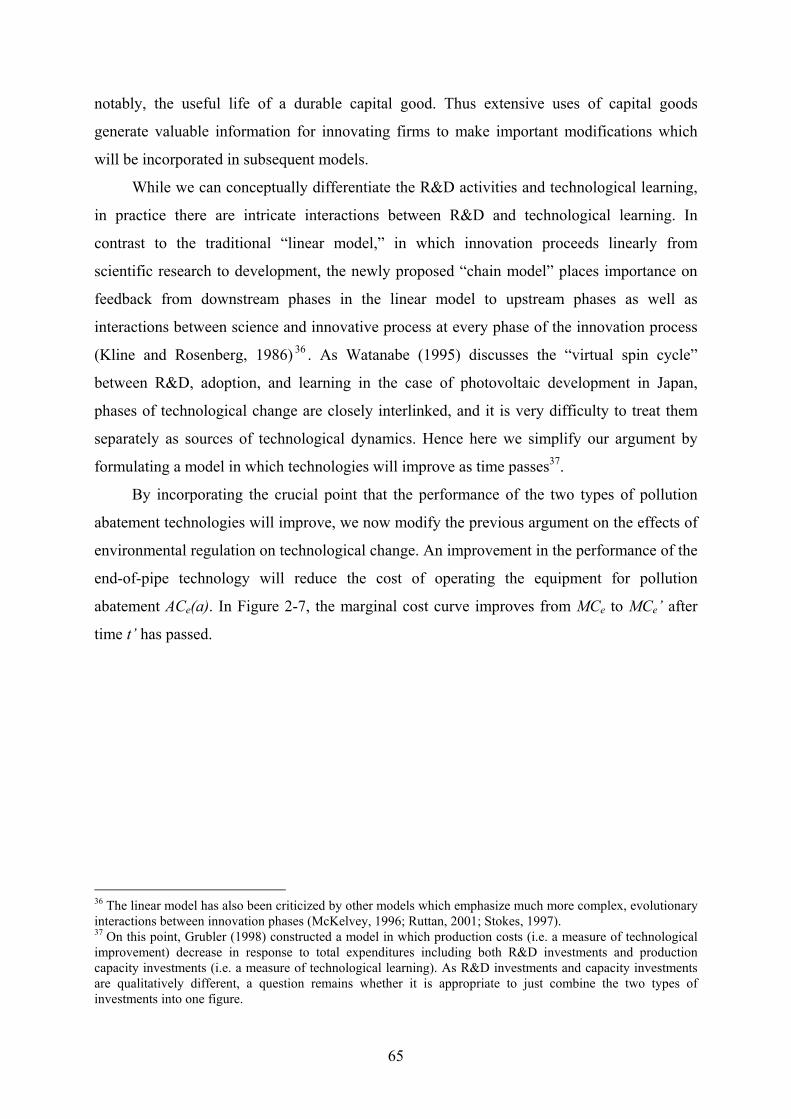
notably, the useful life of a durable capital good. Thus extensive uses of capital goods
generate valuable information for innovating firms to make important modifications which
will be incorporated in subsequent models.
While we can conceptually differentiate the R&D activities and technological learning,
in practice there are intricate interactions between R&D and technological learning. In
contrast to the traditional “linear model,” in which innovation proceeds linearly from
scientific research to development, the newly proposed “chain model” places importance on
feedback from downstream phases in the linear model to upstream phases as well as
interactions between science and innovative process at every phase of the innovation process
(Kline and Rosenberg, 1986) 36 . As Watanabe (1995) discusses the “virtual spin cycle”
between R&D, adoption, and learning in the case of photovoltaic development in Japan,
phases of technological change are closely interlinked, and it is very difficulty to treat them
separately as sources of technological dynamics. Hence here we simplify our argument by
formulating a model in which technologies will improve as time passes37.
By incorporating the crucial point that the performance of the two types of pollution
abatement technologies will improve, we now modify the previous argument on the effects of
environmental regulation on technological change. An improvement in the performance of the
end-of-pipe technology will reduce the cost of operating the equipment for pollution
abatement ACe(a). In Figure 2-7, the marginal cost curve improves from MCe to MCe’ after
time t’ has passed.
36 The linear model has also been criticized by other models which emphasize much more complex, evolutionary interactions between innovation phases (McKelvey, 1996; Ruttan, 2001; Stokes, 1997). 37 On this point, Grubler (1998) constructed a model in which production costs (i.e. a measure of technological improvement) decrease in response to total expenditures including both R&D investments and production capacity investments (i.e. a measure of technological learning). As R&D investments and capacity investments are qualitatively different, a question remains whether it is appropriate to just combine the two types of investments into one figure.
65

Pollution Abatement, a
O 1
B
a1
MCo
MCe
A E
a2
D
MCc C F G
MCe’
B’
E’
t’
Figure 2-7 Pollution Abatement Costs with Improvements in the End-of-Pipe Technology and the Clean Technology
As the end-of-pipe technology is basically separate from the output production
technology, however, R&D on the end-of-pipe technology will have no impact on the main
production process. Hence the production cost PCo will not be affected. And, as we discussed
above, the abatement cost ACe(a) is larger when the level of pollution abatement is higher. A
schematic illustration is given in Figure 2-8(a). The following conditions are satisfied:
0),(<
∂∂
ttaACe
0),(2
2
>∂
∂t
taACe
ACe(a1, t) < ACe(a2, t) (a1 < a2)
0)(=
∂∂
ttPCo (PCo is constant),
66

where t represents the time passed since the time when the technology was developed for the
first time. While improvements can be expected in the performance of the end-of-pipe
technology, which will reduce the pollution abatement cost ACe(a, t) with it, basically they
will not affect the main production process, and the production cost PCo will remain the same.
The abatement cost is simply added to the production cost of the original process. Hence the
total production cost with the original production process equipped with the end-of-pipe
technology will be PCo + ACe(a, t).
On the other hand, the clean technology will not show any improvement specifically in
pollution abatement costs because it makes no pollutant emissions in the first place. That
means that the marginal abatement cost curve MCc remains unchanged in Figure 2-7.
Technological progress through R&D and learning, however, will be directed to reduce the
output production cost PCc. As we discussed above, the clean technology involves a wholly
new process, and the extent of technological progress is subject to uncertainty. Moreover,
there are usually multiple choices of the clean technology, whose ultimate outcomes cannot
be predicted accurately in advance. For the sake of simplicity, here we consider only two
kinds of the clean technology. The first clean technology c1 looks promising at the beginning,
but will fail to achieve significant progress in the long run. The second clean technology c2
initially seems to be far inferior to the existing production technology, but will succeed in
improving rapidly, reducing the output production cost to less than that with the original
technology. Figure 2-8(b) gives a schematic illustration. That is, we have
PCo < PCc1(0) < PCc2(0)
0)()( 12<
∂∂
<∂
∂t
tPCt
tPC cc
PCc2(t*) = PCo
0)(2
12
>∂
∂t
tPCc
0)(2
22
>∂
∂t
tPCc .
We have assumed that the decline in the production cost will be subject to diminishing returns.
After the time t* has passed since the technological development, the production cost with the
clean technology c2 will become lower than that with the original technology.
67
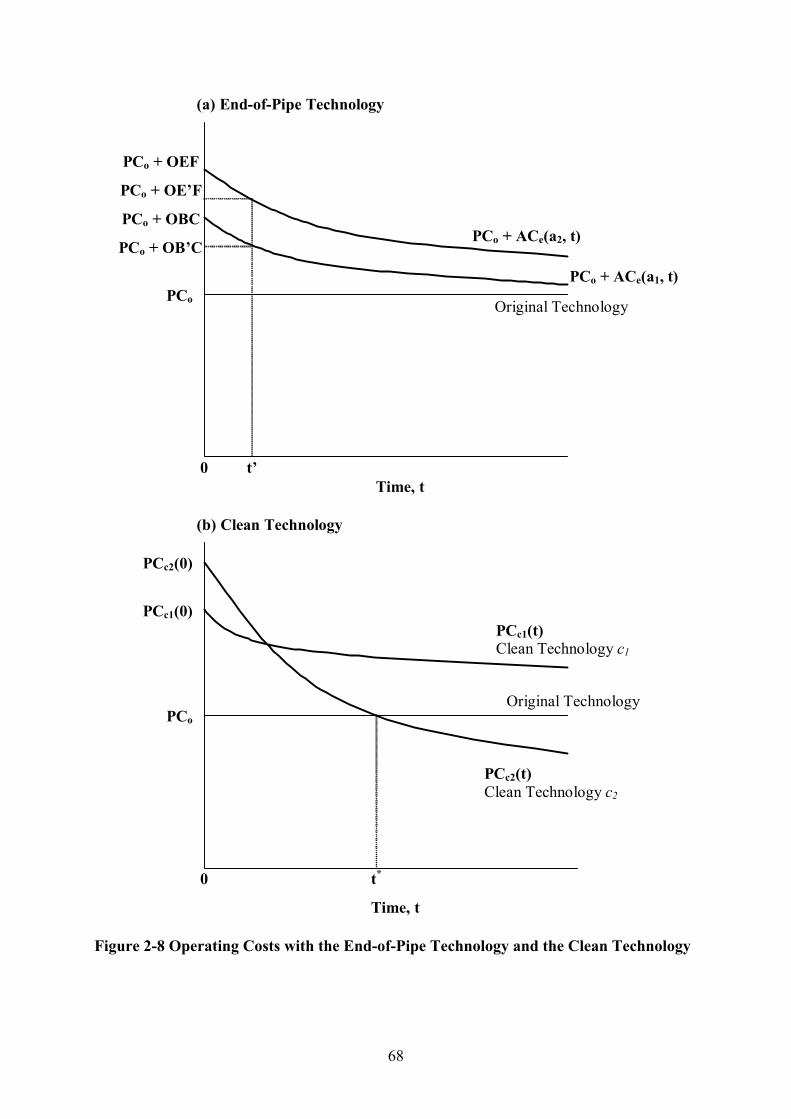
Time, t0
PCo
PCc2(0)
PCc2(t) Clean Technology c2
PCo + OBC
PCo + ACe(a1, t)
PCo + OEF
PCo + ACe(a2, t)
0
Time, t
PCo
(a) End-of-Pipe Technology
t*
(b) Clean Technology
PCc1(t) Clean Technology c1
PCc1(0)
PCo + OE’F
PCo + OB’C
t’
Original Technology
Original Technology
Figure 2-8 Operating Costs with the End-of-Pipe Technology and the Clean Technology
68

As we discussed in the static case, when the effluent standard introduced is not
extremely stringent, meaning that the pollution abatement cost ACe is relatively small, it is
likely that even the clean technology c1, which is initially more efficient the clean technology
c2, is costly to adopt, compared with the end-of-pipe technology; that is, we have the same
result as in the case of no technological progress:
PCc1(0) + ICc1 – (PCo + ICe + ACe(a, 0)) > 0.
That is, prompted by the regulation to reduce pollution to a certain emission standard,
normally by a specified deadline, companies will adopt the end-of-pipe technology, rather
than the more expensive clean technology. Users’ decisions on the adoption of the end-of-
pipe technology will create more demands for it, and that will encourage further research and
development and learning on the end-of-pipe technology, reducing the pollution abatement
cost further. While there is a possibility for the development of the clean technology c2, which
will become better than the original technology in the long run economically as well as
environmentally, it is unlikely that this technological option will be pursued, as the regulation
normally requires compliance with emission standards in a relatively short period of time,
which will not give sufficient time for technological progress. As long as the end-of-pipe
technology works to reduce emissions to a certain extent, pollution-emitting producers have a
strong incentive to continue to use the existing production technology.
In contrast, when the environmental regulation is such a stringent one that effectively
the phase out of the existing production technology is the only option, manufactures need to
switch to a new clean technology. As there are normally multiple options of the clean
technology, which one will turn out to be the most efficient could not be known ex ante
without intensive R&D efforts and technological learning through the use of it. If the
regulatory schedule demands an immediate abolishment of the existing production technology,
however, companies will have no choice other than to adopt a clean technology whose
production cost is the smallest at that time, that is, the clean technology c1. Adoptions of that
technology will promote progress in performance through R&D and learning, but how much
the technological progress will be cannot be exactly predicted under the existence of a high
degree of uncertainty concerning subsequent technological change. Eliminating diversity in
technological options at an earlier stage, the stringent regulation will result in forcing firms to
choose a particular type of the clean technology which may not be the best option from a
long-term perspective. A schematic illustration of this situation is given in Figure 2-9.
69

Time, t
0
PCc2(0)
PCc2(t) Clean Technology c2
PCo + ACe(a,0) PCo + ACe(a, t)End-of-Pipe Technology
t**
PCc1(t) Clean Technology c1
PCc1(0) Stringent regulation requiring immediate phase out of the existing process
Weak regulation
Flexible schedule for the phaseout of the existing process
PCo
Figure 2-9 Production Costs with the End-of-Pipe Technology and the Clean Technology
As investment expenditures entail sunk costs and cannot be fully recouped later,
investment has a characteristic of some degree of irreversibility. Especially in the case of the
chemical process industries, plant investment takes a long period of time and costs a
significant amount of money, and the degree of irreversibility is significantly large. Once a
large investment has been made on a particular type of the clean technology, it will be
considerably costly to switch at a later stage to a better technology, which will be known ex
post. In other words, the initial choice of the clean technology c1 carries the character of
technological lock-in38.
38 The possibility of technological lock-in has been addressed theoretically by Arthur (1989) and empirically by David (1985). Foray and Grübler (1990) examined the case of technological lock-in in the ferrous casting industry, which has had observed the diffusion of different technologies between France and Germany. Their analysis emphasizes the crucial nature of the initial stage of diffusion, where the accumulation of knowledge and learning occurs, bringing about the different technological trajectories. Frankel (1955) and Balmann, Odening, Weikard, and Brandes (1996) showed that technological complementarity and the existence of sunk costs can
70

With a flexible schedule, however, government regulation can provide an opportunity to
experiment other technological alternatives, including the clean technology c2, which seems
to be a promising technology but is still in its infancy at an initial stage. Through R&D
investment and learning experience, further technological progress will be promoted
subsequently, which otherwise would not happen under a rigidly fixed regulatory schedule.
Therefore, there are two possibilities concerning the consequence of the imposition of the
stringent regulation for the phase out of the existing technology; that is, we will observe the
dominance of the ultimately inefficient technology c1 or the emergence of the best technology
c2. By allowing more time and flexibility for actual experimentation of various types of the
clean technology, the stringent regulation can help to make the right technological choice,
that is, the clean technology c2.
Even in a region where such a strong regulation has not been introduced, there is a
possibility that the efficient clean technology c2, whose development has been encouraged by
a stringent regulation, will become available later to pollution emitters. In that case, those
producers who has been subject to relatively weak regulations, observing that the clean
technology has become more efficient than the original technology, that is,
PCc2(t) < PCo + ACe(a, t) (t > t**)
in Figure 2-9, will choose the clean technology when they construct new plants, on the
assumption that the initial investment cost is equal between the original technology and the
clean technology c2:
ICo = ICc2.
For plants which have already been well established with the original pollution-burden
technology, equipped with the end-of-pipe technology for pollution reduction, however, the
replacement of the old technology with the new clean technology c2 will not happen
immediately after time t**. That is because the saving in the production cost from the
conversion of the existing technology to the clean technology will not yet be sufficient at this
moment to offset the large amount of the initial investment cost ICc2 required for the
introduction of the new clean technology; that is,
ICc2 > PCo + ACe(a, t) – PCc2(t) (t ≈ t**)
lead to a state of lock-in. Cowan and Gunby (1996), Cowan and Hultén (1996), and Foreman-Peck (1996) also discussed other cases of technological lock-in. In the case of technologies for environmental protection, Kemp (1995) emphasizes the importance of creating “market niche” to secure the diversity of technological options. For a critical appraisal of the arguments on technological lock-in, particularly from the perspective which emphasizes the efficiency of the market mechanism, see Liebowitz and Margolis (1990; 1995).
71

in Figure 2-10. If the clean technology c2 progress substantially to the extent that, after time
t*** has passed, the saving in the production cost can cover the investment cost, that is,
ICc2 < PCo + ACe(a, t) – PCc2(t) (t > t***)
in Figure 2-10(a), then the operators of the plants based on the old production technology will
switch to the new clean technology.
On the other hand, if the efficiency of the clean technology c2 does not improve
sufficiently, then the cost saving from the technological conversion will never offset the
investment cost; that is, for any t,
ICc2 > PCo + ACe(a, t) – PCc2(t),
as shown in Figure 2-10(b). In this case, it will not be economical to convert the existing
plants based on the original production technology to those based on the new clean
technology. After time t**, there will be no new introduction of the old production technology,
and the clean technology will be adopted whenever plants are newly constructed. By that time,
however, more plants will have been constructed with the old technology, equipped with the
end-of-pipe technology, whose development was encouraged by the relatively weak
environmental regulations. Once investment has been made on plants with the old production
technology, there will be strong incentives to continue to utilize them until they cannot be
used physically. As the lifetime of chemical plants is normally over 40 years39, it will take a
long period of time before the clean technology replaces the old technology, even though it
has become clear that the latter is inferior to the former, economically as well as
environmentally.
39 Jaffe, Newell, and Stavins (1999) argue that a primary driver of replacement purchases for durable goods is the goods useful lifetime. In the case of industrial facilities, the typical service life would be in the range of 40 to 80 years.
72

ICc2
0 Time, t
PCo + ACe(a, t) – PCc2(t)(a)
(b)
ICc2
t**
Time, t0 t**
PCo + ACe(a, t) – PCc2(t)
t***
Figure 2-10 Cost Saving with the Process Conversion from the Original Technology Equipped with the End-of-Pipe Technology to the Efficient Clean Technology
Under a weak regulatory framework, the end-of-pipe technology will be favored for
reducing emissions, because it is initially much cheaper than the clean technology. With the
73
end-of-pipe technology installed, the original production technology will continue to be
adopted, and more investments will be made on plants with this technology. By the time that
a more efficient clean technology becomes available, many plants will have already been
constructed with the old production technology. Adoptions of the end-of-pipe technology, by
succeeding in reducing pollutant emissions, effectively function to prolong the lifetime of the
original, pollution-intensive technology, which may be in a process of technological
obsolescence. In other words, the imposition of weak regulation, by pushing the course of
technological trajectory towards an extension of the existing technology, will block the
development of clean, potentially more efficient, technologies.
Figure 2-11 summarizes our analytical framework for the effects of environmental
regulation on technological change.
74

Uncertainty concerning the scientific mechanism and
impacts of pollution on the environment
Stringent regulation for the phase out of the existing production technology
Relatively weak regulation on emissions by the existing
production technology
R&D on end-of-pipe technologies
Adoption of end-of-pipe technologies
Rigid and short-term regulatory schedule
Flexible and long-term regulatory schedule
Further investment in plants based on the existing
production technology
R&D on clean technologies
Premature choice of an inferior clean technology
Diffusion of the best clean technology
Continuing use of the existing production technology until the
end of plant lifetime
Insufficient time and opportunities for
technological progress
Technological progress in alternative clean
technologies
Use of the existing production technology with pollutant emissions
Figure 2-11 Diverging Effects of Environmental Regulations on Technological Change
2.4 Conclusion
Previous studies on the effects of environmental regulation on technological change mostly
considered only the end-of-pipe technology for pollution abatement. In theoretical models, the
increasing marginal abatement cost curve has been normally used to represent the character of
technologies which reduce emissions. In empirical investigations, the focus has been mainly
75
on technologies exclusively used for reducing emissions, including, for example, filters and
scrubbers. These technologies are basically equipment of the end-of-pipe type.
In our discussion, we explicitly took into account the possibility of clean technology
and emphasized the qualitative difference between the end-of-pipe technology and the clean
technology by using chemical reaction equations. Basically, the end-of-pipe technology is just
installed at the end of manufacturing plants and will not affect the main production process.
While the cost of pollution abatement is relatively small with the use of the end-of-pipe
technology, it will rise as emission standards become more stringent. The clean technology, in
contrast, eliminates the formation of pollution from within the production plant by altering the
whole process. The use of the marginal pollution abatement cost curve, traditionally used in
previous studies, is thus inappropriate for the analysis of the clean technology, which
produces no emission in the first place. Although the initial investment necessary for the
installation of the clean technology will be large, there is a possibility that its performance
will improve significantly through R&D and learning, as the clean technology involves
radical innovations in the whole production facilities. This difference between the two types
of technologies for pollution abatement is crucial in our analytical framework for the
diverging impacts of environmental regulations on technological change.
When an environmental issue occurs, normally there is a large degree of uncertainty
about where the sources of pollution are located, what the mechanisms of physical, chemical,
or biological transformation of the substances are, and how much damage has been or is
expected to be made on the human health or other living organisms. Given the existence of
this uncertainty, scientific arguments cannot exclusively determine environmental policies,
and other factors, including historical, political, and social contexts, will influence the
outcome of policy discussions. Reflecting that, it would be quite possible that diverse
regulations are imposed on the same environmental issue in different regions.
When a relatively weak regulation is imposed, firms will be induced to choose end-of-
pipe technologies, rather than clean technologies. That is because it is cheaper, at least
initially, to reduce emissions by using end-of-pipe technologies, which are just installed at the
end of the manufacturing facilities, than clean technologies involving radical changes in the
whole production process. As there are more demands for end-of-pipe technologies, R&D
efforts will be directed toward improving the performance of end-of-pipe equipment, and
learning experience will be accumulated on this type of technology. With end-of-pipe
technologies installed for successfully reducing emissions, companies will invest in and
76

continue to use the existing production technology, instead of trying to develop radically new
clean technologies, which may be the most efficient from a long-term perspective.
On the other hand, when the imposed regulation is so stringent as to effectively require
the abolishment of the existing production technology, firms will be prompted to find new
clean technologies. Normally, there are multiple options of clean technologies, and a large
degree of uncertainty exists concerning which technology will progress to become the best in
the long run. Thus, as long as the regulation is rigidly fixed, demanding the phase out of the
existing technology immediately, there is a possibility that a wrong technological choice
could be made by companies, without sufficient time or opportunities allowed for R&D and
learning. It will be known ex ante that the chosen technology may not be appropriate, after it
has been used extensively for a certain period of time. Only when the regulatory schedule
maintains some flexibility in schedule and timing, various types of clean technology will be
tested and experimented, and there is a chance that the most efficient clean technology will be
developed and adopted in the end.
Then the best clean technology developed in a region with a stringent regulation could
later become available to polluting manufacturers in other regions where the imposed
regulations were not so strong. Induced by the relatively weak regulations, however, those
manufacturers have adopted end-of-pipe technologies to reduce emissions, and by the time
when the best clean technology is available, new plants have been already established, based
on the existing pollution-laden production technology. Unless the new clean technology is
significantly more efficient than the old production technology equipped with end-of-pipe
technologies, the operators of these new plants will have strong incentives to continue to use
them until the end of their physical life time, which normally goes beyond forty years.
Effectively, the weak regulations work to help the survival of the existing production
technology, which may be actually in a process of technological obsolescence.
In short, when the regulation is relatively weak, firms will be induced to adopt end-of-
pipe technologies, instead of clean technologies. On the other hand, when a very stringent
regulation is imposed, firms will be encouraged to make innovative efforts to develop new
clean technologies, but an inappropriate technology might be chosen by companies if the
regulation is implemented in a rigid and inflexible way. Stringent environmental regulations
coupled with flexibility which allows sufficient time for R&D and learning will work to
promote the emergence of the best clean technology. With this analytical framework for the
diverging effects of environmental regulations on technological change based on the
77

distinction between the end-of-pipe technology and the clean technology, we will examine in
the next two chapters the technological impacts of environmental regulation on mercury
emissions in the chlor-alkali industry in Japan and Western Europe.
Appendix
Product Change
The main product M could be the source of environmental problems. Usually that means the
existing main product has to be replaced with a different one, as, particularly in the chemical
industry, it would be difficult to recycle completely used products, which are mainly in gas or
liquid phase40. A new product should be designed so that its detrimental effects on the
environment will be eliminated or reduced 41 , although the impact of products on the
environment may not be always predictable or even understood for decades. In the chemical
industry, a product change normally requires a change in the chemical composition of the
final product.
When the chemical composition of the main product M1* is changed to obtain M2, at
least one of the input materials Ia1 and Ib1, needs to be replaced with different substance(s) Ia2
and Ib2 (including the possibility of the same Ib1). Therefore, the whole chemical reaction will
be altered as follows:
Ia1 + Ib1 -> M1* + B1
⇒ Ia2 + Ib2 -> M2 + B1.
It should be noted that in many cases the composition of the by-product B1 would also be
transformed to B2 as a result; that is,
Ia1 + Ib1 -> M1*+ B1
40 In the “mechanical” industries, including automobile and electric and electronic industries, practices of closed-loop recycling, now called “inverse manufacturing,” has been emerging. What would be potentially crucial in achieving inverse manufacturing is dynamic aspects of technology, in particular, the gap between the pace of innovation and the product life-span, that is, the length of time that each product is likely to be used by consumers. When consumers finish using products, say, five years later, while the parts of old products might be reusable physically, probably they could be obsolescent technologically, and it would be very difficult to incorporate them to new commercial products. This gap would be particularly large in the case of high-tech products like computers (Baba, Yarime, and Hatashima, 1997). 41 As a useful tool for integrated designing, Life Cycle Assessment (LCA) has been proposed recently and begun to be adopted among firms. That approach is aimed at evaluating the environmental impacts of a product throughout its life cycle from the phase of raw material acquisition via production to consumption. For more information on LCA, see, for example, Society of Environmental Toxicology and Chemistry (1991).
78

⇒ Ia1 + Ib2 -> M2 + B2.
That means the whole chemical reaction would be changed. Therefore, although this case
could be considered basically as product innovation, process innovation would also be
required at the same time.
The use of tetraethyl lead (Pb(C2H5)4)* in gasoline provided a high-octane gasoline for
many years. However, this substance has now been phased out in many parts of the world,
including Europe, Japan, and the US, in favor of methyl t-butyl ether (CH3OC(CH3)3, MTBE).
Commercial production of MTBE began in 1979, shortly after the discovery of its octane-
improving capability for motor fuels. Although a higher proportion of this additive was
required for equivalent octane enhancement, it was less costly and eliminated the hazardous
lead particulate discharges associated with the tetraethyl lead previously used for this purpose.
Hence the convenient industrial method of producing tetraethyl lead, that is, the reaction of a
sodium-lead alloy (Na-Pb) with chloroethane (C2H5Cl)
Na-Pb + 4C2H5Cl -> Pb(C2H5)4* + Na+ + 4Cl-
was replaced with the liquid phase reaction of methanol (CH3OH) with isobutylene
(CH2=C(CH3)2), which gives this novel, oxygenated gasoline additive (Hocking, 1998):
CH3OH + CH2=C(CH3)2 -> CH3OC(CH3)3
Another recent example involves the replacement of chlorofluorocarbons (CFCs). CFCs
were once hailed as wonder products, following the discovery of the first substance, CFC-12,
in 1930. Their chemical inertness, non-flammability, and non-toxic nature rapidly led to their
large-scale use as safe refrigerants, aerosol propellants and form blowing agents in the
production of polyurethane foams. In 1974, however, it was first suggested that because of
their great stability they could rise, unchanged, into the stratosphere, where they would be
broken down by the short wavelength UV-B radiation to form chlorine radicals. These would
then attack and destroy ozone molecules through chain reactions. The consequence of the
thinning of the ozone layer would be that it could no longer prevent the harmful short
wavelength UV-B radiation reaching the surface of the earth. Following the Montreal
Protocol signed in 1987, CFCs, including CFC-11 (CCl3F), CFC-12 (CCl2F2), and CFC-113
(CClF2CCl2F), were phased out by 1996. To produce CFC-12, tetrachloromethane (CCl4)
could be reacted with hydrogen fluoride (HF):
CCl4 + 2HF -> CCl2F2* + 2HCl.
79
CFC alternatives include hydrochlorofluorocarbons (HCFCs) and hydrofluorocarbons
(HFCs) such as HFC-134a (CF3CH2F) and HFC-32 (CH2F2), whose associated ozone
depletion potential (ODP) is zero because they don’t contain any chlorine and, therefore, will
not be able to attack ozone molecules. New products are much more complex than the CFCs
they are replacing, and the required change in the route of chemical reactions would also be
large. A well-studied multi-step synthesis of HFC-134a involves the hydrogenolysis of CFC-
114a (CF3CCl2F) derived from tetrachloroethylene (CCl2=CCl2) through a series of
transformation (Manzer and Rao, 1993):
CCl2=CCl2 + Cl2 -> CCl3CCl3
CCl3CCl3 + 3HF -> CF2ClCCl2F + 3HCl
CF2ClCCl2F + HF -> CF2ClCF2Cl + HCl
CF2ClCF2Cl -> CF3CCl2F
CF3CCl2F + 2H2 -> CF3CH2F + 2HCl.
The overall stoichiometry is thus as follows:
CCl2=CCl2 + Cl2 + 4HF + 2H2 -> CF3CH2F + 6HCl.
While most CFCs are produced in a single catalytic step, alternatives such as HFC-134a
would normally require 2 to 5 complex catalytic steps (Koch, Krause, Manzer, Mehdizadeh,
Odom, and Sengupta, 1996).
The long-term viability of HFCs is not secured, however. Although the volumes of
HFCs emitted to the atmosphere are very low, compared with carbon dioxide (CO2), they
have a large global warming potential (GWP). As HFCs have been listed as one of
greenhouse gases in the Kyoto Protocols, development activities will continue to find more
environmentally desirable replacements for CFCs.
80

3. Technological Background of the Chlor-Alkali Industry
3.1 Production of Chlor-Alkali Products
3.1.1 Chlorine and Caustic Soda
The chlor-alkali industry produces a group of commodity chemicals, including chlorine (Cl2),
sodium hydroxide (caustic soda, NaOH), sodium carbonate (soda ash, Na2CO3), potassium
hydroxide (caustic potash, KOH), and hydrochloric acid (muriatic acid or anhydrous, HCl).
The analysis of this research is focused on chlorine and caustic soda, the most important
products in the chlor-alkali industry.
Chlorine
Initially, chlorine was used as a disinfectant for water treatment and the exploitation of
natural resources such as pulp and paper. Inorganic chemistry applications followed, and then
organic chemicals began to take large quantities. Since chlorine is a highly reactive element,
it is used widely in industry as a strong oxidizing agent and as a specific chlorinating agent.
Table 3-1 and Table 3-2 give the current distributions of applications of chlorine in Japan and
Western Europe.
Table 3-1 Applications of Chlorine in Japan
Application Amount of Demand (Cl2 103 tonnes/year)Vinylchloride 1,862 (37.5 %) Inorganic Chemicals 402 (8.1 %) Chloromethanes 298 (6.0 %) TDIa, MDIb 293 (5.9 %) Propylene Oxide 235 (4.7 %) Dyes and Intermediates 206 (4.2 %) Pulp and Paper 177 (3.6 %) Chlorinated Solvents 171 (3.4 %) Food 55 (1.1 %) Others 1,267 (25.5 %)
Total 4,966 (100%) a: tolylene diisocyanate b: diphenylmethane diisocyanate Source: Japan Soda Industry Association (1999a).
81
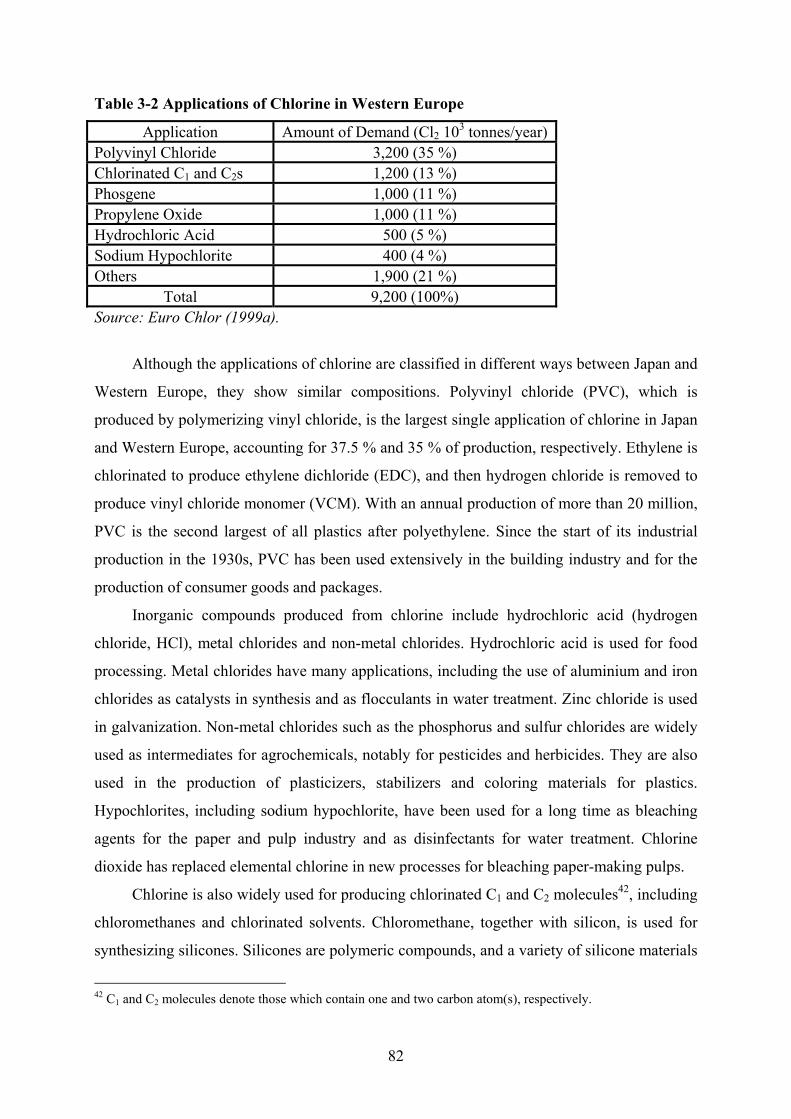
Table 3-2 Applications of Chlorine in Western Europe
Application Amount of Demand (Cl2 103 tonnes/year)Polyvinyl Chloride 3,200 (35 %) Chlorinated C1 and C2s 1,200 (13 %) Phosgene 1,000 (11 %) Propylene Oxide 1,000 (11 %) Hydrochloric Acid 500 (5 %) Sodium Hypochlorite 400 (4 %) Others 1,900 (21 %)
Total 9,200 (100%) Source: Euro Chlor (1999a).
Although the applications of chlorine are classified in different ways between Japan and
Western Europe, they show similar compositions. Polyvinyl chloride (PVC), which is
produced by polymerizing vinyl chloride, is the largest single application of chlorine in Japan
and Western Europe, accounting for 37.5 % and 35 % of production, respectively. Ethylene is
chlorinated to produce ethylene dichloride (EDC), and then hydrogen chloride is removed to
produce vinyl chloride monomer (VCM). With an annual production of more than 20 million,
PVC is the second largest of all plastics after polyethylene. Since the start of its industrial
production in the 1930s, PVC has been used extensively in the building industry and for the
production of consumer goods and packages.
Inorganic compounds produced from chlorine include hydrochloric acid (hydrogen
chloride, HCl), metal chlorides and non-metal chlorides. Hydrochloric acid is used for food
processing. Metal chlorides have many applications, including the use of aluminium and iron
chlorides as catalysts in synthesis and as flocculants in water treatment. Zinc chloride is used
in galvanization. Non-metal chlorides such as the phosphorus and sulfur chlorides are widely
used as intermediates for agrochemicals, notably for pesticides and herbicides. They are also
used in the production of plasticizers, stabilizers and coloring materials for plastics.
Hypochlorites, including sodium hypochlorite, have been used for a long time as bleaching
agents for the paper and pulp industry and as disinfectants for water treatment. Chlorine
dioxide has replaced elemental chlorine in new processes for bleaching paper-making pulps.
Chlorine is also widely used for producing chlorinated C1 and C2 molecules42, including
chloromethanes and chlorinated solvents. Chloromethane, together with silicon, is used for
synthesizing silicones. Silicones are polymeric compounds, and a variety of silicone materials
42 C1 and C2 molecules denote those which contain one and two carbon atom(s), respectively.
82
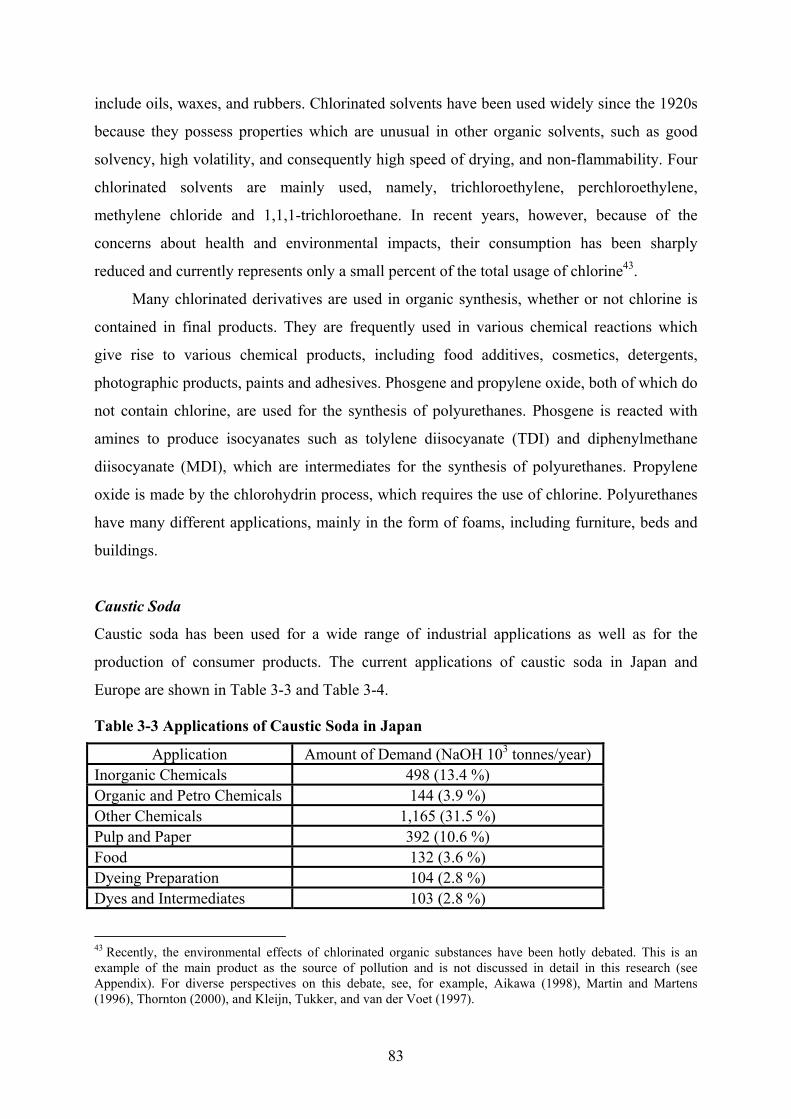
include oils, waxes, and rubbers. Chlorinated solvents have been used widely since the 1920s
because they possess properties which are unusual in other organic solvents, such as good
solvency, high volatility, and consequently high speed of drying, and non-flammability. Four
chlorinated solvents are mainly used, namely, trichloroethylene, perchloroethylene,
methylene chloride and 1,1,1-trichloroethane. In recent years, however, because of the
concerns about health and environmental impacts, their consumption has been sharply
reduced and currently represents only a small percent of the total usage of chlorine43.
Many chlorinated derivatives are used in organic synthesis, whether or not chlorine is
contained in final products. They are frequently used in various chemical reactions which
give rise to various chemical products, including food additives, cosmetics, detergents,
photographic products, paints and adhesives. Phosgene and propylene oxide, both of which do
not contain chlorine, are used for the synthesis of polyurethanes. Phosgene is reacted with
amines to produce isocyanates such as tolylene diisocyanate (TDI) and diphenylmethane
diisocyanate (MDI), which are intermediates for the synthesis of polyurethanes. Propylene
oxide is made by the chlorohydrin process, which requires the use of chlorine. Polyurethanes
have many different applications, mainly in the form of foams, including furniture, beds and
buildings.
Caustic Soda
Caustic soda has been used for a wide range of industrial applications as well as for the
production of consumer products. The current applications of caustic soda in Japan and
Europe are shown in Table 3-3 and Table 3-4.
Table 3-3 Applications of Caustic Soda in Japan
Application Amount of Demand (NaOH 103 tonnes/year) Inorganic Chemicals 498 (13.4 %) Organic and Petro Chemicals 144 (3.9 %) Other Chemicals 1,165 (31.5 %) Pulp and Paper 392 (10.6 %) Food 132 (3.6 %) Dyeing Preparation 104 (2.8 %) Dyes and Intermediates 103 (2.8 %)
43 Recently, the environmental effects of chlorinated organic substances have been hotly debated. This is an example of the main product as the source of pollution and is not discussed in detail in this research (see Appendix). For diverse perspectives on this debate, see, for example, Aikawa (1998), Martin and Martens (1996), Thornton (2000), and Kleijn, Tukker, and van der Voet (1997).
83

Chemical Fiber 91 (2.5 %) Alumina 76 (2.1 %) Electrolysis 72 (1.9 %) Soaps and Detergents 48 (1.3 %) Oil Refining 34 (0.9 %) Cellophane 16 (0.4 %) Others 827 (22.3 %)
Total 3,702 (100%) Source: Japan Soda Industry Association (1999a).
Table 3-4 Applications of Caustic Soda in Western Europe
Application Amount of Demand (NaOH 103 tonnes/year) Chemicals 4,900 (53 %) Paper 1,000 (11 %) Consumer Products 700 (7 %) Aluminium Processing 400 (4 %) Others 2,300 (25 %)
Total 9,300 (100%) Source: Euro Chlor (1999a).
As in the case of chlorine, the applications of caustic soda in both regions show similar
outlets. About half of caustic soda produced is consumed for manufacturing various industrial
chemicals. Large amounts of caustic soda are used in the organic and inorganic chemicals
industries. Since caustic soda is a highly alkaline material, it is widely used for neutralizing
acids and dissolving materials which are difficult to dissolve. A variety of reactions can occur
with organic as well as inorganic materials.
Approximately one tenth goes to the pulp and paper industry, in which caustic soda has
been widely used for a long time. The Kraft process, which was originally developed in 1879,
is currently the preeminent chemical pulping procedure. In this process, wood chips are
cooked in pulping liquor consisting of a solution of sodium hydroxide, that is, caustic soda,
and sodium sulfide in water, the so-called white water, and much of the lignin originally
present in the wood is dissolved. Caustic soda is also used in the bleaching steps for pulp
brightening.
In the textile industry, rayon is made from wood pulp by using caustic soda. In the
viscose process, the pulp is dissolved in carbon disulfide and caustic soda to give a thick
brown liquid, which is then forced through fine nozzles into acid, producing a cellulose
filament. Caustic soda has also been important for aluminium processing since around 1900.
84

Alumina is recovered from bauxite by extraction with caustic soda, which is now frequently
referred to as the Bayer process. Caustic soda also plays an important role in manufacturing
consumer products. Soaps, for example, are made by boiling animal fats with caustic soda44.
3.1.2 Production
The world chlor-alkali production capacity was 43.5 million tonnes of chlorine in 1996. Table
3-5 provides a breakdown of the production capacity by geographical region. The world
largest producing country is the United States. With its annual production capacity of more
than 13 million tonnes of chlorine, it accounts for about 30 % of the world production
capacity. Following the United States, Western Europe is globally the second largest chlor-
alkali producing region, representing 23 % of the world capacity. Japan’s production capacity
accounts for approximately one tenth of the world production.
Table 3-5 Chlor-Alkali Production Capacities in the World
Region Production Capacity (Cl2 103 tonnes/year) North America 13,500 (31 %) Western Europe 10,000 (23 %) Eastern Europe 6,100 (14 %) Asia (excluding Japan) 6,100 (14 %) Japan 4,300 (10 %) Central & South America 1,300 (3 %) Middle East 1,300 (3 %) Other 900 (2 %)
Total 43,500 (100%) Source: SRI (1996).
Within Western Europe, Germany is by far the largest producing country, as is shown in
Table 3-6. Germany represents 38 % of the total installed capacity in the region, followed by
France, United Kingdom, Italy, Belgium and Spain. The largest two countries account for
more than half of the total production capacity in Western Europe.
Table 3-6 Chlor-Alkali Production Capacities in Western Europe
Country Production Capacity (Cl2 103 tonnes/year) Germany 4,379 (38.3 %) 44 There is the third product of the electrolysis of brine, namely, hydrogen (H2). It is very pure and has a wide variety of uses. It is used is as a chemical feedstock for organic hydrogenation, catalytic reductions, and ammonia synthesis and to provide hot flames or protective atmospheres in welding technology, metallurgy, or glass manufacture. It is also used in the manufacture of high-purity hydrogen chloride by combustion with chloride and as a fuel for heating and drying.
85

France 1,686 (14.8 %) UK 1,216 (10.6 %) Italy 982 (8.6 %) Belgium 832 (7.3 %) Spain 802 (7.0 %) Netherlands 647 (5.7 %) Sweden 292 (2.6 %) Norway 180 (1.6 %) Finland 115 (1.0 %) Switzerland 104 (0.9 %) Portugal 89 (0.8 %) Austria 60 (0.5 %) Greece 37 (0.3 %) Ireland 6 (0.1 %)
Total 11,427 (100%) Sources: Euro Chlor (1998a), European IPPC Bureau (1999).
The number and scale of chlor-alkali plants in Western Europe and Japan are given in
Table 3-7. In 1998 the production capacity of Western Europe was 11.4 million tonnes of
chlorine. Across the 15 countries, there were 44 chlor-alkali producers operating 80 plants,
with an average production capacity of 142,800 tonnes of chlorine per year. In the same year,
the annual production capacity of the Japanese chlor-alkali industry was 4.4 million tonnes of
caustic soda, equivalent to 4 million tonnes of chlorine. In total, 29 companies were operating
40 chlor-alkali plants, and the average production capacity was 111,000 tonnes of caustic
soda per year, equal to 99,000 tonne of chlorine per year. Thus the average plant capacity in
Western Europe is approximately 1.5 times larger than that in Japan.
Table 3-7 Chlor-Alkali Plants in Western Europe and Japan
Capacity (Cl2 103 t/year)
Producers Plants Average Plant Capacity (Cl2 103 t/year)
Western Europe 11,400 44 80 142,800 Japan 4,000 29 40 99,000 Sources: Euro Chlor (1998a), European IPPC Bureau (1999), and Japan Soda Industry Association (1998b).
The production of chlorine and caustic soda is significantly integrated with the
downstream businesses, such as the PVC production, and in many cases forms part of an
integrated petrochemicals and plastic complex. For example, among 15 petrochemical
industrial complexes operating in Japan in 1997, chlor-alkali plants supplied chlorine and
86
caustic soda in 10 of them (Japan Soda Industry Association, 1998b). Being classified as a
toxic and corrosive gas, chlorine is difficult to store and handle, and thus the transportation of
chlorine is normally kept to a minimum. More than 85 % of the chlorine produced in Western
Europe is used on the same or adjacent sites for other chemical processes and converted to
chlorinated organic products and intermediates (Lindley, 1997). While very little chlorine
trade occurs in its elemental form, chlorine derivatives, including EDC, VCM, and PVC, are
traded widely in the international market. Caustic soda is usually shipped as solution of about
50 % concentration and is bought and sold freely in the world market.
As chlorine and caustic soda, which are co-produced by a fixed ratio through the
electrolysis of brine, are consumed separately for different purposes, demands for the two
products are not normally balanced. Generally speaking, caustic demand in a developing
country exceeds chlorine demand because caustic-consuming basic industries such as mineral
processing, paper, glass, and textile manufacture normally precede the development of the
chlorine-consuming petrochemical and plastics industries. Hence, industrialized countries,
including Western Europe and Japan, tend to have excess amounts of caustic soda, which can
be exported to industrializing countries such as those in Asia.
3.2 Three Dominant Technologies for Chlor-Alkali Production: Mercury
Process, Diaphragm Process, and Ion Exchange Membrane Process
Traditionally, two types of production technologies were used in the chlor-alkali industry:
• Chemical processes
• Electrolytic processes.
Figure 3-1 gives a schematic illustration of the evolution of various technologies used for
chlor-alkali production since the birth of the chlor-alkali industry.
87

1800
1810
1820
1830
1840
1850
1860
1870
1880
1890
1900
1910
1920
1930
1940
1950
1960
1970
1980
1990
2000
Chemical Processes Electrolytic Processes
Leblanc Process
Ammonia Soda Process
Mercury Process
Diaphragm Process
Ion Exchange Membrane
Process
Chemical Separation
Physical Separation
Ion Exchange
Hydraulic Pressure
End-of-Pipe Technology
Clean Technology
Mercury Emissions
Emissions • Hydrogen
Chloride • Tank
Waste • Nitrogen
Oxides
End-of-Pipe Technology
Figure 3-1 Evolution of Production Technologies in the Chlor-Alkali Industry
88

From the beginning of the industrial production of alkali products at the end of the 18th
century through the 19th century, the production processes were based on chemical reactions.
There are two types of chemical processes45:
• Leblanc process
• Ammonia soda process (Solvay process).
At around the turn of the 19th century, a radically new way of producing alkali was
invented based on the principle of electrolysis. In electrolytic processes, an aqueous solution
of sodium chloride (NaCl), that is, salt, commonly called brine, is decomposed by electrolysis
with direct current, producing chlorine, hydrogen, and sodium hydroxide. For each tonne of
chlorine produced, 1.12 tonnes of caustic soda and 0.028 tonnes of hydrogen are produced at
the same time46. The electrolytic production of chlorine and caustic soda depends on a large
current of amount of electricity. Thus the chlor-alkali industry is a major user of electric
power, and actually its unit consumption of electricity is the one of the largest, following the
aluminium, carbide, and ferroalloy industries. The Japanese chlor-alkali industry, for instance,
consumed approximately 10.7 billion kWh of electricity in 1996, accounting for 3 % of the
total industry consumption and 18 % of the total chemical industry consumption (Japan Soda
Industry Association, 1998a). As energy cost accounts for a significant part of the total
manufacturing cost, one of the major targets of innovative activities in the chlor-alkali
industry has been to develop technologies to reduce energy consumption.
Three types of electrolytic processes are currently in use for commercial manufacturing
of chlorine and caustic soda in the world:
• Mercury process
• Diaphragm process
• Ion Exchange Membrane process
Each process represents a different method of keeping chlorine produced at the anode
separate from the caustic soda and hydrogen produced, directly or indirectly, at the cathode 47.
Figure 3-2 shows the shares of the three processes in the chlor-alkali industry in
Western Europe, the United States and Japan. (Data are given in Table 3-24 in Appendix at
45 Although the Leblanc process and the ammonia soda process are not the focus of our research, the diverging impacts of environmental regulations on technological change are similar to those observed in the case of the electrolytic processes. More detailed discussions are given in Appendix. 46 As both chlorine and caustic soda are used as the unit of measurement in the industry, both of them appear in this research. The conversion factor is 35.5:40; that is, 1 t Cl2 = 1.12 t NaOH.
89

the end of this chapter). As you can see clearly, different production processes are dominant
in the three regions. In Western Europe, approximately 60 % of the chlor-alkali plants are
based on the mercury process. In the United States, more than 70 % of the chlor-alkali plants
are using the diaphragm process. In Japan, while there is no chlor-alkali plants based on the
mercury process, the ion exchange membrane process has been adopted by more than 90 % of
the chlor-alkali plants. In the other two regions, the diffusion of the ion exchange membrane
process is limited to approximately 10 %.
0%
10%
20%
30%
40%
50%
60%
70%
80%
90%
100%
Western Europe United States Japan
Other
Ion ExchangeMembrane ProcessDiaphragm Process
Mercury Process
Figure 3-2 Shares of the Mercury, Diaphragm, and Ion Exchange Membrane Processes in Western Europe, the United States, and Japan in 1998
To investigate why the divergent courses of technological change have occurred
between Western Europe and Japan, we first trace the historical evolution of the electrolytic
processes up to the early 1970s, when environmental regulations began to be introduced on
mercury emissions from chlor-alkali plants. Then, in the next two chapters, we examine how
environmental regulations have influenced the course of technological change in Western
Europe and Japan since then.
47 Anode is a positive electrode, to which negative ions (anions) migrate, and cathode is a negative electrode, to which positive ions (cations) migrate.
90
3.3 Technological Change Prior to the Effects of Environmental Regulations
It had been well known for a long time that electrolysis of brine resulted in the formation of
chlorine at the anode, and of caustic soda and hydrogen at the cathode (Haber, 1971). The
decomposition of salt water by means of an electric current was demonstrated as early as
1800. During the period 1832-1834, the laws governing the electrolysis of aqueous salt
solutions were formulated by Faraday. While a patent was granted in Britain in 1852 for the
electrolytic production of chlorine from brine, laboratory success was slowly converted into
commercial viability. Since electrolysis is a power-intensive process, the supply of cheap
electricity was indispensable for the industrial feasibility of electrolysis. As the accumulator
was not useful for industrial purposes, progress was delayed until the development of an
efficient dynamo in the late 1860s. The first experiments on an industrial scale were not until
the 1880s because of technical as well as commercial difficulties to overcome. One of the
most demanding technical difficulties facing the infant electrolytic technology was how to
devise a means of continuous separation of chlorine and sodium hydroxide. Eventually, two
different processes were developed in the late 1880s and the early 1890s to accomplish this
separation by using mercury and diaphragm, that is, the mercury process and the diaphragm
process.
3.3.1 Development of the Mercury Process
A simplified flow diagram of the mercury process is given in Figure 3-3. Several steps are
common to all of the chlor-alkali production processes, whether mercury, diaphragm, or ion
exchange membrane (Curlin, Bommaraju, and Hansson, 1991; Hocking, 1998; Kelham, 1996;
Schmittinger, Curlin, Asawa, Kotowski, Beer, Greenberg, Zelfel, and Breitstadt, 1986).
91
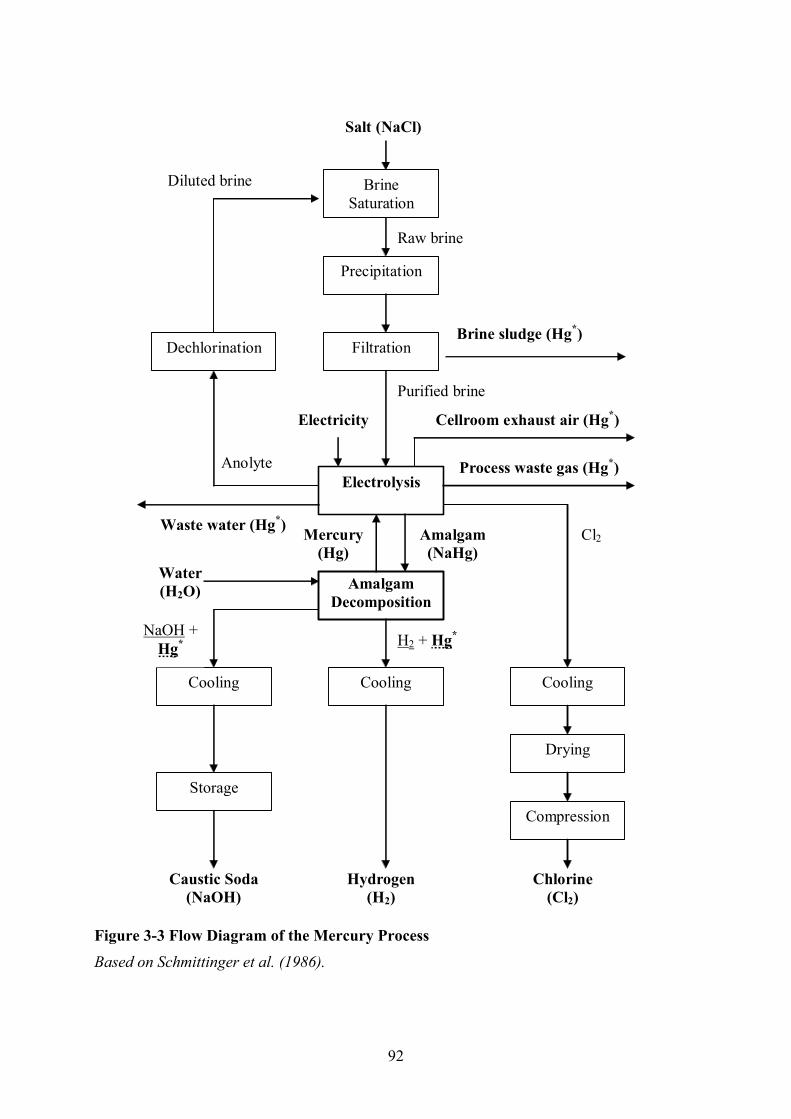
Electrolysis
Amalgam Decomposition
Cooling
Dechlorination
Salt (NaCl)
Brine Saturation
Precipitation
Filtration
Compression
Cooling
Storage
Chlorine (Cl2)
Hydrogen (H2)
Caustic Soda (NaOH)
Water (H2O)
Amalgam (NaHg)
Mercury (Hg)
Raw brine
Purified brine
H2 + Hg*NaOH + Hg*
Cl2
Diluted brine
Anolyte
Drying
Cooling
Electricity
Waste water (Hg*)
Brine sludge (Hg*)
Process waste gas (Hg*)
Cellroom exhaust air (Hg*)
Figure 3-3 Flow Diagram of the Mercury Process
Based on Schmittinger et al. (1986).
92
The basic raw material for the mercury process is normally solid salt. Saturated brine
first goes through the precipitation-filtration step because sodium chloride, whether solution-
mined or obtained as either mined or solar-evaporated solid salt, contains various impurities.
Since these traces of heavy metals in the brine give rise to dangerous operating conditions in
the electrolyzer, brine for the mercury process must meet stringent purity standards. For
undertaking electrolysis, electricity must be provided in the form of direct current, and
rectifiers are used to transform alternate current to direct current.
The mercury process involved two electrochemical units, namely, an electrolytic cell
and an amalgam decomposer (Schmittinger, 2000). Amalgam decomposition is a unique step
for the mercury process, which thus requires mercury removal from the products. Figure 3-4
gives a schematic illustration of the two electrochemical units. In the electrolytic cell, the
purified brine flows through an elongated, slightly inclined trough. Mercury, which functions
as the cathode, flows concurrently with the brine over the base plate. Anodes are suspended in
the brine from above. The evolution of chlorine takes place at the anode in all of the three
processes. At the anode, chlorine ions (Cl-) lose electrons (e-) to form chlorine atoms (Cl•):
Cl- -> Cl• + e-.
Then chlorine atoms combine to escape as chlorine molecules (Cl2):
2Cl• -> Cl2.
As the chlorine produced by any of the electrolyzer processes is saturated with water vapor at
high temperature, it is first cooled, with water removed, and then dried.
Unlike the diaphragm or ion exchange membrane process, in which hydrogen and
sodium hydroxide are produced at the cathode, the cathodic reaction in mercury cells is the
discharge of sodium ions (Na+) to form dilute sodium amalgam with a thin film of mercury.
As mercury itself acts as a separator for the anode and cathode products, the mercury process
contains no mechanical barriers. First, sodium ions gain electrons to form sodium atoms (Na):
Na+ + e- -> Na.
Then, the sodium atom immediately dissolves in the mercury (Hg*) film electrode to form
sodium amalgam (NaHg):
Na + Hg* -> NaHg.
The liquid amalgam then passes into the decomposer, where it reacts with water (H2O) to
form sodium hydroxide (NaOH) solution and hydrogen (H2):
2NaHg + 2H2O -> 2NaOH + H2 + 2Hg*.
93

Anode (+)
Cathode (-)
Chlorine (Cl2)
Na+
Cl-Saturated
brine (NaCl)Depleted
brine
Electrolytic cell
Amalgam Decomposer
Graphite packing
Hydrogen (H2)
NaHg
Na+
H2O
OH-
Amalgam (NaHg) sent to
decomposer
Hg
Mercury (Hg)
recycled to electrolyzer
Caustic soda (NaOH) 50 %
Water (H2O)
Amalgam (NaHg)
HgMercury
(Hg)
Mercury (Hg)
Mercury (Hg)
Figure 3-4 Mercury Electrolyzer and Amalgam Decomposer
Based on Schmittinger et al. (1986).
The process has been made continuous by periodically replenishing the brine and
removing the caustic soda. The depleted brine leaving the electrolyzers is dechlorinated to
recover the dissolved chlorine and to prevent corrosion during further processing.
Dechlorinated brine is then resaturated with solid salt and returned to the cell for further use.
94

The hydrogen produced in the mercury process is relatively pure and thus requires only
cooling to remove water along with entrained salt and caustic.
While physical barriers, such as diaphragms and ion exchange membranes, are used in
the case of the diaphragm process and the ion exchange membrane process, mercury is a
crucial substance to separate caustic soda from chlorine in the mercury process. As can be
seen in Figure 3-3 and Figure 3-4, the facilities are designed to recover most of the mercury
used in the production process within the plant, by allowing mercury to flow from the
decomposer back into the electrolysis cell once the sodium hydroxide has been removed. It is
inevitable, however, that some amount of mercury is released to the environment through
products, air, water, and solid wastes. That necessitates the adoption of technological
measures to prevent the emissions of mercury from the mercury-based plants. Basically, there
are two ways to meet this purpose. One is to install equipment at the end of the production
process, that is, the end-of-pipe technology. The other is to replace the mercury process with
another production process which does not use mercury, that is, the clean technology. As we
will see later, this difference in the adoption of technological measures for pollution
abatement will have significant consequences.
To solve the difficulty of separating chlorine and caustic soda, an electrolytic cell in
which the cathode consisted of a layer of mercury was invented by an American chemist,
Hamilton Young Castner (Warren, 1980). By 1892 he had patented the electrolytic cell, and
subsequently an electrolytic alkali plant was constructed in Britain48. Almost in the same
period, a similar mercury-cathode system was developed by an Austrian engineer, Carl
Kellner. He set up a company to work his process in Austria and sold the other European
rights to Solvay in Belgium. Ultimately the two inventors licensed their patents and
conducted industrial operations jointly. A new company, the Castner-Kellner Alkali Company,
was established in 1895 at Runcorn in Britain, and their process was successfully put into
operation two years later. Of 35 electrolytic alkali works in production or near ready to begin
outside Britain by the beginning of 1900, seven were using the Castner-Kellner process.
The Castner-Kellner process was subsequently established in Germany, Belgium, and
Russia by Solvay (Haber, 1971). The design of the Castner-Kellner cell, which was rocked
periodically from side to side so that mercury flowed from one compartment to the other,
received modifications by the engineers of Solvay. Experiments started in 1898, resulting in
95

the development of a sloping cell, the so-called long cell, in which the mercury flowed
continuously by gravity along the bottom of an elongated trough. The long cell became the
basis of all subsequent mercury cell designs. Solvay later started to offer two models of the
mercury process to the market.
The long cell was also introduced to Britain in 1902 by Castner-Kellner, replacing the
rocking cell (Collins and Entwisle, 1980). A majority share of the Castner-Kellner, together
with the Runcorn plant, was acquired by Brunner-Mond in 1920. Subsequently, they became
part of the newly formed Imperial Chemical Industries (ICI) in 1926. Technological
development continued at ICI, with emphasis on steel baseplates to alleviate the current
loading limitation associated with cathode mushrooms, and the steel baseplate cell became
widely adopted throughout the ICI group. The area of the brine cell was increased from 12.5
m2 in the 1940s to 25 m2 in the 1960s.
In the United States, Mathieson Alkali acquired the license on the mercury cell from
Castner-Kellner in 1894, and the first U.S. plant of this type was subsequently opened at
Saltville, Virginia (Haber, 1971). Initially, the cells were fitted with carbon anodes, which had
only a very limited lifetime. Castner invented a method of graphitizing his carbon, which,
together with some other improvements, made it possible to build a much larger commercial
plant in 1897 at Niagara Falls, New York. Cheap and abundant supply of electricity as well as
good local supply of salt was essential for successful working of the electrolytic process. Thus,
it was after large amounts of direct current electricity could be supplied economically with the
invention of dynamos in such a place as Niagara Falls, that the electrolytic process became
commercially feasible. Since then, Mathieson had been the only major licensor of the mercury
process in the United States.
In the 1930s and the 1940s, rapid progress was made on the mercury process
technology in the German I. G. Farbenindustrie plants through exchange of information and
sharing of the results of research and development. By the end of the Second World War,
Germany had reached a position of technical leadership in the mercury process for chlor-
alkali production (MacMullin, 1947)49. After the end of the war, IG Farben was broken up
48 A number of patents dealing with mercury cells actually issued prior to 1982, the first being that of Nolf, British patent 4349 (1882) (MacMullin, 1962). 49 Just after the end of the Second World War, many American technical investigators, including a dozen people selected from the chlor-alkali industry, were sent to Germany to study the technical developments and progress there. Many reports were written on German chlor-alkali progress and developments, and a tremendous amount of information was uncovered in the files of the German chemical plants. Much of this was brought back to the United States later. Through the Chlorine Institute, the chlor-alkali industry association in the U.S., about 1,900
96

into three companies, namely, Badische Anilin & Soda-Fabrik (BASF) in Ludwigshafen,
Bayer in Leverkusen, and Hoechst in Frankfurt (Aftalion, 1991). Subsequently many
prototypes were developed in the plants of Bayer and Hoechst. In 1952 Hoechst, through its
subsidiary Knapsack-Griesheim, acquired a share in Uhde, an engineering company, and the
cooperation between the two companies started in 1954 (Krupp Uhde, 2001). Hoechst-Uhde
cells later came to be regarded to represent the achievement of the horizontal German
mercury cell. BASF, on the other hand, had cooperated with the Krebs engineering group
since 1951 for the development and installation of mercury cells (MacMullin, 1962). Various
prototypes were installed at the Ludwigshafen works of BASF. Many installations of Krebs-
Zurich cells and Krebs-BASF cells were in operation principally in Europe.
Mercury cells of the horizontal type were also developed by De Nora based in Milan,
Italy. The De Nora cells had evolved through a series of changes since they were introduced
in 1950, although the basic principle remained unchanged; all the cells had a protected
electrolyzer trough and a vertical decomposer. They were widely adopted, as there were at
least 60 De Nora plants located in 25 countries in the 1960s (MacMullin, 1962). The company
also offered a commercial version of the vertical cathode mercury cell, which was known as
the fluent amalgam cell. The principal advantage of the fluent amalgam cell was the economy
of building space as compared to that of horizontal mercury cells.
In Japan, on the other hand, the production of electrolytic alkali began during the First
World War. The development of the mercury process started by Osaka Soda in 1911, and its
Daiso cell was industrialized in 1915. By 1918, about 10,000 tons of caustic soda had come to
be produced annually in this way (Japan Soda Industry Association, 1952). The Krebs
mercury cell was imported to Japan for the first time in 1935. By the Second World War, the
Daiso and Krebs cells, which shared similar structures, had come to become the major
technologies used in Japan. In 1937 the production of caustic soda reached 369,000 tonnes,
the maximum level before the war. After the end of the war, information on advanced
mercury process technologies developed by the German chlor-alkali industry became
available to those in the Japanese chlor-alkali industry through a research report. The so-
called PB report soon began to work as the textbook for chlor-alkali engineers in the post-war
pages of scientific reports on the German chlor-alkali industry, called the “Chlor Fako Reports,” were translated and distributed. All these reports constituted significantly to the subsequent development of the chlor-alkali technology (Murray, 1949).
97

Japan50 . In particular, the Kureha cell was subsequently developed in Japan by Kureha
Chemical. It later came to be regarded as one of the best mercury cells in the world and was
exported to other countries.
By the middle of the 1960s, a number of technologies for the mercury process had been
developed and become available in the market. They were mainly provided by Western
European and Japanese companies, except for one technology supplier based in the United
States. In particular, Solvay, De Nora, Hoechst-Uhde, Krebs, and ICI in Western Europe, and
Osaka Soda, Kureha Chemical, Asahi Glass, Toyo Soda, Tokuyama Soda, and Mitsui
Engineering and Shipbuilding, which later established Chlorine Engineers Corp. (CEC), in
Japan were the companies which made major innovations on the mercury process, as
suggested by technical papers and books written by industry experts at that time (Chlorine
Institute, 1972; Japan Soda Industry Association, 1975; Kuhn, 1971; MacMullin, 1962; Smith,
1968, 1975; Sommers, 1965; Sommers, 1967). Table 3-8 gives some of the characteristics of
each of the technologies supplied by these companies. This implies that both in Western
Europe and in Japan there were several companies which were equally innovative on the
mercury process for chlor-alkali production.
Table 3-8 Major Technologies of the Mercury Process in the Early 1970s
Technology Cell current (kA)
Current density (kA/m2)
Power consumption (DC, kWh/ton Cl2)
Solvay (WE) V-100F V-200F
96 160
5.33 5.33
3,125 3,125
De Nora (WE) 14 x 3F 18 x 4 24 x 5
60 100 200
5.05 4.878 5.85
3,240 3,240 3,312
Hoechst-Uhde (WE) 10 m2 20 m2 31.5 m2
60 120 189
6.0 6.0 6.0
3,240 3,240 3,240
Krebs-BASF (WE)
50 150
4.25 4.13
3,175 3,240
Krebs-Zurich (WE) ZT 80-10-8 ZT 120-15-8
80 120
8.0 8.0
3,310 3,310
50 According to an engineer who studied and worked on the PB report, even 90 per cent of the technologies subsequently developed in Japan could be said to have originated from this report (Sugino, 1991).
98

ICI (WE) Steel Base
90
7.2
3,380
Olin Mathieson (US) E-8 E-11
35 125
5.58 8.33
3,164 3,444
Osaka Soda (JP) Daiso
n/a
n/a
n/a
Kureha Chemical (JP) HD-3 HD-4
80 150
8.13 7.57
3,175 3,096
Toyo Soda (JP) TOSO III-A TOSO IV
140 180
5.49 6.62
3,024 3,130
Asahi Glass (JP) Rotation Type 60kA
60
7.27
3,240
Mitsui-Toa Gosei (JP) TOA 270-G
200
9.3
3,190
Tokuyama Soda (JP) Tokuso 59
120
4.01
n/a
WE: Western Europe; US: United States; JP: Japan Sources: Sommers (1965), Sommers (1967), Japan Soda Industry Association (1975), Collins and Entwisle (1980), Japan Soda Industry Association (1982).
3.3.2 Development of the Diaphragm Process
Another electrolytic route to produce chlor-alkali products is the diaphragm process. There
are several differences in the flow diagram between the mercury and diaphragm processes
(Curlin, Florkiewicz, Luke, Minz, and Schmittinger, 2000; Hocking, 1998; Kelham, 1996;
Schmittinger, Curlin, Asawa, Kotowski, Beer, Greenberg, Zelfel, and Breitstadt, 1986).
Figure 3-5 gives a basic flow diagram of the diaphragm process. As in the case of the mercury
process, electricity is transformed by rectifiers and provided in the form of direct current. On
the other hand, for the diaphragm process solution-mined brine could be used in place of solid
salt. Salt recovery is also undertaken in the diaphragm process.
99

Electrolysis
Liquefaction
Cooling
Salt (NaCl)
Brine saturation
Precipitation
Filtration
Brine resaturation
Oxygen Removal
Compression
Evaporation
Cooling
Storage
Chlorine (Cl2)
Hydrogen (H2)
Caustic Soda (NaOH)
Raw brine
Purified brine
NaOH + NaCl
Cl2
NaCl
Water (H2O)
Concentration Drying
Cooling H2 + O2NaCl
NaCl
Electricity
Steam
Figure 3-5 Flow Diagram of the Diaphragm Process
Based on Schmittinger et al. (1986).
100

In the diaphragm electrolyzer, the anode area is separated from the cathode area by a
porous diaphragm based on asbestos (Curlin, Bommaraju, and Hansson, 1991). As shown in
Figure 3-6, saturated brine is introduced into the anode compartment. The principal reactions
at the anode are the same as those in the mercury process. First, chloride ions lose electrons to
form chlorine atoms:
Cl- - e- -> Cl•.
Subsequently, chlorine atoms combine to escape as chlorine molecules:
2Cl• -> Cl2.
The liquid solution in the anode compartment (anolyte) flows through the diaphragm into the
cathode compartment due to the hydraulic pressure originating from the difference in liquid
level between the two compartments.
At the cathode, water is decomposed to form hydrogen and hydroxyl ions (OH-):
2H2O + 2e- -> H2 + 2OH-.
Then hydroxyl ions combine with sodium ions to form sodium hydroxide, that is, caustic soda
in the catholyte:
OH- + Na+ -> NaOH.
Unlike the mercury process, which can produce highly concentrated caustic soda, the
concentration of caustic soda produced in the diaphragm process is lower than that required
for commercial purposes. Thus the unit for caustic concentration is necessary in the
diaphragm process. This step, however, requires additional energy, and this is basically
responsible for the fact that the total energy consumption for chlor-alkali production by the
diaphragm process is larger than that by the mercury process.
101

Anode (+) Cathode (-)
Chlorine (Cl2)
Saturated brine
(NaCl + H2O)
Electrolytic cell
Hydrogen (H2)
Dilute caustic soda (NaOH) and sodium
chlorine (NaCl)
Diaphragm
Sodium ions (Na+)
Chloride ions (Cl-)
Hydroxide ions (OH-)
NaClH2O
Figure 3-6 Diaphragm Electrolyzer
Based on Curlin, Bommaraju, and Hansson (1991).
As you can see, the diaphragm process does not rely on the use of mercury in producing
chlorine and caustic soda, which are separated by the porous diaphragm. Thus there is no
emission of mercury from the production process. On the other hand, asbestos used in the
diaphragm has long been known as a hazardous substance, and regulations have been
introduced, including exposure levels at workplace, in many countries51. The chlor-alkali
industry, however, has been mostly exempted from these regulations, mainly because of the
claim that asbestos is an indispensable material for the diaphragm used in chlor-alkali
production. According to the industry, asbestos exhibits a highly favorable combination of
essential characteristics, including sufficient mechanical strength, high chemical resistance to
both acids and bases, low electrical resistance, uniform and consistent deposits on the cathode,
appropriate physical structure to permit flow of depleted brine with minimum back migration
51 In the Untied States, for instance, the Occupational Safety and Health Administration of the Department of Labor and the Environmental Protection Agency have introduced various types of regulation on asbestos (see, for example, Occupational Safety and Health Administration, 1993; United States Environmental Protection Agency, 2000).
102

of hydroxyl ion, and an acceptable service life, and controlled use of asbestos should be
allowed (Chlorine Institute, 1995; Trettin, 1997)52.
As an alternative technique to separate chlorine and caustic soda, porous cement
diaphragms were originally invented by Breuer in 1886 (Haber, 1958). The first electrolytic
plant based on the diaphragm process started to operate in 1890 by the Griesheim Company
near Frankfurt, Germany. In this plant, potassium chloride (KCl), instead of sodium chloride,
was treated because caustic potash (potassium hydroxide, KOH) was more valuable at that
time. While the cell was operated batch-wise and the current efficiency was poor, at around
70 to 80 per cent, the cell was simple, inexpensive and relatively large in capacity (Kircher,
1962). The Griesheim cell was the first commercially successful diaphragm cell, and the
simplicity of the design of the process led other firms to apply for a license. By 1900, four out
of eight German electrolytic plants and two out of four French plants had come to use the
Griesheim diaphragm cell (Haber, 1971).
The Griesheim cell was followed by about twenty other designs. In Britain, another type
of diaphragm cell was developed in the 1890s by Hargreaves and Bird. They formed a
company at Cheshire in 1899, and their plant with the Hargreaves-Bird cell was opened two
years later (Kircher, 1962). This cell was based on a non-percolating diaphragm and reduced
the back migration of hydroxide ions by adding carbon dioxide and steam to the cathode
compartment, converting the caustic to sodium carbonate. This was the first
commercialization of the vertical diaphragm cell.
In the United States, a type of the diaphragm process was developed by Le Sueur, who
had also designed a mercury cell, and a small plant based on it was built in 1893 (Haber,
1958). It was the first commercial production of electrolytic caustic soda in the world. The Le
Sueur cell made use of a percolating diaphragm for the first time and had become the basis of
all modern diaphragm chlor-alkali cells. Brine was permitted to flow into the anolyte and
through the diaphragm by the device of maintaining the electrolyte level higher on the anode
than on the cathode side. The slow percolation of electrolyte through the diaphragm countered
the migration of hydroxyl ions toward the anode compartment. Consequently, continuous
operation became possible, and much higher current efficiency was obtained than with a non-
percolating diaphragm such as in the Griesheim cell. The Le Sueur cell was licensed to
52 As attempts have been made recently to avoid the use of asbestos in, for example, fireproofing materials, one of the principal applications of asbestos (Block, Dolhert, Petrakis, and Webster, 2000), several companies have started to develop diaphragms which do not consist of asbestos (Florkiewicz, 1998; Stadig, 1993).
103

several companies in the U.S., notably paper-making firms, which were dependent on a cheap
supply of chlorine.
These early diaphragm cells have been mostly replaced by designs invented in the
1900s (Haber, 1971). In the United States, Townsend and Sperry made electrolytic cell
inventions and sold their design to the development company founded by a civil engineer,
Hooker. The Townsend cell, later known as Hooker cell, was first used in 1906 at the plant of
Hooker Electrochemical Company at Niagara Falls. In Germany, the Billiter cell was
developed in 1907 and was widely used in the world during the 1920s. Another widely
employed diaphragm cell, the Gibbs cell, was developed in the United States in 1908.
The next major development took place in 1913, when a cell with finger cathodes and
side-entering anodes was designed by Marsh (Kircher, 1962). This increased the electrode
area per unit of cell volume or cell floor space, reducing capital investment per unit of
production. Diaphragms were made of asbestos paper wrapped around the cathodes and
sealed with cement and putty. The putty joints, however, provided a poor seal, and the Marsh
cell was plagued with leaks and its current efficiency never equaled that of cells with more
simple construction. In an attempt to overcome the disadvantage of the Marsh cell, Stuart, a
technologist of Hooker Electrochemical Company, invented in 1928 a method of depositing
asbestos fiber onto the cathode by immersing it in slurry and applying a vacuum. With the
flexibility of cell design permitted by the deposited asbestos diaphragm, the Hooker Type S
cell was developed and has been further improved through various stages.
Filter press cells, which had been used extensively for hydrogen-oxygen electrodialysis,
started to be designed also for chlor-alkali production by several early workers. Although the
filter press design was attractive in terms of requiring a minimum of conductor material
between cells, a minimum of floor space and low investment cost, the only commercial use of
the filter press for chlor-alkali had been limited to the Dow Chemical Company in the U.S.
(Murray, 1949). Dow had developed filter press cells through several stages characterized by
simple, rugged, inexpensive construction. Detailed data on the performance of this technology,
however, had not been disclosed to outside companies for a long time.
In the late 1960s PPG Industries in the U.S. made development efforts and succeeded in
commercializing its Glanor electrolyzer in the early 1970s (PPG Industries, 1981). It
consisted of ten bipolar elements securely clamped together with tie rods between two end
electrode elements, forming a sealed electrolyzer module of eleven cells. They were called
bipolar because one side of each element acted as a cathode and the other as an anode, and
104

they were clamped together with the anode side of one element toward the cathode side of the
next element so that the space between formed a cell. The advantage of the bipolar design was
that it permitted current to flow internally within an electrolyzer from one cell to another.
Accordingly, the current path could be shorter and of lower resistance than in conventional
cells, in which the current flowed through external bus bars.
In Japan, the diaphragm process was industrialized for the first time by Hodogaya in
1915 (Yamaguchi, 1999b). Subsequently, the Nakano cell and the Yoshimura cell, named
after the inventors, respectively, were developed and began to be installed in 1920. Nippon
Soda also developed a bipolar diaphragm cell, and Tsurumi Soda developed and installed a
monopolar diaphragm cell in its own plants. At the same time, various types of the diaphragm
cell, including the Townsend cell, Allen-Moore cell, Nelson cell, Billiter-Siemens cell, and
Billiter-Leykam cell, were all introduced from foreign countries. After the Second World War,
however, as the mercury process increased its share steadily, many types of the diaphragm
electrolytic cell, such as the Nakano cell and Allen-Moore cell, disappeared from chlor-alkali
plants in Japan. Overall, compared with the remarkable technological advance made on the
mercury process, the extent of technological progress of the diaphragm process in Japan was
rather limited, and the main focus was placed on incremental improvements on the existing
technologies, which were mainly introduced from technology suppliers based in foreign
countries, particularly the United States.
Although more than thirty types of diaphragm cells had been developed in the past, all
new diaphragm cells available in the early 1970s were basically of two types: the Stuart
(Hooker) type and the filter press type (Chlorine Institute, 1972; Jackson, Cooke, and
Woodhall, 1971; Kircher, 1962; Kuhn, 1971; Smith, 1968; Sommers, 1957a, 1957b, 1965).
The Stuart type cells included the Hooker Type S cells and Diamond cells whereas the filter
press type cells included the Dow cells and Glanor cells. Table 3-9 gives some characteristics
of the technologies for the diaphragm process which were available at the time of the early
1970s. As you can see, technological development of the diaphragm process was basically led
by the US companies, namely, Hooker, Diamond Shamrock, Dow, and PPG, which were
followed by some Japanese companies.
Table 3-9 Major Technologies of the Diaphragm Process in the Early 1970s
Technology Cell Current (kA)
Current Density (kA/m2)
Power Consumption (DC, kWh/short ton Cl2)
Hooker (US)
105

S-3D S-4 H-4
40 55 150
1.435 1.287
-
2,810 2,830 2,671*
Diamond Shamrock (US) D-3 DS-85
30
100-150
1.294
1.82-2.74
2,750
2,459-2,882* Dow (US)
Dow
n/a
n/a
n/a PPG (US)
Glanor V 1144
792
1.975
2,487-2,513* Nippon Soda (JP)
B-5 BM-50
25
250-300
0.975
1.80-1.90
2,540*
2,540-2,681 Tsurumi Soda (JP)
TSB-4 TSBM-7
24 50
0.81 2.0
2,328*
2.513* Showa Denko (JP)
SD-7
75
1.73
2,521* * The unit is kWh/t NaOH. Sources: Sommers (1965), Japan Soda Industry Association (1975).
3.3.3 Diffusion of the Mercury Process in Western Europe and Japan
As we have seen in the previous section, the industrial production of chlor-alkali products
started with the mercury and the diaphragm processes almost simultaneously at the end of the
19th century. Technological development of the two production processes was initially
pursued both in the Western Europe and in the United States. Subsequently, however,
technological progress in the mercury process was mainly made by companies in Western
Europe, whereas the diaphragm process was mainly improved by companies in the United
States. Although the two production processes had remained basic to the chlor-alkali industry,
different types of production technologies had come to be adopted in Western Europe, the
United States, and Japan.
In Western Europe, the mercury process has been dominant since the beginning of the
electrolytic production of chlor-alkali products. Table 3-10 gives the distribution of the chlor-
alkali production processes in Western Europe in the late 1950s. As you can see, more than
80 per cent of the chlor-alkali production capacities were based on the mercury process while
the diaphragm process accounted for only 15 of the total capacities. For the mercury process,
106
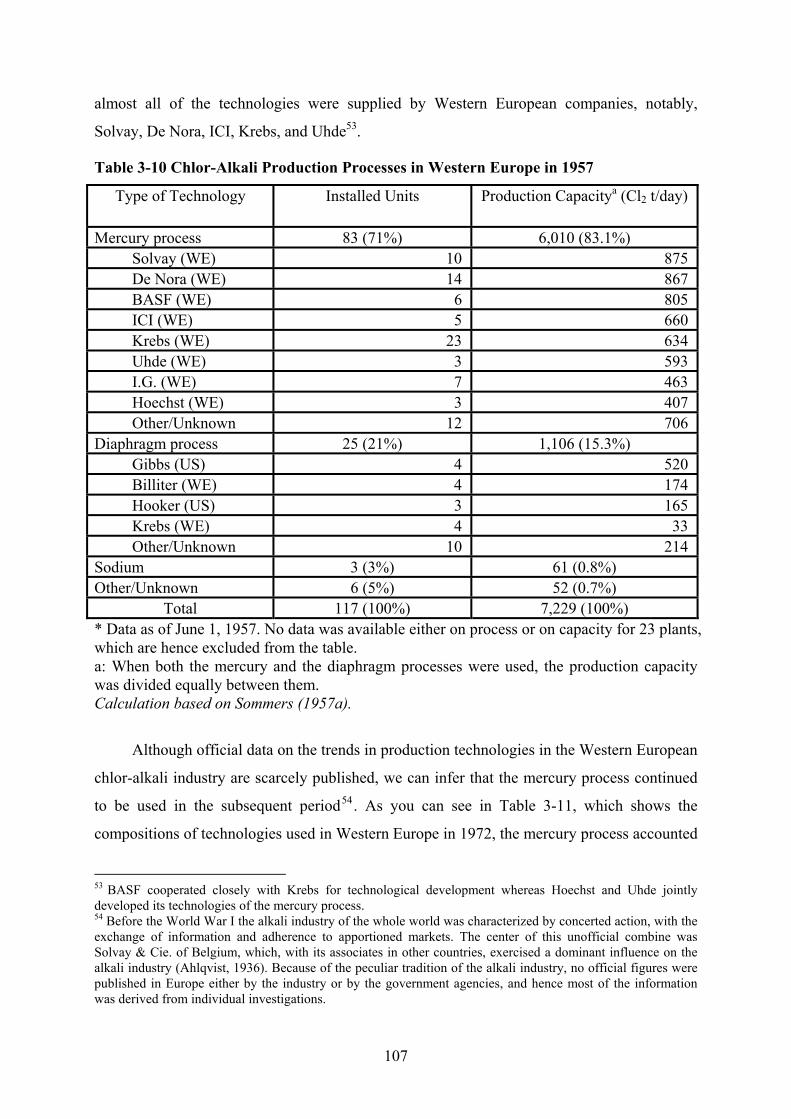
almost all of the technologies were supplied by Western European companies, notably,
Solvay, De Nora, ICI, Krebs, and Uhde53.
Table 3-10 Chlor-Alkali Production Processes in Western Europe in 1957
Type of Technology Installed Units Production Capacitya (Cl2 t/day)
Mercury process 83 (71%) 6,010 (83.1%) Solvay (WE) 10 875De Nora (WE) 14 867BASF (WE) 6 805ICI (WE) 5 660Krebs (WE) 23 634Uhde (WE) 3 593I.G. (WE) 7 463Hoechst (WE) 3 407Other/Unknown 12 706
Diaphragm process 25 (21%) 1,106 (15.3%) Gibbs (US) 4 520Billiter (WE) 4 174Hooker (US) 3 165Krebs (WE) 4 33Other/Unknown 10 214
Sodium 3 (3%) 61 (0.8%) Other/Unknown 6 (5%) 52 (0.7%)
Total 117 (100%) 7,229 (100%) * Data as of June 1, 1957. No data was available either on process or on capacity for 23 plants, which are hence excluded from the table. a: When both the mercury and the diaphragm processes were used, the production capacity was divided equally between them. Calculation based on Sommers (1957a).
Although official data on the trends in production technologies in the Western European
chlor-alkali industry are scarcely published, we can infer that the mercury process continued
to be used in the subsequent period54. As you can see in Table 3-11, which shows the
compositions of technologies used in Western Europe in 1972, the mercury process accounted
53 BASF cooperated closely with Krebs for technological development whereas Hoechst and Uhde jointly developed its technologies of the mercury process. 54 Before the World War I the alkali industry of the whole world was characterized by concerted action, with the exchange of information and adherence to apportioned markets. The center of this unofficial combine was Solvay & Cie. of Belgium, which, with its associates in other countries, exercised a dominant influence on the alkali industry (Ahlqvist, 1936). Because of the peculiar tradition of the alkali industry, no official figures were published in Europe either by the industry or by the government agencies, and hence most of the information was derived from individual investigations.
107

for almost 80 per cent of the total installations at chlor-alkali plants. The major suppliers of
technologies for the mercury process were De Nora, Hoechst-Uhde, Krebs, Solvay, and ICI.
Compared with Table 3-10, we can see that the composition of the technology suppliers for
the mercury process in Western Europe had basically remained unchanged since the end of
the Second World War.
Table 3-11 Chlor-Alkali Production Processes in Western Europe in 1972
Type of Technology Installed Units Mercury Process 146 (78%)
De Nora (WE) 29 Hoechst-Uhde (WE) 24 Krebs (WE) 24 Solvay (WE) 14 Krebskosmo (WE) 12 I.G. (WE) 8 ICI (WE) 5 BASF (WE) 5 Other/Unknown 25
Diaphragm Process 34 (18%) Hooker (US) 6 Pestalozza (WE) 6 Billiter (WE) 4 Other/Unknown 18
Sodium 5 (3%) Other 1 (1%)
Total 186 (100%) No data was available for 36 plants, which are hence excluded from the table. Calculation based on Chlorine Institute (1972).
As regards the production capacity in the same year, there is no detailed data available
to outside the industry. Table 3-12 only gives rough estimations about the shares of the
mercury and the diaphragm processes used in some Western European countries.
Nevertheless, we could see from this table that the mercury process remained the dominant
technology in the early 1970s for the chlor-alkali production.
Table 3-12 Shares of the Chlor-Alkali Production Processes in Western European Countries in 1972
Country Mercury Process Diaphragm Process Belgium 90 10 Francea 70 28 West Germany 89 11
108

Italy 99 1 Netherlands 75 25 Sweden 100 0 United Kingdom 90 10
Totalb 86 13 a: Electrolysis of molten salt of metallic sodium accounts for 2 %. b: All others account for 1 %. Source: Koyama (1972).
In the United States, in contrast, there was a proliferation of the diaphragm process to
chlor-alkali plants. By the Second World War, the diaphragm process had come to dominate
the U.S. chlor-alkali industry. Table 3-13 shows the distribution of various types of the
mercury process used in the chlorine plants in the United States immediately after the war. In
1946, the diaphragm process accounted for almost 90 per cent of the total production in the
U.S. Most of the technologies for the diaphragm process were provided by American
companies; Hooker cells were used most extensively, in 43 per cent of the capacity, followed
by Dow’s bipolar cells representing 17.5 per cent. Mercury cells, on the other hand,
accounted for only 4 per cent of the U.S. chlor-alkali production.
Table 3-13 Chlor-Alkali Production Processes in the United States in 1946
Type of Technology Installed Units Production Capacity* (Cl2 short tons/year)
Mercury Process 3 (5%) 68,400 (4.3%) Castner (US) 1 40,200ICI (WE) 1 23,800Sorensen (WE) 1 4,400
Diaphragm Process 54 (90%) 1,411,790 (88.6%) Hooker-S (US) 24 491,000Hooker-Columbia (US) 3 193,500Dow-Bipolar (US) 3 278,000Vorce (US) 4 151,700Gibbs (US) 3 93,000Diamond (US) 2 90,500Allen-Moore KML (US) 5 64,700Wheeler (US) 3 23,400Hargreaves Bird (WE) 3 11,000Nelson (US) 1 7,300Larcher (US) 1 4,400Townsend (US) 1 2,560MacDonald (US) 1 730
Fused Salt Process (Downs) 2 (3%) 92,000 (5.8%)
109

Nitrosyl process 1 (2%) 20,000 (1.3%) Total 60 (100%) 1,592,190 (100%)
* Built or under construction at the time of 1946. Source: MacMullin (1947).
Shares of the chlor-alkali production processes used in the United States in the
following years are given in Table 3-14. The share of the mercury process increased gradually
after the end of the war, reaching the peak of just less than 30 per cent in the late 1960s.
Nevertheless, the diaphragm process remained the dominant process in the United States
throughout the post-war period. The share of the diaphragm process started to rise again at the
end of the 1960s, and by the early 1970s, the diaphragm process had come to account for
more than 70 per cent of the total capacity in the U.S. chlor-alkali industry.
Table 3-14 Trends in the Shares of the Chlor-Alkali Production Processes in the United States
Year Mercury Process Diaphragm Process Other Processes 1952 12 80 8 1957 14.4 79.0 6.6 1962 18.5 76.2 5.3 1963 20.8 74.1 5.1 1964 23.0 72.2 4.8 1965 24.2 71.2 4.6 1966 26.5 69.7 3.8 1967 26.7 69.8 3.5 1968 28.6 68.1 3.3 1969 27.9 69.2 2.9 1970 27.2 69.6 3.2 1971 27.2 69.8 3.0 1972 24.2 72.4 3.4
Figures are expressed as percentages of the total production capacity. Sources: Gardiner (1978) for 1952; Sommers (1957b) for 1957; Chlorine Institute (1999b) for 1962 onward as of July 1 of each year.
The composition of chlor-alkali production processes used in the U.S. in the middle of
the 1960s is given in Table 3-1555. The diaphragm process had remained the main technology
for the U.S. chlor-alkali production for the 20 years following the end of the Second World
War. Hooker continued to be a dominant supplier of technologies, accounting for more than
one third of the total production capacities in the U.S., followed by Dow Chemical. On the
110

other hand, production units based on the mercury process were also introduced during the
same period. They were mostly provided by Mathieson in the United States, and De Nora,
Solvay, and Uhde in Western Europe.
Table 3-15 Chlor-Alkali Production Processes in the United States in 1965
Type of Technology Installed Units Production Capacity (Cl2 short tons/day)
Mercury Process 31 (37%) 4,811 (26.6%) Mathieson (US) 7 1,365De Nora (WE) 11 1,285Solvay (WE) 6 1,091Uhde (WE) 3 480ICI (WE) 1 230Krebs-BASF (WE) 1 185Dow (US) 1 125BASF (WE) 1 50
Diaphragm Process 45 (54%) 11,984 (66.4%) Hooker (US) 27 6,548Dow (US) 4 3,010Diamond (US) 5 1,333Columbia Southern (US) 1 600Gibbs (US) 2 274Allen-Moore (US) 2 78Vorce (US) 2 70Tucker Windecker (US) 1 35Wheeler (US) 1 26Townsend (US) 1 10
Fused Salt Process (Downs) 5 (6%) 780 (4.3%) KNO3-HNO3 Reaction 1 (1%) 60 (0.3%) Unknown 2 (2%) 425 (2.4%)
Total 84 (100%) 18,060 (100%) Data include projected constructions and expansions. Source: Sommers (1965).
In Japan, both the mercury process and the diaphragm process were used at the initial
stage of industrial development. Table 3-16 gives the shares of the chlor-alkali production
processes in Japan shortly after the Second World War. In 1949, the mercury process
accounted for 43 per cent of the total production capacity whereas the diaphragm process
accounted for 57 per cent. While most of the diaphragm process technologies were introduced
55 The data for 1965 in Table 3-15 is slightly different from that in Table 3-14. That is probably because of the difference in the date of counting.
111

from foreign providers, notably Billiter-Siemens, almost two thirds of the production
capacities based on the mercury process were provided by one Japanese company, Osaka
Soda (currently Daiso), with the rest of the mercury process provided by two companies
based in Western Europe, namely, Krebs and Solvay.
Table 3-16 Chlor-Alkali Production Processes in Japan in 1949
Type of Technology Installed Units Production Capacity (NaOH t/month)
Mercury process 18 (44%) 7,153 (43.1%) Osaka Soda (JP) 11 4,257Krebs (WE) 6 2,422Solvay (WE) 1 474
Diaphragm process 23 (56%) 9,434 (56.9%) Billiter-Siemens
(WE) 8 3,573
Allen-Moore (US) 4 1,468Nakano (JP) 1 1,363Horizontal (JP) 4 954Cylinder (JP) 1 661Hooker (US) 1 645Nelson (US) 4 524
Total 41 (100%) 16,587 (100%) Calculation based on Japan Soda Industry Association (1952).
After the end of the Second World War, detailed information on advanced technologies
for the mercury process developed in Western Europe became available to Japan. As many
Japanese companies started to direct innovative efforts toward the mercury process, various
types of technologies were developed in the post-war period. Table 3-17 gives the trends in
the shares of the chlor-alkali production processes used in the Japanese industry. As you can
see, the mercury process had come to become the dominant technology in Japan by the early
1970s, representing more than 95 per cent of the total production capacity at that time. In the
meantime, technological development for the diaphragm process had stagnated since the end
of the war, and its share continued to decline steadily.
Table 3-17 Shares of the Chlor-Alkali Production Processes in Japan
Year Mercury Process Diaphragm Process 1950 43.6 56.4 1951 41.8 58.2 1952 46.1 53.9 1953 47.9 52.1
112

1954 51.5 48.5 1955 55.6 44.4 1956 55.2 44.8 1957 62.9 37.1 1958 66.6 33.4 1959 66.8 33.2 1960 71.6 28.4 1961 78.8 21.2 1962 80.3 19.7 1963 80.9 19.1 1964 82.2 17.8 1965 85.6 14.4 1966 86.3 13.7 1967 87.3 12.7 1968 89.9 10.1 1969 91.1 8.9 1970 92.2 7.8 1971 95.2 4.8 1972 95.6 4.4
Figures are expresses as percentages of the total production capacity. Source: Calculation based on the production capacity data in Japan Soda Industry Association (1982) as of March in each year, except for August in 1959 and May in 1952.
The types of technologies used for chlor-alkali production at the time of 1972 are shown
in Table 3-18. We can observe that technologies for the mercury process were mainly
provided by De Nora, Uhde, and Krebs based in Western Europe, and Mitsui Engineering and
Shipbuilding (MES), Osaka Soda, Asahi Glass, and Kureha Chemical based in Japan.
Although there are cases in which the technology suppliers are not known, considering other
information sources on the development of technologies in technical and trade journals, we
could safely infer that the remaining chlor-alkali producers in Japan have adopted
technologies provided by these suppliers mentioned above.
Table 3-18 Chlor-Alkali Production Technologies in Japan in 1972
Type of Technology Installed Units Mercury Process 66 (76%)
De Nora (WE) 9Mitsui Engineering and Shipbuilding (JP) 8Osaka Soda (JP) 6Uhde (WE) 4Kureha Chemical Industry (JP) 4Asahi Glass (JP) 4
113

Krebs (WE) 3Krebskosmo (WE) 3Toyo Soda (JP) 1Tokuyama Soda (JP) 1Asahi Chemical Industry (JP) 1Olin (US) 1Other/Unknown 21
Diaphragm Process 16 (18%) Billiter (WE) 4Hooker (US) 3Allen-Moore (US) 1Nelson (US) 1Nippon Soda (JP) 1Tsurumi Soda (JP) 1Other/Unknown 5
Sodium 4 (5%) Unknown 1 (1%)
Total 87 (100%) Calculation based on Japan Soda Industry Association (1952), Chlorine Institute (1972).
There are several factors which are considered to have contributed to the different
courses of technological change prior to the 1970s between the mercury process in Western
Europe and Japan and the diaphragm process in the United States. We first consider the
availability of materials necessary for chlor-alkali production. They include mercury for the
mercury process and asbestos for diaphragm used in the diaphragm process, and different
types of salt suitable for use in each of the two production processes. Then we also consider
demand-side factors, including the different qualities of caustic soda between the mercury
process and the diaphragm process, which would influence the technological preference.
Regarding the choice of the mercury process in Western Europe, a large amount of
mercury was readily available for use in the chlor-alkali industry in Western Europe,
particularly in Spain and Italy. In 1928, a cartel known as Mercurio Europeo was organized
by Spanish and Italian producers to control production, distribution, and sale at a time when
world stocks of mercury were in excess of demand (Goldwater, 1972). Although detailed data
has not been available, it is estimated that more than 80 per cent of world production was
controlled by the interests who formed the combine. By agreement, 55 per cent of sales were
allocated to Spain and 45 per cent to Italy. While the Mercurio Europeo cartel was dissolved
in 1950, the two countries remained the two major mercury-producing countries. As Table
114

3-19 shows, the production of mercury in Spain and Italy in the middle of the 1960s
accounted for more than half of the world production.
Table 3-19 World Production of Mercury in the Middle of the 1960s
Country Annual Productiona (flasksb) Spain 78,322 (30.7%) Italy 57,001 (22.4%) U.S.S.R. 35,000 (13.7%) China 26,000 (10.2%) Yugoslavia 17,318 (6.8%) United States 14,142 (5.5%) Mexico 12,561 (4.9%) Other 14,629 (5.7%)
Total 254,973 (100%) a: Data are of the year 1964. b: The standard commercial unit of mercury is the flask containing 76 pounds avoirdupois. The flask has not always been exactly 76 pounds, but the Spanish flask was 34.5 kg, the Californian, Russian, and Italian flasks 34.7 kg, and the Mexican flask 34.15 kg (Goldwater, 1972). Source: United States Department of the Interior (1968).
In the United States, on the other hand, most of the chlor-alkali plants in had been based
on the diaphragm process. The main material of diaphragms used for chlor-alkali production
was asbestos. As Table 3-20 shows, the principal asbestos-producing countries in the late
1930s were Canada, the Soviet Union56, Southern Rhodesia, the Union of South Africa, the
United States, and Swaziland. In particular, Canada was the dominant producer of asbestos,
accounting for 60 per cent of the world production.
Table 3-20 World Production of Asbestos in the Late 1930s
Country Annual Productiona (short tons) Canada 364,472 (60.2%) Southern Rhodesia 58,313 (9.6%) Union of South Africa 22,050 (3.6%) United States 15,459 (2.6%) Swaziland 7,973 (1.3%)
World Total 605,000 (100%) a: Data are of the year 1939, except for the world total, with the data of the average of 1937-1939. Source: United States Tariff Commission (1951). 56 Although the statistics on the Soviet Union was not available, it was estimated that its asbestos production accounted for most of the remainder, making the country the second largest producer after Canada (United States Tariff Commission, 1951).
115

As the production of asbestos in the United States was minor in relation to the world
production, the country depended upon imports for most of its asbestos requirements. Table
3-21 gives the figures for imports, exports, and consumption of asbestos in the United States
in the late 1930s. Imports totaled 243,000 tons, accounting for 96 per cent of the consumption
of asbestos in the United States. And more than 90 per cent of the imports came from the
neighboring Canada, the largest producing country in the world. Asbestos was basically free
of duty, under the Tariff Act of 1922 and later under the Tariff Act of 1930, and its duty-free
status was bound in the trade agreement with Canada, effective January 1936 and January
1939 (United States Tariff Commission, 1951). Also, the Canadian asbestos deposits, which
were primarily located in the Eastern Townships of Quebec, the Cochrane district of Ontario,
and the Cassiar district of north-western British Columbia, were close to the main United
States consuming centers (Avery, Conant, and Wiessenborn, 1959). As several of the United
States asbestos manufacturers owned and operated asbestos mines in Canada, there was a
close relationship between Canadian producers of asbestos and United States consumers of it.
Thus we can see that asbestos was readily available for use as the key material of the
diaphragm to chlor-alkali producers located in the United States.
Table 3-21 Imports, Exports, Production, and Consumption of Asbestos in the United States in the Late 1930s
Quantity (short tons) Imports 243,079
Canada 221,973Southern Rhodesia 4,893Union of South Africa 4,761All other countries 11,452
Exports 2,653 Production 12,659 Consumption 253,085 Data are of the average of 1937-39. Source: United States Tariff Commission (1951).
The sources of salt, the principal input material for chlor-alkali production, could have
also influenced the technological choice between the mercury process and the diaphragm
process. Solid salt can be obtained from three sources: rock salt, salt from solution-mined
brine, and solar salt. While the diaphragm process can take full advantage of cheap brine
where it is available from brine wells, the mercury process requires solid salt to achieve
116

efficient utilization of salt, although it can also operate with brine as a raw material where that
is sufficiently cheap to offset the high unit consumption (MacMullin, 1947). As you can see
in Table 3-22, the sources of salt were different between countries in Western Europe and the
United States. While the salt produced in West Germany was mostly rock salt, 60 per cent of
the salt production in the United States came from brine wells. Hence, the diaphragm process
was favorable in the United States whereas the mercury process was favorable in West
Germany, and probably in neighboring countries as well.
Table 3-22 Production of Salt in West Germany and the United States in the Early 1950s
Country Rock Brine Evaporated Total West Germany 3,523 (91.5%) 328 (8.5%) 0 3,851 (100%) United States 4,479 (21.5%) 12,608 (60.6%) 3,702 (17.8%) 20,789 (100%) Data are of 1953. Figures are expressed in 103 short tons. Source: Harris (1960).
These factors can be considered to have influenced the choice of technological options
at the initial stage of the technological development in the chlor-alkali industry.
Technological development of the mercury process was mainly pursed by companies in
Western Europe, notably Solvay, Krebs, De Nora, Uhde, and ICI, whereas companies in the
United States mostly concentrated their innovative efforts on the diaphragm process,
particularly companies such as Hooker, Diamond, PPG, and Dow. Without extensive
technological interactions between the two regions, each process had been improved in its
unique way and chlor-alkali producers subsequently adopted the process which was readily
provided by technology suppliers in that region. In this way, learning experiences had been
accumulated on the production process specific to the region, which in turn had contributed to
further technological progress on that process.
In the post-war period, the mercury process was increasingly adopted all over the world.
As you can see in Table 3-14, the share of the mercury process increased rapidly in Japan.
Even in the United States, where the majority of the chlor-alkali plants had been originally
based on the diaphragm process, the mercury process increased its share gradually following
the end of the war. One of the reasons for the increased use of the mercury process can be
considered to concern a demand-side factor, particularly, the quality of caustic soda. High-
quality caustic soda with little impurity is required for the production of rayon, a textile made
from cellulose. As Table 3-23 gives the world-wide trends in the production of rayon since
1930, the rayon industry experienced a significant expansion and became one of the major
117

sectors which consume caustic soda in the post-war period. Since the quality of the caustic
soda produced by the mercury process is much purer than that produced by the diaphragm
process, the increased demand for caustic soda from the rayon industry induced chlor-alkali
producers to choose the mercury process for their production. In Japan, where the chlor-alkali
industry had used the mercury process and the diaphragm process equally, mostly relying on
technologies introduced from Europe and the United States, several innovative companies,
including Osaka Soda, Kureha Chemical, Mitsui Engineering and Shipbuilding, and Asahi
Glass, started to focus their efforts to develop technologies for the mercury process. By the
middle of the 1960s, however, the rayon production had leveled off in most parts of the world.
In the United States, as the production of rayon had declined by 1970, the mercury process
also started to decrease its share in the chlor-alkali industry.
Table 3-23 World Production of Rayon
Year Western Europe
United States
Japan Socialist countries
Others Total
1930 130 58 17 -a 2 207 1940 665 214 225 -a 23 1,127 1950 791 375 121 -a 54 1,341 1955 967 495 425 425 47 2,359 1965 1,101 506 446 684 238 2,975 1970 1,021 391 451 901 240 3,004
Figures are expressed in 103 tonnes/year. a: Figures of socialist countries from 1930 to 1950 are included in those of Western Europe. Source: Sakota (1977).
In this way, by the beginning of the 1970s, most of the chlor-alkali plants in Western
Europe and Japan had come to be based on the mercury process. Figure 3-7 shows the shares
of the mercury and the diaphragm processes in Western Europe, the United States, and Japan
in 1972. (Data are given in Table 3-25 in Appendix at the end of this chapter).
118

0%
10%
20%
30%
40%
50%
60%
70%
80%
90%
100%
Western Europe United States Japan
OtherDiaphragm ProcessMercury Process
Figure 3-7 Shares of the Mercury and the Diaphragm Processes in Western Europe, the United States, and Japan in 1972
While the diaphragm process had continued to be the major technology in the Untied
States, the mercury process had become dominant in Western Europe and Japan. Several
companies in each of Western Europe and Japan succeeded in making innovations on the
mercury process, and their technologies had been widely adopted by chlor-alkali producers in
these regions. Therefore, we can say that the initial conditions in terms of technological
development and adoption in Western Europe and Japan were similar at the time of the early
1970s, just before environmental regulations started to be imposed on mercury emissions
from chlor-alkali plants in the two regions. That will make it easier to see clearly the effects
of the introduction of environmental regulations at a later stage on the course of technological
change, without influences of other complicating factors.
119

3.4 Conclusion
The main products of the chlor-alkali industry are chlorine and caustic soda. The two
substances have been widely used as intermediate materials in various industries, including
the inorganic chemical, organic chemical, pulp and paper, and aluminum industries. Although
chemical processes had been traditionally used in the industry, currently the chlor-alkali
products are produced by the electrolysis of brine, that is, salt water. As brine is electrolyzed
with intensive use of electricity, the chlor-alkali industry consumes a large amount of electric
power. There are three types of electrolytic processes used in the world for commercial
production of the chlor-alkali products, namely, the mercury process, the diaphragm process,
and the ion exchange membrane process. Currently, the mercury process is the dominant
technology in Western Europe whereas the diaphragm process is widely used in the U.S.
chlor-alkali industry. In Japan, the ion exchange membrane process accounts for almost all of
the production technologies used in chlor-alkali plants. In this way, the three processes are
used as the major technology in different regions.
The mercury process and the diaphragm process for chlor-alkali production were
invented almost in the same period, at the end of the 19th century. Since then, technologies
for the mercury process had been mainly developed in Western Europe whereas U.S.
companies had been involved in improving technologies for the diaphragm process. Both
processes were initially introduced from Western Europe and the United States to the
Japanese chlor-alkali industry at the beginning of the 20th century. After the end of the
Second World War, in the United States, where the diaphragm process had been initially
preferred, technological progress was pursued subsequently by innovating companies on the
diaphragm process. Although the share of the mercury process increased slightly in the post-
war period, the diaphragm process had remained the dominant technology in the United
States. On the other hand, innovative companies in Western Europe and Japan devoted
research and development efforts to the mercury process. Through learning and knowledge
accumulation based on the increased use in the industry, technologies for the mercury process
were improved further, and more chlor-alkali producers adopted the mercury process in these
two regions.
By the late 1960s, the mercury process had come to dominate the chlor-alkali industry
in Japan as well as in Western Europe. In each region, there were several innovative
companies which made successful technological developments for the mercury process. In
120

Western Europe the major innovating companies included De Nora, Uhde, Krebs, Solvay, and
ICI, whereas in Japan Osaka Soda, Kureha Chemical Industry, Asahi Glass, Tokuyama Soda,
Asahi Chemical Industry, and Mitsui Engineering and Shipbuilding, which later established
Chlorine Engineers Corp., succeeded in developing their own technologies. That suggests that
several companies in Western Europe and in Japan were equally innovative on the mercury
process technologies, before environmental regulations started to be introduced in the early
1970s to reduce mercury emissions to the environment. In other words, the initial
technological conditions in the chlor-alkali industry were similar in Western Europe and
Japan prior to any influence of environmental regulations.
Since then, Western Europe and Japan have taken divergent courses of technological
change in the same industry. The mercury process has been phased out in Japan, and currently
almost all of the chlor-alkali production capacities are based on the ion exchange membrane
process, which has been developed since the 1970s. In contrast, the mercury process has
continued to be dominant in Western Europe, while the penetration of the membrane process
to chlor-alkali plants has been relatively limited. In the following two chapters, we will
investigate how environmental regulations on mercury emissions have influenced the patterns
of technological change in Japan and Western Europe. We will closely look at the ways in
which different technological trajectories have emerged between the two regions; that is, we
will examine why and how the option of developing end-of-pipe technologies have been
chosen to reduce mercury emissions in Western Europe whereas the ion exchange membrane
process, a clean technology which eliminates mercury pollution from within the production
process, has been invented and widely diffused in Japan.
Appendix
Table 3-24 Shares of Chlor-Alkali Production Capacities Based on the Mercury, Diaphragm, and Ion Exchange Membrane Process in Western Europe, the United States, and Japan in 1998
Mercury Process
Diaphragm Process
Ion Exchange Membrane Process
Other
Western Europe 60.7 23.0 13.4 2.9 United States 12.4 72.8 12.2 2.6 Japan 0 9.5 90.5 0
121

Sources: Western Europe: Euro Chlor (1998a) and European IPPC Bureau (1999); United States: Chlorine Institute (1999b);and Japan: Japan Soda Industry Association (1998b).
Table 3-25 Shares of Chlor-Alkali Production Capacities Based on the Mercury and the Diaphragm Processes in Western Europe, the United States, and Japan in 1972
Mercury Process Diaphragm Process Other Western Europe 86 13 1 United States 24.2 72.4 3.4 Japan 95.6 4.4 0 Sources: Western Europe: Koyama (1972); United States: Chlorine Institute (1999b); and Japan: Japan Soda Industry Association (1982).
122

4. Environmental Regulation and Technological Change in the
Japanese Chlor-Alkali Industry
4.1 Regulatory Decision on the Phase out of the Mercury Process
In May 1956, four cases of an unknown disease with nervous symptoms were reported in
Minamata in the southern part of Japan. Further investigations revealed that more patients
were suffering from the same symptoms among inhabitants in the Minamata Bay area.
Initially, heavy metals such as selenium, manganese, and thallium were suspected as the agent
causing the disease, but later the disease was proved to be methyl mercury poisoning caused
by ingestion of seafood caught in the Minamata Bay and the neighboring seas; hence it has
become called the Minamata disease. Although cases of poisoning from methyl mercury had
been known for one hundred years, it was the first case in which mercury poisoning was
caused by inhalation or absorption of fish and shellfish contaminated by methyl mercury
(Tsubaki and Irukayama, 1977).
Near the Minamata Bay an acetaldehyde plant had been operated by Chisso, the largest
manufacturer of this chemical substance in Japan at that time, while also producing chemical
fertilizers, industrial chemicals, and synthetic plastics and fibers. Mercury had been used as a
catalyst for producing acetaldehyde and vinyl chloride. As mercury began to be regarded as
the suspect of causing the Minamata disease, the wastewater from both the acetaldehyde and
vinyl chloride plants was first stored in a pool, and later it was processed in a cyclator. While
dissolved inorganic mercury compounds were precipitated, methyl mercury in the wastewater
was not removed in the cyclator, however, and the effluent containing methyl mercury
continued to be discharged into the Minamata Bay. As subsequent examinations revealed that
seafood from the Minamata Bay still contained abnormal levels of mercury, the wastewater
flow from the acetaldehyde plant was finally altered to form a complete recirculating system
in May 1966. In the meantime, another case of patients suffering from the same symptoms
was reported in the Agano River basin, Niigata, in July 1965, which subsequently came to be
called the second Minamata disease. In May 1968, 12 years after the first discovery of the
Minamata disease, the acetaldehyde plant finally ceased its operation. Four months later, the
Ministry of Public Health and Welfare made an official statement that the causative agent of
the Minamata disease was the methyl mercury compound emitted from the acetaldehyde plant
123

of Chisso. In March 1971, the vinyl chloride manufacturing process was converted to the
ethylene process, in which no mercury was involved.
Mercury had been widely used as a catalyst for synthesizing acetaldehyde by the
hydration of acetylene. During the period from 1932 to 1968, 456,300 tonnes of acetaldehyde
were produced in the Minamata plant (Iijima, 1990b). Of 1,181.1 tonnes of mercury inputted
in total, 204.9 tonnes were consumed, and the loss of mercury discharged in the wastewater
was estimated to be 81.3 tonnes. The synthesis of vinyl chloride was made by a process in
which acetylene was reacted with hydrogen chloride in the gaseous state, and mercuric
chloride adsorbed onto activated carbon, so-called mercury dregs, was used as a catalyst. The
total amount of 510,000 tonnes of vinyl chloride was produced in the period from 1941 to
1971. With 178 tonnes of mercury consumed in total, the estimated loss of mercury was 0.2
tonnes, a figure which was much smaller than that for the acetaldehyde manufacture. While it
had become clear that the material which caused the Minamata disease was the methyl
mercury emitted from the acetaldehyde plant, at that time there was no scientific explanation
which explained in a satisfactory manner, qualitatively as well as quantitatively, why methyl
mercury, a form of organic mercury, was formed in the plant, where acetaldehyde was
synthesized from acetylene with the use of inorganic mercury as a catalyst57.
Having seen the misery of the Minamata disease, which caused at least 700 patients
who had been recognized by the government by the end of 1972, the general public started to
have a grave concern about pollution in the environment. The Basic Law for Environmental
Pollution Control was enacted in August 1967, establishing environmental quality standards
based on the designation of pollutants’ target ranges, the liability of polluters, and the
responsibilities of the national as well as local governments. It was then followed by other
regulations to control mercury emitted to the environment. The chlor-alkali industry, in
particular, was using a large amount of mercury for the mercury process in the 1960s and thus
invited public attention, although the emissions from the industry did not include any trace of
methyl mercury, the organic mercury which caused the Minamata disease. Without any
organic substances involved in the relevant chemical reactions, there was no possibility of the
formation of organic mercury within chlor-alkali plants. Nevertheless, in June 1968 the
57 A book which has been published recently tries to elucidate the scientific mechanism of the formation of methyl mercury in the process of synthesizing acetaldehyde from acetylene with inorganic mercury (Nishimura and Okamura, 2001). According to the authors, methyl mercury was formed at the Minamata plant because the high concentration of chlorine ions in the reactor, caused by the inappropriate management of the process water,
124

Ministry of International Trade and Industry (MITI)58 started to investigate mercury uses in
chlor-alkali plants, in the presence of a significant degree of uncertainty in the scientific
mechanism of the transformation of mercury in the environment 59 . This was the first
involvement of the government in issues related to mercury emissions of the chlor-alkali
industry. In February 1969, all the waters linked to chlor-alkali plants based on the mercury
process became subject to the Law for the Conservation of Water Quality in Public Areas
(Japan Soda Industry Association, 1982). At this moment, the emphasis of these measures
was basically place on how to reduce, but not necessarily eliminate, mercury emissions into
the environment.
Table 4-1 lists chronologically major regulations and measures on mercury emissions,
particularly those related to the chlor-alkali industry.
Table 4-1 Chronology of Environmental Regulations on Mercury Emissions from Chlor-Alkali Plants in Japan
Year Environmental Regulation June 1968 First government investigation on mercury uses in chlor-alkali plants February 1969 All mercury chlor-alkali plants subject to the Law for the Conservation
of Water Quality in Public Areas May - June 1973 Newspaper reports on the third and fourth Minamata disease due to
mercury pollution from chlor-alkali production processes (proved later to be false)
June 1973 Establishment of the Council for the Promotion of Countermeasures against Mercury Pollution
November 1973 Government mandate for completion of the closed system of mercury by December 1973 and conversion of 2/3 of the mercury process to the diaphragm process by 9/1975 (phase I) and the rest by 3/1978 (phase II)
April 1976 Completion of the first phase of process conversion to the diaphragm process
May 1977 Postponement of the second phase of process conversion June 1979 Evaluation report on the ion exchange membrane process September 1979 Government mandate for completion of the second phase of process
conversion to the ion exchange membrane process by December 1984 June 1986 Completion of the second phase of process conversion to the ion
exchange membrane process and phase-out of the mercury process
helped to create methyl chloride mercury, which was easy to evaporate, thus easy to leak to the outside of the system. 58 MITI has been recently reorganized into the Ministry of Economy, Trade, and Industry (METI). 59 At that time there were some research results which suggested that aquatic micro-organisms could convert inorganic mercury into the methyl mercuric ion and, under certain conditions, also into the water-immiscible, volatile dimethyl mercury (Bouveng, 1972).
125

Then, in May 1973, a newspaper published an article which suggested that a case of the
third Minamata disease was discovered in the Ariake Sea area in Kyushu (Asahi Shinbun,
1973a). Just one month later the same newspaper reported a similar incident which happened
near Tokuyama Bay in the western part of Japan (Asahi Shinbun, 1973b). As both cases were
linked to industrial complexes which involved chlor-alkali plants, the public pressure was
growing to demand some measures to stop mercury emissions from these plants, although
there was no scientific evidence to support these allegations, which proved to be false later.
Many fishermen went on demonstrations against mercury-based chlor-alkali plants in coastal
areas throughout Japan, and some of the plants were actually forced to halt their operations.
The Environmental Agency, which had been established just two years earlier, organized the
Health Examination Committee, and conducted medical examinations of inhabitants of nine
marine areas, including the Ariake Sea and Tokuyama Bay areas. No case of the Minamata
disease or methyl mercury poisoning was found in any area other than Minamata Bay and its
neighboring seas (Irukayama, 1977). Nevertheless, the public pressure for immediate actions
was so fierce that the Japanese government was prompted to take measures to cut mercury
emissions.
On June 12, 1973, in the wake of the controversies triggered by the newspaper reports,
the government established the Council for the Promotion of Countermeasures against
Mercury Pollution (Countermeasures Council) in the Environmental Agency. It was chaired
by the Minister of State for Environment, assisted by the Administrative Vice-Minister and
the State Secretary for Environment, and consisted of members from twelve ministries and
agencies in the government (Japanese Ministry of International Trade and Industry, 1979). As
all relevant ministries and agencies were represented, with only the Ministry of Justice and
the Ministry of Posts and Telecommunications absent, the Countermeasures Council could
coordinate policies of different government bodies and thus was decisive in making the
government’s position on the issue of mercury emissions.
At the first meeting held on June 14, 1973, the Countermeasures Council decided that,
after the completion of installing the so-called closed system for effluents containing mercury
by the end of September 1974, as many mercury plants as possible should be converted to the
diaphragm process by the end of September 1975. The chlor-alkali industry association
argued that there were many technical as well as economic difficulties in the conversion of
the existing mercury plants to the diaphragm process and that its implementation would take a
long period of time (Japan Soda Industry Association, 1973a). The statement of the industry
126

was also handed over to the Minister of the Environmental Agency when the representatives
of the industry visited the Agency to discuss the issue (Japan Soda Industry Association,
1973b). The industry’s request was not accepted by the Minister, however, and the third
meeting of the Countermeasures Council, which was subsequently held on November 1973,
agreed on the following concrete schedule for the process conversion program (Council for
the Promotion of Countermeasures against Mercury Pollution, 1973):
Two thirds of the existing mercury plants are to be converted to the diaphragm
process by September 1975, and the remaining one third by March 1978.
That means that there were only less than two years left for many of the existing mercury
plants to conduct the technological conversion from the mercury process to the non-mercury,
diaphragm process.
4.2 Conversion of the Mercury Process to the Diaphragm Process
Following the government’s decision to convert the existing mercury plants to the diaphragm
process, MITI organized the Committee for the Promotion of Process Conversion in the Soda
Industry (Conversion Committee) on September 14, 1973, as a private consulting body to the
Director-General of MITI’s Basic Industries Bureau. As shown in Table 4-2, the members of
the Conversion Committee were selected from banks, academics, journalism, and industry,
reflecting the relevant issues to be discussed. Along with a subcommittee, three expert groups
were established on finance and tax, technology and regulation, and supply and demand
coordination to have more detailed and informed discussions on the schedule and criteria for
the process conversion program and financial and tax incentives to support it.
Table 4-2 Members of the Committee for the Promotion of Process Conversions in the Soda Industry
President, Japan Development Bank; Member, Central Council for Countermeasures against Public Nuisance
ISHIHARA Amao (Chairman)
Governor, Chiba Prefecture TOMONO Takeo President, Industrial Bank of Japan MASAMUNE Isao President, Long-Term Credit Bank of Japan SUGIURA Shunsuke Professor, University of Tokyo MUKAIBO Takashi Professor, Yokohama National University MATSUNO Takeo Member, Central Council for Countermeasures against Public Nuisance; Member, Science and Technology Council
KUROKAWA Matake
Editorial Board Member, Asahi Newspaper; Member, Central Council for Countermeasures against Public Nuisance
KISHIDA Junnosuke
127

Editorial Board Member, Nihon Keizai Newspaper KAMADA Isao Chairman, Japan Paper Manufacturers’ Association KANEKO Saichiro Chairman, Japan Chemical Fibers Association YASUI Yoshizo Chairman, Vinyl Chloride Industry Association SHIMAMURA Michiyasu Counselor, Japan Soda Industry Association NINOMIYA Yoshimoto Vice Chairman, Japan Soda Industry Association; Chairman, Committee for Countermeasures against Mercury
IMAI Hiroshi
Director-General, Basic Industries Bureau IIZUKA Shiro Source: Japan Soda Industry Association (1974a).
The Conversion Committee decided on the criteria for the conversion of mercury plants
specified as follows (Japanese Ministry of International Trade and Industry, 1973):
1. Plants whose mercury consumption per unit caustic soda is higher than the
average of the soda industry are to be completely converted by September
1975.
2. Plants whose mercury consumption per unit caustic soda is lower than the
average of the soda industry are to be converted in the following way.
a. Facilities which will end their lifetime by September 1975 are to be
converted partially by September 1975 and completely by March 1978,
depending on the conditions of depreciation and mercury management.
b. Facilities which will not end their lifetime by September 1975 are, in
principle, to be converted completely by March 1978.
In this way, the process conversion program was decided to be implemented in two steps: the
first phase for two thirds of mercury plants to be converted by September 1975 and the
second phase for the remaining one third to be converted by March 1978.
For the implementation of the process conversion program, tax reductions were
introduced to support newly converted or expanded production facilities. Table 4-3 shows the
new scheme for tax reductions. The special depreciation rate applicable for the first year was
one third at the beginning and then was reduced gradually. While the new tax reduction
scheme was initially targeted to the diaphragm process, after the fiscal year 1978 this
preferential tax treatment became applicable to the ion exchange membrane process, which
had been just developed by several innovative companies in the Japanese chlor-alkali industry.
Table 4-3 Tax Reductions for the Process Conversion in the Chlor-Alkali Industry
Fiscal Yeara Targeted process Special depreciation rateb
Special tax rate on fixed assetsc
128

1973 D 1/3 1/2 1974 D 1/3 1/2 1975 D 1/3 1/2 1976 D 25/100 3/5 1977 D 25/100 3/5 1978 IM 25/100 3/5 1979 IM 25/100 3/5 1980 IM 20/100 3/5 1981 IM 20/100 3/5 1982 IM 18/100 3/5 1983 IM 18/100 3/5 1984 IM 18/100 3/5 1985 IM 16/100 2/3 1986 IM 16/100 2/3
D: Diaphragm process; IM: Ion exchange membrane process a: A fiscal year starts in April and ends in March next year. Exceptions in the table are April – December in 1984, January – December in 1985, and January – June in 1986. b: The special depreciation rate was applied for the first year, in addition to the normal depreciation rate. c: The special tax rate was applied for three years after purchase. Source: Japan Soda Industry Association (1985).
When the official decision was made on the phase out of the mercury process, it was by
far the dominant technology adopted for the chlor-alkali production in Japan, accounting for
95 % of the total capacity as you can see in Table 3-17. In replacing the mercury process, the
only alternative technology available at that time was the diaphragm process, a type of
process technology which was used for only 5 % of the total production. As the regulatory
schedule for process conversions specified that two thirds of the mercury process plants must
be converted to the diaphragm process just in two years, there was not sufficient time for
companies in the chlor-alkali industry to newly develop by themselves diaphragm-based
technologies which could be feasible at the industrial level. Consequently, technologies
necessary for the diaphragm process had to be introduced mostly from foreign companies.
The types of technologies for the diaphragm process adopted during the first phase of
the process conversion program are shown in Table 4-4. Under the policy schemes, the first
diaphragm plant converted from the mercury process started to operate in March 1974, and
other conversions followed in the subsequent period up to 1976. Reflecting the most
advanced development of the diaphragm process in the U.S. at that time (see Table 3-9),
many of the technologies adopted for the diaphragm process were provided by American
129

suppliers; Diamond Shamrock based in the U.S. accounted for 32 % of the total capacity,
Hooker based in the U.S. for 27 %, and PPG based in the U.S. for 26 %. Only 15 % of the
total production capacity relied on technologies provided by Japanese companies. While
Nippon Soda, Tsurumi Soda, and Showa Denko had previous technical experiences on the
diaphragm process, the technology developed by Kureha Chemical Industry was the first to
be introduced for commercial purposes in the chlor-alkali industry.
Table 4-4 Technologies for the Diaphragm Process Adopted during the First Phase of the Process Conversion Program
Technology (Company)
Start-up Year
Plant Capacity (NaOH t/y)
1974 Asahi Glass, Kita-Kyushu 16,3001974 Sumitomo Chemical, Ohita 15,4001974 Mitsui Toatsu, Nagoya 59,1001975 Ajinomoto, Kawasaki 35,7001975 Tokuyama Soda, Tokuyama 190,4001975 Mitsui Toatsu, Ohmuta 80,2001975 Nihon Vinyl Chloride, Chiba 86,6001975 Osaka Soda, Matsuyama 44,4001976 Toagosei Chemical, Tokushima 148,5001976 Hodogaya Chemical, Kohriyama 24,5001976 Nikkei Kako, Kanbara 36,6001976 Toyo Soda, Yokkaichi 70,8001977 Nankai Chemical, Tosa 15,700
DS (Diamond Shamrock, US)
Total 13 plants 31,216,793 (31.9%)
1974 Mitsubishi Gas Chemical, Naniwa 12,2001974 Kanegafuchi Chemical, Takasago 99,3001974 Central Chemical, Kawasaki 61,0001974 Sanyo Kokusaku Pulp, Iwakuni 28,0001975 Hokkaido Soda, Tomakomai 119,5001975 Shin-etsu Chemical, Naoetsu 40,2001975 Osaka Soda, Amagasaki 51,1001975 Denki Kagaku Kogyo, Ohme 61,0001975 Mitsubishi Monsanto, Yokkaichi 56,4001975 Tekkosha, Sakata 36,5001975 Mitsubishi Chemical, Kurosaki 40,0001975 Ryonichi, Mizushima 97,600
Hooker (Hooker, US)
Total 12 plants 702,800 (27.2%)1975 Asahi Glass, Kashima 160,0001975 Toyo Soda, Nanyo 156,200
Glanor (PPG, US)
1975 Asahi Glass, Chiba 180,000
130

1976 Sumitomo Chemical, Kikumoto 174,200 Total 4 plants 670,400 (26.0%)1974 Nippon Soda, Nihongi 25,8001975 Chiba Chlorine Chemical, Chiba 111,400
BM (Nippon Soda, Japan)
Total 2 plants 137,200 (5.3%) 1974 Tsurumi Soda, Tsurumi 10,5001974 Showa Enso, Gushikawa 3,100
TSBM (Tsurumi Soda, Japan)
Total 2 plants 13,600 (0.5%) 1975 Showa Denko, Kawasaki 103,1001975 Kanto Denka Kogyo, Mizushima 38,200
SD (Showa Denko, Japan)
Total 2 plants 141,300 (5.5%) 1976 Kureha Chemical Industry,
Nishiki 93,500SK
(Kureha Chem., Japan) Total 1 plant 93,500 (3.6%)
Total 36 plants 2,583,000 Sources: DS and Glanor: Chlorine Engineers Corp. (1999b). Hooker: European Chemical News (1974) (converted from daily capacities). BM: Calculation based on Japan Soda Industry Association (1982) (converted from monthly capacities). TSBM: Tsurumi Soda (2001), Nikkei Sangyo Shinbun (1975b), Showa Chemical (2001). SD: Takeshita (1990), Nikkei Sangyo Shinbun (1975a), Kanto Denka Kogyo (1998). SK: Shibata, Kokubu, and Okazaki (1977).
As many mercury-based plants were converted to the diaphragm process, however, the
serious concern which had been raised previously, that is, the high production cost of the
diaphragm process with the output of low-quality caustic soda, materialized in the industry.
Many users who had previously purchased caustic soda produced by the mercury process
demanded the same level of high quality for caustic soda. For about 25 % of all the
applications, caustic soda produced by the diaphragm process was considered not to be
suitable, especially for the manufacture of chemical fibers such as rayon (Japan Soda Industry
Association, 1982). Since rayon is a thin fiber whose diameter is in the order of micro, i.e. 10-
6 meters, it can be easily cut when impurities exist in caustic soda (Sakota, 1977). Hence the
manufacturing of chemical fibers requires caustic soda which contains as fewer impurities as
possible.
Table 4-5 shows the results of an analysis of the quality of caustic soda produced by the
mercury and diaphragm processes. While the caustic soda produced by the mercury process
was relatively pure, the diaphragm process produced caustic soda which contained more
131

impurities, notably sodium chloride. Its concentration was 1 %, a level which was much
higher than that acceptable for use in the manufacture of chemical fibers.
Table 4-5 Quality of Caustic Soda Produced with the Mercury Process and the Diaphragm Process
Chemical fiber gradec Mercury processa
Diaphragm processb No. 1 No. 2
Sodium chloride (NaCl)
0.003 1.0 > 0.07 > 0.40
Sodium carbonate (Na2CO3)
0.037 0.07 > 0.3 > 0.4
Silicon dioxide (SiO2)
0.0035 0.02 > 0.03 > 0.15
Aluminium oxide (Al2O3)
0.00044 0.0005 > 0.02 > 0.04
Calcium oxide (CaO)
0.0004 0.003 > 0.005 > 0.008
Iron(III) oxide (Fe2O3)
0.00015 0.0009 > 0.003 > 0.005
Sodium sulfate (Na2SO4)
0.0026 0.02 - -
Figures are expressed in percentage. a: 1975 b: 1974 c: Japan Industrial Standard (JIS) K 1204-1955, K 1205-1955 Sources: Sakota (1977), Industrial Structure Council (1972).
As the demand for the poor-quality caustic soda was low, manufacturers who had
already converted their plants to the diaphragm process had difficulties in selling their
products to customers. They argued for a level playing-field; that is, they demanded that
diaphragm and mercury plant operators deal with, that is, consume and sell, caustic soda
produced by the diaphragm and mercury processes in the same proportion by making barter
trades with each other. MITI, intending to promote the conversion program smoothly,
responded to this claim by issuing an administrative guidance in June 1975. With its
instruction, caustic soda producers had to submit their production plans every three months to
MITI. MITI, in turn, based on its demand projection for the quarter, revised the production
plans and mediated barter trades among the producers between caustic soda produced by the
diaphragm process and that produced by the mercury process (Japanese Ministry of
International Trade and Industry, 1975b).
132

Furthermore, the diaphragm process was also at a disadvantage in terms of the energy
consumption, which occupies a major part of the chlor-alkali production process. At that time,
the energy consumption of the diaphragm process was approximately 3,400 kWh per tonne of
caustic soda, which was larger than that of the mercury process, 3,200 kWh per tonne of
caustic soda (Japan Soda Industry Association, 1975). This difficulty worsened by the oil
crisis which happened during the 1970s. Table 4-6 shows the trends in the electricity prices
for average consumers, large consumers, and chlor-alkali producers in Japan since the
beginning of the 1970s. The price of electricity used for chlor-alkali production almost tripled
after the first phase of the energy crisis, from 3.10 yen/kWh in 1970 to 9.10 yen/kWh in 1977.
By the early 1980s, the electricity price for chlor-alkali producers had reached 14.80, a level
which is more than four times larger than the price at the beginning of the 1970s.
Table 4-6 Electricity Prices in Japan
Year Normal Consumer Large Consumer Chlor-Alkali Producer 1970 6.35 3.92 3.10 1971 6.52 3.98 3.40 1972 6.57 3.99 3.30 1973 6.76 4.17 4.16 1974 10.62 7.72 7.14 1975 11.61 8.49 7.69 1976 13.20 9.75 8.42 1977 14.51 10.62 9.10 1978 14.02 9.95 8.42 1979 14.69 10.52 9.12 1980 22.47 17.07 14.31 1981 23.14 17.30 14.80 1982 23.44 17.40 14.45 1983 23.53 17.35 14.35 1984 23.53 17.23 13.34 1985 23.71 17.38 13.36 1986 21.93 15.66 11.73
Source: Japan Soda Industry Association (1988).
Heavily dependent on electricity, chlor-alkali producers were particularly hit by the
soaring energy cost. As the cost of caustic soda produced at newly constructed diaphragm
plants became significantly larger than that at the existing mercury plants, the barter trading
system was modified in October 1976 to include financial compensations reflecting the cost
difference. In exchanging caustic soda, mercury process operators had to pay their
133

counterparts using the diaphragm process for the cost difference, which was initially
determined to be 5,000 yen per tonne of caustic soda and was changed one year later to 5,500
yen per tonne (Japan Soda Industry Association, 1980a). Table 4-7 gives the figures which
show the extent to which caustic soda was exchanged between the operators of the two types
of production processes. Until the barter trading system was finally abandoned in September
1980, approximately 6 % of the total caustic soda production was exchanged in average, and
more than 3 billion yen was transferred from operators of the mercury process to those of the
diaphragm process.
Table 4-7 Exchange of Caustic Soda between the Mercury Process and Diaphragm Process Operators
Period Quantity exchanged (tonnes)
Exchange/Production (%)
Financial transfer (thousand yen)
1975 July – September October – December
32,674 57,167
4.4 7.3
- -
1976 January – March April – June July – September October – December
58,165 60,718 49,517 50,240
7.6 8.5 6.8 7.3
- - -
251,200
1977 January – March April – June July – September October – December
48,275 51,791 49,805 46,993
6.8 7.2 6.8 6.6
241,375 258,955 273,927 258,462
1978 January – March April – June July – September October – December
44,037 45,240 45,335 43,598
6.1 6.6 6.5 6.6
242,203 248,820 249,343 239,789
1979 January – March April – June July – September October – December
38,731 39,758 41,623 46,005
5.8 5.6 5.1 5.5
213,020 218,669 228,927 253,027
1980 January – March April – June July – September
42,402 41,576 41,647
5.0 5.2 5.5
233,211 228,668 229,059
Total 975,297 6.3 3,868,655 Source: Japan Soda Industry Association (1982).
134

The first phase of the conversion program was completed in April 1976. By that time,
the proportion of the production capacity of the mercury process had dropped to
approximately 40 % whereas the share of the diaphragm process had increased significantly
from the level of less than 5 % prior to the conversion program. That was achieved half a year
behind the schedule, due to the technical as well as economic problems caused by the oil
crisis at that time (Japanese Ministry of International Trade and Industry, 1975a). Heavily
impacted by the rising energy cost following the oil crisis, the chlor-alkali industry,
particularly its members which was still operating mercury-based plants, claimed that they did
not have sufficient financial resources to conduct more process conversions and made a
request to the Liberal Democratic Party, the party in power at that time, as well as to MITI
that the implementation of the second phase of the process conversion program should be
postponed (Japan Soda Industry Association, 1979a).
4.3 Interruption of the Process Conversion Schedule and Evaluation of the Ion
Exchange Membrane Process
In these circumstances, the fourth meeting of the Countermeasures Council took place in May
1977. MITI explained to the other members that the caustic soda produced by the diaphragm
process had a low quality and thus was very difficult to use. And at the same time, it was also
mentioned that a newly developed process, the ion exchange membrane process, was in a
process of rapid progress and that it was expected to be able to produce high-quality caustic
soda. Taking into account the situation of the technological progress of the emerging ion
exchange membrane process, the Countermeasures Council made a decision that the
implementation of the second phase of the conversion program should be suspended until an
appropriate judgment could be made on the feasibility of the ion exchange membrane process
at the industrial scale (Council for the Promotion of Countermeasures against Mercury
Pollution, 1977)60.
60 It was also decided at the meeting that the safety of the closed system, which had been already installed in the existing mercury plants, would be examined thoroughly by an expert group. Accordingly, the Expert Committee for Examination of the Closed System (Examination Committee) was established in June 1977 as a subcommittee in the Conversion Committee. It was chaired by an academic researcher, MATSUNO Takeo, Professor of Yokohama National University, for independent investigations. The first result of its investigations was published in October 1977, concluding that the closed system installed at mercury plants was functioning properly and that there was no mercury pollution which would pose threat to the health of the local people
135

Then, an expert group was established to make a technical evaluation of the ion
exchange membrane process, with a specified deadline of October 1977. The newly created
subcommittee, the Expert Committee for Technical Evaluation of the Ion Exchange
Membrane Process, the so-called Evaluation Committee, set out to do its assigned task in
June 1977. As Table 4-8 shows, the four members who constituted the Evaluation Committee
were all academic researchers of public research institutes. This selection of the experts was a
reflection of the government’s intention that the committee’s technological evaluation should
be conducted in a neutral arena, avoiding any intervention of particular industrial or corporate
interests.
Table 4-8 Members of the Expert Committee for Technical Evaluation of the Ion Exchange Membrane Process
Position Name Expertise Professor, Kyoto University YOSHIZAWA Shiro Electrochemistry Professor, Yokohama National University
MATSUNO Takeo Electrochemistry, Environmental Chemistry
Professor, University of Tokyo TSURUTA Teiji Polymer Chemistry Director, Tokyo Industrial Laboratory ISHISAKA Seiichi System Engineering Source: Expert Committee for Technical Evaluation of the Ion Exchange Membrane (1977).
The Evaluation Committee made a thorough examination of technologies which were
being developed at that time by chlor-alkali companies, domestic as well as foreign, through
documents, interviews, and, in some cases, visits to plant sites. In evaluating the technologies,
the committee paid particular attention to the following aspects: performance, including
power and steam consumption, caustic soda concentration, electricity density, and product
quality; operation and maintenance management; durability and stability of ion exchange
membranes; environmental and safety measures; and construction and operational costs. The
findings of the Evaluation Committee were published in October 1977 (Expert Committee for
Technical Evaluation of the Ion Exchange Membrane Process, 1977). The Committee’s
technical evaluation of the ion exchange membrane process at that time was as follows:
While we could consider overall that, as far as the current situation in Japan is
concerned, the ion exchange membrane process technology has reached a level
appropriate for industrialization, we should be cautious about its evaluation,
(Expert Committee for Examination of the Closed System, 1977). The conclusion of the first report was reconfirmed by the Examination Committee in June 1979 (Expert Committee for Examination of the Closed System, 1979).
136

taking into full account the importance of caustic soda and chlorine as basic
chemical materials and its impacts on other industries. In order to conclude that
this technology is industrially viable, it is indispensable that the durability of
various materials, including, among others, ion exchange membranes and
electrolytic cells, and the operational performance of plants are well demonstrated.
At this moment, however, we have not yet obtained sufficient data on these
aspects, and thus it is necessary to continue our observation to obtain more data
on the operation of commercial plants for at least two years. If it is confirmed that
the current operational performance is maintained throughout the period, we can
regard this technology as industrially established.
As regards the development of the ion exchange membranes, they are only
produced in a small scale, just meeting the demand. Hence it is also necessary, by
the time when the ion exchange membrane process technology reaches the level
of industrial viability, that a system for stable supply of ion exchange membranes
is established.
While recognizing that several companies had already possessed technologies for the
membrane process ready for industrial applications, the Evaluation Committee asked for more
data to reach a conclusion with sufficient confidence. Based on the recommendation, the
government made a decision to postpone the process conversion program for about two years.
In September 1978, almost one year after the publication of the first report, the members of
the Evaluation Committee resumed their activities to see the technological progress made
during the past year 61 . Basically, they followed the same procedure, evaluating again
different types of the membrane process by reviewing reports and documents, undertaking
interviews with firms in Japan as well as in foreign countries, and doing fieldwork. It was
found that, as several companies actively conducted R&D activities, a considerable progress
had been made on the ion exchange membrane process in one year.
In particular, three companies, namely, Asahi Chemical Industry, Asahi Glass, and
Tokuyama Soda, were found to be well ahead of other companies in developing their
technologies for the ion exchange membrane process. Asahi Chemical Industry’s first
61 One of the members, ISHISAKA Seiichi, was replaced by SHIROZUKA Tadashi, Professor of Waseda University (applied chemistry), before the publication of the second report (Expert Committee for Technical Evaluation of the Ion Exchange Membrane Process, 1979).
137
commercial plant and Asahi Glass’s demonstration plant had already had experiences of
stable operation for several years. Another commercial plant constructed by Asahi Chemical
Industry and the first commercial plant of Asahi Glass had been operated reliably since the
beginning of their operations, though for shorter periods. Tokuyama Soda had also started to
operate commercial plants, and both of them had been running without any serious problems
since the replacement of the original ion exchange membranes with those currently in use.
These examples of stable and reliable plant operation convinced the members of the
Evaluation Committee that the ion exchange membrane process not only eliminated mercury
emissions into the environment, but also had surpassed the mercury process in the efficiency
of energy consumption while producing caustic soda with the same quality as the mercury
process.
With these findings in hand, the Evaluation Committee published its second report in
June 1979, making the following judgment (Expert Committee for Technical Evaluation of
the Ion Exchange Membrane Process, 1979):
Taking into account the operating experiences of various plants overall, our
Committee considers that the ion exchange membrane process technology in
Japan has reached a level which could be regarded as an established industrial
technology.
In the following section, we examine in detail how the ion exchange membrane process
has been developed by innovative companies in the Japanese chlor-alkali industry.
4.4 Technological Development of the Ion Exchange Membrane Process
4.4.1 Characteristics of the Ion Exchange Membrane Process
We first closely examine the technological characteristics of the ion exchange membrane
process by analyzing the chemical reactions involved, as we have done previously for the
mercury process and the diaphragm process. The ion exchange membrane process operates in
a similar way to the diaphragm process, with basically the same chemical reactions which
does not involve any use of mercury throughout the whole production process (Curlin,
Bommaraju, and Hansson, 1991; Schmittinger, 2000). Figure 4-1 gives a simplified flow
diagram of the ion exchange membrane process.
138

In the ion exchange membrane process, a higher degree of brine quality is required than
the mercury process because ion exchange membranes are extremely sensitive to brine
impurities such as calcium and magnesium ions (Japan Soda Industry Association, 1998b).
When impurities precipitate, ion exchange membranes are physically disrupted, which will
lead to a substantial reduction in the current efficiency62. The circulating brine must be
rigorously purified to avoid any buildup of these substances to undesirable levels. While the
primary purification step, which consists of precipitation and filtration, produces brine
satisfactory for both the mercury process and the diaphragm process, it is not sufficient to
meet the extremely high level of brine purity required for the ion exchange membrane process
makes. Thus, following the primary purification by the precipitation-filtration step, the brine
goes through an additional step for fine purification, as the life expectancy of the expensive
ion exchange membrane also depends on the purity of the brine.
62 The current efficiency of an electrolytic process is the ratio of the amount of material produced to the theoretically expected quantities. Inefficiencies arise from secondary reactions occurring at the anode and cathode and in the bulk.
139

Electrolysis
Liquefaction
Cooling
Dechlorination
Salt (NaCl)
Brine saturation
Precipitation
Filtration
Fine purification
Compression
Evaporation
Cooling
Storage
Chlorine (Cl2)
Hydrogen (H2)
Caustic Soda (NaOH)
H2O
Raw brine
Purified brine
H2NaOH
Cl2
Diluted brine
Anolyte
Drying
Cooling
Water(H2O)
Concentration
Cooling
Electricity
Steam
Figure 4-1 Flow Diagram of the Ion Exchange Membrane Process
Based on Curlin, Bommaraju, and Hansson (1991).
140
The purified brine is then fed into the electrolyzer, which consists of cell, electrodes,
that is, anode and cathode, and ion exchange membrane. The anode and cathode are separated
by a cation-permeable ion exchange membrane, as is shown in Figure 4-2. Saturated brine
(NaCl) is first fed into the anode compartment. Chlorine ions (Cl-) are attracted to the anode
to form chlorine (Cl2):
2Cl- -> Cl2 + 2e-,
whereas sodium ions (Na+) migrate through the ion exchange membrane into the cathode
compartment. Depleted brine is discharged from the cell and, as in the mercury process, is
dechlorinated and recirculated. While hydraulic pressure prevents the reverse flow of
hydroxide ions (OH-) physically through the porous diaphragm in the case of the diaphragm
process, the ion exchange membrane allows only sodium ions to pass through in the direction
from the anode to the cathode and thus inhibits the reverse flow of hydroxide ions
electrochemically.
Water (H2O) is electrolyzed in the cathode compartment. Hydrogen (H2) is evolved at
the cathode by combining hydrogen ions (H+):
2H+ + 2e- -> H2.
Hydroxide ions, together with the permeating sodium ions, form sodium hydroxide (NaOH),
that is, caustic soda:
Na+ + OH- -> NaOH.
Strong caustic of about 33 % is produced either by controlling the water addition rate directly
to the catholyte or by recirculating caustic to which water has been added. To produce 50%
caustic soda, the caustic solution coming out of the cell needs to be concentrated by
evaporation. Caustic soda solution obtained by the ion exchange membrane process contains
few impurities, owing to the selective permeability of the ion exchange membrane, and the
chloride content in it is as low as that from the mercury process. Since the catholyte is a
strong caustic, however, there is some inevitable back-migration of hydroxide ions into the
anolyte, which results in a loss of current efficiency.
141

Anode (+) Cathode (-)
Chlorine (Cl2)
Saturated brine
(NaCl + H2O)
Electrolytic cell
Hydrogen (H2)
Caustic soda (NaOH) 33%
Ion exchange membrane
Sodium ions (Na+)
Chloride ions (Cl-)
Hydroxide ions (OH-)
Depleted brine
Water (H2O)
Figure 4-2 Ion Exchange Membrane Electrolyzer
Based on Curlin, Bommaraju, and Hansson (1991).
As you can see in examining the chemical reactions involved in the ion exchange
membrane process, the process’s most important advantages is that it poses no serious
environmental problems. In contrast to the mercury process, there are no chemical reactions
involving mercury (Hg) within the production process (see Figure 3-3 and Figure 3-4). Hence
the ion exchange membrane process avoids the serious environmental concern regarding the
mercury process while achieving the same level of high purity of caustic produced by the
mercury process. Without any pollutant included in the manufacturing process from the very
outset, the ion exchange membrane process is a prime example of the clean technology as
defined in Chapter 2. This is in sharp contrast to the end-of-pipe technology, which is aimed
at reducing emissions of pollutant, mercury for example, at the end of the production process
facilities.
As you would expect, the component which is critical to the well functioning of the ion
exchange membrane process is the ion exchange membrane. While the ion exchange
membrane determines the electrolytic cell performance, including the current efficiency and
cell voltage, and hence energy consumption, it also needs to have a sufficient strength to
withstand exposition to chlorine on one side and strong caustic on the other in the electrolytic
cell. Although the idea of the ion exchange membrane process for the production of chlorine
142
and caustic soda had been known for many years, earlier work failed as a result of non-
availability of suitable ion exchange membranes which could resist the very demanding
conditions within the chlor-alkali cell. A significant amount of research and development
efforts had been devoted to invent the ion exchange membranes suitable for the production of
chlorine and caustic soda.
Basically, ion exchange means the exchange of ions of the same charge between a
solution, which is normally aqueous, and a solid in contact with it (Dorfner, 1990). The
process occurs widely in nature, particularly in the absorption and retention of water-soluble
fertilizers by soils. For example, when a potassium salt is dissolved in water and applied to
soil, potassium ions (K+) are absorbed by the soil and sodium ions (Na+) and calcium ions
(Ca2+) are released from it. In this case, the soil is acting as an ion exchanger. Synthetic ion
exchange resins consist of various copolymers with a cross-linked three dimensional structure
to which ionic groups have been attached. An anionic resin has negative ions built into its
structure and hence exchanges positive ions whereas a cationic resin has positive ions built in
and exchanges negative ions. The ion exchange membrane is an ion exchange body in
membrane form and thus provides special functional characteristics which cannot be obtained
with ion exchange resins.
A report on ion exchange resins was published for the first time in 1935 by researchers
in the United Kingdom, and the first industrial production of ion exchange resins stared in
1938 at the Wolfen plant of IG Farben in Germany (Shimizu, 1992). In the United States,
Resinous Products and Chemical started its industrial production of ion exchange resins in
1940. Some experimental work on ion exchange membranes was done in the 1930s and 1940s,
but it was not yet possible to obtain ion exchange membranes to be applicable for industrial
purposes. In 1950, Juda and McRae reported the first successful development of ion exchange
membranes which had electrical resistance combined with adequate mechanical strength for
use on the industrial scale (Juda and McRae, 1950). With this report of the fabrication of
membranes from ion exchange bodies of synthetic resin, a period of technological progress of
ion exchange membranes started in the United States, Western Europe, and Japan. Research
efforts were devoted for the development and utilization of ion exchange membranes
composed of hydrocarbon polymers and their use for electrodialysis, a method of separating
water containing a salt into pure water and more concentrated solution.
In the United States and Western Europe, research activities were directed toward water
desalination. The companies and organizations which sought for the production and
143
utilization of ion exchange membranes for that purpose included Ionics in the U.S., Permutit
in the U.K., and T.N.O., the Dutch Organization for Applied Scientific Research (Kawate,
Tsuzura, and Shimizu, 1990). The Kennedy administration of the U.S. lent its support to
water conversion projects in its space programs, and research and development activities were
pursued vigorously with financial assistance from the Office of Saline Water. Since
electrodialysis inherently involves concentration, the problem of scale formation also
impeded progress at early stages in water desalination applications. This problem was solved
later by a technology developed by Ionics, leading to the widespread use of ion exchange
membranes for water desalination. American Machine and Foundry and General Electric also
manufactured ion exchange membranes in the early 1960s, when they were cooperating with
the National Aeronautic and Space Agency (NASA) for developing fuel cells with ion
exchange membranes as barriers (McRae, 1974).
The possibility of using the ion exchange membrane for chlor-alkali production had
been considered since a relatively early stage in the history of its development. A number of
companies, such as Hooker cooperating with Rohm and Haas, and Ionics with Diamond
Alkali, worked for developing the ion exchange membrane process for the chlor-alkali
production in the 1950s and 1960s (Currey and Ahern, 1974). Technologies developed in
these periods, however, were never put into commercial use, primarily because the available
ion exchange membranes, which were mostly based on hydrocarbons, did not have either
sufficient chemical stability or economic viability. Since the chemical structure of the plastic
materials was not inert to chlorine, hypochlorite, and caustic, the ion exchange membrane was
eroded or corroded after a relatively short period of use (see Figure 4-2). Its degradation
proceeded to the extent that it had to be replaced with a new one. The second problem was the
performance of the ion exchange membrane. While the ion exchange membrane was the key
to the cell’s performance with regard to voltage and current efficiency, good voltages could
be achieved only at the expense of low current efficiencies and visa versa. The marginal cell
power performance coupled with the membrane replacement problem was never fully
resolved initially, discouraging chlor-alkali producers to make further development efforts on
the ion exchange membrane process until the 1970s.
These long-standing problems started to be solved by the advent of the perfluorinated
ion exchange membrane, Nafion. Prior to the development of Nafion by Du Pont, the Plastic
Development Group of the company had already discovered Teflon, a form of
tetrafluoroethylene (TFE) polymer (Edwards, 1979). Looking for uses of this material, the
144
group started to do research on a new type of monomer with which to co-polymerize TFE and
succeeded in establishing a general method for synthesizing perfluorovinylether. The co-
polymerization of TFE and perfluorovinylether produced XR resins, a precursor to other
useful types of polymer invented later. Then, the Nafion membrane was invented at the
company’s experimental station in 1962 (Grot, 1986). This membrane possessed the heat and
chemical resistance necessary for use in such a harsh environment as in chlor-alkali
electrolyzers and, with functional groups of sulfonic acid, also provided low electric
resistance, although it exhibited low current efficiency. It was actually demonstrated in 1964
that these perfluorinated polymers in a film form could be used as a separator in chlor-alkali
cells (Brooks, 1988). Together with early applications of them for fuel cells, that led to a
broader recognition of the potential for these materials within the chlor-alkali industry.
Nevertheless, substantial technological progress had to be made in the following years
in order to achieve commercial applications of the membrane. While the perfluorinated films
had the desirable electrical and chemical properties, it was necessary to supplement the
physical properties with appropriate mechanical strength and handling characteristics to be
used in commercial chlor-alkali electrolytic cells. And, as the ion rejection properties of the
membranes had resulted in current efficiencies less than 90 %, one of the most difficult
problems to be solved was how to prevent the diffusion of hydroxyl ions (OH-) at a high
concentration of caustic soda (see Figure 4-2). On this aspect, several Japanese companies
later succeeded in making innovations and removed the obstacles along the way toward the
industrial application of the ion exchange membrane for use in chlor-alkali production. In the
subsequent sections, we will examine in detail how the Japanese companies conducted their
innovative activities for the development of the ion exchange membrane process in the chlor-
alkali industry.
4.4.2 Patents on Technologies for Chlor-Alkali Production
To investigate the extent of innovative activities conducted by the Japanese firms, we
analyzed data on patent applications on the ion exchange membrane process, along with those
on the mercury process and the diaphragm process. Figure 4-3 shows the trends in successful
applications for Japanese patents by Japanese firms from the late 1960s to the late 1980s.
(Detailed data are given in Table 4-23 in Appendix at the end of this chapter). Patent data on
technologies related to the mercury process were obtained from the data assembled by the
industry association (Japan Soda Industry Association, 1982). The data covers patents granted
145

up to the end of the 1970s. Patents on technologies related to the diaphragm process and the
ion exchange membrane process were selected by using the data set constructed by the
industry association and shared by its member companies (Japan Soda Industry Association,
1976, 1977, 1978a, 1978b, 1979b, 1991a, 1991b, 1992a, 1992b). The data set contains both
granted patents and unexamined patent applications which were published in the period until
1988.
We picked up only patent applications which were successfully granted, and those
selected patents are classified into three processes, that is, the mercury process, the diaphragm
process, and the ion exchange membrane process. They are arranged by the year of
application, rather than by the year of publication. As it normally takes 18 months before
patent applications are published, that is expected to make it possible for us to examine when
innovations were actually made. In the case of patents on the mercury process, information on
the date of patent application is not included in the data. As it took at least two years for
patents to be granted after their application, we here assumed a two-year lag between patent
application and granting.
146

0
10
20
30
40
50
60
70
80
90
100
1965 1970 1975 1980 1985 1990
Year of Patent Application
Num
ber o
f Pat
ents Mercury Process
Diaphragm Process
Ion ExchangeMembrane Process
Figure 4-3 Japanese Patents Successfully Applied for by Japan Companies on the Mercury, Diaphragm, and Ion Exchange Membrane Processes
As you can see in Figure 4-3, most of the patents granted in the late 1960s were related
to the mercury process. The number of successful patents on the mercury process rose at the
beginning of the 1970s, as the general public’s concern on mercury pollution increased. It
then decreased subsequently, coinciding with the government decision that the mercury-based
plants in the Japanese chlor-alkali industry were to be phased out rather immediately. On the
other hand, patents successfully applied on technologies related to the diaphragm process
were few in the later 1960s and the early 1970s. They increased to some extent in the middle
of the 1970s, as patent applications on the mercury process declined. Then, successful patent
applications on the diaphragm process started to drop in the late 1970s, and it had almost
stopped by the middle of the 1980s.
Regarding the ion exchange membrane process, although several patent applications
were already seen in the late 1960s, most of the patents granted were on ion exchange
147

membranes based on hydrocarbon polymers (e.g. Japanese Patent Publication No. 47-40860,
No. 49-28351). As salt had been traditionally produced at salt fields by using the solar power,
this type of ion exchange membranes was developed for the purpose of replacing solar
evaporation as the method of producing salt from sea water. Hydrocarbon-based ion exchange
membranes, however, could not maintain its chemical stability in a strong alkaline
environment, and the application of ion exchange membranes for use in chlor-alkali
electrolytic cells had been very limited. In the early 1970s, at the time of the government’s
decision to phase out the mercury process in Japan, applications for patents on ion exchange
membranes started to rise rapidly. After a patent application was filed on a new type of ion
exchange membranes based on fluorocarbon polymers (Japanese Patent Publication No. 52-
13228), on which there had been only one patent application before (Japanese Patent
Publication No. 36-20742), other patent applications continued for this type of ion exchange
membranes (Japanese Patent Publication No. 57-3699, No. 54-20960). Then successful patent
applications on the ion exchange membrane process increased rapidly in the middle of the
1970s and remained large in the 1980s, while there were few patent applications of the
mercury process and the diaphragm process in the 1980s.
In Section 3.3, we identified the Japanese firms which were innovative on the mercury
process, namely, Mitsui Engineering and Shipbuilding (MES) 63 , Osaka Soda, Kureha
Chemical Industry, Asahi Glass, Toyo Soda, Tokuyama Soda, and Asahi Chemical Industry,
and those companies which were innovative on the diaphragm process, namely, Nippon Soda,
Tsurumi Soda, and Showa Denko (see Table 3-8, Table 3-9, and Table 3-18). We examine
how these companies, which had strong expertise on the technologies for chlor-alkali
production in the past, pursued their innovative activities on the production processes without
the use of mercury, when they faced the government’s decision to abolish the mercury
process in the early 1970s.
We first look at the patenting activities of these companies for clean technologies for
chlor-alkali production, that is, the diaphragm process and the ion exchange membrane
process. Table 4-9 and Table 4-10 show the trends on Japanese patents successfully applied
by these innovative companies, that is, Asahi Chemical Industry, Asahi Glass, Tokuyama
63 Mitsui Engineering and Shipbuilding established an engineering company, Chlorine Engineers Corp. (CEC), with Mitsui in 1973 (Chlorine Engineers Corp., 1998). Since then, the new company has provided technologies and related services for the replacement of chlor-alkali plants based on the mercury process.
148

Soda, and CEC, on technologies related to the diaphragm process and those related to the ion
exchange membrane process, respectively.
Table 4-9 Japanese Patents Successfully Applied by Japanese Companies on the Diaphragm Process and the Ion Exchange Membrane Process (I)
Asahi Chemical Asahi Glass Tokuyama Soda CECb Yeara D IM D IM D IM D IM
1968 0 0 0 1 0 0 0 0 1969 0 3 0 1 0 3 0 0 1970 1 2 0 1 1 0 0 0 1971 0 0 0 0 0 2 0 0 1972 4 0 0 0 1 8 0 0 1973 0 2 0 0 3 13 0 0 1974 1 8 0 1 2 4 0 0 1975 1 5 2 13 1 14 1 0 1976 1 6 3 12 8 20 0 9 1977 2 6 2 10 2 23 2 6 1978 0 6 2 6 1 20 2 6 1979 0 10 0 15 0 7 3 9 1980 0 15 3 51 1 2 0 11 1981 1 2 0 30 0 17 1 13 1982 0 1 0 4 0 5 0 9 1983 0 1 0 2 0 1 0 18 1984 0 0 0 7 0 3 1 4 1985 0 1 0 4 0 1 0 1 1986 0 0 0 6 0 5 0 1 1987 0 2 0 5 0 0 0 0 Total 88 560 96 1352 160 1184 0 0 a: Year of patent applications. b: Data of CEC includes that of Toyo Soda.
Table 4-10 Japanese Patents Successfully Applied by Japanese Companies on the Diaphragm Process and the Ion Exchange Membrane Process (II)
Kureha Chemical
Osaka Soda Nippon Soda
Tsurumi Soda
Showa Denko
Yeara
D IM D IM D IM D IM D IM 1968 0 0 0 0 0 0 0 0 1 0 1969 0 0 0 0 0 0 0 0 0 0 1970 0 0 0 0 2 0 0 0 1 0 1971 0 0 0 0 1 0 0 0 1 0 1972 1 0 0 0 1 0 0 0 0 0 1973 2 0 2 0 2 0 0 0 0 0 1974 8 7 2 0 0 0 1 0 0 0
149

1975 3 9 1 2 1 0 0 0 0 0 1976 1 0 0 0 1 0 0 0 0 1 1977 1 1 2 2 1 0 0 0 1 0 1978 0 3 0 0 0 0 0 0 2 0 1979 0 0 1 0 1 0 0 0 1 0 1980 0 0 2 0 0 0 0 0 0 4 1981 0 0 1 0 0 0 0 0 1 2 1982 0 0 1 0 0 0 0 0 0 0 1983 0 0 0 1 0 0 0 0 0 0 1984 0 0 0 0 0 0 0 0 0 3 1985 0 0 0 1 0 0 0 0 0 1 1986 0 0 0 0 0 0 0 0 0 0 1987 0 0 0 0 0 0 0 0 0 0 Total 0 0 0 0 0 0 2 0 12 12 a: Year of patent applications.
These tables suggest that Asahi Chemical Industry, Asahi Glass, and Tokuyama Soda
had been doing research on technologies related to ion exchange membranes since the late
1960s, although the level of successful patent applications was low. Detailed analysis of the
patent data shows that these ion exchange membranes mostly belonged to the hydrocarbon
type, which was basically intended for use in the salt production process. Then, in the early
1970s, the three companies started to be actively engaged in applying much more for patents
on the ion exchange membrane process for chlor-alkali production. A little later, Chemical
Engineers Corp. (CEC), cooperating with Toyo Soda, followed them in the middle of the
1970s. These intensive R&D activities later led to their success in developing their own
technologies for the ion exchange membrane process and subsequently provided these
technologies to other chlor-alkali producers.
On the other hand, Kureha Chemical Industry and Osaka Soda, which had also been
innovative companies on the mercury process in the past, did not have any successful patent
applications on the ion exchange membrane process until the beginning of the 1970s. While
they were granted patents for their technologies related to the diaphragm process in the 1970s,
their successful patent applications for the ion exchange membrane process technologies
remained relatively few in the 1970s and the 1980s, compared with Asahi Chemical Industry,
Asahi Glass, and Tokuyama Soda. Similarly, the three companies which had previously
developed their own technologies for the diaphragm process, namely, Nippon Soda, Showa
Denko, and Tsurumi Soda, successfully applied for patents on the diaphragm process in the
150

1970s. Their patent applications on the ion exchange membrane process, however, were few,
and were not comparable to those made by Asahi Chemical Industry, Asahi Glass, or
Tokuyama Soda.
4.4.3 Technological Developments of the Ion Exchange Membrane Process by
Innovative Companies in Japan
As we have seen in the preceding section, Asahi Chemical Industry, Asahi Glass, Tokuyama
Soda, and CEC were actively engaged in R&D activities on the ion exchange membrane
process. In the present section, we examine in detail how these companies conducted R&D
activities for chlor-alkali production and subsequently succeeded in developing their own
technologies for the ion exchange membrane process.
Asahi Chemical Industry
Among the Japanese firms which were innovative on chlor-alkali production technologies,
Asahi Chemical Industry64 was the first to reach the industrial stage of the ion exchange
membrane process. Since 1950, the company had already working on an R&D program on
ion exchange membranes based on hydrocarbon to be used for various types of separating
operation in chemical processes. In 1961, after ten years of R&D activities on ion exchange
membranes, the first plant started to operate at Kawasaki for the manufacture of its ion
exchange membranes, Aciplex. At the same time, the company began the commercial
production of salt by electrodialysis with these membranes at Onahama. The plant, with a
capacity of 50,000 tonnes per year, which was expanded later to 190,000 tonnes per year,
represented the first commercial application of ion exchange membranes in the world. This
eventually led to increasing the range of applications of ion exchange membranes in other
industrial areas, including the desalination of brine by electrodialysis and the electroreduction
of uranium. In 1971 Asahi Chemical succeeded in commercializing the synthesis of
adiponitrile, an intermediate to nylon 6/6, at the Nobeoka plant (25,000 tonnes/year) through
the electrolytic dimerization of acrylonitrile by using ion exchange membranes. The
electrolytic cells adopted in this process turned out later to be the prototype of electrolyzers
64 This section is based on the information obtained through the author’s interview with Mr. Hiroshi Oh-hama, Mr. Masao Hamada, and Mr. Mitsuo Yoshida of Asahi Chemical Industry (Oh-hama, Hamada, and Yoshida, 1998).
151

for the chlor-alkali production. This development helped the company to recognize the ion
exchange membrane as a promising technology in the future.
These previous experiences of working on ion exchange membranes have functioned as
the basis for the subsequent technological development of the ion exchange membrane
process for chlor-alkali production. In 1967 Asahi Chemical started R&D activities on the ion
exchange membrane process of brine electrolysis for chlor-alkali production, with bench-
scale facilities constructed at the Nobeoka site. Engineers found that the knowledge and
expertise gained through developing other electrochemical processes in the past, including the
manufacture of salt, adiponitrile, and other materials, were often useful in dealing with
practical problems in this development work. Although initial research efforts were directed
toward the development of a three-compartment method using hydrocarbon-based ion
exchange membranes, they were later concentrated on the development of a two-compartment
method using ion exchange membranes of the perfluorosulfonic acid type.
In May 1973 a pilot plant started to operate at an annual capacity of 4,000 tonnes,
utilizing Nafion membranes, the only type of ion exchange membranes based on
perfluorosulfonic acid which were available for large-scale applications at that time. The
operation of the plant generated some data, which suggested that, as a production process for
high-quality caustic soda, chlorine and hydrogen, the ion exchange membrane process would
surpass the diaphragm process and become comparable to the mercury process. Intensive
discussions within the company were followed by the formation of a large organization,
together with a basic strategy for the ion exchange membrane technology. It was almost at the
same time that the newspapers reported the case of the third Minamata disease, leading to the
government’s decision to phase out all the mercury processes used for the chlor-alkali
production.
The company’s chlor-alkali plant in Nobeoka was originally built in 1933 to supply
caustic soda and chlorine for the manufacturing of other products, notably, rayon at the
production site. The plant was based on the mercury process, and its production capacity had
grown to approximately 100,000 tons of caustic soda per year by the time that the official
process conversion program was mandated. Initially, it was planned that the mercury plant
would be converted to the diaphragm process with separators made of asbestos. However,
since the diaphragm process was found to produce caustic soda which contained various
impurities, including, among others, 1 % of salt, it was not an appropriate process for
providing caustic soda to be used in the production of rayon, which was one of the company’s
152
main products at that time. The necessity of high-quality caustic soda required a change in the
original conversion plan, and in 1974 the company made a decision to adopt the ion exchange
membrane process for the plant, although that technology was still in its infancy and was not
yet established for industrial applications. With this decision, Asahi Chemical was exempted
from the mandate for immediate conversion of the mercury process to the diaphragm process
and was allowed some time for technological development of the ion exchange membrane
process.
At that time, the perfluorosulfonic acid membrane Nafion, which was developed in the
1960s, was the only type of ion exchange membranes applicable to the chlor-alkali cell
because it did not contain any C-H bond. However, ion exchange membranes having sulfonic
acid exchange groups did not have high current efficiency in strong concentrations of caustic
soda due to the counter migration of OH- ions from catholyte to anolyte. By the time when the
decision was made to convert the mercury plant, the company, with the idea that a higher
current efficiency could be achieved if the ion exchange membrane contains
perfluorocarboxylic acid functional groups, had initiated R&D on this type of ion exchange
membranes.
In 1975, with an annual production capacity of 40,000 tonnes, a new plant with the use
of ion exchange membranes came on stream at the Nobeoka site. It was the first commercial-
scale plant relying on the ion exchange membrane process in the world. Since the
performance of the company’s own ion exchange membranes was not yet sufficient for
industrial applications, the Nafion membranes were adopted for the plant at the beginning.
The electric power consumption of the new process was 3,520 kWh/t NaOH, whereas that of
the mercury process was approximately 3,200 kWh/t NaOH. In addition, since the
concentration of the caustic soda was low, steam was necessary to increase it to the
commercial level of 50 %, raising the total energy consumption to 3,925 kWh/t NaOH. This
relatively low performance, coupled with the low current efficiency of 80 %, prompted the
company to focus its research efforts to improve the quality of ion exchange membranes.
A result of the intensive R&D was the invention of ion exchange membranes based on
perfluorocarboxylic acid. The production of this type of ion exchange membranes was made
possible by chemically modifying one side of sulfonic acid membranes to obtain a region of
carboxylic acid groups. Contributing to achieving a higher current efficiency of more than
95% without increasing the electrical resistance, this development proved to be one of the
technological breakthroughs in establishing the ion exchange membrane process as an
153

industrially viable technology for chlor-alkali production. The Nafion membranes based on
perfluorosulfonic acid which were adopted at the beginning of the plant operation were all
replaced by the newly developed membranes in 1976. As a result, the electric power
consumption was reduced to 2,700 kWh/t NaOH. The initial production capacity of the
Nobeoka plant was doubled to 80,000 tons in August 1977 and was further increased to
120,000 tons in March 1982, when the last of the mercury electrolyzers was shut down at the
Nobeoka site.
Table 4-11 gives the chronology of technological developments related to the ion
exchange membrane process at Asahi Chemical Industry.
Table 4-11 Chronology of Technological Developments Related to the Ion Exchange Membrane Process at Asahi Chemical Industry
Year Technological Development 1967 Start of R&D on the ion exchange membrane process of brine electrolysis for chlor-
alkali production with bench-scale facilities 1973 Pilot plant for brine electrolysis with Nafion membranes based on fluorosulfonic
acid 1974 Decision to convert the mercury process at the Nobeoka site to the ion exchange
membrane process Start of R&D on ion exchange membranes based on fluorocarbonic acid
1975 First commercial chlor-alkali plant with Nafion membranes at the Nobeoka site Bench-scale facilities for the production of ion exchange membranes based on fluorocarbonic acid
1976 Replacement of Nafion membranes by Asahi Chemical’s membranes First license of Asahi Chemical’s ion exchange membrane process to an outside firm
1977 Expansion of the ion exchange membrane process at the Nobeoka site 1982 Expansion of the ion exchange membrane process at the Nobeoka site, eliminating
the mercury process
Innovative efforts were conducted intensively for the development of the ion exchange
membrane process. Figure 4-4 gives the trends in the R&D expenditures and personnel which
Asahi Chemical Industry devoted for innovation on the ion exchange membrane process. The
absolute figures of the expenditures as well as personnel in 1975 are normalized to 100.
154

Figure 4-4 R&D Expenditures and Personnel for the Ion Exchange Membrane Process at Asahi Chemical Industry
Source: Asahi Chemical Industry.
In the period from 1973 to 1997, R&D expenditures amounted to 13 billion yen at the ion
exchange membrane process division and to three billion yen at the headquarters, with
roughly one half spent on personnel and the other half on actual research activities. During
this period the annual R&D expenditures fluctuated between 400 million yen and one billion
yen. In the first five years three billion yen was spent on R&D by the corporate headquarters.
As the headquarters is normally responsible for conducting R&D projects whose outcomes
are perceived to be highly uncertain, that suggests that the development of the ion exchange
membrane process for chlor-alkali production was regarded by the company as a risky project.
Following the initial period in which R&D activities were conducted at the corporate as well
as the division levels in parallel, the main responsibility for the project was shifted to the ion
exchange membrane process division. The number of the personnel involved in this
technological development varied from the minimum of 50 to the maximum of 250. The R&D
expenditures and personnel, with small declines at the beginning of the 1980s, continued to
increase until the middle of the 1980s, when the government’s process conversion program
was completed, and then decreased steadily. Recently they have started to rise again, as the
company, having finished providing its ion exchange membrane process technology to other
Personnel —●— Expenditures --■--1975: 100
Year
155

chlor-alkali producers based in Japan, is now trying to increase the business of supplying its
technology to chlor-alkali producers in other parts of the world.
The effects of the rapid increase in R&D activities in the middle of the 1970s can be
seen in some measures of innovation outputs. Table 4-9 shows the trends in successful patent
applications by Asahi Chemical Industry on technologies related to the ion exchange
membrane process. A small number of patents were applied on ion exchange membranes in
the late 1960s, as the company was engaged in producing as well as using ion exchange
membranes for salt production. These membranes were based on hydrocarbons, however, and
were not suitable for use in chlor-alkali production. In the early 1970s, immediately after the
government’s decision on the phase out of the mercury process, patent applications on the ion
exchange membrane process began to pick up quickly. They had a peak at the beginning of
the 1980s and were then followed by a rather rapid decrease. In this period, there were several
patents granted on technologies which were crucial for the successful application of the ion
exchange membrane process for chlor-alkali production. Among notable examples were the
invention of a bumpy surface on the ion exchange membrane and the invention of carbonate
membranes with three layers.
Having developed its technology for the ion exchange membrane process and used it at
its own chlor-alkali production plant, Asahi Chemical Industry started to supply it to outside
companies. Chlor-alkali plants to which Asahi Chemical Industry provided its technology for
the ion exchange membrane process are listed in Table 4-27 in the appendix to the present
chapter. Encouraged by the government’s decision on the phase-out of the mercury process in
Japan in 1973, the company’s ion exchange membrane process was adopted by other chlor-
alkali producers in Japan. The first process which was installed in plants outside the company
was for Denki Kagaku Kogyo at Ohme, Tokyo, for a 60,000 tonne/year plant which started
operation in 1976. At that time the potential performance of the ion exchange membrane
process was not yet fully realized. While the Nafion ion exchange membranes were initially
adopted for the plant, they were subsequently replaced with the ion exchange membranes
developed by Asahi Chemical Industry in 1978. The completion and startup of a chlor-alkali
plant in 1982 at Akzo Zout Chemie (currently Akzo Nobel) in the Netherlands was based on
the technology provided by Asahi Chemical and was the first large-scale ion exchange
membrane process adopted in Western Europe. The total capacity of the chlor-alkali plants
based on the ion exchange membrane technology of Asahi Chemical Industry is currently
about 4.8 million tonnes out of about 16.7 million tonnes all over the world. The company is
156

also supplying its ion exchange membranes to other companies and has so far provided about
6 million tonnes of them in the world.
Asahi Glass
Asahi Glass65 was established in 1907 as the first company to begin the production of sheet
glass in Japan. The chemical division started operations in 1917 with the production of soda
ash, which was used for its own manufacturing of sheet glass. Subsequently, the company
expanded its business activities to include various alkalis and chlorine derivatives. In 1963 the
company moved into the field of fluorine chemistry with the production of
chlorofluoromethane refrigerants, solvents, and urethane-forming agents. This was followed
by the introduction of a series of new products, including an ethylene-TFE copolymer and a
fluorinated rubber.
In the meantime, the company started R&D activities in 1952 on ion exchange
membranes for desalination and concentration of sea water as well as on electrodialytic cell
technology. In 1960 Asahi Glass began to produce its ion exchange membrane, Selemion, at
the industrial level for the first time in Japan, and subsequently the company’s plant for salt
production utilizing ion exchange membranes started to operate. In 1964 the company started
to produce chlorine and caustic soda by brine electrolysis, changed from the traditional
chemical processes. Hence the company had technical experiences on fluorine chemistry and
sea water dialysis with ion exchange membranes and chlor-alkali production, prior to
developing its own technology for the ion exchange membrane process of brine electrolysis.
In May 1973, amid the widespread public concern over mercury pollution triggered by
the newspaper articles, the company started to conduct R&D activities aimed at developing a
new process using ion exchange membranes for the chlor-alkali production. A project team
was established at the central research center, along with the chemical division and its R&D
department. The deadline of September 1975, which was initially set by the government for
the conversion of the mercury process, however, allowed too short a time for sufficient
technological development of the ion exchange membrane process for industrial applications,
and consequently Asahi Glass introduced the diaphragm process from Diamond Shamrock to
its Kitakyushu plant in 1974 and from PPG to its Kashima plant in 1975 (see Table 4-4).
65 This section is based on the information obtained through the author’s interview with Mr. Kimihiko Sato of Asahi Glass (Sato, 1998). The company has no organizational or financial relationship with Asahi Chemical Industry. Asahi literally means the rising sun and is used for many corporate names in Japan.
157

Then, in 1975, the company succeeded in developing the perfluorocarboxylate
membrane, Flemion, which made it possible to produce strong caustic solution with high
current efficiency. A pilot plant with a production capacity of 155 tonnes of caustic soda per
month started to operate at its Kansai plant in Osaka with the newly developed ion exchange
membranes. During the following two years, intensive R&D efforts were continued to
improve the Flemion membranes. The introduction of a carboxylic acid grouping to the side-
chains gave a high current efficiency, but with a relatively poor voltage, and was attacked by
the anolyte-side conditions. A technological compromise was that a laminated membrane was
produced with a thick layer of a sulfonic acid structure on the anolyte side to give low voltage
and physical integrity and a thin layer containing carboxylic structures on the catholyte side to
provide a good current efficiency. A demonstration plant with a production capacity of 269
tonnes of caustic soda per month was constructed in 1976. The first commercial chlor-alkali
plant based on ion exchange membranes started to operate at the Osaka site in 1978 with an
annual production capacity of 795 tonnes of caustic soda.
A further enhancement of the performance of ion exchange membranes was made by
adding surface coatings to promote the release of bubbles, which reduced thickness, and by
incorporating reinforcing meshes. In 1981 an improved type of the Flemion membrane was
developed, with a hydrophilic surface on non-conductive porous materials. This technological
invention made it possible for the first time to operate the so-called zero-gap electrolyzer, a
type of electrolyzer which has little space between the electrodes and the ion exchange
membrane, leading to a reduction in the electric current resistance. While the limit to the
minimum distance between the electrodes was previously 7 mm, because of the necessity to
remove gases, the zero-gap electrolyzer reduced the inter-electrode distance to virtually zero
and brought about a significant voltage reduction, resulting in a decrease in energy
consumption. Subsequently, a new electrolyzer system, AZEC, was commercialized in 1982
and began to be provided to other companies.
Table 4-12 summarizes the chronology of technological development related to the ion
exchange membrane process at Asahi Glass.
Table 4-12 Chronology of Technological Developments Related to the Ion Exchange Membrane Process at Asahi Glass
Year Technological Development 1973 Start of R&D on the ion exchange membranes process for chlor-alkali
production
158

1975 Development of a perfluorocarboxylate ion exchange membrane, Flemion Start-up of a pilot plant based on the ion exchange membrane process
1976 Start-up of a demonstration plant based on the ion exchange membrane process
1978
Start-up of a commercial plant based on the ion exchange membrane process at Osaka Start of the commercial production of the Flemion ion exchange membranes Development of a large filter press type cell with finite gap
1980 First supply of Asahi Glass’s ion exchange membrane process to an outside firm
1981 Development of the Flemion membranes with hydrophilic inorganic coating 1982 Development of the AZEC electrolyzer with zero gap and activated cathodes
The trends in the R&D personnel involved for the development of the ion exchange
membrane process at Asahi Glass are shown in Figure 4-566. The R&D project which was
initiated in 1973 conducted in such a large scale that about one third of the company’s
engineers who have expertise on chemical technology were engaged in this project at that
time. The central research center led the initial stage of the project, which was followed by
the chemical division’s attempts to industrialize the ion exchange membrane process. More
than 100 scientists and engineers continued to be engaged until the new technology for the
ion exchange membrane process was fully established.
66 Since the scale of the vertical axis has not been disclosed for this figure, it is not possible to discuss the trends in detail. Nevertheless, we can see at least that R&D activities increased from 1973 to 1976, initially at the central research center and subsequently at the division.
159
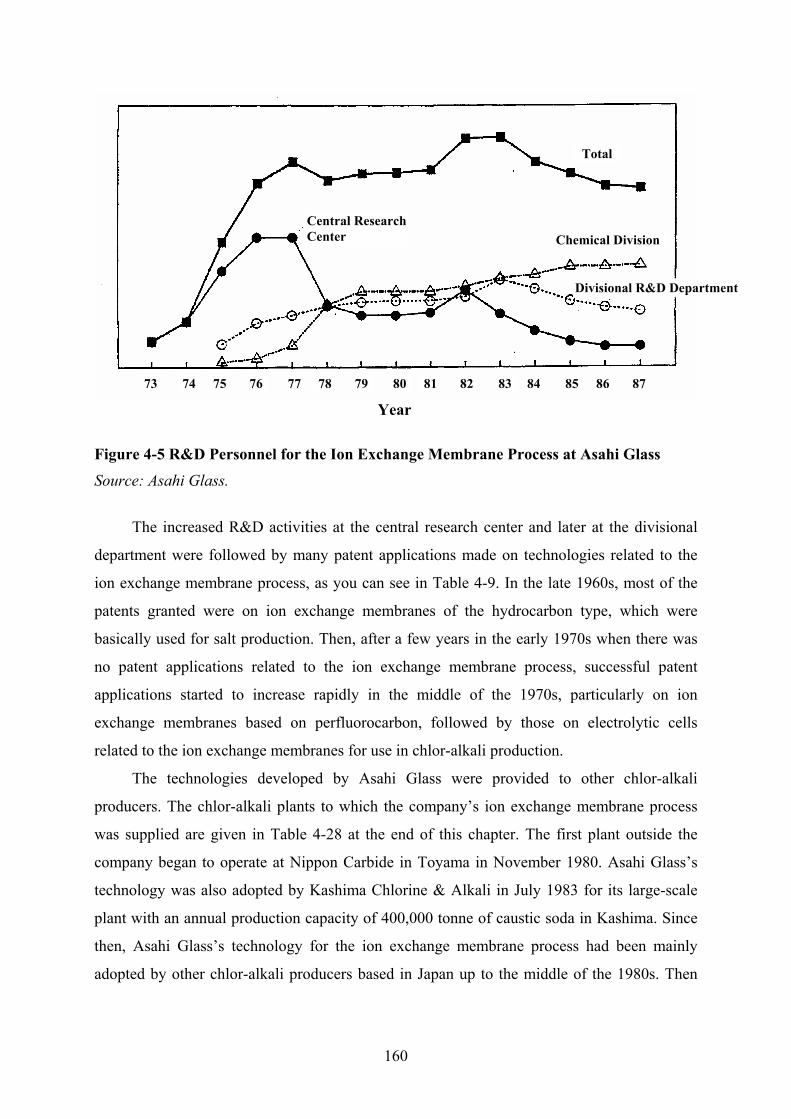
Figure 4-5 R&D Personnel for the Ion Exchange Membrane Process at Asahi Glass
Source: Asahi Glass.
The increased R&D activities at the central research center and later at the divisional
department were followed by many patent applications made on technologies related to the
ion exchange membrane process, as you can see in Table 4-9. In the late 1960s, most of the
patents granted were on ion exchange membranes of the hydrocarbon type, which were
basically used for salt production. Then, after a few years in the early 1970s when there was
no patent applications related to the ion exchange membrane process, successful patent
applications started to increase rapidly in the middle of the 1970s, particularly on ion
exchange membranes based on perfluorocarbon, followed by those on electrolytic cells
related to the ion exchange membranes for use in chlor-alkali production.
The technologies developed by Asahi Glass were provided to other chlor-alkali
producers. The chlor-alkali plants to which the company’s ion exchange membrane process
was supplied are given in Table 4-28 at the end of this chapter. The first plant outside the
company began to operate at Nippon Carbide in Toyama in November 1980. Asahi Glass’s
technology was also adopted by Kashima Chlorine & Alkali in July 1983 for its large-scale
plant with an annual production capacity of 400,000 tonne of caustic soda in Kashima. Since
then, Asahi Glass’s technology for the ion exchange membrane process had been mainly
adopted by other chlor-alkali producers based in Japan up to the middle of the 1980s. Then
Total
Central Research Center Chemical Division
Divisional R&D Department
73 74 75 76 77 78 79 80 81 82 83 84 85 86 87
Year
160
recently it has been increasingly adopted for chlor-alkali plants overseas, particularly in other
Asian countries, and in total the company has supplied approximately 50 plants with its ion
exchange membrane process technology. The cumulative annual production capacities of
these plants have reached more than 3.7 million tonnes of caustic soda. As with any new
technology, the company faced many technical problems in the early stages of the commercial
operation of the ion exchange membrane process. Nonetheless, these problems were finally
solved, as the company could have a wide variety of learning experience and know-how in
cell operations and their conditions. In developing the ion exchange membrane process, it has
been crucial to gain practical experiences of operating commercial plants by closely
cooperating with the users of the company’s technology.
Tokuyama Soda
Tokuyama Soda67 started its corporate history in 1918, when the first ammonia-soda plant in
Japan was constructed by the company. The company had obtained experience and
knowledge about the mercury process since the first mercury-based plant was constructed in
1952. Tokuyama Soda was one of the largest producers and suppliers of caustic soda, chlorine
and other related products in Japan in the 1970s. As regards ion exchange membranes, the
company started R&D activities in 1950, mainly on electrodialysis for brine desalination and
salt production. The production of Tokuyama Soda’ ion exchange membrane, Neosepta,
started in 1963, and the company’ trial salt plant based on the ion exchange membrane began
to operate in 1965. The company subsequently had become one of the major suppliers in the
world of ion exchange membranes and related system technologies for electrodialysis. These
previous experience of working on the mercury process and technologies related to ion
exchange membranes used for salt production gave Tokuyama Soda useful expertise in later
developing the ion exchange membrane process for chlor-alkali production.
Tokuyama Soda began to undertake R&D on the ion exchange membrane process for
chlor-alkali production in 1972 by using ion exchange membranes of a hydrocarbon type. As
the ion exchange membrane containing perfluorinated sulfonic acid groups, Nafion, was
introduced to the market, a bench-scale plant with this type of ion exchange membranes was
set up in 1973. Subsequently, a semi-commercial plant was constructed in 1975 with a
production capacity of 1,500 tonnes of caustic soda per year. The technologies for the ion
161

exchange membrane process, however, had not been sufficiently developed by September
1975, the deadline set by the Japanese government for the conversion of the mercury process,
and the diaphragm process was introduced from Diamond Shamrock based in the United
States to its chlor-alkali plant in 1975 (see Table 4-4).
In the meantime, as the performance of the Nafion membranes originally used was not
satisfactory in the electrolysis of sodium chloride solution for chlor-alkali production, the
company later developed a type of ion exchange membranes which had a thin layer of
carboxylic acid groups on one of the surfaces of the membrane of perfluorinated sulfonic acid
groups. Following several years of intensive R&D activities on laboratory cells, pilot cells
and intermediate-size practical cells, a commercial plant based on the ion exchange
membrane process with a production capacity of 10,000 tonnes per year came into operation
in June 1977. This commercial plant was equipped with three electrolyzers, each containing
40 bipolar cells and ion exchange membranes based on a fluorocarbon resin which were
developed by the company, Neosepta.
Table 4-13 gives the chronology of technological developments related to the ion
exchange membrane process for chlor-alkali production at Tokuyama Soda.
Table 4-13 Chronology of Technological Developments Related to the Ion Exchange Membrane Process at Tokuyama Soda
Year Technological Development 1972 Start of R&D on the ion exchange membrane process with the hydrocarbon-type
ion exchange membranes 1973 Start-up of a bench-scale plant with the Nafion membranes 1974 Construction of a pilot plant with the Nafion membranes 1975 Construction of a semi-commercial plant with the Nafion membranes 1976 Long-run durability test of ion exchange membranes based on fluorocarbon resins
in small-sized laboratory cells 1977 Test run of a practical electrolyzer of the TSE-270 type
Construction of a commercial plant with the Nafion membranes Test run of Neosepta-F C-1000 membranes at the semi-commercial plant
1978 Start of commercial operation with the Neosepta-F C-1000 membranes Development of the Neosepta-F C-2000 membranes
1979 Start of commercial operation with the Neosepta-F C-2000 membranes Construction of a manufacturing plant for the Neosepta-F membranes
1981 First supply of the ion exchange membrane process to an outside firm
67 This section is based on the information obtained through the author’s interviews with Dr. Sata and Mr. Matsuura of Tokuyama Soda (Matsuura, 2002; Sata, 2002).
162

The trends in successful patent applications made by Tokuyama Soda are shown in
Table 4-9. At the end of the 1960s there were several patent applications made on ion
exchange membranes. They were basically based on hydrocarbons and hence were primarily
intended for use in the salt production process. Then, in the early 1970s, as R&D on the ion
exchange membrane process for chlor-alkali production was initiated, relevant patent
applications increased rapidly. The number of patents successfully applied on technologies
related to the ion exchange membrane process remained large until the late 1970s, and then
started to decline in the 1980s. By the late 1980s, there had been no new patent grated on the
ion exchange membrane process.
Tokuyama Soda’s technology for the ion exchange membrane process became available
for adoption by other chlor-alkali producers at the beginning of the 1980s as a package of ion
exchange membranes, electrolyzers, and associated facilities. Table 4-29 in the appendix to
this chapter shows the chlor-alkali plants to which Tokuyama Soda’s ion exchange membrane
process was installed. As you can see, the company’s ion exchange membrane process has
been adopted mainly by companies in other Asian countries. The first adoption of Tokuyama
Soda’s technology occurred in 1981 at a small plant of Kokuto Chemical based in South
Korea. It was followed by the adoption of the technology by a Taiwanese chlor-alkali
producer in 1982. After an interval of a few years, a chlor-alkali producer in Kuwait adopted
in Tokuyama Soda’s process technology in 1986, and the last adoption was made by a
Chinese chlor-alkali producer in 1987. Since then, however, the company has basically
stopped providing its ion exchange membrane process to other chlor-alkali producers68.
Chlorine Engineers Corp.
Chlorine Engineers Corp. (CEC)69 is an engineering company which was established in 1973
as a joint venture between Mitsui Corporation and Mitsui Engineering and Shipbuilding
(MES). MES had previously been one of the major suppliers of the mercury process to chlor-
alkali plants in Japan (see Table 3-18). The creation of CEC was to provide engineering and
related services for the conversion of mercury-based chlor-alkali plants, as was mandated by
the government decision on their phase out at that time. While Asahi Chemical, Asahi Glass,
68 Recently, the company has changed its corporate name to Tokuyama, removing Soda from the original name. That suggests that the company’s focus has shifted from the chlor-alkali business to other areas, while continuing the operation of its chlor-alkali production plant. 69 This section is based on the information obtained through the author’s interview with Dr. Kenzo Yamaguchi of Chlorine Engineers Corp. (Yamaguchi, 1999a).
163

and Tokuyama Soda has been producing chlor-alkali products, CEC has not been engaged in
chlor-alkali manufacture, but is a specialized engineering company supplying production
technologies to chlor-alkali producers.
The initial target of CEC’s technological development was on the diaphragm process.
When the government made the decision on the phase out of the mercury process in the early
1970s, the ion exchange membrane process for chlor-alkali production was still in its infancy,
and its technological performance was far inferior to that of the diaphragm process, which had
been well established at the industrial level. CEC hence expected that most of the chlor-alkali
producers would adopt the diaphragm process when converting mercury-based plants. Rather
than trying to develop its own technologies for the diaphragm process within the short period
of time limited by the regulatory schedule, the company chose to introduce necessary
technologies from outside. These technologies were supplied by foreign companies, namely,
the DS cell by Diamond Shamrock and the Glanor cell by PPG, both of which were based in
the United States. The chlor-alkali producers to which the diaphragm process was installed by
CEC are listed in Table 4-30. The first case of the adoption of CEC’s diaphragm process
technology was implemented by Asahi Glass in Kitakyushu in February 1974. By May 1977,
when the government decided to review the initial schedule of the conversion program, 18
chlor-alkali plants in Japan had adopted the diaphragm process supplied by CEC. The
production capacities of chlor-alkali plants based on the company’s diaphragm process had
reached almost 1.5 million tonnes of caustic soda per year, which accounted for more than
50 % of the total domestic capacity in the Japanese chlor-alkali industry at that time.
It was getting clear, however, that the ion exchange membrane process was emerging as
a new promising technology for chlor-alkali production, with its technical performance in a
process of rapid improvement. Thus the company also started to develop its own technologies
for the ion exchange membrane process. As major technological innovations had been already
made on ion exchange membranes by the first movers, including Asahi Chemical Industry,
Asahi Glass, and Tokuyama Soda, the focus of the company’s R&D activities was placed on
electrolytic cells, another major component of the ion exchange membrane process (see
Figure 4-2). The first program intended for commercial applications was the development of
the Chlorine Engineers’ Membrane Electrolyzer (CME). In the process of developing CME,
CEC maintained cooperation with Toa Gosei, the partner company for the development of
technologies for the mercury process in the past (see Table 3-8). A test cell of CME was
installed in 1975, during the first phase of the conversion program of mercury-based plants.
164

Two pilot cells were subsequently established in 1977. In 1980 the CEC’s first commercial
plant, with a production capacity of eight tonnes of caustic soda per day, was constructed in
Okinawa, Japan. It was a plant converted from the diaphragm process. In the same year,
another electrolytic cell was added to the pilot facilities, which was based on the carboxylic-
type Nafion membrane. Table 4-31 in the appendix to this chapter shows the chronology of
installations of the CME ion exchange membrane process to chlor-alkali plants.
In the meantime, chlor-alkali producers in Japan were severely hit by the rapid rise in
the energy price following the oil crisis in the late 1970s. In particular, those chlor-alkali
producers who had converted their plants from the mercury process to the diaphragm process
suffered most from the price hike. As the diaphragm process consumed more energy, hence
raising its production cost, there was a strong demand for replacing the diaphragm process.
An installation of the ion exchange membrane process, a new technology which consumed
less energy with a lower production cost, however, required a large amount of initial
investment, and it was difficult for the plant operators, who had already hit by the rise in the
energy cost, to implement process conversions again. Thus CEC tried to develop a new type
of electrolytic cells for the ion exchange membrane process which could be readily retrofitted
to the existing plants based on the diaphragm process. In 1980 CEC started to cooperate
closely with Mitsui Toatsu Chemical70 in conducting R&D activities on the Membrane Bag
Cell (MBC). While the CME technology was intended for use to replace mercury- or
diaphragm-based plants, the MBC technology was designed to be retrofit to the existing
plants using the diaphragm process. In the MBC process, ion exchange membranes formed
like a bag were mounted on the anode in place of the deposited asbestos diaphragm. The
anode assembly and the cathode can used in the existing diaphragm cells could be utilized
with only minor adjustments, thus making the cost of process conversion significantly smaller
than that necessary for complete replacement.
The development of MBC was completed in 1981, and the first MBC-type electrolyzer,
with the Nafion membranes installed, began to operate at Mitsui Toatsu Chemical’s Nagoya
plant in 1982. Table 4-32 in the appendix to the present chapter gives the supply record of the
MBC process to chlor-alkali producers by CEC. Most of the retrofittings of the ion exchange
membrane process to the existing plants based on the diaphragm process were carried out in
the period from 1982 to 1984, just before the completion of the second phase of the
165

conversion program mandated by the government. While the electric power consumption of
the retrofit ion exchange membrane process was higher than that of a newly installed process,
the initial investment required for retrofitting was set by the company to be less expensive.
Almost 90 % of the DS diaphragm electrolytic cells which had been installed by CEC during
the first phase of the process conversion program turned out to be converted again to the
retrofit ion exchange membrane process. In 1988, just after mercury-based plants finished
process conversion completely, the retrofit-type technology accounted for 29 % of all of the
ion exchange membrane process installed in the Japanese chlor-alkali industry.
As the technical performance of the ion exchange membrane process continued to
improve further, however, these retrofit cells were to be eventually replaced with ion
exchange membrane cells which were designed for new installations. Then, in 1991, CEC
started to develop a new type of membrane electrolyzer, jointly working with Tosoh, formerly
known as Toyo Soda71, one of the largest chlor-alkali producers in Japan. Following the stage
of establishing pilot plants, the development of the BiTAC (an abbreviation of Bipole of
Tosoh and CEC) process reached at the industrial level in 1993. As Table 4-33 in the
appendix to this chapter shows the supply list of the BiTAC process since then, CEC has
provided the BiTAC technology to chlor-alkali plants in other countries as well as to Tosoh’s
plants. The chronology of technological developments related to the ion exchange membrane
process at CEC is given in Table 4-14.
Table 4-14 Chronology of Technological Developments Related to the Ion Exchange Membrane Process at CEC
Year Technological Development 1975 Start of R&D on the ion exchange membrane process with installation of a test
electrolytic cell 1977 Construction of a pilot plant based on the ion exchange membrane process CME 1980 Construction of the first commercial plant based on the ion exchange membrane
process CME Test of large-size cells with the Nafion membrane
1981 Development of the retrofit ion exchange membrane process MBC 1982 First installation of the retrofit ion exchange membrane process MBC 1984 Application of the ion exchange membrane technology CME for commercial
conversion projects 1993 Development of the ion exchange membrane process BiTAC
70 Mitsui Toatsu Chemical merged with Mitsui Petrochemical in 1997 to create Mitsui Chemical (Mitsubishi Chemical, 2001).
166

In developing technologies for the ion exchange membrane process, CEC cooperated
with several chlor-alkali producers, including Toa Gosei for CME, Mitsui Toatsu Chemical
for MBC, and Tosoh for BiTAC. That was particularly important, because CEC, as an
engineering company specializing in providing technologies and related services to chlor-
alkali manufacturers without engaging itself in manufacturing, needed detailed information on
the actual use of its membrane process technologies for further improvement. This is in
contrast with the cases of technological development by Asahi Chemical Industry, Asahi
Glass, and Tokuyama Soda, all of which have been chlor-alkali producers with their own
technologies and thus could utilize their own experiences of using them.
Kureha Chemical Industry
Following the Japanese government’s decision made in 1973 to abolish all the chlor-alkali
plants employing the mercury process, Kureha Chemical Industry instigated a program to
develop an electrolytic cell for the diaphragm process to take the place of the mercury cells
used by the company at that time (Shibata, Kokubu, and Okazaki, 1977). In April 1976, the
company’s electrolytic cells based on the mercury process were abolished. At the same time
the company developed a new type of electrolytic cells designed for use in the diaphragm
process, the SK diaphragm cells, and the commercial production using them was initiated.
One of the primary aims in the development of this type of diaphragm cells was to utilize the
existing facilities, including buildings and rectifiers, busbars, and cranes, as much as possible,
so as to restrict the investment required for the process conversion.
On the other hand, Kureha Chemical Industry did not develop any technology which
could be utilized at the industrial level for the ion exchange membrane process. As we can see
in Table 4-10, in the early 1970s, the company’s patent applications were targeted on
technologies related to the diaphragm process, and then patent applications started to be made
on technologies for the ion exchange membrane process in the middle of the 1970s. The
number of successful patent applications on the ion exchange membrane process was almost
the same as those on the diaphragm process in the end. However, while the research activities
on the diaphragm process led to the industrialization of the SK diaphragm cell, the company
introduced technologies for the ion exchange membrane process from an outside company,
namely, Asahi Chemical Industry, in 1985.
71 Toyo Soda was renamed to Tosoh in 1987 (Tosoh, 2001).
167
Osaka Soda
As we have seen in 3.3.1, Osaka Soda was one of the pioneering companies in Japan in the
development of the mercury process. Just after the end of the Second World War, the
technology provided by the company accounted for more than half of the production
capacities based on the mercury process in Japan (see Table 3-16). By the beginning of the
1970s, the company had come to rank third, following De Nora and MES, in supplying the
mercury process to Japanese chlor-alkali plant operators.
Following the government decision on the phase out of the mercury process in the
1970s, however, the company had to use clean technologies without relying mercury for
chlor-alkali production. As Table 4-10 suggests, while the number of successful patent
applications on the diaphragm process was at the equal level as that of other innovative
companies in Japan, there were only much fewer patent applications which were granted on
the ion exchange membrane process, suggesting the company’s R&D efforts had been mainly
directed to the diaphragm process. Eventually, this company did not develop technologies by
itself either for the diaphragm process or the ion exchange membrane process. Instead, the
diaphragm process was introduced from two U.S. companies, namely, Diamond Shamrock
and Hooker, and the ion exchange membrane process was supplied by CEC.
Nippon Soda
Nippon Soda was established in 1920, and its chlor-alkali production was started with the
Nakano-type electrolytic cell of the diaphragm process, which was originally developed by
the corporate founder, NAKANO Yurei, at the Nihongi site (Nippon Soda, 2001). Although
the Nakano cells ceased to operate after the Second World War, the company made further
improvements in the electrolytic cell. Subsequently, the company developed the B cells and
the BM cells equipped with metal anodes and expanded their production capacities. Table
4-10 suggests that Nippon soda continued to make R&D activities on the diaphragm process
throughout the 1970s. The company’s enlarged electrolytic cell was later adopted by Chiba
Chlorine Chemical in 1975 (Japan Soda Industry Association, 1982). On the other hand, the
company did not make any significant innovations on the ion exchange membrane process, as
suggested by no successful patent applications seen in Table 4-10.
168

Showa Denko
Showa Denko started its electrolytic production of caustic soda in 1935 with the diaphragm
process using horizontal diaphragm cells (Takeshita, 1990). Later, the mercury process was
added to the company’s production facilities. With the advent of a dimensionally stable
electrode in the 1960s, the company started to develop a type of vertical diaphragm cells, the
SD cell. Its commercial operation was initiated in 1969, and the production capacity of the
diaphragm plant with it was expanded subsequently. Following the government’s decision the
phase out of the mercury process in the early 1970s, the operation of the mercury plant was
discontinued in 1975. And at the same time the company made an agreement with Hitachi
Engineering and Shipbuilding to promote the development of the company’s diaphragm
process technology and its sales to other chlor-alkali producers (Nikkei Sangyo Shinbun,
1976). The result, however, was that Showa Denko’s technology was adopted by only one
company, Kanto Denka Kogyo, which introduced it to the Mizushima plant in 1975 (Kanto
Denka Kogyo, 1998). Table 4-10 suggests that, after having been engaged in developing
technologies for the diaphragm process in the late 1960s and the 1970s, the company started
to make R&D activities on the ion exchange membrane process in the 1980s. These efforts to
innovate on the ion exchange membrane process did not result in a successful development of
technologies for industrial uses.
Tsurumi Soda
Tsurumi Soda started to produce chlor-alkali products in 1934 with the diaphragm process
(Tsurumi Soda, 2001). The company was the only Japanese company which had never
adopted the mercury process for chlor-alkali production since its establishment. Thus the
company’s technological expertise was accumulated solely on the diaphragm process, and
that led to the development of the TSB cell and the TSBM cell, both of which have been
designed for use in the diaphragm process. Relying solely on the diaphragm process, Tsurumi
Soda did not face technological as well as financial difficulties when other chlor-alkali
producers had to cope with the issue of converting the existing plants based on the mercury
process in the 1970s. The company’s technology for the diaphragm process was also adopted
by Showa Enso in 1974 (Showa Chemical, 2001). On the other hand, the company did not
make innovations on the ion exchange membrane process, and the technology of Asahi Glass
was introduced to its chlor-alkali plant in 1982.
169

Comparison of the Innovative Companies in Japan
As we have discussed above, various types of technologies for chlor-alkali production were
developed by the innovative companies in Japan. Table 4-15 lists these technologies for the
mercury process, the diaphragm process, and the ion exchange membrane process.
Table 4-15 Technologies for Chlor-Alkali Production Developed by Innovative Companies in Japan
Ion Exchange Membrane Process Company Mercury Process Diaphragm Process Ion Exchange
Membrane Electrolytic Cell
Asahi Chemical Asahi Chemical - Aciplex Acilyzer Asahi Glass Rotation - Flemion Azec Tokuyama Soda Tokuso - Neosepta TSE CEC (MES) Mitsui (DS, Glanor) - CME, MBC, BiTACKureha Chemical HD SK - - Osaka Soda Daiso - - - Nippon Soda - BM - - Showa Denko - SD - - Tsurumi Soda - TSBM - -
By the early 1970s, when the government decided to abolish all the mercury-based
chlor-alkali plants, several technologies had been developed for the mercury process by
innovative companies in Japan. They include the Mitsui-Toa Gosei cell of Mitsui Engineering
and Shipbuilding (MES), which later established Chlorine Engineers Corp. (CEC), the HD
cell of Kureha Chemical Industry, the Daiso cell of Osaka Soda, the Rotation cell of Asahi
Glass, the Tokuso cell of Tokuyama Soda, and the Asahi Chemical cell of the Asahi Chemical
Industry.
Among these companies which had previous experiences of developing technologies
the mercury process, four companies, Asahi Chemical Industry, Asahi Glass, Tokuyama Soda,
and CEC, succeeded in making innovations on the ion exchange membrane process.
Technically speaking, the ion exchange membrane process basically consists of the ion
exchange membrane and the electrolytic cell, as we can see in Figure 4-2. Asahi Chemical
Industry, Asahi Glass, and Tokuyama Soda made innovations on both the ion exchange
membrane, developing the Aciplex, Flemion, and Neosepta membranes, respectively, and the
electrolytic cell for the ion exchange membrane process, that is, the Acilyzer, Azec, and TSE
processes, respectively. CEC initially introduced technologies for the diaphragm process,
namely, the DS cell and the Glanor cell, from foreign companies, whereas three types of the
170
electrolytic cell were developed later by the company for the ion exchange membrane process,
that is, the CME, MBC, and BiTAC processes.
There have not been major innovations on the ion exchange membrane process by the
other companies with expertise on the mercury process, that is, Kureha Chemical Industry and
Osaka Soda. While Kureha Chemical Industry industrialized its own electrolytic cell, the SK
cell, for the diaphragm process, the company did not develop technologies for the ion
exchange membrane process. Osaka Soda, once a leading innovator on the mercury process,
did not make any significant innovations on either the diaphragm process or the ion exchange
membrane process. Instead, the company introduced technologies from outside companies for
the diaphragm process as well as for the ion exchange membrane process, without making its
own innovations on either process.
On the other hand, Nippon Soda, Tsurumi Soda, and Showa Denko had already
developed technologies for the diaphragm process, the BM, TSBM, and SD cells, respectively,
by the early 1970s. Following the government’s decision to phase out the mercury process in
Japan, the companies increased their production capacity based on the diaphragm process
with their own technologies. Although there were several chlor-alkali producers who adopted
the technologies developed by these companies, these cases were relatively rare, as the
advanced technologies, that is, the DS and Glanor cells, were introduced from foreign
companies, mostly those based in the United States. Regarding the ion exchange membrane
process, these companies did not make any significant innovations which could be utilized for
industrial applications.
Asahi Chemical Industry, Asahi Glass, and Tokuyama Soda had previously experiences
of developing and utilizing ion exchange membranes for salt production. Unlike in Europe or
the United States, rainfall has been generally abundant in Japan, and water desalination has
not been given priority for the application of ion exchange membranes. On the other hand,
natural rock salt has not been available in Japan, and salt had to be produced in solar fields.
The traditional process of salt production was labor-intensive and constantly subject to
adverse weather, with little prospect of significant improvement (Shimizu, 1993). Hence the
three Japanese companies started to conduct R&D activities on ion exchange membranes for
the production of salt from sea water. In 1960 Asahi Glass began to produce its ion exchange
membrane, Selemion, at the industrial level for the first time in Japan, and at the same time
the company’s first plant for salt production utilizing ion exchange membranes started to
operate. The first trial of salt production with ion exchange membranes was immediately
171

followed by the other companies. In 1961 Asahi Chemical Industry initiated the manufacture
of its ion exchange membrane, Aciplex, and the production of salt based on the membrane.
The production of Tokuyama Soda’ membrane, Neosepta, began in 1963, and the company’
trial salt plant based on the ion exchange membrane started to operate in 1965.
The new method of salt production by using ion exchange membranes was efficient in
terms of space and cost, and the quality of the produced salt was sufficiently high as to be
used for food (Hanafusa, 1998). Accordingly, the salt production process with the use of ion
exchange membranes was diffused rather quickly in the salt industry in Japan. As Table 4-16
gives the start-up years of salt production based on the ion exchange membrane, all of the salt
producers in Japan, namely, Shin-Nihon Chemical Industry72 , Ako Sea Water Chemical
Industry73, Kinkai Salt Manufacturing, Naikai Salt Industries, Naruto Salt Manufacturing,
Sanuki Salt Industry, and Sakito Salt74, eventually introduced ion exchange membranes for
salt production. The ion exchange membranes used by these salt producers were supplied by
three companies, namely, Asahi Chemical, Asahi Glass, and Tokuyama Soda. By 1972, the
traditional process had been completely replaced with the process with the ion exchange
membrane for the production of salt applied for food in Japan (Japan Salt Industry
Association, 2001).
As salt had been traditionally produced at salt fields by using the solar power,
technological developments of the ion exchange membrane were conducted for the purpose of
replacing solar evaporation as the method of producing salt from sea water. In this process,
the three companies, that is, Asahi Chemical Industry, Asahi Glass, and Tokuyama Soda,
gained earlier experiences of developing and improving ion exchange membranes. As these
ion exchange membranes were based on hydrocarbons, however, they could not maintain
their chemical stability in a strong alkaline environment and hence was not readily used for
chlor-alkali production. The application of ion exchange membranes for use in chlor-alkali
electrolytic cells did not occur until the 1970s.
Table 4-16 Use of Ion Exchange Membranes for Salt Production in Japan
Supplier of Ion Exchange Membrane Start-up Year Salt Producer 1962 Shin-Nihon Chemical Industry 1967 Ako Sea Water Chemical Industry
Asahi Chemical Industry
1967 Naruto Salt Manufacturing 72 Shin-Nihon Chemical Salt has been renamed to Shin-Nihon Salt (Shin-Nihon Salt, 2001). 73 Ako Sea Water Chemical Industry has been renamed to Ako Sea Water. 74 Sakito Salt Manufacturing has been renamed to Dia Salt (Dia Salt, 2001).
172

1969 Naikai Salt Industries Asahi Glass 1972 Sakito Salt Manufacturing 1967 Kinkai Salt Manufacturing Tokuyama Soda 1971 Sanuki Salt Industry
The chronology of the technological developments made by these companies are
compared in Figure 4-6, which indicates the timing of R&D activities, pilot plants, and
commercial plants concerning the diaphragm process and the ion exchange membrane process
for each company. Although the idea of using ion exchange membranes for electrolytic chlor-
alkali production had existed since the 1950s, the lack of suitable ion exchange membranes
prevented the industrial realization of the ion exchange membrane process. In the meantime,
several companies in Japan, including Asahi Chemical Industry, Asahi Glass, and Tokuyama
Soda, had earlier experiences on developing ion exchange membranes primarily used for the
manufacture of salt in the 1960s. Then, at the end of the 1960s, the Nafion membrane, which
was invented by Du Pont, started to be available to companies in the Japanese chlor-alkali
industry. That in effect worked to provide a fertile technological opportunity to these
companies for the development of ion exchange membranes to be used in chlor-alkali
production.
173

Asahi Chem.
Asahi Glass
CEC
67 68 69 70 71 72 73 74 75 76 77 78 79 80 81 82 83 84 85 86 87 88 89 90
Toku- yama Soda
Kureha
IM
IM
IM
IM
D
D
• R&D • Pilot plant
• Processes from Diamond Shamrock, PPG
Construction of commercial plants
Construction of commercial plants
• R&D• Pilot plant
• Demonstration plant
Construction of commercial plants
• R&D • Pilot plant
• Semi-commercial plant
Construction of commercial plants
• R&D• Pilot plant
Construction of commercial plants
• R&D• Commercial plant
D
D
• Processes from Diamond Shamrock, PPG
• Process from Diamond Shamrock
IM
Osaka Soda
IM • Process from CEC
• Process from Asahi Chemical
D: Diaphragm Process; IM: Ion Exchange Membrane Process
Figure 4-6 Technological Developments of Chlor-Alkali Production Processes by Japanese Companies
174

Coincided with the emergence of the Nafion membrane, the government’s decision
made in 1973 to phase out all the mercury-based plants in Japan created demands for clean
technologies which would replace the mercury process. In particular, that provided a
significant impetus for the innovative companies with previous expertise on ion exchange
membranes to start intensive research efforts to develop the ion exchange membrane process
for chlor-alkali production. While the government did not give any financial support to these
companies when they conducted their R&D activities on the ion exchange membrane process,
the decision worked to assure them that there would be a large amount of secured demands
for alternative processes and thus encouraged the innovative companies to invigorate R&D
efforts for developing the ion exchange membrane process. The guaranteed demand for clean
technologies for chlor-alkali production helped the developers of the ion exchange membrane
process to overcome the initial obstacle of its poor performance and uncertain technological
progress in the future.
On the other hand, other companies which had been previously innovative on the
mercury process, namely, Mitsui Engineering and Shipbuilding (MES), Kureha Chemical
Industry, and Osaka Soda did not make significant innovations on the ion exchange
membrane process. Unlike the three early innovators on the ion exchange membrane, that is,
Asahi Chemical Industry, Asahi Glass, and Tokuyama Soda, these companies had not been
involved in salt production previously and hence had little experience of developing the ion
exchange membrane or utilizing it for other purposes. Thus, the initial focus of technological
development was placed on the diaphragm process.
Immediately after the government decision on the phase out of the mercury process in
the Japanese chlor-alkali industry, MES established CEC in 1973 to enter the business of
converting the mercury process to clean processes which do not rely on any use of mercury in
the production facilities. Without sufficient experience or expertise on the ion exchange
membrane process, CEC picked up the diaphragm process for their technological target. The
company decided to introduce technologies from foreign companies, namely, the DS cell
from Diamond Shamrock in the United States and the Glanor cell from PPG also in the
United States and provided these diaphragm process technologies to many chlor-alkali
producers in Japan. The diaphragm process, however, turned out not to be appropriate for
producing high-quality caustic soda, with various types of impurities contained. In the
meantime, the company saw a rapid progress in developing ion exchange membranes based
175

on fluorocarbons by Asahi Chemical Industry, Asahi Glass, and Tokuyama Soda in the 1970s.
The company hence started to undertake R&D activities on electrolytic cells designed for use
in the ion exchange membrane process in the second half of the 1970s. Following a successful
operation of the pilot plant, the first commercial plant based on the ion exchange membrane
process started to operate in 1980. Although CEC was the last company in developing
technologies for the ion exchange membrane process, the company has since then provided its
process to many chlor-alkali producers in Japan. During the technological development, close
cooperation with chlor-alkali manufacturers, including Toa Gosei Chemical and Toyo Soda,
was of critical importance to CEC. As an engineering company which has not been engaged
in chlor-alkali production, the company could receive precious feedback from the practical
experiences of these chlor-alkali manufacturers and utilize it for further technological
improvement.
Another innovative company without previous experience on ion exchange membranes,
Kureha Chemical Industry also chose the diaphragm process for the target of technological
development. The company started R&D activities on the diaphragm process in 1973,
following the government decision on the phase out of the mercury process. The company
subsequently succeeded in developing an electrolytic cell, the SK cell, and converted its own
mercury-based plant to the diaphragm process in 1976. The company, on the other hand, did
not develop its own technologies for the ion exchange membrane process, although the patent
data suggests that some R&D activities were conducted later in the 1970s. Similarly, Osaka
Soda, without technical background in the field of ion exchange membranes, made R&D
efforts on the diaphragm process, following the government’s decision for the abolishment of
the mercury process in 1973. As is indicated by the patent data, however, these innovative
efforts did not result in successful technological development which could be utilized at the
industrial level. In comparison to the diaphragm process, the ion exchange membrane process
was not the focus of the company’s R&D activities. In the end, its mercury-based chlor-alkali
plants were converted to the ion exchange membrane process provided by an outside
technology supplier, namely, CEC.
Figure 4-7 shows the trends in the supply of the diaphragm process and the ion
exchange membrane process by the Japanese companies. (Detailed data are given in Table
4-26 in Appendix at the end of this chapter.) Following immediately the government decision
on the phase out of the mercury process, the supply of the diaphragm process increased
rapidly and reached its peak in the middle of the 1970s. While the supply of the diaphragm
176

process then declined quickly and ceased in 1980, the ion exchange membrane process started
to be supplied in the middle of the 1970s and showed a large increase in the 1980s. After the
supply of the ion exchange membrane process declined in the late 1980s, following the
completion of the process conversion program in Japan, it picked up again in the 1990s,
mainly because of an increase in its supply to chlor-alkali producers in other countries.
0
5
10
15
20
1970 1975 1980 1985 1990 1995 2000
Year
Num
ber o
f Ins
talla
tions
Diaphragm Process
Ion ExchangeMembrane Process
Figure 4-7 Supply of the Diaphragm and the Ion Exchange Membrane Processes by Japanese Firms
Table 4-17 gives detailed data on the supply of the two processes by Asahi Chemical
Industry, Asahi Glass, Tokuyama, and CEC. This table has been constructed by using the
supply lists of the two production processes provided by these companies. (The supply lists of
the companies are shown in Table 4-27, Table 4-28, Table 4-29, Table 4-30, Table 4-31,
Table 4-32, and Table 4-33 in Appendix at the end of this chapter.)
177

Table 4-17 Supply of the Diaphragm and Ion Exchange Membrane Processes by Innovative Companies in Japan
Asahi Chemical Asahi Glass Tokuyama CEC Year D IM D IM D IM D IM
1971 0 0 0 0 0 0 0 0 1972 0 0 0 0 0 0 0 0 1973 0 0 0 0 0 0 0 0 1974 0 0 0 0 0 0 4 0 1975 0 1 0 0 0 0 8 0 1976 0 1 0 0 0 0 5 0 1977 0 1 0 0 0 1 1 0 1978 0 0 0 1 0 0 3 0 1979 0 1 0 0 0 0 1 0 1980 0 0 0 1 0 0 0 1 1981 0 1 0 1 0 1 0 1 1982 0 1 0 1 0 1 0 1 1983 0 2 0 2 0 0 0 6 1984 0 0 0 1 0 0 0 9 1985 0 1 0 6 0 0 0 4 1986 0 5 0 4 0 1 0 2 1987 0 4 0 2 0 1 0 3 1988 0 2 0 1 0 0 0 3 1989 0 0 0 6 0 0 0 3 1990 0 0 0 1 0 0 0 1 1991 0 2 0 3 0 0 0 1 1992 0 0 0 1 0 0 0 2 1993 0 2 0 1 0 0 0 4 1994 0 3 0 2 0 0 0 4 1995 0 0 0 1 0 0 0 3 1996 0 4 0 2 0 0 0 6 1997 0 3 0 8 0 0 0 1 1998 0 10 0 3 0 0 0 3 1999 0 3 0 3 0 0 0 5 Total 0 376 0 408 0 40 176 504 D: Diaphragm Process; IM: Ion Exchange Membrane Process
As we can see in the table, in the second half of the 1970s, Asahi Chemical Industry,
Asahi Glass, Tokuyama Soda succeeded in industrializing their technologies for the ion
exchange membrane process and began to use them basically at their own chlor-alkali
production plants. Then, in the 1980s, these companies started to provide their technologies to
other chlor-alkali producers in Japan. On the other hand, CEC introduced technologies for the
diaphragm process from foreign companies and began to supply them to chlor-alkali
178

producers in Japan in 1974, immediately after the government policy for the phase out of the
mercury process. By 1977, when the initial schedule of the government policy for the phase
out of the mercury process reviewed, CEC’s diaphragm process was adopted by many chlor-
alkali producers in Japan. As the diaphragm process turned out to be an inappropriate
technology, however, CEC, cooperating with several chlor-alkali producers, started to
develop technologies for the ion exchange membrane process in the late 1970s. The
company’s ion exchange membrane process was supplied for the first time to a chlor-alkali
producer in Japan in 1980. In the middle of the 1980s, as the deadline for the phase out of the
mercury process approached, these four companies provided their technologies to many
Japanese chlor-alkali producers who had to convert their mercury-based plants.
Having finished supplying domestic chlor-alkali producers with their ion exchange
membrane process technologies, these companies started to seek actively their customers in
other countries in the late 1980s. Particularly in other countries in Asia, including Taiwan,
South Korea, and China, the technologies developed by the Japanese companies were adopted
by many chlor-alkali producers. Along with the remarkable economic development in these
countries, their chlor-alkali productions have also been growing rapidly, and consequently
many of the chlor-alkali producers avoided from adopting the mercury process, which has
become technologically obsolescent, and instead could introduce the ion exchange membrane
process to their new production facilities.
The intensified R&D activities of the innovative companies in Japan, namely, Asahi
Chemical Industry, Asahi Glass, Tokuyama Soda, and CEC, resulted in a rapid improvement
in the technological performance of the ion exchange membrane process. One of the major
indicators which represent the technological performance of technologies for chlor-alkali
production is the energy consumption, as it accounts for a significant part of the total
manufacturing cost. Table 4-18 shows the trends in the electric power consumption of the ion
exchange membrane process technologies developed by Asahi Chemical Industry, Asahi
Glass, Tokuyama Soda, and CEC 75. Compared with the mercury process, whose energy
consumption remained almost unchanged at the level of approximately 3,200 kWh/t NaOH,
the ion exchange membrane process has shown a remarkable progress in its power
consumption.
75 The electric power consumption is normally higher at a higher current density.
179

Table 4-18 Electric Power Consumption of the Ion Exchange Membrane Process Technologies Developed by Japanese Companies
Year Asahi Chemical Industry
Asahi Glass Tokuyama Soda CEC
1975 3,500 - - - 1976 2,700 3,200 3,200 3,200 1977 2,620 2,740 3,000 - 1978 2,570 2,610 - - 1979 2,500 2,470 2,495 - 1980 2,420 2,340 - 2,600 1981 2,200 2,080 - 2,400 1982 2,200 - 2,160 2,200 1983 2,200 2,080 2,080 - 1984 2,100 - - - 1985 2,100 2,100 - -
Figures are expressed in kWh/t NaOH. Sources: Asahi Chemical Industry: 1975: Oh-hama, Hamada, and Yoshida (1998) (at 4 kA/m2). 1976:
Seko (1976) (at 4 kA/m2). 1977, 1979, 1980, and 1981: Yomiyama (1982). 1978: Seko (1980) (at 3.56 kA/m2). 1982: Seko, Yomiyama, Ogawa, and Ono (1983) (at 4 kA/m2). 1983: Seko, Yomiyama, and Ogawa (1983) (at 4.0 kA/m2). 1984: Seko, Ogawa, Ono, and Suzuki (1984) (at 4 kA/m2). 1985: Seko, Omura, and Yoshida (1986) (at 4 kA/m2).
Asahi Glass: 1976, 1977, 1978, 1980, and 1981: Nagamura, Ukihashi, and Shiragami (1983) (at 3 kA/m2). 1979: Nagamura, Ukihashi, and Shiragami (1980) (at 2 kA/m2). 1983: Ukihashi, Asawa, and Miyake (1983) (at 3 kA/m2). 1985: Ukihashi and Sato (1986) (at 3 kA/m2, 35% NaOH).
Tokuyama Soda: 1979: Motani and Sata (1980) (at 2 kA/m2). 1982: Motani (1982). 1983: Sata, Motani, and Ohashi (1983).
CEC: 1976, 1980, 1981, 1982: Yamaguchi and Kumagai (1990).
Among the innovative companies, Asahi Chemical Industry initially took the lead in
improving the energy consumption of the ion exchange membrane process. When the
company started to operate the first commercial plant in 1975, the power consumption was
3,500 kWh/t NaOH (3,925 kWh/t NaOH, including steam). Then it declined rapidly to about
2,200 kWh/t NaOH in the early 1980s, achieving a reduction by 43 %, and has remained
stable since then. The other companies have caught up with Asahi Chemical Industry quickly
in a short period of time. When Asahi Glass developed the Flemion membrane in 1976, the
power consumption for producing 40 % caustic soda by its ion exchange membrane process
was 3,200 kWh/t NaOH, a level which was almost equivalent to that of the mercury process at
that time. By 1985, the power consumption with the company’s AZEC electrolyzer with ion
exchange membranes had been reduced to less than 2,200 kWh/t NaOH. In the case of
180

Tokuyama Soda, when the first commercial plant based on the ion exchange membrane
process was installed in 1977, its power consumption was more than 3,000 kWh/t NaOH. By
the early 1980s, it had been reduced to less than 2,100 kWh/t NaOH, the lowest among the
three processes. The technological development by CEC for the ion exchange membrane
process was delayed, compared with the other innovative companies in Japan. CEC’s
technology for the ion exchange membrane process, however, showed a rapid progress in
reducing the energy consumption from the initial level of 3,200 kWh/t NaOH to the level of
2,200 kWh/t NaOH just in six years.
In this way, for the past twenty years, the energy consumption of the ion exchange
membrane process has shown a remarkable improvement. To see the extent and speed of
technological progress, we make a comparison between the mercury process, diaphragm
process, and the ion exchange membrane process in terms of progress in the efficiency of
energy consumption. Figure 4-8 shows the trends in the energy consumption of the three
processes. (Detailed data are given in Table 4-24 in Appendix at the end of this chapter.)
181

0
1,000
2,000
3,000
4,000
5,000
1970 1975 1980 1985 1990 1995 2000
Year
Ener
gy C
onsu
mpt
ion
(kW
h/t N
aOH
)
Mercury Process
Diaphragm Process
Ion ExchangeMembrane Process
Figure 4-8 Energy Consumption of the Mercury, Diaphragm, and Ion Exchange Membrane Processes
The total energy consumption is the sum of the electric power consumption and, in the
cases of the diaphragm process and the ion exchange membrane process, the steam
consumption required to increase the concentration of caustic soda. Here the data on the
energy consumption of the ion exchange membrane process is represented by that of the
technology developed by Asahi Chemical Industry, except for 1970. With regard to the steam
consumption required for concentrating caustic soda, it has been assumed to be 470 kWh/t
NaOH for the diaphragm process, and 450 kWh/t NaOH until 1979 and 300 kWh/t NaOH
thereafter for the ion exchange membrane process76. When data is not available, we have
made an assumption of linear improvement in the energy efficiency. Figure 4-8 can be seen in
76 The development of the ion exchange membrane process can be traced in three phases. While the ion exchange membrane process produced 8 to 15 % caustic soda in the first phase, which ended in 1979, caustic soda of 35 % was produced in the second and the third phases (Chatterjee, 1984).
182
relation to Figure 2-9, which we have developed in discussing our analytical framework for
the effects of environmental regulation on technological change.
Initially, the energy consumption of the ion exchange membrane process exceeded
4,800 kWh/t NaOH (Morris, 1990). In 1970 the development of the ion exchange membrane
process was still in its infancy, with a level of energy consumption at 4,500 kWh/t NaOH. At
the middle of the 1970s, when the first commercial plant based on the ion exchange
membrane process started to produce chlor-alkali products, the total energy consumption was
more than 3,900 kWh/t NaOH, which included the consumption of steam for concentrating
caustic soda. In the decade from the middle of the 1970s to the middle of the 1980s, when
R&D activities were conducted intensively by the Japanese companies, the energy efficiency
of the ion exchange membrane process was improved significantly. Its total energy
consumption soon surpassed the level of 3,200 kWh/t NaOH of the mercury process, and by
the middle of the 1980s, the electric power consumption had reached 2,100 kWh/t NaOH.
Since then, the electric power consumption has remained almost unchanged at the same level.
Although the theoretical power consumption for chlor-alkali production is calculated as 1,480
kWh/t NaOH, the current level of 2,100 kWh/t NaOH is considered by many industry experts
to be fairly close to the practical limit with the current technological design (Seko, Ogawa,
Ono, and Suzuki, 1984)77.
On the other hand, the mercury process, which does not require any steam for the
concentration of caustic soda, consumed electric power of 3,200 kWh/t NaOH at the
beginning of the 1970s. The smaller figure of energy consumption made the mercury process
economically superior to the ion exchange membrane process at that time. The energy
consumption of the mercury process has remained almost unchanged until now, at the same
level of 3,200 kWh/t NaOH. In the case of the diaphragm process, its energy consumption had
been larger than that of the mercury process. In the middle of the 1970s, when the government
decision on the phase out of the mercury process, the energy consumption of the diaphragm
process was much smaller than that of the ion exchange membrane process. Since then,
however, the extent of progress in the technological performance of the diaphragm process
has been small, and its total energy consumption, which is currently at the level of 3,120
77 Some people expect that it is possible to reduce the electrical energy consumption of the ion exchange membrane process by another 20 to 25 % with the application of a fuel depolarized cathode, which has not yet reached the level of industrialization. Some companies are also working on technologies which can produce directly 50 % caustic soda (Nakao and Miyake, 1995; Shimohira, Saito, Saito, and Miyake, 1993). If successful,
183

kWh/t NaOH, has been surpassed by that of the ion exchange membrane process. In other
words, while there has been basically no change in the energy consumption of the mercury
process and very little improvement in the case of the diaphragm process since the 1970s, the
ion exchange membrane process has reduced its energy consumption significantly, advancing
it from the least to the most economically efficient technology78.
The quality of caustic soda produced also indicated the extent of technological progress
of the ion exchange membrane process. To produce caustic soda of a high concentration, the
ion exchange membrane needs to maintain its chemical stability in the strong alkali
environment, and that requires technological sophistications in the chemical composition of
the ion exchange membrane. In 1975, when the first commercial plant using the ion exchange
membrane process started its operation, the concentration of caustic soda was 17 %. Since
commercial applications of caustic soda normally require a concentration which is close to
50 %, a further step is necessary to increase the caustic concentration, consuming an extra
amount of energy. As the additional energy is normally provided in the form of steam, it
raises the production cost of the ion exchange membrane process. Since the middle of the
1970s, the concentration of caustic soda has been increased, and its current level is
approximately 35 %, implying that the steam cost for concentrating caustic soda has been
reduced. Furthermore, the quality of caustic soda has been improved, as impurities contained
in caustic soda have been reduced. The concentration of sodium chloride, a major substance
among various impurities, in caustic soda has dropped from the level of hundreds parts per
million (ppm) in the 1970s to just a few ppm in the current period.
4.5 Modification of Regulatory Schedule and Adoption of the Ion Exchange
Membrane Process
The rapid progress in the technological performance of the ion exchange membrane process
was carefully monitored and assessed by the academic experts of the Evaluation Committee.
that will remove the necessity of using steam to further increase the concentration of caustic soda. This technological progress, however, might increase the consumption of electric power. 78 While the electric power consumption of the ion exchange membrane process declined significantly, the current density has increased, from 2.5 kA/m2 to the present level of 5 kA/m2. This has contributed to keeping the nominal capital cost for the process conversion almost unchanged over the 20 years. On the other hand, ion exchange membranes in the high current density operation usually do not show their good performance which would be obtained at lower current density, and cell operation becomes more difficult because the increasing current requires special cell design to achieve a homogeneous electrolyte distribution in the cell and the reliable
184

Their final conclusion that the ion exchange membrane process had reached a stage at which
it could be applied for industrial applications prompted the Countermeasures Council to
review the regulatory schedule which had been rigidly fixed in a short-time framework.
In September 1979 the Countermeasures Council at its fifth meeting made a decision
that the remaining mercury process plants were to be converted by the end of 1984 (Council
for the Promotion of Countermeasures against Mercury Pollution, 1979). This extension of
the deadline for process conversion enabled the operators of mercury-based plants to adopt
the more efficient ion exchange membrane process in the second phase of the government
program for process conversion, instead of the diaphragm process. Some manufacturers,
particularly those whose chlor-alkali production had heavily depended on the mercury
process, argued that they would need more time to see whether the newly developed
membrane process could be reliably used at the industrial level (Japan Soda Industry
Association, 1980b; Katsumura, 1979). Nevertheless, the Countermeasures Council
maintained its original schedule for the completion of process conversions at subsequent
meetings (Council for the Promotion of Countermeasures against Mercury Pollution, 1980,
1981, 1982).
Subsequently, the ion exchange membrane process technologies developed by the
innovating companies came to be adopted by other chlor-alkali producers in Japan. By using
Table 4-27, Table 4-28, Table 4-29, Table 4-31, Table 4-32, and Table 4-33, we obtain Table
4-19, which shows the adoption of the ion exchange membrane process at chlor-alkali plants
in chronological order.
Table 4-19 Adoption of the Ion Exchange Membrane Process by Chlor-Alkali Producers in Japan
Year Plant Site Technology Supplier 1975 Asahi Chemical Industry, Nobeoka Asahi Chemical Industry 1976 Denki Kagaku Kogyo, Ohme Asahi Chemical Industry 1977 Tokuyama Soda, Tokuyama Tokuyama Soda 1978 Asahi Glass, Osaka Asahi Glass
Nippon Carbide, Uozu Asahi Glass 1980 Showa Enso, Gushikawa CEC
1981 Osaka Soda, Amagasaki CEC Tsurumi Soda, Tsurumi Asahi Glass 1982 Mitsui Toatsu Chemical, Nagoya CEC
discharging device. Currently, one of the targets of R&D activities concerning the ion exchange membrane process is to overcome these technical difficulties (e.g. Nakao, Shimohira, and Takechi, 1998).
185

Nikkei Kako, Kanbara Asahi Chemical Industry Kashima Chlorine & Alkali, Kashima Asahi Glass Nankai Chemical Industry, Tosa Asahi Glass Mitsui Toatsu Chemical, Ohmuta CEC Osaka Soda, Matsuyama CEC Toyo Soda, Yokkaichi CEC Kanto Denka Kogyo, Mizushima CEC
1983
Tokuyama Soda, Tokuyama CEC Sumitomo Chemical, Ohita CEC Confidential CEC Confidential CEC Chiba Chlorine & Alkali, Chiba CEC Ajinomoto, Kawasaki CEC Kansai Chlor-Alkali, Osaka Asahi Glass Hodogaya Chemical, Kohriyama CEC Toa Gosei Chemical, Tokushima CEC Mitsui Toatsu Chemical, Nagoya CEC
1984
Mitsui Toatsu Chemical, Osaka CEC Kureha Chemical, Nishiki Asahi Chemical Industry Central Chemical, Kawasaki Asahi Glass Mitsubishi Chemical, Mizushima Asahi Glass Shin-etsu Chemical, Naoetsu Asahi Glass Confidential Asahi Glass Hokkaido Soda, Horobetsu Asahi Glass Toagosei Chemical, Nagoya CEC
1985
Osaka Soda, Kokura CEC Okayama Chemical, Mizushima Asahi Chemical Industry Kanto Denka Kogyo, Shibukawa Asahi Chemical Industry Hokkaido Soda, Tomakomai Asahi Glass Nankai Chemical Industry, Wakayama Asahi Glass Asahi Glass, Chiba Asahi Glass Nippon Soda, Takaoka CEC
1986
Kanto Denka Kogyo, Mizushima CEC Sumitomo Chemical, Kikumoto Asahi Chemical Industry 1987 Toagosei Chemical, Tokushima CEC Hodogaya Chemical, Kohriyama CEC 1988 Confidential CEC Mitsubishi Chemical, Kurosaki Asahi Glass Asahi Glass, Kashima Asahi Glass
1989
Kanegafuchi Chemical, Takasago CEC 1995 Tosoh CEC
186

As we can see, in the second half of the 1970s, the ion exchange membrane process was
initially installed at chlor-alkali plants by the innovating companies which had developed
technologies by themselves, that is, Asahi Chemical Industry, Tokuyama Soda, and Asahi
Glass. Although at that time the technological performance of the ion exchange membrane
process was not particularly favorable, compared with the diaphragm process, these
companies could gain experiences of actually using their own technologies for industrial
production and utilize these practical experiences for future developments of their
technologies for the ion exchange membrane process. As further progress had been achieved
in the technological performance, other chlor-alkali producers gradually started to introduce
the ion exchange membrane process in the early 1980s. In the same period, CEC joined the
three early movers in providing technologies for the ion exchange membrane process to chlor-
alkali producers.
As chlor-alkali producers were hit by the second oil crisis at that time, severely
deteriorating their financial situations, MITI contacted individual companies to see the
progress on their conversion plans. It was then becoming clear that some of the companies
would not be able to finish converting their mercury-based plants by the end of 1984, the
deadline which had been originally set by the Countermeasures Council. The
Countermeasures Council convened again in December 1983 to discuss the issue and made a
decision to extend the deadline to the middle of 1986, on the condition that the companies
would start to convert their mercury-based plants by the end of 1984 (Council for the
Promotion of Countermeasures against Mercury Pollution, 1983). As Table 4-19 indicates,
most of the introductions of the ion exchange membrane process subsequently took place in a
few years just before the extended deadline. The last chlor-alkali plant based on the mercury
process was finally converted at the end of June in 1986. It was 13 years after the
government’s initial decision to phase out the mercury process in the Japanese chlor-alkali
industry.
Figure 4-9 shows the overall trends in production capacities based on the mercury
process, the diaphragm process, and the ion exchange membrane process from the early 1970s.
(Detailed data are given in Table 4-25 in Appendix at the end of this chapter.)
187
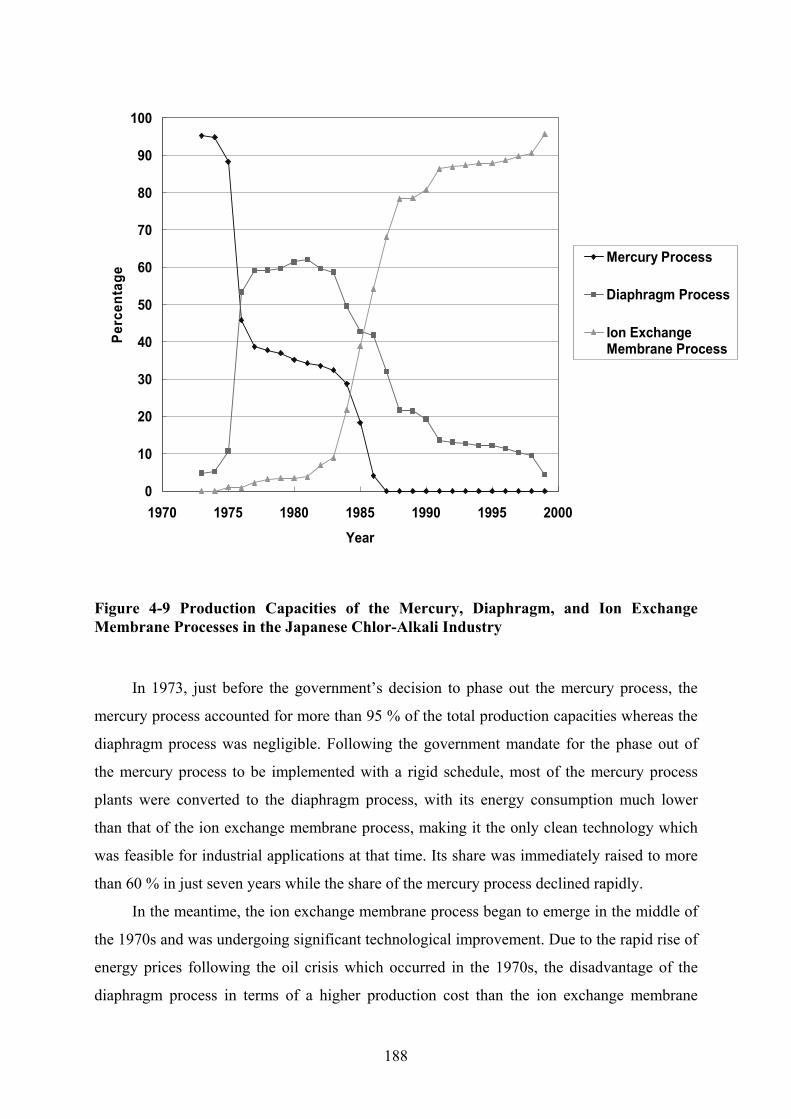
0
10
20
30
40
50
60
70
80
90
100
1970 1975 1980 1985 1990 1995 2000
Year
Perc
enta
ge
Mercury Process
Diaphragm Process
Ion ExchangeMembrane Process
Figure 4-9 Production Capacities of the Mercury, Diaphragm, and Ion Exchange Membrane Processes in the Japanese Chlor-Alkali Industry
In 1973, just before the government’s decision to phase out the mercury process, the
mercury process accounted for more than 95 % of the total production capacities whereas the
diaphragm process was negligible. Following the government mandate for the phase out of
the mercury process to be implemented with a rigid schedule, most of the mercury process
plants were converted to the diaphragm process, with its energy consumption much lower
than that of the ion exchange membrane process, making it the only clean technology which
was feasible for industrial applications at that time. Its share was immediately raised to more
than 60 % in just seven years while the share of the mercury process declined rapidly.
In the meantime, the ion exchange membrane process began to emerge in the middle of
the 1970s and was undergoing significant technological improvement. Due to the rapid rise of
energy prices following the oil crisis which occurred in the 1970s, the disadvantage of the
diaphragm process in terms of a higher production cost than the ion exchange membrane
188

process became much worse. Furthermore, while the existing mercury-based plants were
being converted to the diaphragm process rapidly in the late 1970s, a serious concern was
growing among chlor-alkali producers who had already finished converting their plants to the
diaphragm process. The production cost with the diaphragm process became higher than that
with the mercury process, and the quality of caustic soda produced with the diaphragm
process was not sufficiently high, as Table 4-5 shows that the diaphragm process produced
caustic soda which contained much more impurities, notably sodium chloride, making it
inappropriate for use in some industrial applications.
Accordingly, the newly developed ion exchange membrane process started to replace
the mercury process and later the diaphragm process as well. When the mercury process was
completely abolished in 1986, the installed capacity of the ion exchange membrane process
accounted for more than half of the total production capacity. Since then, the share of the ion
exchange membrane process has increased steadily, reaching more than 95 % in 1999.
4.6 Costly Transition from the Mercury Process to the Diaphragm Process and
then to the Ion Exchange Membrane Process
Figure 4-9 shows that the diaphragm process has decreased its share steadily since the early
1980s, with the once dominant diaphragm process currently accounting for less than 5 % of
the total production capacities in Japan. This suggests that the mercury-based plants which
had been converted to the diaphragm process were shortly converted again to the ion
exchange membrane process. We thus examined how long the chlor-alkali plants which had
introduced the diaphragm process were operated. Figure 4-10 shows the operating period of
the diaphragm process adopted at chlor-alkali plants in Japan. (Detailed data are given in
Table 4-34 in Appendix at the end of this chapter.)
189

1970 1975 1980 1985 1990 1995 2000
123456789
1011121314151617181920212223242526272829303132333435
Plan
tYear
Average: 10.0 years
Figure 4-10 Operating Period of the Diaphragm Process at Chlor-Alkali Plants in Japan
As you can see, all of the chlor-alkali plants which had been converted to the diaphragm
process following the government decision on the phase out of the mercury process were
converted again to the ion exchange membrane process. As a result, the operating period of
these diaphragm plants was very short, an average of only 10 years. That is far shorter than
the normal period of approximately 40 years for plant operation in the chemical process
industry (Society of Chemical Engineers of Japan, 1998). In retrospect, we could argue that
the investment needed to convert mercury-based plants to the diaphragm process was
scrapped prematurely.
Process conversions at this scale normally require a significant amount of investment in
the industry. Table 4-20 gives the composition of the investments used for the conversions of
the mercury-based plants in Japan from the beginning of the process conversion program in
the early 1970s to its completion in the late 1980s. The investment costs include those for the
conversion of the mercury process either to the diaphragm process or to the ion exchange
190

membrane process and those for the conversion of the newly adopted diaphragm process to
the ion exchange membrane process. The investment costs are compared with the annual
turnovers of the Japanese chlor-alkali industry as a whole.
Table 4-20 Investment Costs for the Process Conversion in the Japanese Chlor-Alkali Industry
Fiscal Year
Mercury Process -> Diaphragm or Ion Exchange
Membrane Process
Diaphragm Process ->Ion Exchange
Membrane Process
Total Investment
Industry Turnover
1973 1974 1975 1976 1977
231.8 0 231.8 630.9a
1978 1979 1980 1981
1.9 2.7 4.6 594.7
1982 3.7 1.3 5.0 172.1 1983 5.6 10.0 15.6 184.5 1984 11.2 5.0 16.2 190.2 1985 18.6 5.7 24.3 180.4 1986 14.5 6.0 20.5 167.3 1987 0 14.4 14.4 169.0 1988 0 1.6 1.6 185.0 Total 287.3 46.7 334.0 -
Figures are expressed in Japanese billion yen. a: The annual turnovers for 1973 and 1974 are assumed to be the same as that for 1975. Sources: Investment: Japanese Ministry of International Trade and Industry (1989). Industry Turnover: Japanese Ministry of International Trade and Industry (1985; 1990).
The process conversions which were undertaken from 1973 to 1988 cost the Japanese
chlor-alkali industry 334 billion yen as a whole. Of the total cost of 287.3 billion yen invested
in converting the existing mercury-based plants to the diaphragm or ion exchange membrane
process, 231.8 billion yen was spent during the first phase of the process conversion program
which was implemented from 1973 to 1977. That means that approximately 80 % of the total
investment for converting mercury-based plants was made at the initial stage of the process
conversion program.
At this stage of the conversion program, as indicated in Table 4-4, 41 plants introduced
the diaphragm process, the only clean technology which it had been well-established could be
191

reliably used for industrial applications. Only 3 plants, as Table 4-19 shows, adopted the ion
exchange membrane process, whose technological development was still in its infancy.
Assuming that the investment cost for the construction of a plant is equal between the
diaphragm process and the ion exchange membrane process, more than 90 % of the
investment of 231.8 billion yen spent in the first phase of the conversion program was used to
introduce the diaphragm process, rather than the ion exchange membrane process, during the
first phase of the conversion program. And almost all of these plants were later switched to
the newly developed ion exchange membrane process.
This amount of financial resources constituted a considerable burden on the chlor-alkali
industry, which had already been severely hit by the rise in energy prices following the oil
crisis in the 1970s. The sum of the industry’s annual turnovers in the first phase of the
conversion program, that is, from 1973 to 1977, was 630.9 billion yen. The amount of
financial resources devoted to convert mercury-based plants to the diaphragm process, which
would be converted again to the ion exchange membrane process in a very short period of
time, reached more than one third of the industry’s turnover in the same period. This clearly
indicates that the investment necessary for process conversions had a significant impact on
the financial condition of the Japanese chlor-alkali industry as a whole.
As the investment required such a large amount of financial resources in such a short
period of time, chlor-alkali producers asked the government for financial support (Japan Soda
Industry Association, 1974c). The Conversion Committee made a similar recommendation to
provide the industry with financial resources and tax reductions for the process conversion
(Committee for the Promotion of Process Conversions in the Soda Industry, 1973)79. The
Ministry of Finance, however, insisting on the Polluters Pay Principle (PPP), initially claimed
that all of the necessary investment should be financed by the industry (Tajima, 1997).
Negotiations between MITI and the Ministry of Finance finally resulted in the agreement that
Japan Development Bank and Hokkaido-Tohoku Development Finance Public Corporation80
79 The Conversion Committee also made a recommendation to provide loans for the investments related to scrapping mercury process facilities, most of which had not yet been depreciated completely. This recommendation, although strongly supported by chlor-alkali producers, was rejected by the Ministry of Finance (Tajima, 1997). As some of the mercury process facilities to be abolished were relatively new and technologically sophisticated, plant operators were hoping to sell them in other countries in order to finance the necessary investments. MITI, however, fearing to be criticized for exporting pollution, decided that the scrapped mercury process facilities were in principle prohibited from being exported to foreign countries (Japanese Ministry of International Trade and Industry, 1974). 80 Japan Development Bank and Hokkaido-Tohoku Development Finance Public Corporation were merged on October 1, 1999, creating the Development Bank of Japan.
192

were to provide loans for the conversion of the mercury process to the diaphragm process in
the chlor-alkali industry (Japan Soda Industry Association, 1974b). The interest rate was set
to be the most preferential rate, 7.7 % for the fiscal year 1974, a figure which was less
favorable than for loans for technological development but better than those for general
countermeasures against public nuisance. Furthermore, 70 % of the investment for the process
conversion and 35 % of the investment for the expansion of facilities were decided to be
financed by the loans from the public financial institutions.
Table 4-21 shows the sources from which plant operators financed the investment
capital necessary for the first phase of the process conversion program. More than half of the
total investment of 231.8 billion yen was financed through borrowings from the two public
financial institutions. Together with borrowings from private financial institutions, about
90 % of the total investment capital was financed through borrowings, making a heavy burden
on the financial conditions of the companies.
Table 4-21 Sources of Investment Capital for the First Phase of the Process Conversion
Institution Interest rate (%)
Amount (billion yen)
Public financial institutions • Japan Development Bank
• Hokkaido-Tohoku Development
Finance Public Corporation
7.9*
8.2 7.7 8.2 7.7
128.0 (55.2%) 40.870.14.7
12.4
Borrowing
Private Financial Institutions n/a 81.6 (35.2%) Self-financing - - 22.2 (9.6%) Total investment - - 231.8 * Average Source: Japanese Ministry of International Trade and Industry (1979).
In retrospect, these financial resources could have been saved if the mercury-based
plants that existed in the early 1970s had been converted directly to the ion exchange
membrane process without going through the diaphragm process. To realize that route of
technological change, however, a different schedule for the implementation of the
government’s policy to phase out the mercury process would have been required. If the
requirement for the phase out of the mercury process had not been set to complete
immediately, but implemented with some flexibility in timing, allowing more time to test and
evaluate technological progress of alternative clean processes carefully, it would have been
193

possible for the operators of the mercury process to switch directly to the ion exchange
membrane process, avoiding this considerable waste in investment.
4.7 Conclusion
In this chapter, we examined the effects of environmental regulation on technological change
in the Japanese chlor-alkali industry. We paid particular attention to technological
developments by those companies which had previous experiences of making innovations on
chlor-alkali production technologies. At the beginning of the 1970s, the mercury process had
become the dominant technology for chlor-alkali production, accounting for more than 95 %
of the production capacities of the Japanese chlor-alkali industry. The technologies used for
the mercury process had been developed by several companies in Japan. Notably, Mitsui
Engineering and Shipbuilding (MES), Osaka Soda, Kureha Chemical Industry, Asahi Glass,
Tokuyama Soda, and Asahi Chemical Industry had been particularly innovative on the
mercury process prior to the introduction of environmental regulations on mercury emissions
into the environment.
We next examined the environmental regulations introduced in Japan to deal with
mercury emissions from chlor-alkali plants using the mercury process. In the 1960s Japan
experienced the tragedy of the Minamata disease. Concerns were growing among the general
public on the effects of mercury emitted to the environment, whether it was organic mercury,
which caused the serious disease, or inorganic mercury. With public pressures increasing, the
Japanese government had to take a very strong stance on the emissions of mercury from
chlor-alkali plants, despite strong opposition from the chlor-alkali industry in Japan. The
regulation set by the government demanded that chlor-alkali producers completely abolish the
mercury process in less than five years. To facilitate the conversion of the existing mercury-
based plants, the government provided financial support to chlor-alkali producers through
preferential tax treatment and low-interest public loans. As the regulatory schedule for
converting the mercury process to alternative clean technologies was rigidly fixed, however,
most of the chlor-alkali manufacturers had no choice other than to adopt the diaphragm
process. It was regarded by many as the only clean technology feasible for industrial chlor-
alkali production at that time despite that, as the diaphragm process was less energy efficient,
production costs with the diaphragm process were higher than with the mercury process.
Although several innovative Japanese firms began to work on the diaphragm process, the
194
regulatory schedule for process conversions initially lacked flexibility and did not allow
sufficient time for new technological development. By 1976, two thirds of the chlor-alkali
production capacities in Japan had been converted to the diaphragm process. Overall, the
technologies adopted for the diaphragm process in Japan following the government decision
on the phase out of the mercury process were mostly those developed by foreign companies.
During this period, however, there were other companies who chose another type of
clean technologies to replace the mercury process. Asahi Chemical Industry, Asahi Glass, and
Tokuyama Soda focused their R&D efforts on the ion exchange membrane process. These
companies had earlier experiences of developing and utilizing ion exchange membranes
primarily for the production of salt in the 1960s. While the idea of using the ion exchange
membrane for chlor-alkali production had existed since the 1950s, its industrial realization
was prevented by the unavailability of ion exchange membranes with chemical stability and
mechanical strength that could reliably be used in the chlor-alkali electrolytic cell. Then, in
the late 1960s, a new type of the ion exchange membrane developed in the United States
became available to Japanese companies. That provided these companies with an opportunity
to utilize their technological expertise for the improvement of ion exchange membranes for
chlor-alkali production.
Shortly thereafter, the government decision to phase out the mercury process created a
secure demand for mercury-free, clean technologies in the Japanese chlor-alkali industry. This
provided a strong incentive for innovative companies to develop technologies for the ion
exchange membrane process and to supply them to other chlor-alkali producers. In the
absence of government financial support for their R&D activities, and as the ion exchange
membrane process for chlor-alkali production was still in its infancy in the early 1970s, with
its technological feasibility not yet firmly established, only those companies that had previous
experience and expertise on the ion exchange membrane, that is, Asahi Chemical Industry,
Asahi Glass, and Tokuyama Soda, intensified their R&D activities. These companies
succeeded in developing their technologies for the ion exchange membrane process and
started to utilize them for their own chlor-alkali plants. Through the practical experiences of
using the newly developed technologies, these companies further improved the technical
performance of the ion exchange membrane process.
While the ion exchange membrane process was undergoing rapid technological
advancement, the disadvantage of the diaphragm process in terms of production costs was
worsening, as energy prices soared following the oil crisis in the 1970s. Moreover, it had
195

become clear among chlor-alkali producers that the quality of caustic soda produced by the
diaphragm process was not high enough as to be used for several industrial applications.
Under the circumstances, it was decided in 1977 that the implementation of the process
conversion program would be interrupted for a while, and at the same time an expert
committee was established to evaluate the extent of the technological progress of the newly
emerging ion exchange membrane process. The committee members, all of whom were from
academic research institutes, interviewed and visited companies for detailed information on
the on-going technological developments in the industry. In 1979 they finally agreed on the
conclusion that the ion exchange membrane process had reached a stage ready for industrial
applications.
With the expert evaluation of the technological progress, the government modified the
original conversion program and postponed the deadline for the phase out of the mercury
process to the middle of the 1980s. This adjustment of the regulatory schedule allowed more
time for innovative companies to undertake R&D activities and to learn through actual
experiences of operating chlor-alkali plants based on the ion exchange membrane process,
promoting further progress of the promising, but not yet proved, new technology. In the end,
the ion exchange membrane process had advanced to become the best technology among the
three chlor-alkali processes economically as well as environmentally, and subsequently the
remaining mercury-based plants were converted to the ion exchange membrane process. The
phase out of the mercury process was completed in 1986, and currently almost all of the
chlor-alkali plants in Japan are relying on the ion exchange membrane process. Furthermore,
in addition to the environmental benefits and cost savings in the use of the ion exchange
membrane process, innovative companies such as Asahi Chemical Industry, Asahi Glass,
Tokuyama Soda, and CEC are supplying their technologies to chlor-alkali producers in other
countries, particularly in Asia.
On the negative side, the mercury-based plants which had been converted to the
diaphragm process, immediately following the government decision on the phase out of the
mercury process, had to be converted again to the ion exchange membrane process. The
average operating period of the plants based on the diaphragm process was only ten years, a
figure which is significantly shorter than the normal operating period of 40 years. This
implies that a large amount of the capital investment made for the introduction of the
diaphragm process, which was comparable to the industry’s annual turnover at that time, was
not utilized usefully until the end of the technologies’ lifetime and effectively ended up
196

wasted. In retrospect, this could have been avoided if the initial policy for the phase out of the
mercury process had maintained some degree of flexibility in its regulatory schedule, taking
into account the state of technological development of alternative processes. As innovations
on the ion exchange membrane process were perceived to be on the horizon by several
innovative companies at the time of the early 1970s, if the deadline for the phase out of the
mercury process had been initially set for a later date, there could have been more time for
necessary detailed experiments and evaluations of alternative technologies, and most of the
mercury-based plants could have been converted directly to the ion exchange membrane
process, without wasting investments on the diaphragm process.
To sum up, government policy for the phase out of the mercury process did encourage
innovative companies to undertake R&D activities on clean technologies. Applied on a too
rigid schedule, however, the stringent regulation initially did not allow for sufficient time to
see further technological progress of the newly emerging ion exchange membrane process
while most of the chlor-alkali producers were induced to adopt the diaphragm process, which
was to be abandoned soon. Only after the initial rigid regulatory schedule was relaxed, was
the ion exchange membrane process widely adopted by the Japanese chlor-alkali industry.
One of the policy implications we could draw from this case of technological change in the
Japanese chlor-alkali industry is that, while stringent regulation is expected to encourage
radical innovations on clean technologies, instead of incremental innovations on end-of-pipe
technologies, the regulatory schedule should be sufficiently flexible incorporating accurate
information on the state of technological development in industry. That will help to avoid
choosing a technology which may not be the best one in the long run. This is particularly
important in a case in which the speed of technological change is high and the degree of its
uncertainty is large.
Appendix
List of Interviewees in Japan
Asahi Chemical Industries
• Mr. OH-HAMA Hiroshi, Corporate Auditor
197

• Mr. HAMADA Masao, General Manager, Chemicals Strategic Planning
Department, Chemicals Administration
• Mr. YOSHIDA Mitsuo, Senior Staff, Corporate R&D Administration
Asahi Glass
• Mr. SATO Kimihiko, former General Manager, Technology Division
Tokuyama Soda
• Dr. SATA Toshikatsu, former Chief Researcher, Technology Research Center
• Dr. MATSUURA Shunji, Corporate Planning Division
Chlorine Engineers Corp.
• Dr. YAMAGUCHI Kenzo, Technical Advisor
Mitsubishi Chemical Corporation
• Mr. FUJII Toshiharu, General Manager, Global Environmental Department
Sumitomo Chemical
• Mr. FUKUNAGA Tadatsune, Manager, Environment and Safety Department
Japan Soda Industry Association
• Mr. AIKAWA Hiroaki, Director, Global Environment Department
• Mr. SAKAMOTO Akio, Manager, Public Relations Division
Japan Chemical Industry Association
• Mr. KAWAMATA Motoo, Deputy General Manager, Japan Responsible Care
Council
Japan Salt Industry Association
• Mr. HANAFUSA Fumiyuki, Manager, Research Division
Ministry of International Trade and Industry
198

• Mr. FUJII Kenya, Chemicals Division, Basic Industries Bureau
• Mr. TAJIMA Keizo, former Manager, Petrochemical Group, Basic Chemicals
Division, Basic Industries Bureau
Table 4-22 List of Chlor-Alkali Plants in Japan
Capacity (NaOH 103 tonnes/year) Company Site Hg D IM Other
Hokkaido Soda Tomakomai - - 132 - Tohoku Tosoh Chemical Sakata - - 54 - Kureha Chemical Industry Nishiki - - 110 - Showa Denko Kawasaki - 59 57 - Nippon Soda Takasaki - - 65 - Kanto Denka Kogyo Shibukawa - - 45 - Kanto Denka Kogyo Mizushima - - 58 - Central Chemical Kawasaki - - 67 - Tsurumi Soda Tsurumi - - 90 - Nippon Light Metal Kanbara - - 50 - Shin-etsu Chemical Naoetsu - - 46 - Denki Kagaku Kogyo Omi - - 52 - Mitsui Chemical Nagoya - - 69 - Mitsui Chemical Osaka - - 66 - Mitsui Chemical Ohmuta - - 73 - Toa Gosei Nagoya - - 73 - Toa Gosei Tokushima - - 166 - Nippon Carbide Industries Uozu - - 15 - Asahi Glass Kashima - 173 109 - Asahi Glass Chiba - - 229 - Asahi Glass Kitakyushu - - 14 - Kanegafuchi Chemical Industry Takasago - - 297 - Daiso Amagasaki - - 90 - Daiso Matsuyama - - 43 - Daiso Kokura - - 29 - Nankai Chemical Industry Wakayama - - 32 - Sumitomo Chemical Ehime - - 112 - Sumitomo Chemical Oita - - 13 - Nippon Paper Industries Iwakuni - 27 - - Tosoh Yokkaichi - - 76 - Tosoh Nanyo - 163 423 - Tokuyama Tokuyama - - 342 - Mitsubishi Chemical Mizushima - - 116 - Mitsubishi Chemical Kurosaki - - 35 - Asahi Chemical Industry Nobeoka - - 142 -
199

Showa Chemical Gushikawa - - 3 - Kashima Chlorine & Alkali Kashima - - 354 - Chiba Chlorine & Alkali Chiba - - 94 - Kansai Chlor-Alkali Osaka - - 38 - Okayama Chemical Mizushima - - 129 - Total 0 3,376 32,064 0
Data as of 1998. Hg: Mercury process D: Diaphragm process IM: Ion exchange membrane process Monthly production capacities have been transformed to annual production capacities: monthly capacity x 12 x 0.86 = annual capacity. Source: Japan Soda Industry Association (1998b).
Table 4-23 Japanese Patents on the Mercury, Diaphragm, and Ion Exchange Membrane Processes Granted to Japanese Firms
Year of patent applications
Mercury Process Diaphragm Process Ion Exchange Membrane Process
1968 18 1 3 1969 14 2 7 1970 20 6 3 1971 21 4 5 1972 30 7 11 1973 2 11 21 1974 11 18 27 1975 9 10 45 1976 7 24 60 1977 2 16 53 1978 - 8 46 1979 - 8 47 1980 - 9 87 1981 - 6 71 1982 - 1 30 1983 - 1 20 1984 - 1 20 1985 - 0 10 1986 - 0 12 1987 - 0 7 Total 1072 1064 4680
200

Table 4-24 Energy Consumption of the Mercury, Diaphragm, and Ion Exchange Membrane Processes
Year Mercury Process
Diaphragm Process
Ion Exchange Membrane Process
1970 3,200 - 4,450 1971 - - - 1972 - - - 1973 - - - 1974 3,200 3,350 - 1975 - - 3,950 1976 - - 3,150 1977 - - 3,070 1978 - - 3,020 1979 - - 2,950 1980 - - 2,720 1981 - - 2,500 1982 - - 2,500 1983 - - 2,500 1984 - - 2,400 1985 - - - 1986 - - - 1987 - - - 1988 - - - 1989 - - - 1990 - - - 1991 - - - 1992 - - - 1993 - - - 1994 - - - 1995 - - - 1996 - - - 1997 3,200 3,120 2,400
Sources: Mercury Process: 1970: Kuhn (1971). 1974: Japan Soda Industry Association (1975). 1997: Japan Soda Industry Association (1998b). Diaphragm Process: 1974: Japan Soda Industry Association (1975). 1997: Japan Soda Industry Association (1998b). Ion Exchange Membrane Process: 1970: Chatterjee (1984). 1975-1984: Asahi Chemical Industry (see Table 4-18). 1997: Oh-hama, Hamada, and Yoshida (1998).
Table 4-25 Production Capacities of the Mercury Process, Diaphragm Process, and Ion Exchange Membrane Process in the Japanese Chlor-Alkali Industry
Year Mercury Process Diaphragm Process Ion Exchange Total Production
201

Membrane Process Capacity 1973 3,660 (95.3 %) 180 (4.7 %) 0 3,840 1974 3,605 (94.8 %) 196 (5.2 %) 0 3,801 1975 3,479 (88.3 %) 421 (10.7 %) 41 (1.0 %) 3,941 1976 2,064 (45.8 %) 2,403 (53.3 %) 41 (0.9 %) 4,508 1977 1,747 (38.7 %) 2,667 (59.1 %) 102 (2.2 %) 4,516 1978 1,697 (37.7 %) 2,667 (59.2 %) 142 (3.1 %) 4,506 1979 1,652 (37.0 %) 2,655 (59.6 %) 152 (3.4 %) 4,459 1980 1,591 (35.2 %) 2,771 (61.4 %) 152 (3.4 %) 4,514 1981 1,575 (34.2 %) 2,852 (62.0 %) 172 (3.8 %) 4,599 1982 1,278 (33.5 %) 2,273 (59.6 %) 263 (6.9 %) 3,814 1983 1,234 (32.4 %) 2,232 (58.6 %) 343 (9.0 %) 3,809 1984 1,098 (28.8 %) 1,885 (49.5 %) 826 (21.7 %) 3,809 1985 681 (18.3 %) 1,589 (42.7 %) 1,448 (39.0 %) 3,718 1986 144 (4.1 %) 1,445 (41.7 %) 1,880 (54.2 %) 3,469 1987 0 1,174 (32.0 %) 2,489 (68.0 %) 3,663 1988 0 770 (21.6 %) 2,793 (78.4 %) 3,563 1989 0 788 (21.5 %) 2,884 (78.5 %) 3,672 1990 0 751 (19.2 %) 3,156 (80.8 %) 3,907 1991 0 531 (13.6 %) 3,381 (86.4 %) 3,912 1992 0 522 (13.1 %) 3,459 (86.9 %) 3,981 1993 0 511 (12.7 %) 3,524 (87.3 %) 4,035 1994 0 493 (12.2 %) 3,544 (87.8 %) 4,037 1995 0 493 (12.2 %) 3,566 (87.8 %) 4,059 1996 0 473 (11.4 %) 3,689 (88.6 %) 4,162 1997 0 449 (10.3 %) 3,887 (89.7 %) 4,336 1998 0 424 (9.5 %) 4,008 (90.5 %) 4,430 1999 0 190 (4.4 %) 4,155 (95.6 %) 4,345
Figures are expressed in 103 tonnes of 100% NaOH per year. a: production capacity as of the end of March of each year b: until 1981 annual production capacity = monthly production capacity x 12 months; since 1982 production capacity = monthly production capacity x 12 months x 0.846 c: 15.4 % = 4.7 % (maintenance and repair) + 10.7 % (day-night fluctuation of power load) Sources: Japan Soda Industry Association (1995; 1999b).
Table 4-26 Supply of the Diaphragm and Ion Exchange Membrane Processes by Japanese Firms
Year Diaphragm Process Ion Exchange Membrane Process 1971 0 0 1972 0 0 1973 0 0 1974 7 0 1975 11 1
202

1976 6 1 1977 1 2 1978 3 1 1979 1 1 1980 0 2 1981 0 4 1982 0 4 1983 0 10 1984 0 10 1985 0 11 1986 0 11 1987 0 9 1988 0 6 1989 0 9 1990 0 2 1991 0 6 1992 0 3 1993 0 7 1994 0 9 1995 0 4 1996 0 12 1997 0 12 1998 0 16 1999 0 11 Total 0 0
Calculation based on Table 4-27, Table 4-28, Table 4-29, Table 4-30, Table 4-31, Table 4-32, and Table 4-33.
Table 4-27 Supply List of the Ion Exchange Membrane Process by Asahi Chemical Industry
Plant Site Start-up Capacity (t NaOH/year)
Asahi Chemical Industry Nobeoka, Japan
1975/77/82/86/91 160,000
Denki Kagaku Kogyo Ohme, Japan
1976 61,000
Saskatoon Chemicals Saskatoon, Canada
1977 30,000
St. Anne Chemicals Nackawic, Canada
1979 10,000
Carter Holt Harvey Pulp and Paper Kinleith, New Zealand
1981 10,000
Tasman Pulp and Paper Kawerau, New Zealand
1982/89 12,000
203
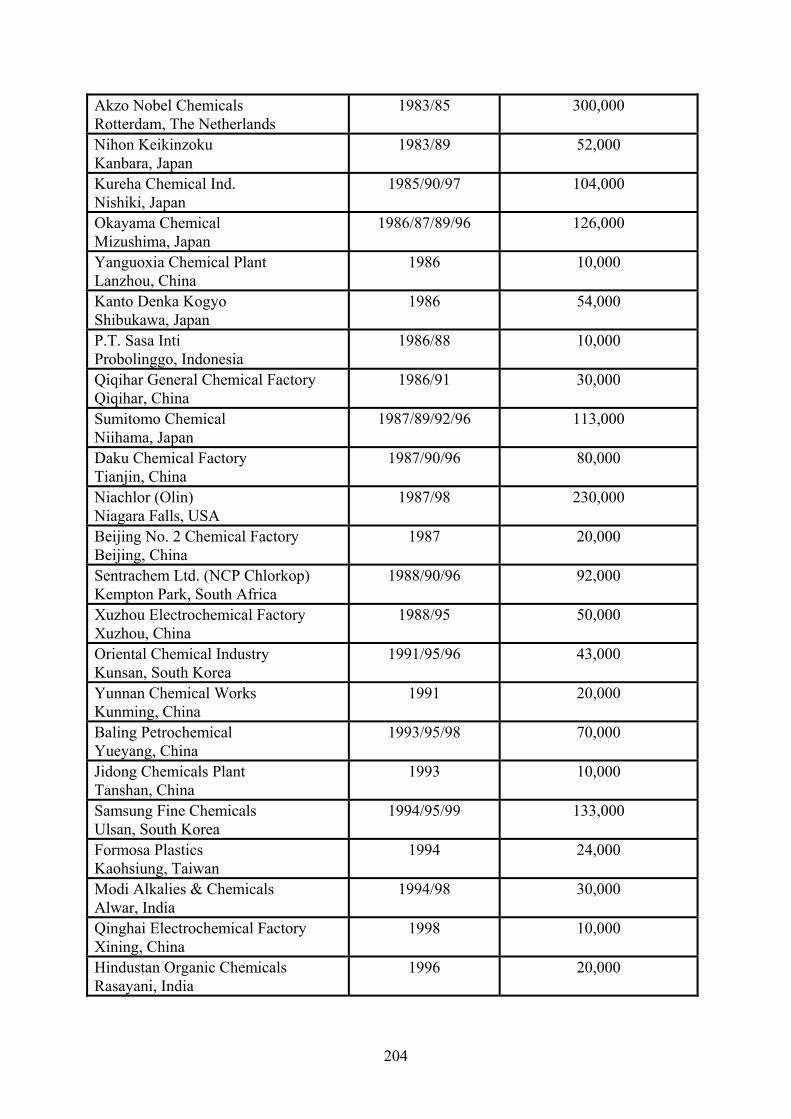
Akzo Nobel Chemicals Rotterdam, The Netherlands
1983/85 300,000
Nihon Keikinzoku Kanbara, Japan
1983/89 52,000
Kureha Chemical Ind. Nishiki, Japan
1985/90/97 104,000
Okayama Chemical Mizushima, Japan
1986/87/89/96 126,000
Yanguoxia Chemical Plant Lanzhou, China
1986 10,000
Kanto Denka Kogyo Shibukawa, Japan
1986 54,000
P.T. Sasa Inti Probolinggo, Indonesia
1986/88 10,000
Qiqihar General Chemical Factory Qiqihar, China
1986/91 30,000
Sumitomo Chemical Niihama, Japan
1987/89/92/96 113,000
Daku Chemical Factory Tianjin, China
1987/90/96 80,000
Niachlor (Olin) Niagara Falls, USA
1987/98 230,000
Beijing No. 2 Chemical Factory Beijing, China
1987 20,000
Sentrachem Ltd. (NCP Chlorkop) Kempton Park, South Africa
1988/90/96 92,000
Xuzhou Electrochemical Factory Xuzhou, China
1988/95 50,000
Oriental Chemical Industry Kunsan, South Korea
1991/95/96 43,000
Yunnan Chemical Works Kunming, China
1991 20,000
Baling Petrochemical Yueyang, China
1993/95/98 70,000
Jidong Chemicals Plant Tanshan, China
1993 10,000
Samsung Fine Chemicals Ulsan, South Korea
1994/95/99 133,000
Formosa Plastics Kaohsiung, Taiwan
1994 24,000
Modi Alkalies & Chemicals Alwar, India
1994/98 30,000
Qinghai Electrochemical Factory Xining, China
1998 10,000
Hindustan Organic Chemicals Rasayani, India
1996 20,000
204

DCM Shriram Consolidated Jhagadia, India
1996 52,000
LG Chemical South Korea
1996/98 200,000
Formosa Plastics Corporation Taiwan
1998 440,000
Xian Chemical Plant Xian, China
1997 40,000
CCM Malaysia
1996 22,000
Confidential
1999 92,000
Nanning Chemical Nanning, China
1998 20,000
Tianjin Chemical Tianjin, China
1998 85,000
Dow Chemical Canada
1997 70,000
Dow Chemical Germany
1998/99 330,000
Fuzhou No. 2 Chemical Plant China
1998 40,000
P.T. Sulfindo Adiusaha Indonesia
1997/98 215,000
Zhejiang Gala Chemical China
1998 20,000
Confidential
1998 540,000
P.T. Pabrik Kertas Tjiwi Kimia Indonesia
1998 22,000
Dow Chemical Stade, Germany
1998 130,000
Dow Chemical Free Port, U.S.A.
1999 550,000
Confidential
1999 80,000
Total 38,896,000 * Acilyzer Process Source: Asahi Chemical Industry (1998).
Table 4-28 Supply List of the Ion Exchange Membrane Process by Asahi Glass
Plant Site Start-up Date Capacity (t NaOH/year)
Asahi Glass Kansai Factory Osaka, Japan
August 1978 10,000
205

Nippon Carbide Toyama, Japan
November 1980 17,000
THASCO Chemical Bangkok, Thailand
July 1981 62,000
Tsurumi Soda Kanagawa, Japan
December 1982 34,000
Kashima Chlorine & Alkali Ibaraki, Japan
July 1983 395,000
Nankai Chemical Industry Kochi, Japan
October 1983 15,000
Kansai Chlor-Alkali Osaka, Japan
April 1984 44,000
Central Chemical Kanagawa, Japan
April 1985 67,000
Mitsubishi Chemical Okayama, Japan
October 1985 127,000
Shin-etsu Chemical Niigata, Japan
November 1985 44,000
Confidential Japan
November 1985 Confidential
Hokkaido Soda Hokkaido, Japan
November 1985 15,000
Yee Fong Chemical & Ind. Taipei, Taiwan
November 1985 46,000
Hokkaido Soda Hokkaido, Japan
May 1986 152,000
Nankai Chemical Industry Wakayama, Japan
May 1986 35,000
Shanghai Tian Yuan Chemical WorksShanghai, China
July 1986 10,000
Asahi Glass Chiba, Japan
September 1986 216,000
Hanwha Chemical Corporation Yeosu, South Korea
April 1987 63,000
Egyptian Petrochemical Company Alexandria, Egypt
September 1987 85,000
Taiwan Chlorine Industry Kaohsiung, Taiwan
April 1988 115,000
ISK Singapore Singapore
January 1989 9,000
Asahimas Subentra Chemical Anyer, Indonesia
June 1989 293,000
Chung Hwa Pulp Corporation Hualien, Taiwan
October 1989 20,000
Mitsubishi Chemical Fukuoka, Japan
October 1989 40,000
206

Thai Plastic & Chemicals Public Rayong, Thailand
November 1989 26,000
Asahi Glass Kashima, Japan
November 1989 124,000
Shanghai Chlor-Alkali Complex Shanghai, China
April 1990 155,000
Hanwha Chemical Corporation Ulsan, Korea
May 1991 134,000
Jin-Hua Chemical Corporation Liao-Ning, China
October 1991 120,000
Solvay France
December 1991 Confidential
Solvay Belgium
April 1992 Confidential
Zhejiang Gala Chemical Zhejian, China
September 1993 33,000
Jiangmen Electrical Chemical Guangdong, China
June 1994 20,000
Tianjin Chemical Plant Tianjin, China
November 1994 25,000
Baoding Electro-Chlorine Factory Hebei, China
September 1995 20,000
Taiyuan General Chem. Ind. Plant Shanxi, China
January 1996 20,000
Vinythai Rayong, Thailand
March 1996 100,000
Bangladesh Chemical Industries Chittagong, Bangladesh
March 1997 7,000
Travancore Cochin Chemicals Kerala, India
May 1997 33,000
Changzhou Chemical Plant Jiangsu, China
May 1997 60,000
Huhhot Chemical General Factory Inner-Mongol, China
July 1997 20,000
THASCO Chemical Rayong, Thailand
October 1997 115,000
Borregaard Industries Sarpsborg, Norway
November 1997 42,000
Jiujiang Chemical Plant Jiangxi, China
December 1997 20,000
Shanghai Chlor-Alkali Complex Shanghai, China
December 1997 100,000
Taixin Xinpu Chemicals Jiangsu, China
May 1998 40,000
Thai Organic Chemicals Rayong, Thailand
June 1998 33,000
207

Asahi Glass Kashima, Japan
July 1998 166,000
Resin Factory of Ping Ding Shan Henan, China
January 1999 20,000
Indupa S.A.I.C. Bahia Blanca, Argentina
March 1999 76,000
THASCO Chemical Rayong, Thailand
July 1999 40,000
Total 27,704,000 * AZEC Process Source: Asahi Glass (1999).
Table 4-29 Supply List of the Ion Exchange Membrane Process by Tokuyama Soda
Plant Site Start-up Date Capacity (t NaOH/year) Tokuyama Soda Tokuyama
1977 10,000
Kokuto Chemical South Korea
1981 3,600
Formosa Plastics Kaohsiung, Taiwan
1982 n/a
Petrochemical Industries Shuaiba, Kuwait
1986 36,000
Dalian Chemical Industry Dalian, China
1987 n/a
* TSE Process Source: Tokuyama (2002).
Table 4-30 Supply List of the Diaphragm Process by CEC
Plant Start-up Date Capacity (NaOH tonne/year)
Technology Type
Asahi Glass Kita-Kyushu, Japan
February 1974 16,300 DS
Ajinomoto Thailand
February 1974 6,000 DS
Sumitomo Chemical Ohita, Japan
September 1974 – March 1976
15,400 DS
Mitsui Toatsu Chemical Nagoya, Japan
December 1974 59,100 DS
Asahi Glass Kashima, Japan
March 1975 160,000 Glanor
Ajinomoto Kawasaki, Japan
April 1975 35,700 DS
Tokuyama Soda Tokuyama, Japan
April 1975 190,400 DS
208

Mitsui Toatsu Chemical Ohmuta, Japan
May 1975 80,200 DS
Toyo Soda Nanyo, Japan
June 1975 156,200 Glanor
Asahi Glass Chiba, Japan
August 1975 180,000 Glanor
Nihon Enka Vinyl Chiba, Japan
November 1975 86,600 DS
Osaka Soda Matsuyama, Japan
November 1975 44,400 DS
Toa Gosei Chemical Tokushima, Japan
February 1976 148,500 DS
Hodogaya Chemical Kohriyama, Japan
February 1976 24,500 DS
Nikkei Kako Kanbara, Japan
February 1976 36,600 DS
Sumitomo Chemical Kikumoto, Japan
March 1976 174,200 Glanor
Toyo Soda Yokkaichi, Japan
June 1976 70,800 DS
Nankai Chemical Tosa, Japan
April 1977 – August 1978
15,700 DS
Veb Chemi Combinat East Germany
July 1978 120,300 DS
BASF West Germany
November 1978 184,100 DS
AECI South Africa
December 1978 18,000 DS
Pechiney Ugine Kuhlmann France
May 1979 58,600 DS
China National Technical Import Corp., P. R. China
June 1988 200,000 DS
Total - 16,652,800 - Source: Chlorine Engineers Corp. (1999b).
Table 4-31 Supply List of the CME Ion Exchange Membrane Process by CEC
Plant Start-up Date Capacity (NaOH tonne/year)
Showa Enso Gushikawa, Japan
November 1980 June 1985
November 1989
2,640 240 240
Osaka Soda Amagasaki, Japan
June 1981 August 1982
1,920 960
Mitsui Toatsu Chemical December 1983 – February 5,880
209

Ohmuta, Japan 1984 April 1988
October 1989 December 1989
2,940 3,420 1,380
Mitsui Toatsu Chemical Nagoya, Japan
November 1984 – June 1985April 1988
October 1989 December 1989
5,880 2,940 1,380 1,380
Mitsui Toatsu Chemical Osaka, Japan
December 1984 December 1985 February 1986 March 1986 May 1986
22,320 7,440 14,880 11,160 3,720
Chemfab Alkalis India
June 1985 September 1988
9,000 4,500
Toa Gosei Chemical Japan
October 1985 December 1985
April 1988
31,320 31,320 3,960
Osaka Soda Kokura, Japan
December 1985 February 1986 December 1987
12,120 13,080
960 Nippon Soda Takaoka, Japan
March 1986 September 1987
54,000 8,520
Kanto Denka Kogyo Mizushima, Japan
April 1986 June 1986
11,760 3,960
Plant A Asia
July 1987 February 1988
8,760 4,380
Toa Gosei Chemical Japan
November 1987 March 1988 March 1988 July 1990
82,800 46,200 1,560 15,960
Bayer Germany
August 1987 792
Hodogaya Chemical Kohriyama, Japan
August 1988 July 1990
13,680 34,200
Solvay Spain
July 1988 1,764
Plant B Japan
October 1988 5,520
Kanegafuchi Chemical Takasago, Japan
August 1989 – March 1990 April 1990 May 1991
139,800 18,840 45,240
Plant C Asia
April 1989 10,320
Plant D U.S.A.
April 1989 10,800
Plant E February 1991 23,040
210

September 1991 3,840 Korea Otsuka Korea
May 1990 21,600
Morro Verde Brazil
November 1992 19,560
FPC U.S.A. U.S.A.
May 1993 684,000
Hukumchand Jute and Ind. India
January 1993 15,660
Ashok Organic Ind. India
July 1993 19,980
Union Ajinomoto Philippine
May 1994 4,320
Vedan Enterprise Vietnam
September 1994 19,800
Vedan Enterprise Vietnam
August 1995 19,800
Ashok Organic Ind. India
March 1996 19,800
Southern Petrochemical Ind. India
July 1996 50,000
Petkim Petrokimya Holding Turkey
December 1996 15,800
Total - 13,064,288 CME: Chlorine Engineers’ Membrane Electrolyzer Source: Chlorine Engineers Corp. (1999a).
Table 4-32 Supply List of the MBC Ion Exchange Membrane Process by CEC
Plant Start-up Date Capacity (NaOH tonne/year)
Mitsui Toatsu Chemical Nagoya, Japan
September 1982 – June 1983 61,680
Tokuyama Soda Tokuyama, Japan
February 1983 – December 1983
191,040
Kanto Denka Kogyo Mizushima, Japan
October 1983 – January 1984 52,920
Mitsui Toatsu Chemical Ohmuta, Japan
December 1983 – March 1984
61,680
Toyo Soda Yokkaichi, Japan
April 1983 – September 1983 58,800
Osaka Soda Matsuyama, Japan
April 1983 – July 1984 36,720
Hodogaya Chemical Kohriyama, Japan
February 1984 – August 1984 35,280
211

Sumitomo Chemical Ohita, Japan
November 1984 14,760
Toa Gosei Chemical Tokushima, Japan
May 1984 – October 1984 31,560
Name withheld by request Japan
April 1984 – December 1984 6,600
Chiba Chlorine & Alkali Chiba, Japan
October 1984 – March 1985 111,480
Ajinomoto Kawasaki, Japan
December 1984 – July 1985 38,160
Name withheld by request Japan
July 1984 5,880
Name withheld by request Overseas
May 1985 1,560
Total - 5,664,960 MBC: Membrane Bag Cell Source: Chlorine Engineers Corp. (1999c).
Table 4-33 Supply List of the BiTAC Ion Exchange Membrane Process by CEC
Plant Start-up Date Capacity (NaOH tonne/year)
Tosoh Japan
April 1992 972
Tosoh Japan
September 1993 1,204
Confidential Japan
February 1994 14,820
Confidential Korea
October 1994 27,000
Tosoh Japan
July 1995 20,000
Confidential Korea
December 1995 35,470
Polifin South Africa
April 1996 22,410
Confidential Japan
August 1996 87,900
Tosoh Japan
December 1996 118,900
Wuxi China
May 1997 30,000
P & G Italy
February 1998 8,382
Tosoh Japan
June 1998 40,000
212

Wuhu China
September 1998 20,000
Bayer U.S.A.
January 1999 320,000
Honghe China
March 1999 50,300
Tosoh Japan
June 1999 96,310
Tosoh Japan
June 1999 325,000
Elite Chemicals Pty. Australia
October 1999 2,880
Total - 9,772,384 BiTAC: Bipole of Tosoh and CEC Source: Chlorine Engineers Corp. (2000).
Table 4-34 Operating Period of the Diaphragm Process at Chlor-Alkali Plants in Japan
Plant Start-up Year of Diaphragm
Process
Conversion to Ion Exchange Membrane
Process
Operating Years of Diaphragm
Process Asahi Glass, Kita-Kyushu 1974 1982 8 Sumitomo Chemical, Ohita 1974 1984 10 Mitsui Toatsu, Nagoya 1974 1984 10 Mitsubishi Gas Chemical, Naniwaa
1974 1984 10
Kanegafuchi Chemical, Takasago 1974 1989 15 Central Chemical, Kawasaki 1974 1985 11 Sanyo Kokusaku Pulp, Iwakunib 1974 1999 25 Showa Enso, Gushikawa 1974 1980 6 Tsurumi Soda, Tsurumi 1974 1982 8 Nippon Soda, Nihongi 1974 1988c 14 Ajinomoto, Kawasaki 1975 1984 9 Tokuyama Soda, Tokuyama 1975 1983 8 Mitsui Toatsu, Ohmuta 1975 1983 8 Nihon Vinyl Chloride, Chibad 1975 1984 9 Osaka Soda, Matsuyama 1975 1983 8 Hokkaido Soda, Tomakomai 1975 1986 11 Shin-etsu Chemical, Naoetsu 1975 1985 10 Osaka Soda, Amagasaki 1975 1981 6 Denki Kagaku Kogyo, Ohme 1975 1976 1 Mitsubishi Monsanto, Yokkaichi 1975 1981e 6 Tekkosha, Sakataf 1975 1986 11 Mitsubishi Chemical, Kurosaki 1975 1989 14 Ryonichi, Mizushimag 1975 1985 10
213

Asahi Glass, Kashima 1975 1989 14 Toyo Soda, Nanyo 1975 1995 20 Asahi Glass, Chiba 1975 1986 11 Kanto Denka Kogyo, Mizushima 1975 1986 11 Chiba Chlorine Chemical, Chiba 1975 1982h 7 Toagosei Chemical, Tokushima 1976 1987 11 Hodogaya Chemical, Kohriyama 1976 1984 8 Nikkei Kako, Kanbara 1976 1983 7 Toyo Soda, Yokkaichi 1976 1983 7 Sumitomo Chemical, Kikumoto 1976 1987 11 Kureha Chemical, Nishiki 1976 1985 9 Nankai Chemical, Tosa 1977 1983 6
Average - - 10.0 a: The Naniwa plant of Mitsubishi Gas Chemical was transferred to Kansai Chlor-Alkali in 1984 (Mitsubishi Gas Chemical, 2001). b: Sanyo Kokusaku Pulp merged with Jujo Paper Industries in 1993, creating Nippon Paper Industries (Nippon Paper Industries, 2001). c: The Nihongi plant of Nippon Soda was shut down in 1988 (Nikkei Kinyu Shinbun, 1987). d: Nihon Vinyl Chloride was renamed to Chiba Chlorine & Alkali in 1985 (Sumitomo Chemical, 1998). e: The Yokkaichi plant of Mitsubishi Monsanto (currently Mitsubishi Chemical MKV) was closed in 1981 (Mitsubishi Chemical MKV, 2001). f: Tekkosha was acquired by Toyo Soda in 1975 (Tosoh, 2001). g: The Mizushima plant of Ryonichi was transferred to Mitsubishi Chemical in 1986 (Mitsubishi Chemical, 2001). h: The Chiba plant of Chiba Chlorine Chemical ceased its operation in 1982 (Nihon Keizai Shinbun, 1982). Sources: Table 4-4 and Table 4-19.
214

5. Environmental Regulation and Technological Change in the
Western European Chlor-Alkali Industry
5.1 Imposition of Emission Standards on Mercury
A serious concern was also growing in Western Europe during the 1960s about the impacts of
mercury on the environment. However, the cause for the concern was the depletion of bird
populations as a consequence of methyl mercury poisoning from seed grain, rather than the
impacts on human health like those observed at the Minamata Bay in Japan. High mercury
concentrations were also found in other wild fauna, particularly in predator species
(Organisation for Economic Co-operation and Development, 1974). As scientific
investigations were initiated, information about the use, disposal, fate and effects of mercury
and mercury compounds grew gradually. Although some of the research results suggested that
inorganic mercury could be transformed into methyl mercury by the action of microorganisms
under aerobic conditions (e.g. Jensen and Jernelov, 1969), there was no report which
confirmed that finding quantitatively. Nevertheless, that prompted fears that regulations
should be imposed on emissions of mercury per se, in addition to methyl mercury, whose
intake to human body caused the Minamata disease. Several policy measures were introduced
in Sweden in the late 1960s to restrain the discharge of mercury from chlor-alkali plants,
requiring these firms to install the “best available technology.” These measures, however, did
not include the setting of quantitative standards for liquid effluents containing mercury
(Organisation for Economic Co-operation and Development, 1974). Similarly, there were no
strict regulations introduced in the 1960s on mercury emissions from chlor-alkali plants in
other countries in Western Europe.
It was in the 1970s that two institutions in Western Europe, namely, the Paris
Commission and the European Community, that began to work almost in parallel to regulate
mercury emissions from chlor-alkali plants based in Western Europe. In the following
sections, we look at these regulations actually introduced by the two institutions.
5.1.1 Paris Commission
At the end of the 1960s and the beginning of the early 1970s, several regional agreements for
the protection of the marine environment surrounding the Western Europe started to be
215

established 81 . With the increasing concern on its impacts on the environment, mercury
became one of the substances which received a special attention in these agreements. In
February 1972, the Convention for the Prevention of Marine Pollution by Dumping from
Ships and Aircraft, the so-called Oslo Convention, was adopted, and mercury was included in
the list of the substances which were prohibited to be dumped into the sea. The prohibition of
the dumping of mercury was extended to a global scale when the Convention on the
Prevention of Marine Pollution by Dumping of Wastes and Other Matter (London Dumping
Convention) was agreed in November 1972.
Negotiations on this issue resulted in the signing of the Convention for the Prevention
of Marine Pollution from Land-Based Sources (Paris Convention) on 4 June 1974
(Convention for the Prevention of Marine Pollution from Land-Based Sources, 1974). The
members of the convention included Denmark, Sweden, France, Norway, The Netherlands,
United Kingdom, Portugal, Spain, Iceland, Germany, Belgium, and Ireland. With the
European Economic Community also joining the convention by adding its signature in June
1975, the Paris Convention finally entered into force in May 197882. As the sea area covered
by the Paris Convention was basically the North-East Atlantic, defined as extending
westwards to the east coast of Greenland, eastwards to the continental North Sea coast, south
to the Straits of Gibraltar and northwards to the North Pole, the maritime area did not include
the Baltic or Mediterranean seas; the Helsinki and Barcelona Conventions applied in these
sea areas83.
The members of the Paris Convention agreed “to eliminate, if necessary by stages, the
pollution of the maritime area from land-based sources by substances listed in Part I of Annex
A to the present Convention” (Convention for the Prevention of Marine Pollution from Land-
Based Sources, 1974). “Pollution from land-based sources” meant the pollution of the
maritime area through watercourses, from the coast, including introduction through
underwater or other pipelines, from man-made structures placed within the limits of the
81 One of the earlier examples is the Agreement for Cooperation in Dealing with Pollution of the North Sea by Oil of 1969 (Bonn Agreement). 82 The Convention for the Protection of the Marine Environment of the North-East Atlantic, the OSPAR Convention, was adopted in September 1992 and entered into force in March 1998. The new Convention replaces the Oslo and Paris Conventions, but Decisions, Recommendations and all other agreements adopted under those Conventions will continue to be applicable, unaltered in their legal nature, unless they are terminated by new measures adopted under the 1992 OSPAR Convention (Convention for the Protection of the Marine Environment of the North-East Atlantic, 1992).
216

maritime area, and by emissions into the atmosphere from land or from man-made structures.
Mercury, along with other substances such as cadmium and organohalogen compounds, was
placed in the “blacklist.” They were selected based on the three criteria, namely, persistence,
toxicity or other noxious properties, and tendency to bio-accumulation. By the time of the
establishment of the convention, it had come to be generally regarded that mercury
compounds possessed all three characteristics.
In order to carry out the undertakings set out in the convention, the member countries,
individually or jointly, had to implement “programmes and measures” (Convention for the
Prevention of Marine Pollution from Land-Based Sources, 1974). They were to include
specific regulations or standards governing the quality of the environment, discharges into the
maritime area, including discharges into watercourses and emissions into the atmosphere
which would affect the maritime area, and the composition and use of substances and
products. The convention stipulated that these programmes and measures should take into
account the latest technical developments and that the programmes should contain time limits
for their completion.
The Paris Commission was created, comprising representatives of each of the members.
The commission then set up a standing scientific group, the Technical Working Group, to
examine and discuss technical issues in detail. The standing scientific groups were usually
assisted in its tasks by preparatory work undertaken by ad hoc or permanent working groups
on specific subjects. The working groups reported on their work to the appropriate standing
technical group, and each standing group in turn reported on its work to the Commission. The
Commission had the power to take decisions and make recommendations, and decisions
could be adopted by unanimity. In the case of programmes and measures, when unanimity
could not be obtained, they nevertheless might be adopted by a qualified majority, but in such
cases they were applicable only to those countries which voted for them (Oslo and Paris
Commissions, 1984).
The Commission conducted several studies on substances, particularly those listed in
the blacklist, that is, the Part I of Annex. During each of these studies the technical groups
tried to determine the origins of the sources of pollution. This was one of the most difficult
tasks because these sources were often diffuse; they were not restricted to sources linked with
83 The Convention on the Protection of the Marine Environment of the Baltic Sea Area was established in 1974 (Helsinki Convention), and the Convention for the Protection and Development of the Marine Environment and Coastal Region of the Mediterranean Sea in 1976 (Barcelona Convention).
217

a certain type of production but also included losses associated with the use and consumption
of other products. The origins of emissions had to be identified before any decision could be
taken regarding programmes and measures, and mercury was no exception.
The sources of mercury emission included chlor-alkali plants, agriculture, dentistry,
electrical apparatus, control instruments, and paints. As Table 5-1 shows, the chlor-alkali
industry was the only sector in which relatively abundant data was available on the
discharges of mercury84.
Table 5-1 Emissions of Mercury in European Countries in the 1970s
Country Chlor-Alkali Industry
Agriculture Dentistry Electrical Apparatus
Control Instruments
Paints
Austria 3,307a n/a n/a n/a n/a n/a Belgium 18,621 n/a n/a n/a n/a n/a Denmark 243 1,114 ~ 3,000 ~ 6,400 ~ 2,000 n/a Finland 1,210 3,540 n/a n/a n/a n/a France 54,281 n/a n/a n/a n/a n/a Germany 101,000b n/a n/a n/a n/a n/a Greece 1,500a n/a n/a n/a n/a n/a Iceland n/a n/a n/a n/a n/a n/a Ireland n/a n/a n/a n/a n/a n/a Italy 155,000c n/a n/a n/a n/a n/a Netherlands ~ 4,800 700 4,500 n/a n/a ~ 150 Norway 2,280 631 n/a n/a n/a n/a Portugal n/a n/a n/a n/a n/a n/a Spain n/a n/a n/a n/a n/a n/a Sweden 2,900 n/a n/a n/a n/a n/a Switzerland 2,650 n/a n/a n/a n/a n/a UK 282,632 n/a n/a n/a n/a n/a Data is of 1975 otherwise noted. Figures are in kilograms. a: 1974 data b: 1971 data c: 1973 data Source: Organisation for Economic Co-operation and Development (1981).
Emitted mercury entered the sea through several pathways, namely via the atmosphere,
rivers, pipelines linked to industry, sewage, and dumped waste. The Paris Commission,
despite the scarcity of relevant data, estimated that the chlor-alkali industry accounted for
84 Note that the data on mercury in the chlor-alkali industry was assembled in different ways. Some countries equated the figures for the consumption of mercury in the chlor-alkali industry with those for mercury supplied to the industry whereas others equated the figures for the chlor-alkali mercury consumption with those for the industry’s mercury emissions. That would make direct comparisons between countries difficult.
218

40 % of the mercury input to the marine environment in the middle of the 1970s (Oslo and
Paris Commissions, 1984). Accordingly, mercury discharges from the chlor-alkali industry
became the primary subject for programmes and measures to be adopted.
As the convention itself did not give any quantitative definition of pollution or a level
of pollution, the programmes and measures to be taken were open to wide interpretation and
possibilities. The majority of the countries favored a policy for elimination of pollution by
imposing strict limits on discharges, that is, by the uniform emission standards approach
(Paris Commission, 1983a). Among the reasons cited for the advantages of applying emission
standards were that emission standards could be based on the “best technical means
available”; that they would enable standards to be imposed on an international basis; that
emission standards would be easily controlled, enabling industry to take the necessary
decisions; and that the emission standard approach would not exclude the use of more
stringent standards if demanded by local conditions.
On the other hand, the United Kingdom and Portugal preferred the adoption of
environmental quality objectives. Under this system, which was concerned with the use of the
receiving waters, rather than the discharges into them, water quality standards were set to
which all discharges would have to conform. The advantages of the environmental quality
objective approach, its supporters argued, were that it would concentrate upon the protection
of the quality of the aquatic environment, the aim and purpose of the convention, after all;
that it would take account of all discharges as well as all natural or background levels of
particular substances; and that it would also take account of the overall conditions of the
water, including its assimilative capacity, and the differences between inland rivers and
turbulent coastal waters.
Despite intensive discussions at several meetings of the Technical Working Group85, it
was not possible to a make a conclusive comparison between the two policies on the basis of
the monitoring data available. In November 1978, at its first meeting, the Paris Commission
therefore decided to follow the dual approach of emission standards and environmental
quality objectives for a period of five years (Paris Commission, 1978a). The agreed line of
action included that there would be a uniform emission standard for mercury discharges from
existing and new plants and that quality objectives for mercury should be formulated for
85 For example, in the Fifth Meeting of the Technical Working Group, a number of questions and arguments were put to the United Kingdom, the main proponent of the EQO approach, which in turn made its response, which was shared by Portugal (Paris Commission, 1977).
219

organisms, as soon as possible for water and, if appropriate, for sediments. The programmes
and measures decided upon in implementing the emission standard approach were carried out
only by the countries applying them, which represented the majority, whereas programmes
and measures for environmental quality objectives were applicable only to the supporters of
this type of policy. The measures regarding new plants, however, were applied to all the
countries, whether the emission standard or environmental quality objective approach was
adopted.
The emission standard approach set maximum values to be applied for mercury
discharges in effluent from existing and new chlor-alkali production plants. These maximum
values differed, depending on the type of plants, namely, those which operate with brine used
only once, generating more mercury emissions, or those with recycled brine. Furthermore,
different maximum values were adopted according to whether they were to be applied at the
outlet from the whole production site or at the outlet from the treatment plant. While many of
the measures adopted were binding decisions, recommendations were used in cases where an
agreement on binding decisions was difficult to reach.
The first decision on limit values was made at the second meeting in June 1980 as
PARCOM Decision 80/2. Table 5-2 gives the limit values for mercury emissions in water
from existing and new brine-recirculation chlor-alkali plants. In particular, the limit value, as
a monthly mean, was fixed at 0.5 g of mercury per tonne of chlorine production capacity.
These limit values were to apply from July 1, 1983, provided that limit values for waste brine
plants have been agreed by that date. As it was acknowledged that discharges from the factory
site as a whole could greatly exceed the emissions at the exit of the treatment unit, the
Commission asked the Working Group on Mercury Pollution to make proposals for limit
values for chlor-alkali factory sites, which would cover all mercury-containing waste water
streams.
Table 5-2 PARCOM Decision 80/2 on Limit Values for Mercury Emissions in Water from Existing and New Brine Recirculation Chloralkali Plants (exit of the purification plant)
Limits, expressed as maximum concentration of
mercury
Limit, expressed as maximum amount of
mercury
Deadline for existing emissions
Remarks
The limits, expressed as maximum concentration of mercury, are calculated by dividing the limits
0.5 g of mercury per metric tonne of chlorine production capacity as a monthly
1 July 1983 The limits given in the preceding columns are applicable to the mercury arising from
220
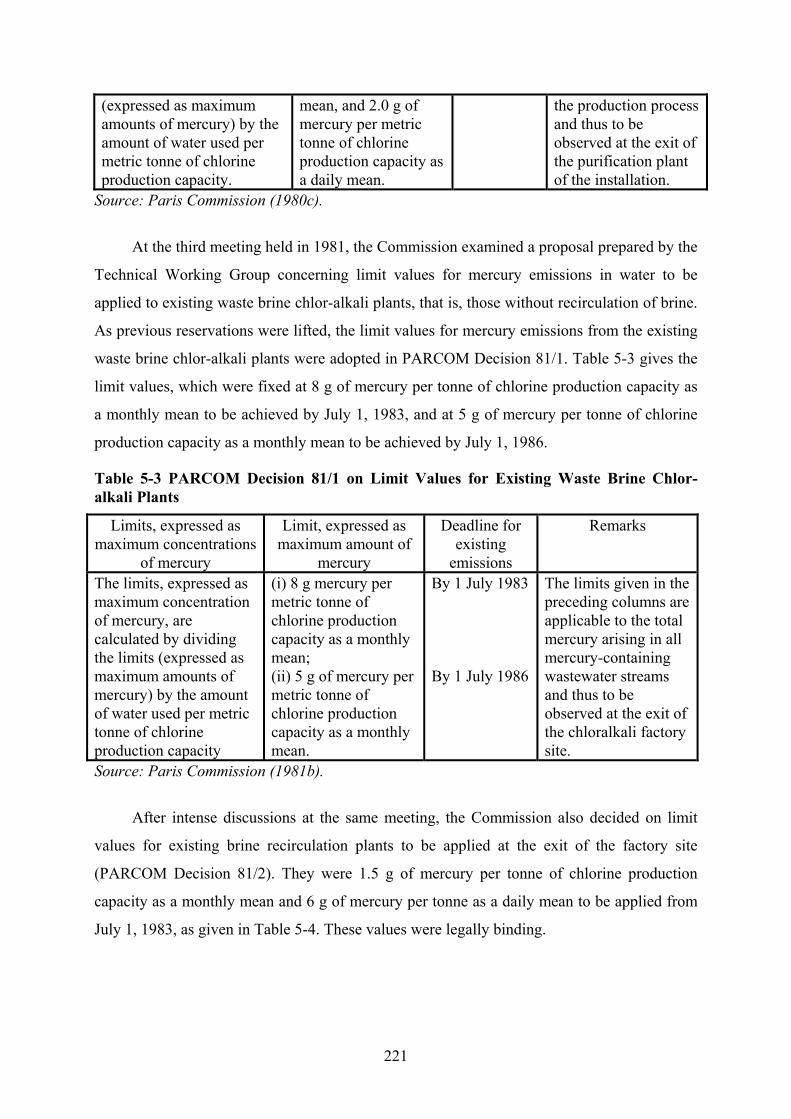
(expressed as maximum amounts of mercury) by the amount of water used per metric tonne of chlorine production capacity.
mean, and 2.0 g of mercury per metric tonne of chlorine production capacity as a daily mean.
the production process and thus to be observed at the exit of the purification plant of the installation.
Source: Paris Commission (1980c).
At the third meeting held in 1981, the Commission examined a proposal prepared by the
Technical Working Group concerning limit values for mercury emissions in water to be
applied to existing waste brine chlor-alkali plants, that is, those without recirculation of brine.
As previous reservations were lifted, the limit values for mercury emissions from the existing
waste brine chlor-alkali plants were adopted in PARCOM Decision 81/1. Table 5-3 gives the
limit values, which were fixed at 8 g of mercury per tonne of chlorine production capacity as
a monthly mean to be achieved by July 1, 1983, and at 5 g of mercury per tonne of chlorine
production capacity as a monthly mean to be achieved by July 1, 1986.
Table 5-3 PARCOM Decision 81/1 on Limit Values for Existing Waste Brine Chlor-alkali Plants
Limits, expressed as maximum concentrations
of mercury
Limit, expressed as maximum amount of
mercury
Deadline for existing
emissions
Remarks
The limits, expressed as maximum concentration of mercury, are calculated by dividing the limits (expressed as maximum amounts of mercury) by the amount of water used per metric tonne of chlorine production capacity
(i) 8 g mercury per metric tonne of chlorine production capacity as a monthly mean; (ii) 5 g of mercury per metric tonne of chlorine production capacity as a monthly mean.
By 1 July 1983 By 1 July 1986
The limits given in the preceding columns are applicable to the total mercury arising in all mercury-containing wastewater streams and thus to be observed at the exit of the chloralkali factory site.
Source: Paris Commission (1981b).
After intense discussions at the same meeting, the Commission also decided on limit
values for existing brine recirculation plants to be applied at the exit of the factory site
(PARCOM Decision 81/2). They were 1.5 g of mercury per tonne of chlorine production
capacity as a monthly mean and 6 g of mercury per tonne as a daily mean to be applied from
July 1, 1983, as given in Table 5-4. These values were legally binding.
221

Table 5-4 PARCOM Decision 81/2 on Limit Values for Existing Brine Recirculation Chlor-Alkali Plants (exit of the factory site)
Limit values, expressed as maximum concentration
of mercury
Limit values, expressed as maximum amount of
mercury
Deadline for existing emissions
Remarks
The limit values, expressed as maximum concentration of mercury, as calculated by dividing the values in column 2 (expressed as maximum amounts of mercury) by the amount of water used per metric tonne of chlorine production capacity
1.5 g of mercury per metric tonne of chlorine production capacity as a monthly mean, and 6 g of mercury per metric tonne of chlorine production capacity as a daily mean.
1 July 1983 The limit values given in the preceding columns are applicable to the total mercury arising in all mercury-containing wastewater streams and thus to be observed at the exit of the chloralkali factory site.
Source: Paris Commission (1981a).
Regarding the existing brine-recirculation chlor-alkali plants, the Commission had
actually proposed the adoption of more stringent limit values to be applied from July 1, 1986:
0.5 g of mercury per tonne of chlorine production capacity as a monthly mean and 2 g of
mercury per tonne as a daily mean at the exit of the factory site. The Technical Working
Group had considered these proposals and had recommended that the Commission should
adopt the limit values as legally binding. While most of the countries were in favor of a
legally binding decision on the limit values, the EEC reserved its position, because the
proposed standards were more stringent than those in the relevant EEC Directive, and Spain
also claimed that it was not able to accept the adoption of a more stringent limit value (Paris
Commission, 1985c). In 1985, the Commission finally agreed to recommend the values
referred above to the member countries, with the exception of Spain, which maintained a
reservation (PARCOM Recommendation 85/1).
Table 5-5 PARCOM Recommendation 85/1 on Limit Values for Mercury Emissions in Water from Existing Brine Recirculation Chlor-Alkali Plants (exit of factory site)
Limit values, expressed as maximum amount of mercury
Deadline for existing emissions
Remark
0.5 g of mercury of chlorine production capacity as a monthly mean 2 g of mercury per tonne as a daily mean
1 July 1986 The limit values are applicable to the total mercury arising in all mercury-containing wastewater streams and thus to be observed at the exit of the chlor-alkali factory site.
Source: Paris Commission (1985b).
222

In the meantime, since the environmental quality objective approach was also approved
in 1978 along with the uniform emission standards approach, a task had been left to the
Commission to set environmental standards for organisms, water and sediments with regard
to quality objectives for mercury. In 1980, the Commission adopted its first environmental
standards to be applied for organisms (PARCOM Decision 80/1). Based on the Technical
Working Group’s recommendation, it was decided that a standard of 0.3 mg/kg of mercury in
wet fish flesh should be the environmental standard for organisms.
PARCOM Decision 80/1 on Environmental Quality Standard for Mercury in
Organisms
The Commission adopted TWG’s recommendation that a standard of 0.3 g mg/kg
of mercury in wet fish flesh should be the environmental standard for organisms.
Source: Paris Commission (1980b).
Regarding the environmental quality objectives for water and sediments, the Technical
Working Group had been unable to make progress on an environmental standard for water or
on whether an environmental standard for sediments was appropriate. Then the Commission,
after intensive discussions, confirmed its approval in principle of a “standstill” principle for
water, that is, that the concentrations in water should not increase (Paris Commission, 1980a).
Those countries having adopted the environmental quality objective approach were asked to
submit data to the Commission every year on the emission standards fixed in order to respect
the quality objectives. In the case of the United Kingdom, the emission standards were set in
the range of 0 – 20 g of mercury per tonne of chlorine production capacity (Paris Commission,
1985a).
Concerning new plants, the Commission made a recommendation as early as 1978 that
new waste-brine plants should not be built in the future (PARCOM Recommendation 78/1).
PARCOM Recommendation 78/1
(b) The Commission recommends that no new waste-brine plans should be built.
Source: Paris Commission (1978b).
By the third meeting held in 1981, the Technical Working Group had not been able to
decide whether the limit values for new plants should be 0.5 g or 1 g of mercury per tonne of
chlorine production capacity (Paris Commission, 1983b). During the meeting, all countries
223
except France were able to agree that in the construction of new plants account must be taken
of the best technical means available to prevent pollution of the maritime area by mercury and
were prepared to agree on the limit value of 0.5 g per tonne for new brine-recirculation plants.
France argued that a global programme should be adopted, covering both the environmental
quality objective and the emission standard approaches as well as prohibiting the construction
of new waste-brine plants. With the reservation of France, the Commission was not able to
reach a decision on this issue. Nevertheless, the previous recommendation that no new waste-
brine plants should be built was maintained.
At the same meeting, the Commission asked the Working Group on Mercury Pollution
to make an evaluation of mercury-free chlor-alkali production technologies. The Working
Group expressed its opinion that the ion exchange membrane process was very interesting
from the economic viewpoint as well as from the environmental aspect. Accordingly, the
Technical Working Group agreed to recommend to the Commission that, when the
construction of new plants was considered, the use of the ion exchange membrane process
should be encouraged whenever circumstances permit. Furthermore, it was also recommended
that when major changes were to take place in the existing mercury-based plants, replacement
with the ion exchange membrane process should be considered.
With the recommendations of the Mercury Working Group and the Technical Working
Group on the feasibility of the ion exchange membrane process, the Commission discussed in
its fourth meeting held in June 1982 whether it would be feasible to impose a prohibition on
the mercury process in the construction of new chlor-alkali electrolysis plants (Paris
Commission, 1984). Although some support was expressed for the eventual phasing out of the
mercury process, a number of delegations expressed reservations on a total prohibition at the
present time. It was pointed out that the new plants with the ion exchange membrane process
being constructed in the Netherlands and Portugal at that time were, although promising, not
yet operational and that consequently it would be wise to wait for actual experience with this
new technology. In addition, it was expected that experience in countries outside Europe
would also become available.
In the end, the Commission made a decision, which was to be effective from July 1,
1982, that authorizations for new plants 86 might be granted only if such authorizations
86 “New plants” means existing industrial plants whose capacity for the electrolysis of alkali chlorides was to be substantially increased after July 1, 1982, as well as industrial plants which would become operational after July 1, 1982 (Paris Commission, 1982).
224

included a reference to the standards corresponding to the “best technical means available”
for preventing discharges of mercury (PARCOM Decision 82/1). According to the
Commission, the application of the best technical means available would make it possible to
limit discharges of mercury from the site of a new industrial plant using the recycled-brine
process to less than 0.5 g/tonne of installed chlorine production capacity. These arrangements
for the authorization of new plants had to be applied by all members, whether they followed
the environmental quality objective or the emission standard approach.
Table 5-6 PARCOM Decision 82/1 on New Chloralkali Plants using Mercury Cells
Condition for authorization of new plants
Achievable level of discharges of mercury
Date for the decision to be effective
Application of the best technical means available
Less than 0.5 g/tonne of installed chlorine production capacity
1 July 1982
Source: Paris Commission (1982).
Furthermore, the Commission agreed that when the construction of new plants was
being considered, the use of mercury-free technologies, particularly the ion exchange
membrane process, should be encouraged whenever circumstances permitted. It was also
decided that the Commission would consider again later whether stricter rules, including the
possibility of prohibiting the use of the mercury process, would be appropriate. The Technical
Working Group examined the latest information available on the development of alternative
technologies and confirmed its earlier opinion that from the technical point of view mercury-
free production processes should be encouraged whenever new plants were constructed. At
the Commission’s meeting held in 1985, however, three countries did not accept the
strengthening of the measures on the use of mercury-free technologies, and the Commission’s
earlier recommendation was retained unchanged (Paris Commission, 1985c).
5.1.2 European Community
The work of the Paris Commission was carried out more or less in parallel with a similar
work conducted by the Commission of the European Communities. The differences between
the work of the two organizations have been recognized, and it was particularly emphasized
that that the Paris Commission considered pollution specifically from the point of view of
protecting the marine environment. Nevertheless, a significant degree of duplication has been
225

observed in the regulations of the two organizations, including those issued on mercury
emissions from chlor-alkali plants.
In November 1973, the European Community adopted its First Action Programme on
the Environment (Council of the European Communities, 1973). The Action Programme
indicated that a detailed examination would be carried out of the different possible methods,
such as establishing discharges or emission standards, in order to achieve and respect the
quality objectives fixed with regard to water pollution. The programme stated that priority
would be given to the regulation of discharges of toxic, persistent and bioaccumulative
substances into fresh water.
In order to meet these objectives, the Council of the European Communities started to
adopt a series of Directives 87 proposed by the Commission. In May 1976, the Council
approved a directive on pollution caused by certain dangerous substances discharged into the
aquatic environment of the Community (Council of the European Communities, 1976).
Directive 76/464/EEC identified the most dangerous substances, including mercury, in the
“List I” or “blacklist” and established the basic principle according to which any discharge of
a blacklist substance must be authorized beforehand by the relevant authority in the member
countries. This authorization, which could only be granted for a limited period, was required
to lay down an emission standard to be respected. As in the case of the Paris Commission, the
Council agreed in this directive that, parallel to the emissions standards, quality objectives
should also be established for substances on the blacklist. While this parallel approach was
formally adopted, the directive indicated clearly that as a general rule the emission standards
should be applied. This framework directive established the basic principles of regulations on
aquatic pollution in the Community and was followed by a number of implementing
directives.
In June 1979, the Commission, in accordance with the agreement reached in the parent
Directive 76/464, submitted to the Council two specific proposals for directives concerning
emission standards and quality objectives respectively to be applied to mercury discharges by
the chlor-alkali industry. In March 1982, after long and difficult negotiations, the Council
finally adopted a single directive, Directive 82/176, which contained limit values and quality
objectives, together with methods of measurement and monitoring, concerning mercury
87 Article 189 of the Treaty of Rome indicates that “[a] directive shall be binding, as to the result to be achieved, upon each Member State to which it is addressed, but shall leave to the national authorities the choice of form and methods” (Craig and de Burca, 1995).
226

emissions from chlor-alkali plants (Council of the European Communities, 1982). This
directive, concerned with only one substance discharged by only one manufacturing
process,88 was the first of the daughter directives resulting from the framework Directive
76/464 on water pollution caused by dangerous substances89.
The limit values and the time limits by which they were to be complied with are given
in Table 5-7. The authorizations issued by the member countries had to contain provisions at
least as stringent as these limit values and were to be reviewed at least every four years.
Different limit values were laid down for plants using the lost brine and recycled brine
processes. The limit values for mercury discharges were expressed in two ways, namely, in
terms of concentration and quantity. The directive stated that the limit values expressed in
terms of concentration should, in principle, not be exceeded. However, because the
concentration of mercury in effluent depends on the volume of water involved, which varies
with different processes and plants, the limit values expressed in terms of quantity in relation
to installed chlorine capacity had to be observed in all cases. The limit values were expressed
as monthly average, and daily average limit values were specified as four times the
corresponding monthly average values.
Table 5-7 Limit Values for Mercury Discharges by the Chlor-Alkali Industry in the Council Directive 82/176/EEC
Limit values (monthly average)Unit of measurement 1 July 1983 1 July 1986
Remarks
Concentration for recycled and lost brine plants (micrograms of mercury per litter)
75 µg/l 50 µg/l Applicable to the total quantity of mercury present in all mercury-containing water discharged from the site of the industrial plant
Quantity for recycled brine plants (grams of mercury per tonne of installed chlorine production capacity)
0.5 g/t
1.5 g /t
0.5 g/t
1.0 g/t
Applicable to the mercury present in effluent discharged from the chlorine production unit Applicable to the total quantity of mercury present in all mercury-containing water discharged from the
88 A separate directive was adopted in March 1984 (Directive 84/156/EEC), which covered mercury discharges by sectors other than the chlor-alkali industry (Council of the European Communities, 1984a). 89 As regards other dangerous substances, a directive on limit values and quality objectives for cadmium discharges (Directive 83/513/EEC) was adopted in September 1983 (Council of the European Communities, 1983). Another directive was adopted in October 1984 for discharges of hexachlorocyclohexane (Directive 84/491/EEC) (Council of the European Communities, 1984b).
227

site of the industrial plant Quantity for lost brine plants (grams of mercury per tonne of installed chlorine production capacity)
8.0 g/t 5.0 g/t Applicable to the total quantity of mercury present in all mercury-containing water discharged from the site of the industrial plant
Source: Council of the European Communities (1982).
Four quality objectives for mercury concentrations were set in the directive, as laid
down in Table 5-8. Those countries which adopted the environmental quality objective
approach were required to fix emission standards so that the appropriate quality objectives
would be complied with in the area affected by discharges of mercury from the chlor-alkali
industry. The directive also stipulated that the concentration of mercury in sediments or in
shellfish should not increase significantly with time. Furthermore, the quality of the waters
had to be sufficient to comply with the requirements of any other directive applicable to such
waters as regards the presence of mercury.
Table 5-8 Quality Objectives for Mercury Discharges by the Chlor-Alkali Industry in the Council Directive 82/176/EEC
Organism/water Quality objective Fish 0.3 mg/kg wet flesh Inland surface waters 1 µg/l Estuary waters 0.5 µg/l Territorial sea waters and internal coastal waters 0.3 µg/l Concentrations of mercury in waters are arithmetic means of the results obtained over a year. Source: Council of the European Communities (1982).
The directive made it clear that countries could grant authorizations for new plants only
if such authorizations contain a reference to the standards corresponding to the best technical
means available for preventing discharges of mercury. The directive included a statement of
the Council and Commission, while not legally forming part of the directive, that “the
application of the best technical means available makes it possible to limit discharges of
mercury from the site of a new industrial plant using the recycled-brine process to less than
0.5 g/tonne of installed chlorine production capacity” (Council of the European Communities,
1982). A country, where for technical reasons the intended measures did not conform to the
best technical means available, was required to provide the Commission with the
justifications for these reasons.
228

The treatment of new plants was an issue of particular importance in the process of
formulating the directive (Haigh, 1987). Originally the Commission proposed limit values for
new plants set at the level to be achieved by recycled brine plants in July 1989 whereas the
proposal for quality objectives made no such reference. France and Italy, on the one hand,
argued that, if a country applying quality objectives did not have to apply the limit values that
would otherwise apply in the case of a new plant, there would be distortion of competition.
The United Kingdom, on the other hand, thought it was important to uphold the principle
underlying the use of quality objectives; that is, the emission standard to be applied to any
plant, whether new or not, should be related to the quality to be met in the receiving waters.
The resultant compromise was the directive which actually avoided requiring best technical
means to be used, but in effect creating an atmosphere in which it would be very difficult not
to use them. It was implicitly understood that it would be unrealistic to build a new plant
which did not make use of processes based on the best technical means available.
These regulations, including the Decisions, Recommendations, and Directives, imposed
since the 1970s were aimed at reducing mercury emissions to water by basically using
measures of the end-of-pipe type. It was in the late 1980s that atmospheric emissions of
mercury started to become the target of regulations. In 1988 the Paris Commission decided
that its work on atmospheric emissions should concentrate on measures aimed at limiting the
emissions of heavy metals and established the Atmospheric Inputs Working Group (Paris
Commission, 1989). The Commission made discussions in the following year on a draft of a
decision on reducing atmospheric emissions of mercury from the existing chlor-alkali plants.
The draft specified a standard of 2 g of mercury per tonne of chlorine capacity for emissions
to the atmosphere, including mercury in hydrogen released to the atmosphere or burnt. This
standard was to be complied with by the end of 1994 unless there was a firm commitment that
the plant would be converted to a mercury-free process by the year 2000. The draft also
included a recommendation for a complete phasing out of the mercury process by 2010 (Paris
Commission, 1990). As it was pointed out, however, that all countries were already obliged to
use the best technical means and that the technology necessary to achieve the envisaged
reductions was available, the Commission could not agree on the decision.
Meanwhile, environmental ministers from the North Sea coastal countries convened in
The Hague, the Netherlands, in March 1990 for the Third International Conference on the
229

Protection of the North Sea (INSC)90. The principal task of the conference was to review the
implementation of commitments made at the first and second conferences, held in Bremen in
1984 and London in 1987, respectively91. A list of 36 hazardous substances was identified
with the target of 50% or more reduction between 1985 and 1995, and, in particular, a 70%
reduction target was established for the most dangerous substances to the environment,
namely, dioxins, cadmium, lead, and mercury. The adopted Hague Declaration included what
went beyond the regulations of the Paris Commission or the European Commission in regard
to mercury emissions from chlor-alkali plants. That is, the environmental ministers agreed
that existing mercury-based plants should be phased out as soon as practicable on a national
basis with the objective that they should be phased out completely by 2010. It was decided
that mercury plants should be required to meet by 1996 a limit value of 2 g of mercury per
tonne of chlorine capacity for emissions to the atmosphere, including those in hydrogen,
unless there was a firm commitment that the plant would be converted to a mercury-free
process by the year 2000 (Third International Conference on the Protection of the North Sea,
1990). While this declaration was not legally binding, it represented a political commitment
by the environmental ministers92.
Several months later, following the measures agreed in the Hague Declaration, the Paris
Commission adopted a decision, PARCOM Decision 90/3. A limit value of 2 g of mercury
per tonne of chlorine capacity was specified for the atmospheric mercury emissions, including
mercury in hydrogen. And, most significantly, the decision recommended that existing
mercury plants should be completely phased out by 2010. It was formulated as a
recommendation because a number of member countries, during negotiations at the Paris
Commission, were not able to accept the proposed phase-out in the form of a PARCOM
Decision.
90 The participating countries were Belgium, Denmark, France, Germany, Netherlands, Norway, Sweden and the United Kingdom, joined for the first time by Switzerland. 91 The history of INSC started in 1983, when the German government proposed an international conference for the protection of the North Sea environment at ministerial level. The purpose was to make a political declaration which would stimulate and further ongoing work within the existing international conventions, including the Paris Convention, rather than to create another set of international agreements. For details, see Ehlers (1990). 92 Skjærseth (1998) argues that by excluding the least ambitious countries and focusing political pressure at the ministerial level, it was possible to adopt stringent international commitments that did not merely reflect the interests and preferences of the least ambitious members. Similarly, Haas (1993) argues that collective pollution control efforts for the North Sea have developed through a “leader-laggard dynamic.”
230
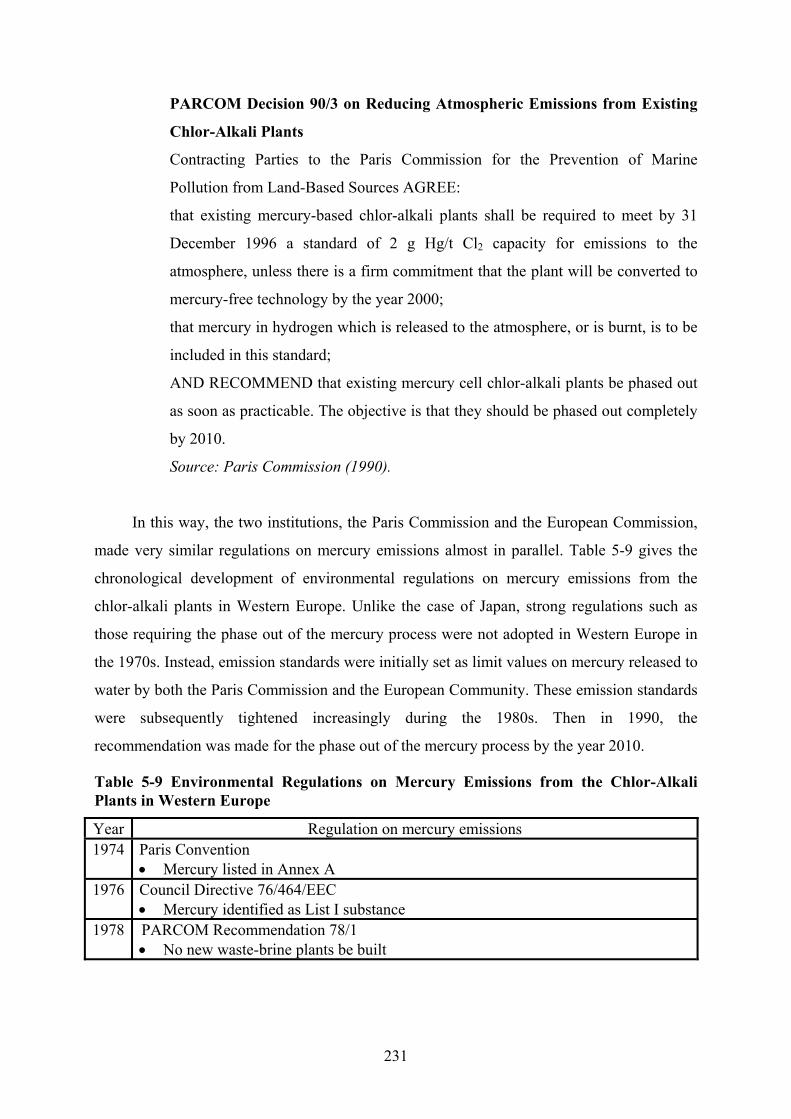
PARCOM Decision 90/3 on Reducing Atmospheric Emissions from Existing
Chlor-Alkali Plants
Contracting Parties to the Paris Commission for the Prevention of Marine
Pollution from Land-Based Sources AGREE:
that existing mercury-based chlor-alkali plants shall be required to meet by 31
December 1996 a standard of 2 g Hg/t Cl2 capacity for emissions to the
atmosphere, unless there is a firm commitment that the plant will be converted to
mercury-free technology by the year 2000;
that mercury in hydrogen which is released to the atmosphere, or is burnt, is to be
included in this standard;
AND RECOMMEND that existing mercury cell chlor-alkali plants be phased out
as soon as practicable. The objective is that they should be phased out completely
by 2010.
Source: Paris Commission (1990).
In this way, the two institutions, the Paris Commission and the European Commission,
made very similar regulations on mercury emissions almost in parallel. Table 5-9 gives the
chronological development of environmental regulations on mercury emissions from the
chlor-alkali plants in Western Europe. Unlike the case of Japan, strong regulations such as
those requiring the phase out of the mercury process were not adopted in Western Europe in
the 1970s. Instead, emission standards were initially set as limit values on mercury released to
water by both the Paris Commission and the European Community. These emission standards
were subsequently tightened increasingly during the 1980s. Then in 1990, the
recommendation was made for the phase out of the mercury process by the year 2010.
Table 5-9 Environmental Regulations on Mercury Emissions from the Chlor-Alkali Plants in Western Europe
Year Regulation on mercury emissions 1974 Paris Convention
• Mercury listed in Annex A 1976 Council Directive 76/464/EEC
• Mercury identified as List I substance 1978 PARCOM Recommendation 78/1
• No new waste-brine plants be built
231
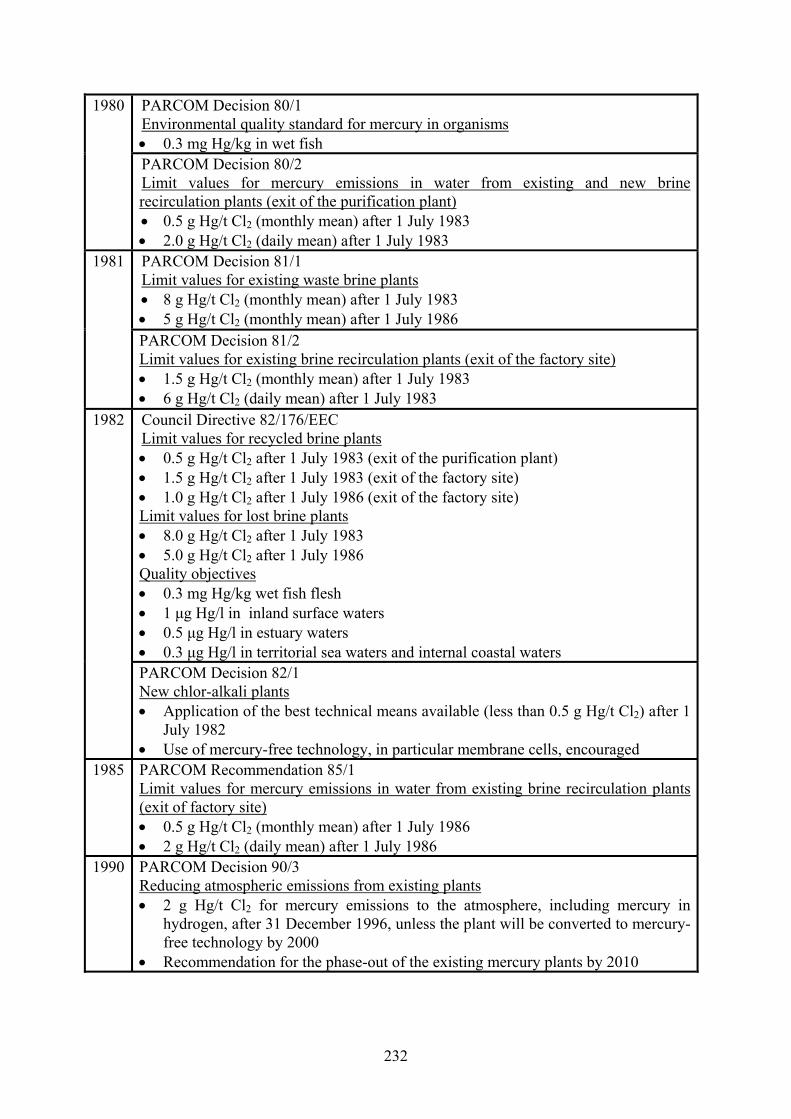
PARCOM Decision 80/1 Environmental quality standard for mercury in organisms • 0.3 mg Hg/kg in wet fish
1980
PARCOM Decision 80/2 Limit values for mercury emissions in water from existing and new brine recirculation plants (exit of the purification plant) • 0.5 g Hg/t Cl2 (monthly mean) after 1 July 1983 • 2.0 g Hg/t Cl2 (daily mean) after 1 July 1983 PARCOM Decision 81/1 Limit values for existing waste brine plants • 8 g Hg/t Cl2 (monthly mean) after 1 July 1983 • 5 g Hg/t Cl2 (monthly mean) after 1 July 1986
1981
PARCOM Decision 81/2 Limit values for existing brine recirculation plants (exit of the factory site) • 1.5 g Hg/t Cl2 (monthly mean) after 1 July 1983 • 6 g Hg/t Cl2 (daily mean) after 1 July 1983 Council Directive 82/176/EEC Limit values for recycled brine plants • 0.5 g Hg/t Cl2 after 1 July 1983 (exit of the purification plant) • 1.5 g Hg/t Cl2 after 1 July 1983 (exit of the factory site) • 1.0 g Hg/t Cl2 after 1 July 1986 (exit of the factory site) Limit values for lost brine plants • 8.0 g Hg/t Cl2 after 1 July 1983 • 5.0 g Hg/t Cl2 after 1 July 1986 Quality objectives • 0.3 mg Hg/kg wet fish flesh • 1 µg Hg/l in inland surface waters • 0.5 µg Hg/l in estuary waters • 0.3 µg Hg/l in territorial sea waters and internal coastal waters
1982
PARCOM Decision 82/1 New chlor-alkali plants • Application of the best technical means available (less than 0.5 g Hg/t Cl2) after 1
July 1982 • Use of mercury-free technology, in particular membrane cells, encouraged
1985 PARCOM Recommendation 85/1 Limit values for mercury emissions in water from existing brine recirculation plants (exit of factory site) • 0.5 g Hg/t Cl2 (monthly mean) after 1 July 1986 • 2 g Hg/t Cl2 (daily mean) after 1 July 1986
1990 PARCOM Decision 90/3 Reducing atmospheric emissions from existing plants • 2 g Hg/t Cl2 for mercury emissions to the atmosphere, including mercury in
hydrogen, after 31 December 1996, unless the plant will be converted to mercury-free technology by 2000
• Recommendation for the phase-out of the existing mercury plants by 2010
232
5.2 Reduction of Mercury Emissions with End-of-Pipe Technologies
5.2.1 Patents on Chlor-Alkali Production Technologies
With the imposition of these regulations, which mainly involved emission standards, chlor-
alkali producers operating the mercury process in Western Europe were required to reduce
mercury emissions. In the 1970s, their emissions accounted for a major share of the total
mercury emissions to the environment. As we have discussed above, there are basically two
types of technologies to reduce emissions from the production process, that is, the end-of-pipe
technology and the clean technology. Accordingly, two technological options were available
to the operators of the mercury process for the abatement of mercury emissions. One option
was to adopt end-of-pipe technologies to reduce mercury emissions and then to continue to
rely on the mercury process for chlor-alkali production. The other option was to convert the
mercury process to a clean technology. As we have seen in the case of technological change
in the Japanese chlor-alkali industry, the diaphragm process and the ion exchange membrane
process could be alternative production processes.
To see what kinds of technologies were developed in Western Europe, we examined
successful patent applications by Western European companies. As there are major
differences among countries in procedures and criteria for granting patents (Patel and Pavitt,
1995), international comparisons are most reliable when international patenting or patenting
in one country is used. In Western Europe, with the entry into force of the European Patent
Convention on 7 October 1977, the first European patent applications were received on 1 June
1978, and subsequently the European patents were granted for the first time in 1980
(European Patent Office, 2000). Therefore, the European patents are not suitable for
examining patents applied in the 1970s, a period which is crucial for our examination of the
development of chlor-alkali technologies in Western Europe.
We instead used the US patents for our research because the US patent database is a
neutral source of information, which covers patents applied since the beginning of the 1970s.
Also, companies in Western Europe are reasonably expected to have strong incentives to
obtain patent protection in the world’s largest market for their technologies, which can be
adopted all over the world. Data was obtained from the web-based patent database of the US
Patent and Trademark Office93. The patents included in this database were those issued in the
93 The URL is http://www.uspto.gov/patft/index.html.
233

period from January 1, 1976, to December 31, 1998. For patents issued in the period from
1971 to 1975, we used the web-based database of the IBM Intellectual Property Network94.
Relevant patents were identified by using the International Patent Classification (IPC).
The IPC, in its sixth edition, divides various types of technology into eight sectors with
approximately 67,000 subdivisions, each of which has a symbol consisting of Arabic
numerals and letters of the Latin alphabet. The appropriate IPC symbols are indicated on each
patent document. In this study, we examined patents included in the following classes:
• C25B-1/16 Electrolytic production of alkali metal hydroxides
• C25B-1/26 Electrolytic production of chlorine or compounds thereof
• C25B-1/34 Simultaneous production of alkali metal hydroxides and chlorine,
its oxyacids or salts
• C25B-1/36 • in mercury cathode cells
• C25B-1/38 • • with vertical mercury cathode
• C25B-1/40 • • with horizontal mercury cathode
• C25B-1/42 • • Decomposition of amalgams
• C25B-1/44 • • • with the aid of catalysts
• C25B-1/46 • in diaphragm cells
In the first edition of IPC, which entered into force on September 1, 1968, the above-
mentioned classes did not exist. Instead, they were classified in the following way:
• C01B-7/06 Preparation of chlorine by electrolysis
• C01D-1/06 Preparation of hydroxides of sodium and/or potassium by
electrolysis
• C01D-1/08 • with the aid of a liquid cathode
• C01D-1/10 • • with a vertical cathode
• C01D-1/12 • • with a horizontal cathode
• C01D-1/14 • • Regulating the distance between the solid anode(s) and the
liquid cathode
• C01D-1/16 • • Working up the amalgam
• C01D-1/18 • • • with the aid of catalysts
Accordingly, we used the above patent classes for patents issued from 1971 to 1975.
94 The database is currently called the Delphion Intellectual Property Network. The URL is http://www.delphion.com/home.
234

These patent classes, however, include patents on other areas than the electrolytic
production of sodium hydroxide, which is just one type of alkali metal hydroxides, and
chlorine. For example, the class of C25B-1/16 includes patents related to the electrolytic
production of potassium hydroxide, and the class of C25B-1/24 includes patents on the
electrolytic production of hypochlorite. Thus, by examining all the patent documents one by
one, we excluded inappropriate patents from our analysis. Then we divided patents on the
electrolytic production of sodium hydroxide and chlorine into the three categories of the
mercury process, the diaphragm process, the ion exchange membrane process. The judgement
was made by examining each patent document closely. For the category of the mercury
process, we also picked up patents on technologies for dealing with mercury emissions. By
using the following combinations of keywords, namely, mercury, and treat*, reduc*, remov*
or recov*, we first collected 1,295 patents which could potentially be relevant. Then we
selected those which are related to the chlor-alkali industry by examining each patent.
Figure 5-1 shows the trends in the US patents successfully applied by companies in
Western Europe since the end of the 1960s for technologies related to the mercury process
and the ion exchange membrane process for chlor-alkali production. (Detailed data are given
in Table 5-21 in Appendix at the end of this chapter.)
235

0
2
4
6
8
10
12
14
16
1965 1970 1975 1980 1985 1990 1995 2000
Year of Patent Application
Num
ber o
f Pat
ents
Mercury Process
Ion ExchangeMembrane Process
Figure 5-1 US Patents Successfully Applied by Western European Firms on the Mercury and Ion Exchange Membrane Processes
As we can see, most of the patents successfully applied by Western European
companies from the end of the 1960s to 1980, that is, 54 out of 60 patents, were targeted for
technologies related to the mercury process. On the other hand, only 10 per cent of all the
patents granted in the same period, namely, 6 patents, were related to the ion exchange
membrane process. The number of patents on the mercury process increased from the level
observed at the end of the 1960s and reached a peak in the late 1970s. Thereafter, relatively
few patents were granted in the 1980s and 1990s. Although there were several patents on the
ion exchange membrane process at the end of the 1970s and in the 1980s, overall more than
three times as many patents were granted on the mercury process as on the ion exchange
membrane process. That suggests that the focus of R&D activities made by Western European
companies were primarily aimed at developing technologies for reducing mercury emissions
236
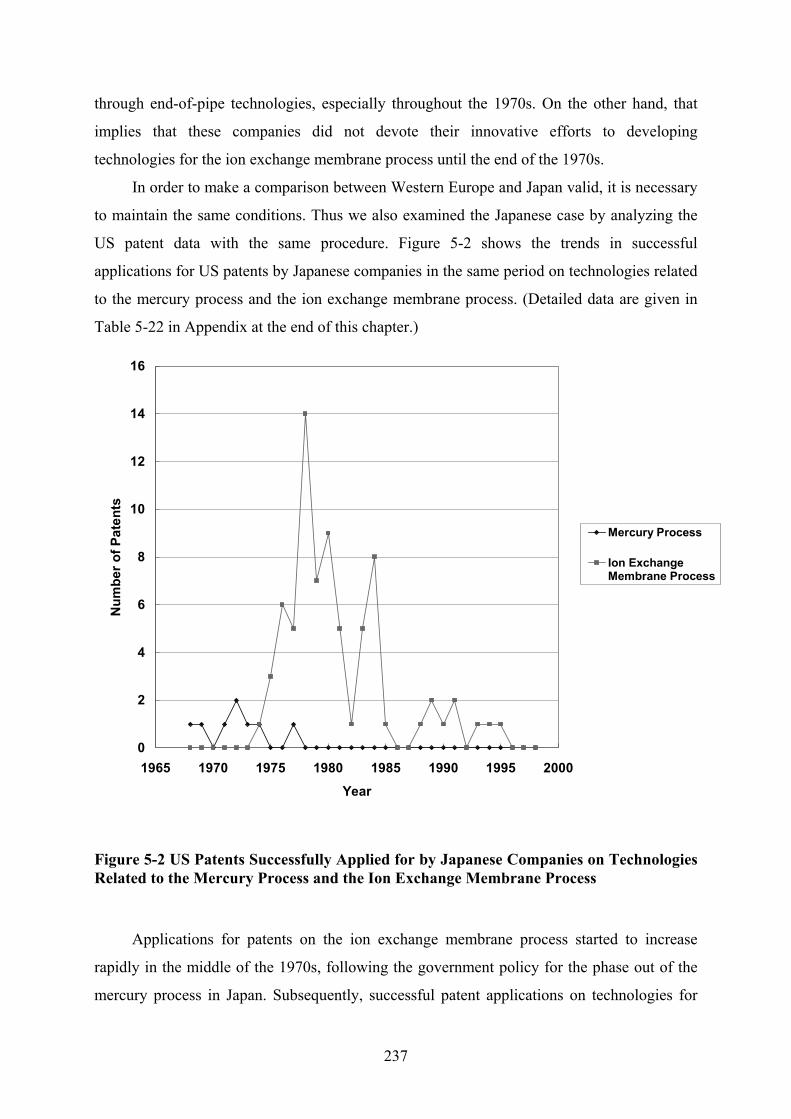
through end-of-pipe technologies, especially throughout the 1970s. On the other hand, that
implies that these companies did not devote their innovative efforts to developing
technologies for the ion exchange membrane process until the end of the 1970s.
In order to make a comparison between Western Europe and Japan valid, it is necessary
to maintain the same conditions. Thus we also examined the Japanese case by analyzing the
US patent data with the same procedure. Figure 5-2 shows the trends in successful
applications for US patents by Japanese companies in the same period on technologies related
to the mercury process and the ion exchange membrane process. (Detailed data are given in
Table 5-22 in Appendix at the end of this chapter.)
0
2
4
6
8
10
12
14
16
1965 1970 1975 1980 1985 1990 1995 2000
Year
Num
ber o
f Pat
ents
Mercury Process
Ion ExchangeMembrane Process
Figure 5-2 US Patents Successfully Applied for by Japanese Companies on Technologies Related to the Mercury Process and the Ion Exchange Membrane Process
Applications for patents on the ion exchange membrane process started to increase
rapidly in the middle of the 1970s, following the government policy for the phase out of the
mercury process in Japan. Subsequently, successful patent applications on technologies for
237
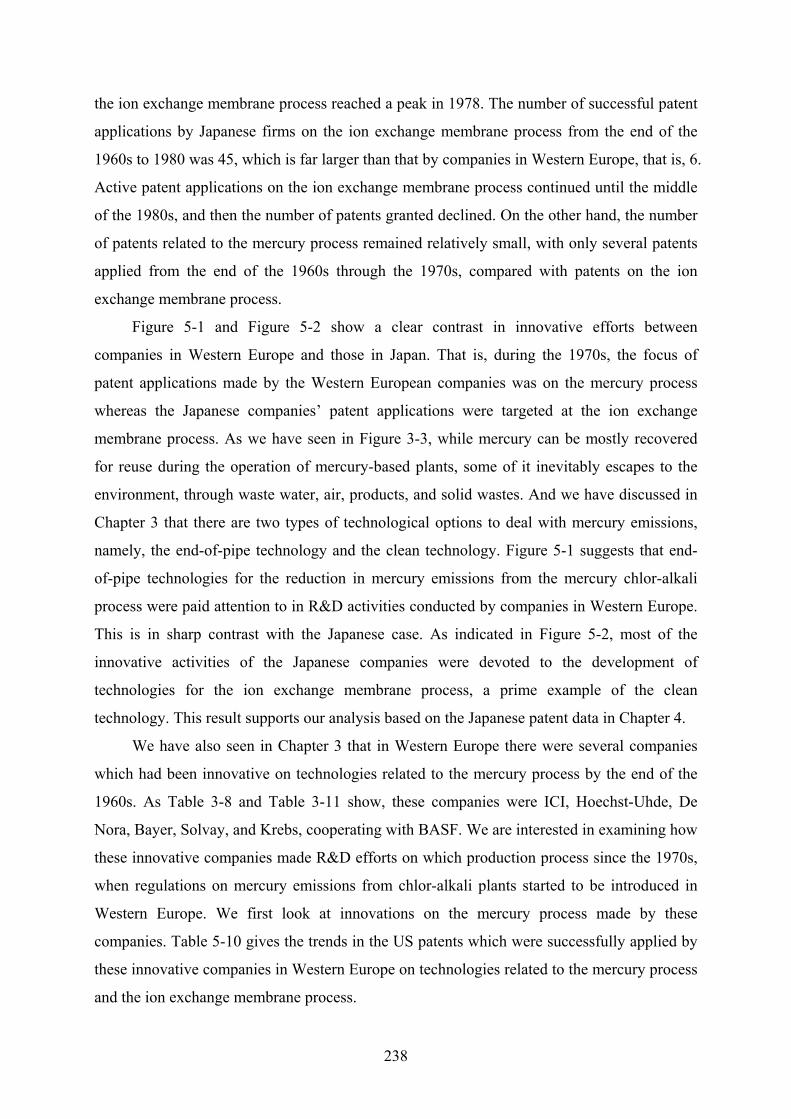
the ion exchange membrane process reached a peak in 1978. The number of successful patent
applications by Japanese firms on the ion exchange membrane process from the end of the
1960s to 1980 was 45, which is far larger than that by companies in Western Europe, that is, 6.
Active patent applications on the ion exchange membrane process continued until the middle
of the 1980s, and then the number of patents granted declined. On the other hand, the number
of patents related to the mercury process remained relatively small, with only several patents
applied from the end of the 1960s through the 1970s, compared with patents on the ion
exchange membrane process.
Figure 5-1 and Figure 5-2 show a clear contrast in innovative efforts between
companies in Western Europe and those in Japan. That is, during the 1970s, the focus of
patent applications made by the Western European companies was on the mercury process
whereas the Japanese companies’ patent applications were targeted at the ion exchange
membrane process. As we have seen in Figure 3-3, while mercury can be mostly recovered
for reuse during the operation of mercury-based plants, some of it inevitably escapes to the
environment, through waste water, air, products, and solid wastes. And we have discussed in
Chapter 3 that there are two types of technological options to deal with mercury emissions,
namely, the end-of-pipe technology and the clean technology. Figure 5-1 suggests that end-
of-pipe technologies for the reduction in mercury emissions from the mercury chlor-alkali
process were paid attention to in R&D activities conducted by companies in Western Europe.
This is in sharp contrast with the Japanese case. As indicated in Figure 5-2, most of the
innovative activities of the Japanese companies were devoted to the development of
technologies for the ion exchange membrane process, a prime example of the clean
technology. This result supports our analysis based on the Japanese patent data in Chapter 4.
We have also seen in Chapter 3 that in Western Europe there were several companies
which had been innovative on technologies related to the mercury process by the end of the
1960s. As Table 3-8 and Table 3-11 show, these companies were ICI, Hoechst-Uhde, De
Nora, Bayer, Solvay, and Krebs, cooperating with BASF. We are interested in examining how
these innovative companies made R&D efforts on which production process since the 1970s,
when regulations on mercury emissions from chlor-alkali plants started to be introduced in
Western Europe. We first look at innovations on the mercury process made by these
companies. Table 5-10 gives the trends in the US patents which were successfully applied by
these innovative companies in Western Europe on technologies related to the mercury process
and the ion exchange membrane process.
238

Table 5-10 US Patents Successfully Applied by Western European Companies on Technologies Related to the Mercury Process and the Ion Exchange Membrane Process
ICI Hoechst-Uhde
De Nora Bayer Krebsb Solvay Yeara
Hg IM Hg IM Hg IM Hg IM Hg IM Hg IM 1970 0 0 0 0 1 0 0 0 0 0 0 0 1971 1 0 0 0 0 0 0 0 2 0 0 0 1972 0 0 0 0 1 0 0 0 0 0 0 0 1973 0 0 1 0 0 0 1 0 0 0 0 0 1974 1 0 0 0 1 0 1 0 0 0 0 0 1975 1 0 0 0 0 0 0 0 0 0 0 0 1976 0 0 1 0 0 0 0 0 0 0 0 0 1977 0 0 1 0 0 0 0 0 0 0 0 0 1978 0 0 0 0 2 0 2 0 0 0 0 0 1979 1 0 2 1 1 1 0 0 0 0 0 0 1980 0 0 0 0 1 1 1 0 0 0 0 0 1981 0 0 0 0 0 4 0 0 0 0 0 0 1982 0 0 0 0 0 0 0 0 0 0 0 0 1983 0 0 0 0 0 3 0 0 0 0 0 0 1984 0 1 0 0 0 0 0 0 0 0 1 0 1985 0 1 0 1 0 1 0 0 0 0 0 0 1986 0 0 0 0 0 0 0 0 0 0 0 0 1987 0 0 0 0 0 0 0 0 0 0 0 0 1988 0 0 0 0 0 2 0 0 0 0 0 0 1989 0 0 0 0 0 1 0 0 0 0 0 0 1990 0 0 0 0 0 0 0 0 0 0 0 0 1991 0 0 0 0 0 0 0 0 0 0 0 0 1992 0 0 0 0 0 0 0 0 0 0 0 0 1993 0 0 0 0 0 0 0 0 0 0 0 0 1994 0 0 0 0 0 0 0 0 0 0 0 0 1995 0 0 0 0 0 0 0 0 0 0 0 0 1996 0 0 0 0 0 0 0 0 0 0 0 0 1997 0 0 0 0 0 0 0 0 0 0 0 0 Total 32 2 4 2 9 9 16 0 2 0 1 0 Hg: Mercury Process; IM: Ion Exchange Membrane Process a: Year of patent applications. b: The data of Krebs includes that of BASF.
Although the number of successful patent applications is small, we can see that, while
these companies made patent applications basically on technologies related to the mercury
process in the 1970s, successful patent applications started to appear on the ion exchange
membrane process at the end of the 1970s and the beginning of the 1980s. That suggests that
239

these companies initially focuses their R&D activities on technologies related to the mercury
process in the 1970s, when regulations on mercury emissions began to be introduced in
Western Europe. Then they started to shift their innovative efforts to the ion exchange
membrane process at the end of the 1970s. To understand exactly what kinds of technologies
were developed for the mercury process in the 1970s, particularly whether these innovations
were actually technological measures aimed at reducing mercury emissions, more detailed
analysis of these technological developments is necessary. In the next section, we examine in
detail what kinds of technologies have been actually developed and subsequently supplied by
these companies in Western Europe.
5.2.2 Development of End-of-Pipe Technologies for the Reduction of Mercury
Emissions
As we can see in Figure 3-3 and Figure 3-4, mercury-based chlor-alkali plants discharge
mercury to the environment. It is mainly emitted through waste water, process gases, and
products (Schmittinger, Curlin, Asawa, Kotowski, Beer, Greenberg, Zelfel, and Breitstadt,
1986). Liquid effluent streams contain significant amounts of mercury. Mercury-containing
wastewater has several sources in the production process. They include condensate and wash
liquor from treatment of chlorine, hydrogen, and brine, stuffing-box rinse water from pumps
and blowers, and brine leakage. In addition, the cleaning operations of cells, floors, tanks,
pipes, and dismantled apparatus normally produce waste waters containing mercury.
Mercury emissions to products include those to chlorine and caustic soda. Hot, moist
chlorine leaving the cell contains small amounts of mercury chloride. This is almost
completely washed out in the subsequent cooling process and is fed back into the brine with
the condensate. As there are only minute traces of mercury in the cooled and dried chlorine
gas, normally mercury removal processes are not required for this product. On the other hand,
the caustic soda produced with the mercury process inevitably contains mercury, and
technical treatment is necessary to reduce the mercury content.
Mercury emissions to the atmosphere are accounted for by mercury in three sources,
namely, process exhaust, cellroom ventilation, and hydrogen95. Process exhaust refers to all
gaseous streams by which mercury is emitted to the atmosphere, apart from in cellroom
ventilation air and in hydrogen as a product. Each plant has different streams, but typically
240

purge air from cell end-boxes, vents from wash water collection tanks and exhaust from any
vacuum system used to collect spilled mercury are the main sources of mercury emissions to
the air. Mercury spillage occurs during essential operations involving electrolytic cells or
decomposers, for example, opening electrolytic cells for anode changing or cleaning,
assembling or dismantling equipment, and replacing defective pipes, and spillage leads to
small losses in the air owing to the vapor pressure of mercury. Mercury is also emitted
through unintended leakage from equipment including cells, pipes and vessels, via faulty
seals. The hydrogen gas stream is nearly saturated with mercury when it leaves the
decomposer.
To see whether innovations on the mercury process have been aimed at the reduction of
mercury emissions through these various routes to the environment, we need to examine what
kinds of technological developments have been made by companies in Western Europe
concerning the mercury process. We look at the patent data in detail for that purpose. Table
5-11 shows the US patents granted to companies in the Western European chlor-alkali
industry on technologies related to the mercury process.
Table 5-11 US Patents Successfully Applied by Companies in the Western European Chlor-Alkali Industry on Technologies Related to the Mercury Process
Company Patent No. Year Patent Title US3718457 1971 Process for the recovery of mercury from waste brine
from mercury cells US3905880 1974 Operation of mercury-cathode cells US4060463 1975 Operation of mercury-cathode cells
ICI
US4234405 1979 Electrode for electrochemical processes US3922210 1973 Process of avoiding mercury emission from mercury-
using plants US4059438 1976 Process for the work-up of a contaminated inactive
mercury(II) chloride/active carbon-catalyst US4108769 1977 Process for reducing the mercury content of industrial
waste waters US4212715 1979 Process for reducing losses of mercury in alkali metal
chloride electrolysis
Hoechst-Uhde
US4244801 1979 Apparatus to measure the distribution of the anode currents in cells for alkali metal chloride
De Nora US3627652 1970 Method of operating mercury cathode electrolytic cell plant
95 Note that hydrogen released to the atmosphere or used or sold as a fuel is included in gaseous effluent, not classified as a product.
241
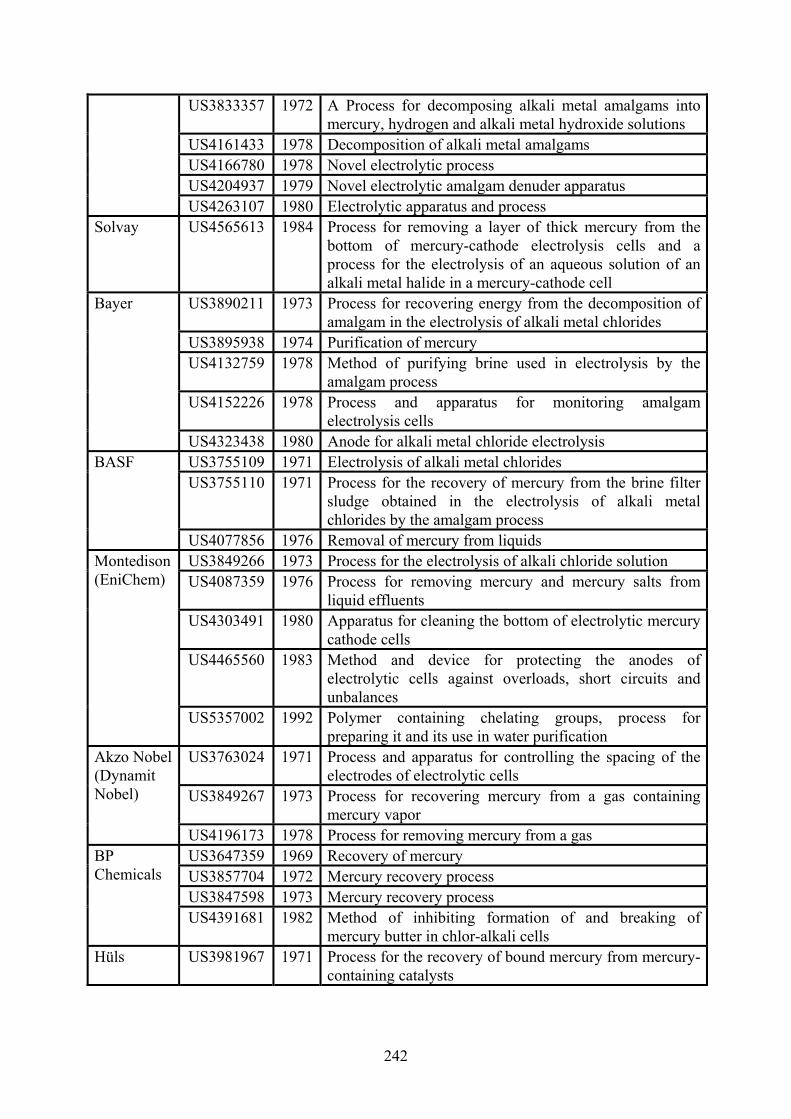
US3833357 1972 A Process for decomposing alkali metal amalgams into mercury, hydrogen and alkali metal hydroxide solutions
US4161433 1978 Decomposition of alkali metal amalgams US4166780 1978 Novel electrolytic process US4204937 1979 Novel electrolytic amalgam denuder apparatus
US4263107 1980 Electrolytic apparatus and process Solvay US4565613 1984 Process for removing a layer of thick mercury from the
bottom of mercury-cathode electrolysis cells and a process for the electrolysis of an aqueous solution of an alkali metal halide in a mercury-cathode cell
US3890211 1973 Process for recovering energy from the decomposition of amalgam in the electrolysis of alkali metal chlorides
US3895938 1974 Purification of mercury US4132759 1978 Method of purifying brine used in electrolysis by the
amalgam process US4152226 1978 Process and apparatus for monitoring amalgam
electrolysis cells
Bayer
US4323438 1980 Anode for alkali metal chloride electrolysis US3755109 1971 Electrolysis of alkali metal chlorides US3755110 1971 Process for the recovery of mercury from the brine filter
sludge obtained in the electrolysis of alkali metal chlorides by the amalgam process
BASF
US4077856 1976 Removal of mercury from liquids US3849266 1973 Process for the electrolysis of alkali chloride solution US4087359 1976 Process for removing mercury and mercury salts from
liquid effluents US4303491 1980 Apparatus for cleaning the bottom of electrolytic mercury
cathode cells US4465560 1983 Method and device for protecting the anodes of
electrolytic cells against overloads, short circuits and unbalances
Montedison (EniChem)
US5357002 1992 Polymer containing chelating groups, process for preparing it and its use in water purification
US3763024 1971 Process and apparatus for controlling the spacing of the electrodes of electrolytic cells
US3849267 1973 Process for recovering mercury from a gas containing mercury vapor
Akzo Nobel (Dynamit Nobel)
US4196173 1978 Process for removing mercury from a gas US3647359 1969 Recovery of mercury US3857704 1972 Mercury recovery process US3847598 1973 Mercury recovery process
BP Chemicals
US4391681 1982 Method of inhibiting formation of and breaking of mercury butter in chlor-alkali cells
Hüls US3981967 1971 Process for the recovery of bound mercury from mercury-containing catalysts
242
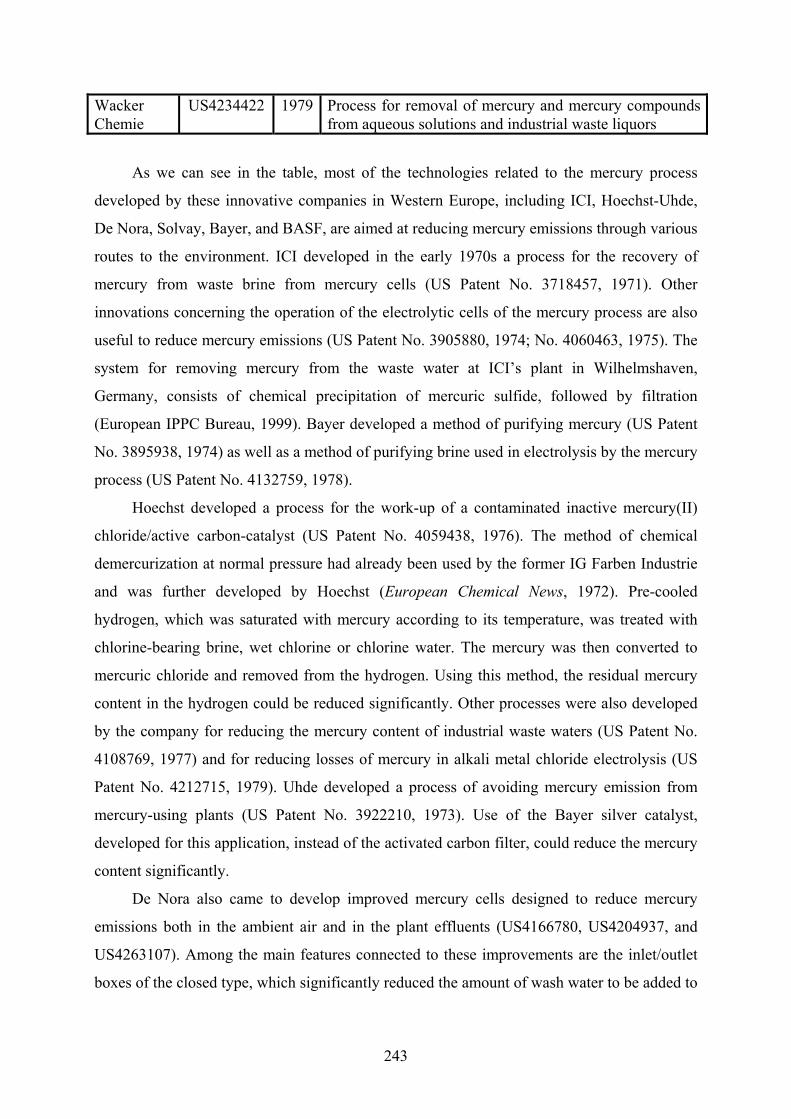
Wacker Chemie
US4234422 1979 Process for removal of mercury and mercury compounds from aqueous solutions and industrial waste liquors
As we can see in the table, most of the technologies related to the mercury process
developed by these innovative companies in Western Europe, including ICI, Hoechst-Uhde,
De Nora, Solvay, Bayer, and BASF, are aimed at reducing mercury emissions through various
routes to the environment. ICI developed in the early 1970s a process for the recovery of
mercury from waste brine from mercury cells (US Patent No. 3718457, 1971). Other
innovations concerning the operation of the electrolytic cells of the mercury process are also
useful to reduce mercury emissions (US Patent No. 3905880, 1974; No. 4060463, 1975). The
system for removing mercury from the waste water at ICI’s plant in Wilhelmshaven,
Germany, consists of chemical precipitation of mercuric sulfide, followed by filtration
(European IPPC Bureau, 1999). Bayer developed a method of purifying mercury (US Patent
No. 3895938, 1974) as well as a method of purifying brine used in electrolysis by the mercury
process (US Patent No. 4132759, 1978).
Hoechst developed a process for the work-up of a contaminated inactive mercury(II)
chloride/active carbon-catalyst (US Patent No. 4059438, 1976). The method of chemical
demercurization at normal pressure had already been used by the former IG Farben Industrie
and was further developed by Hoechst (European Chemical News, 1972). Pre-cooled
hydrogen, which was saturated with mercury according to its temperature, was treated with
chlorine-bearing brine, wet chlorine or chlorine water. The mercury was then converted to
mercuric chloride and removed from the hydrogen. Using this method, the residual mercury
content in the hydrogen could be reduced significantly. Other processes were also developed
by the company for reducing the mercury content of industrial waste waters (US Patent No.
4108769, 1977) and for reducing losses of mercury in alkali metal chloride electrolysis (US
Patent No. 4212715, 1979). Uhde developed a process of avoiding mercury emission from
mercury-using plants (US Patent No. 3922210, 1973). Use of the Bayer silver catalyst,
developed for this application, instead of the activated carbon filter, could reduce the mercury
content significantly.
De Nora also came to develop improved mercury cells designed to reduce mercury
emissions both in the ambient air and in the plant effluents (US4166780, US4204937, and
US4263107). Among the main features connected to these improvements are the inlet/outlet
boxes of the closed type, which significantly reduced the amount of wash water to be added to
243
avoid carry over of chlorides into caustic soda while practically eliminating the need of
sucking and treating mercury-contaminated air from the cell end boxes. Another technology is
a cell bottom wiper. This device, which is normally located inside the inlet end box, can be
operated from outside, making possible periodical mechanical cleaning of the cell bottom
without opening the cell. That is, any impurity accumulated on the cell bottom, which could
disturb mercury flow along the cell, can be eliminated by just pushing the wiper from the inlet
towards the outlet end.
BASF developed a process for the recovery of mercury from the brine filter sludge
obtained in the electrolysis of alkali metal chlorides by the mercury process (US Patent No.
3755110, 1971). The company also developed a technology for the removal of mercury from
liquids (US Patent No. 4077856, 1976). At BASF’s plant located in Antwerp, hydroxylamine
is used to reduce mercury concentration, followed by filtration and activated carbon filters
(European IPPC Bureau, 1999). And all gases are treated in an absorption tower. The lower
section of the tower is used to neutralize the chlorine in the gas, which is transformed into
hypochlorite. While the mercury in the waste gas is partly absorbed by the hypochlorite in the
lower section, absorption does not take place in the upper section of the tower, where no
hypochlorite is contained, and the technology consists of adding hypochlorite in the upper
section. For the treatment of hydrogen, the company uses a chemical reaction with copper
oxide after the cooling step in order to absorb mercury.
Solvay developed a process for removing a layer of thick mercury from the bottom of
mercury-cathode electrolysis cells and a process for the electrolysis of an aqueous solution of
an alkali metal halide in a mercury-cathode cell (US Patent No. 4565613, 1984). At Solvay’s
plant at Roermond, the process waste water is treated by means of sedimentation of solid
mercury and subsequent precipitation of mercury with sodium bisulfide (Information Centre
for Environmental Licensing, 1998). The mercury contained in waste gas has been reduced by
adsorption on activated carbon impregnated with sulfur. By using filtration with activated
carbon, the company achieved a reduction in mercury contained in hydrogen. Similarly, by
adsorption on activated carbon, the company’s plant at Antwerp removed mercury contained
in hydrogen (European IPPC Bureau, 1999). The company’s plant at Martorell, Spain,
reduced mercury contained in waste gas by adsorption on activated carbon impregnated with
sulfur (European IPPC Bureau, 2000).
244

In addition to the companies which had been previously innovative on the mercury
process, other chlor-alkali producers, namely, BP Chemical, Akzo, Montedison (EniChem)96,
Wacker Chemie, and Hüls, also made successful patent applications on technologies for the
reduction of mercury emissions. Montedison, Process for removing mercury and mercury
salts from liquid effluents (US Patent No. 4087359, 1976). Montedison also developed an
apparatus for cleaning the bottom of electrolytic mercury cells (US Patent No. 4303491,
1980), which reduced the frequency of opening the cell, leading to a reduction in mercury
emissions to cellroom ventilation air. Wacker Chemie developed a process for removal of
mercury and mercury compounds from aqueous solutions and industrial waste liquors (US
Patent No. 4234422, 1979). Hüls developed a process for the recovery of bound mercury from
mercury-containing catalysts (US Patent No. 3981967, 1971). BP Chemicals developed a
process for the recovery of mercury (US Patent No. 3647359, 1969; US Patent No. 3857704,
1972; US Patent No. 3847598, 1973) as well as a method of inhibiting formation of and
breaking of mercury butter in chlor-alkali cells (US Patent No. 4391681, 1982), which
contributes to a reduction in mercury emissions to cellroom ventilation air.
Akzo succeeded in the early 1970s in lowering the mercury concentration of the waste
water by developing a one-stage process with the ion exchange resin97 (Rekers, 1973). Akzo’s
plant in Hengelo treats the process water by sedimentation of solid mercury and subsequent
removal of mercury in an ion exchange unit (Information Centre for Environmental Licensing,
1998). To remove mercury from hydrogen, the company utilizes a calomel reaction, followed
by filtration with activated carbon. At Akzo Nobel in Bohus, the waste water treatment
system consists of a mixing unit where hydrazine is added to the waste water, two
sedimentation tanks, sand filters, activated carbon filters and ion exchange filters (Information
Centre for Environmental Licensing, 1998). Akzo also developed a process for recovering
mercury from a gas containing mercury vapor (US3849267, 1973; US4196173, 1978). The
company’s calomel process has been used at its plant in Hengelo (Rekers, 1973). The
mercury concentration in caustic soda at Akzo Nobel’s plant at Bohus has been reduced by
using filters with activated carbon. The hydrogen gas is scrubbed with chlorinated brine
96 The chlor-alkali business of Montedison has been transferred to EniChem, which was founded in 1989 as a joint venture between the chemical operations of the Eni Group and the majority of the chemical operations of the Montedison Group (EniChem, 2001). 97 Synthetic ion exchange resins normally consist of various copolymers having a cross-linked three-dimensional structure to which ionic groups have been attached. Note that this technology is different from the ion exchange membrane used for the chlor-alkali manufacture.
245

before adsorption on activated carbon. Mercury emissions via process exhausts at the plant
have been reduced by adsorption on activated carbon impregnated with sulfur.
As we have seen, these technologies developed for the abatement of mercury emissions
from chlor-alkali plants in Western Europe are basically measures of the end-of-pipe type.
Technologies for the reduction of mercury emissions to waste water normally include settling
to remove large mercury droplets, followed by oxidation using hypochlorite, chlorine or
hydrogen peroxide to take remaining metallic mercury into solution. A process which has
been frequently used for purifying depleted brine leaving the plant and any other mercury-
containing waste water is the precipitation of mercuric sulfide, followed by filtration. In the
precipitation process, the mercuric sulfide is filtered from the waste water in sand or plate
filters and then can be dissolved in hypochlorite and recycled to the cellroom brine system.
Several types of end-of-pipe technologies have been developed, notably filters, to
remove mercury from caustic soda. They include plate filters with carbon pre-coat, candle
filters with carbon pre-coat, and candle filters without pre-coat. Although all types of filters
can achieve very low levels of mercury in the product, the predominant technique, which
achieves low levels, has been the plate filter with carbon pre-coat. Mercury is absorbed on the
carbon pre-coat and is discharged from the filter as a dry cake. On the other hand, the
activated carbon filtration generates mercury-contaminated waste, and the discharged filter
cake needs to be subjected to distillation to recover the mercury.
To achieve low levels of mercury in process exhaust, there are basically two principal
single-stage processes, which are of the end-of-pipe type, namely, chemical process,
including scrubbing with hypochlorite or chlorinated brine and use of a calomel reaction, and
the use of sulfurized charcoal. By scrubbing with chlorine-containing brine, mercury(II)
chloride (HgCl2) is produced, forming a mercury-chlorine complex in the brine. After
chlorine is removed, the brine is recirculated. By scrubbing with alkaline hypochlorite
solution, the mercury contained in the process exhausts is also oxidized without any necessity
of subsequent chlorine removal. The cleaned gas passes through a separator to remove
entrained liquid droplets, and the mercury is recirculated via the brine. Another way of
removing mercury from the process exhaust is to utilize a calomel reaction. By adding
chlorine, mercury contained in the waste gas is converted to calomel (Hg2Cl2). The calomel is
then collected on rock salt or similar material in a packed column, allowing for direct
recycling of mercury to the brine feed to the cellroom. Mercury contained in the process
246
exhaust is also removed by adsorption on activated carbon impregnated with sulfur or sulfuric
acid, although that generates contaminated wastes at the same time.
The common approach to reducing the mercury content in hydrogen has been a two-
stage process. The first stage involves cooling, compression and cooling, or chemical process,
for example, scrubbing with hypochlorite or use of a calomel reaction. The second stage is
adsorption on iodized or sulfurized charcoal, while avoiding water condensation in the
charcoal bed.
To keep the cellroom ventilation losses to a minimum, there are basically two ways, that
is, purification of the ventilation air and prevention of mercury emissions at the sources. The
purification of the ventilation air leaving the cellroom is basically done by using end-of-pipe
technologies. Mercury cells are normally set up in very large cellroom buildings, and a huge
volume of ventilation air is necessary to remove the heat resulting from electrolysis in the
cells. Because of the huge volume of the ventilation air, which is released from many points
of the large cellroom, the removal of mercury by using end-of-pipe technologies has not been
practical. Hence the only satisfactory way of controlling mercury losses to atmosphere has
been to prevent mercury emissions at the sources. That requires a high standard of
housekeeping and equipment maintenance in the cellroom98. Since some mercury emissions
inevitably occur when an electrolytic cell is opened for sampling the amalgam or cleaning the
cells, mercury emissions can be reduced by minimizing the frequency and duration of the cell
opening. The frequency of cell cleaning is directly related to the quantity of thick mercury,
the so-called mercury butter, whose formation results from the existence of impurities in the
brine. Thus technologies have been developed to monitor accurately the accumulation of the
thick mercury in the cell and to reduce levels of impurities in the brine, such as heavy metals
as well as calcium and magnesium. Also cell-bottom wipers have been invented to limit
mercury emissions by making possible periodical mechanical cleaning of the cell bottom
without opening the electrolytic cells.
98 The ease with which mercury cellrooms can be managed for the minimum emission of mercury would be influenced by several factors, including the climate and the age and nature of the plant design (Euro Chlor, 1993). The climate is considered important, as the mercury loss rate varies depending on the ambient temperature. With other conditions held constant, mercury losses are generally higher in summer than in winter and also during the day than at night. For the same reason, cellrooms in Southern Europe would be expected to have higher losses than those in Northern Europe due solely to the different climate conditions. The plant design may also influence the extent to which mercury emissions can be reduced. In general, older plants were not designed for efficient containment of mercury. Older designs of cells operated at lower current density require larger buildings with larger floor areas, resulting in a greater potential for mercury emissions.
247

As we have discussed above, various kinds of equipment of the end-of-pipe type have
been adopted to curb mercury emissions from chlor-alkali plants to water, products, and air.
Figure 5-3 gives a schematic illustration of these technologies used to reduce mercury
emissions at a mercury-based chlor-alkali plant. Comparing with Figure 3-3, we can see that
these technologies are primarily aimed at scrubbing, filtration, and adsorption and are
installed at the end of the production process without making any changes in the chemical
reactions involved; that is, they are end-of-pipe technologies.
248

Electrolysis
Amalgam Decomposition
Cooling
Dechlorination
Salt
Brine Saturation
Precipitation
Filtration
RefrigerationAdsorption
Compression
Filtration
Storage
Chlorine HydrogenCaustic Soda
Water
AmalgamMercury
Raw Brine
Purified Brine
Hydrogen (Hg*)Caustic solution (Hg*) Chlorine
Diluted Brine
Anolyte
Drying
Cooling
Filtration
Brine sludge (Hg*)
Cellroom ventilation (Hg*)
Wastewater (Hg*)
Precipitation Filtration
Process exhaust (Hg*)
Cooling
ScrubbingAdsorption
Good Housekeeping
Figure 5-3 End-of-Pipe Technologies Developed to Reduce Mercury Emissions
249

5.2.3 Continued Use of the Mercury Process with End-of-Pipe Technologies
The previous section shows that various types technologies, most of which are of the end-of-
pipe type, have been developed by companies in Western Europe to reduce mercury
emissions from chlor-alkali plants to water, products, and air. To see the effects of adoptions
of these technologies at mercury-based chlor-alkali plants, we need to examine actual
mercury emissions. Figure 5-4 shows the trends in mercury losses per unit production
capacity of chlorine to water, products, and air from chlor-alkali plants in Western Europe
since 197799. (Detailed data are given in Table 5-23 in Appendix at the end of this chapter.)
0
5
10
15
20
25
30
1975 1980 1985 1990 1995 2000
Year
Mer
cury
Em
issi
ons
(g H
g/t C
l2)
WaterProductsAirTotal
Figure 5-4 Mercury Emissions to Water, Products, and Air from Chlor-Alkali Plants in Western Europe
99 The chlor-alkali industry association in Europe, Euro Chlor, represented all 38 Western European chlorine producers in 14 countries at the time of 1997 (Euro Chlor, 1997). Note that the data collected by Euro Chlor includes those of Austria, Finland, Italy, and Greece, which have not been the members of the Paris Commission (subsequently the OSPAR Commission). For more information on the data collected by the Paris Commission, see Appendix.
250

According to the table, these end-of-pipe technological measures have made significant
impacts on the amount of mercury emissions from chlor-alkali plants in Western Europe.
Mercury losses per unit production capacity to water from chlor-alkali plants located in
Western Europe have decreased steadily since 1977, from 9.4 g Hg/t Cl2 to 0.11 g Hg/t Cl2,
achieving a 99 % reduction. A similar trend has been observed in the case of mercury losses
through products. Over the last 20 years, a decrease of 98 % was achieved, from 5.5 g Hg/t
Cl2 in 1977 to 0.14 g Hg/t Cl2 in 1997. Mercury emissions to air, that is, those contained in
process exhaust, ventilation air and hydrogen used as fuel, have also shown a large decrease
since the late 1970s. Atmospheric emissions were reduced from 11.7 g Hg/t Cl2 in 1977 to 1.2
g Hg/t Cl2 in 1997. The reduction rate of atmospheric emissions from 1982 to 1997 was 69 %,
however, which was much smaller compared with that of emissions to products or water.
Concerning mercury discharges to water from existing waste brine chlor-alkali plants,
the Paris Commission adopted in 1981 the limit values of 8 g Hg/t Cl2 capacity to be
complied with at the exit of a factory as a monthly mean from July 1983, and 5 g Hg/t Cl2
capacity from July 1986. For brine recirculation plants, the European Communities made the
decision in 1982 on the limit value of 1.5 g Hg/t Cl2 to be effective after July 1983, and the
Paris Commission also adopted in 1985 the recommendation requiring the limit value of 0.5 g
Hg/t Cl2 capacity from July 1986. Figure 5-4 suggests that, while we would expect variations
in the amount of mercury emissions among the individual plants, these emission targets have
been met by mercury-based chlor-alkali plants in Western Europe. (For individual chlor-alkali
plants located in Western Europe, chronological data since the 1970s is not publicly available.
Only for the year 1999, detailed data on mercury emissions to water, products, and air has
been published recently. The results are given Table 5-24 in the appendix at the end of this
chapter.)
Also, there was the limit value for emissions to the atmosphere, as stipulated in
paragraph 1 of PARCOM Decision 90/3, that is, 2 g Hg/t Cl2 capacity to be complied with by
December 1996 (OSPAR Commission, 1999a). Figure 5-4 shows that, while air emissions
currently account for the largest share of the total mercury emissions from chlor-alkali plants
in Western Europe, all the existing mercury-based chlor-alkali plants have complied with the
limit value for air emissions. These technological measures of the end-of-pipe type have
functioned successfully to reduce mercury emissions to such an extent that all the
environmental regulations introduced in Western Europe have been complied with.
251

This remarkable success in reducing mercury emissions by using various types of end-
of-pipe technologies has made it possible for plant operators to continue to rely on the
mercury process for chlor-alkali production. Figure 5-5 shows the trends in the shares of
chlor-alkali production capacities based on the mercury process and the non-mercury
processes, that is, the diaphragm and ion exchange membrane processes, in Western Europe.
(Detailed data are given in Table 5-25 in Appendix at the end of this chapter.)
0
10
20
30
40
50
60
70
80
90
100
1980 1985 1990 1995 2000
Year
Perc
enta
ge
Mercury ProcessNon-Mercury Processes
Figure 5-5 Production Capacities Based on the Mercury, Diaphragm, and Ion Exchange Membrane Processes in the Western European Chlor-Alkali Industry
Although the production capacities based on the mercury process have declined slightly
since the early 1980s, the mercury process is still the dominant technology, currently
accounting for more than 60 % of the total production capacities in Western Europe. In other
words, most of the European chlor-alkali producers have continued to use the mercury
process by adopting various types of end-of-pipe technologies installed to reduce mercury
emissions. This form of technological change is in sharp contrast to the Japanese case, where
252

mercury emissions have been eliminated by phasing out the mercury process. Rather than
installing end-of-pipe technologies for the abatement of mercury emissions, all the existing
mercury-based chlor-alkali plants have been replaced with clean technologies, notably the ion
exchange membrane process, which currently accounts almost all of the chlor-alkali
production capacities in Japan.
5.3 Delayed Development of Technologies for the Ion Exchange Membrane
Process
As we can see in while there were many successful patent applications on the mercury
process by Western European companies during the 1970s, patents on the ion exchange
membrane process started to appear at the end of the 1970s. In Chapter 3, we discussed that
several companies in Western Europe, namely, ICI, Hoechst-Uhde, De Nora, Bayer, Solvay,
and Krebs, cooperating with BASF, had been innovative on the mercury process in the past.
Table 5-10 suggests that, in the 1970s, when environmental regulations on mercury emissions
were being introduced, these companies continued to focus on the mercury process, applying
successfully for US patents on this process. On the other hand, patent applications made by
these companies on the ion exchange membrane process have been relatively few. Only ICI,
Hoechst-Uhde, and De Nora were granted patents on technologies related to the ion exchange
membrane process. Their successful patent applications started at the end of the 1970s, later
and fewer than those made by the innovative companies in Japan. Other companies, including
Bayer, Solvay, and Krebs, did not have any US patents on the ion exchange membrane
process. In the following sections, we examine in detail when and how innovative activities
were conducted by these companies for technological development of the ion exchange
membrane process.
Imperial Chemical Industries
The chlor-alkali production of Imperial Chemical Industries (ICI)100 started at the end of the
19th century, with the Castner-Kellner mercury cells introduced in 1897 at Runcorn in the
northwest of England. This site is still the location of ICI’s largest chlor-alkali plant with a
production capacity of more than 700,000 tonnes of chlorine per year. This figure is
100 This section is based on information obtained through the author’s interview with Mr. Steve Ingleby, Mr. R. W. Curry and Mr. Cliff Broom of ICI (Ingleby, Curry, and Broom, 1999).
253

significantly larger than that in the 19th century; only 500 tons of caustic soda was produced
in 1897, increasing to 3,500 tons in 1900. Mond Division, which was responsible for the
alkali production, was located at Runcorn because the country’s main salt resources lied in
that region. The electrolytic process was made possible by the increasing availability of
electric generation capacity and essentially marked the beginning of the modern chlor-alkali
industry. It replaced a variety of inefficient and expensive chlorine manufacturing processes
based on oxidation of the by-product, hydrogen chloride, which prevailed before, and
provided a new source of high quality caustic soda, another chemical in increasing demand at
that time101. New cellrooms based on the mercury process were constructed at Runcorn in the
1930s.
Since the beginning of the electrolytic production of chlor-alkali products, ICI’s R&D
activities had been focused on the mercury process. Their main objective was to improve the
reliability of the mercury process and to make it possible to operate the process continuously,
as well as to develop technological measures for the reduction of mercury emissions (see
Table 5-11). A major mercury cellroom, equipped with computer controlled anode adjustment
and shorting resistant anode coatings, was commissioned in 1974, and mercury cells with
steel baseplaces were introduced in 1976. The 1970s at the same time brought the realization
of a need for reducing mercury emissions from its chlor-alkali plants, as mercury became one
of the main targets of environmental regulations introduced in Western Europe. In addition to
the development of end-of-pipe equipment, the optimization of process operation was
effective in reducing mercury emissions, particularly those from cellrooms to the air.
On the other hand, the application of the ion exchange membrane for use in the chlor-
alkali production had been recognized as a promising technology in the future for a long time.
Some work on technologies related to the ion exchange membrane process was done by ICI
as early as in the 1960s. The first ICI’s patent on a zero-gap electrolytic cell, which could be
utilized for the ion exchange membrane process, was indeed granted in 1962. As reliable ion
exchange membranes with a sufficient lifetime for industrial uses were not available at that
time, however, further R&D efforts were not made on the ion exchange membrane process.
Then, in the 1970s, there was the rapid technological progress on the ion exchange membrane
process in Japan in response to the government regulation to phase out the mercury process in
the chlor-alkali industry. Better ion exchange membranes suitable for use in chlor-alkali
101 The chemical processes used in the chlor-alkali industry prior to the invention of the electrolytic processes
254

plants were developed by the Japanese companies and become available to Western Europe.
That has provided ICI with strong incentives to invigorate its innovative efforts to develop
technologies for the ion exchange membrane process. Subsequently, ICI made an agreement
with Asahi Glass to introduce the ion exchange membrane, and an intensive R&D program
was initiated in the late 1970s. A pilot plant utilizing the ion exchange membrane process
with a production capacity of 6,000 tonnes of chlorine per year started to operate at its
Lostock site in 1978.
Table 5-12 gives the chronology of technological development of the ion exchange
membrane process at ICI.
Table 5-12 Technological Development of the Ion Exchange Membrane Process at ICI
Year Technological Development 1962 First patent on electrolyzer for the ion exchange membrane process 1978 Start of a pilot plant based on the ion exchange membrane process 1983 First commercial sale of the ion exchange membrane process technology to
outside firms 1989 Introduction of the ion exchange membrane process to its own plant
As with the company’s earlier technologies for the mercury process, the development of
technologies for the ion exchange membrane process was originally intended to be used at
plants within the company’s group. Having experienced operating the pilot plant for a few
years, however, the company recognized that opportunities would exist to sell its ion
exchange membrane process technologies to chlor-alkali producers beyond the corporate
group. Accordingly, the company decided to market the technology to outside companies, and
the company’s FM21 process technology was launched for commercialization in July 1981.
Table 5-28 in the appendix to this chapter gives the list of the chlor-alkali plants to which ICI
has supplied its ion exchange membrane process technologies.
As you can see, the first major contract was made with Nobel for its plant in Sweden in
December 1983 to convert the mercury process. Since then, ICI’s technology for the ion
exchange membrane process has been adopted by chlor-alkali producers around the world,
but not by those in Western Europe. ICI itself introduced the ion exchange membrane process
to its Runcorn site in 1989 for the production of caustic potash (KOH) of 26,000 tonnes per
year, replacing the mercury process. This represented the company’s first installment of the
ion exchange membrane process to its own production plants. At the Runcorn site, however,
and the effects of environmental regulations on technological change are discussed in more detain in Appendix.
255

most of the chlor-alkali production is still based on the mercury process. The company also
maintains a plant based on the mercury process at Wilhelmshaven, Germany, with the
production capacity of 130,000 tonnes of chlorine per year. Hence a significant part of the
company’s chlor-alkali products is still produced by using the mercury process.
Uhde
Uhde102 is an engineering company, specializing in providing technologies for such product
groupings as electrolysis, fertilizers, coke oven plants and machinery, polymers, organic
chemicals, industrial plants, oil and gas technology, and off-sites. The electrolysis business
accounts for more than one third of the total turnover of the company. Uhde had been
associated with Hoechst, one of the major chlor-alkali manufacturers in Germany, with its
Griesheim plant going on stream in 1892 as one of the first chlor-alkali electrolyzers in the
world103.
In the past, the focus of the company’s technological development had been placed on
the mercury process. The Uhde mercury cells were developed through decades of experience
and research conducted cooperatively with Hoechst. Facilities necessary for R&D activities
were located in the sites of this company. By the 1960s, Hoechst-Uhde had developed four
sizes of mercury cells rated according to cathode area, with each size available in two styles,
i.e. with decomposer either alongside or underneath the electrolyzer (Table 3-8). More than
100 chlor-alkali plants had been supplied with Uhde’s mercury process technologies in the
world.
The main emphasis of the R&D activities during the 1970s was placed on the mercury
process, particularly on measures to reduce mercury emissions as well as to increase current
density. Technological developments by the company have been focused on the removal of
mercury from caustic soda, hydrogen, and waste water (see Table 5-11). In the middle of the
1970s, while the mercury process was still the major target of technological development,
Uhde started to conduct R&D on the ion exchange membrane process. The availability of ion
exchange membranes suitable for commercial-scale application developed by the Japanese
companies encouraged the company’s technological development of the ion exchange
membrane process. A very small cell consisting of 10 single elements was set up in 1975,
102 This section is based on the author’s interview with Dr. Benno Lüke and Mr. Roland Beckmann of Uhde (Luke and Beckmann, 1999).
256

primarily intended for the testing of materials. The test runs revealed that the only suitable
materials were stainless steel, nickel and titanium sheet for cells with long-term stability, and
perfluorinated plastics for gaskets and hoses. Based on this experience, the first pilot plant
with an annual capacity of 500 tonnes of caustic soda was commissioned in 1977.
The ion exchange membrane process developed in the late 1970s and the early 1980s
was characterized by improved performance of ion exchange membranes. They were at the
root of the breakthrough of the ion exchange membrane process technology, opening a
broader spectrum of commercial applications. They made it possible to obtain caustic soda
solution of a high concentration at reduced power consumption. The Flemion membranes
developed by Asahi Glass became available to Uhde through a technical agreement concluded
in 1980. These ion exchange membranes were capable of producing caustic soda solution at
as high as 35 %. Then electrolytic cells based on the ion exchange membrane process with a
large current were assembled and installed at the second pilot plant of Bayer in Leverkusen in
1981.
Table 5-13 gives the chronological development of the membrane process by Uhde.
Table 5-13 Technological Development of the Ion Exchange Membrane Process at Uhde
Year Technological Development 1975 Start of R&D on the ion exchange membrane process with a small-scale plant1977 Start-up of the first pilot plant based on the ion exchange membrane process 1981 Start-up of the second pilot plant based on the ion exchange membrane
process 1984 First supply of the ion exchange membrane process to outside firms 1987 Construction of the first full-scale pilot plant based on the ion exchange
membrane process at Hoechst
As the company shifted the emphasis of its R&D activities from the mercury process to
the ion exchange membrane process, the R&D expenditures on the ion exchange membrane
process increased significantly, from less than 1 million DM in 1980 to 4 million DM in 1995.
This significant increase in R&D expenditure was followed by a similar increase in the supply
of the ion exchange membrane processes by the company to chlor-alkali producers around the
world. Table 5-29 in the appendix to this chapter shows the chlor-alkali plants which adopted
the ion exchange membrane process technologies developed by Uhde.
103 In 1996 Uhde was demerged from Hoechst and purchased by the Krupp Group, which formed Krupp-Uhde GmbH.
257

The first industrial chlor-alkali facility using Uhde’s ion exchange membrane process
technology was commissioned in 1984 at Tofte in Norway. A full-scale pilot plant was built
at Hoechst in Frankfurt in 1987. Compared with the chlorine production capacity of several
hundred thousand tonnes per annum at Hoechst, the capacity of the ion exchange membrane
process of 10,000 tonnes per annum was relatively small. This pilot plant, however, was
intended primarily for testing a modular unit for the use in electrolysis plants with large
chlorine capacities, that is, for the construction of new grass-roots plants as well as for the
conversion of existing mercury-based plants.
As we can see in the table, installations of Uhde’s ion exchange membrane process
mostly occurred in the 1990s. In the period from 1994 to 1999, production capacities of
2,943,000 t NaOH/year were commissioned, accounting for more than 80 % of the total
capacities of 3,600,000 t/year NaOH constructed by Uhde since 1984. During the same period,
the ion exchange membrane process was introduced to 30 chlor-alkali plants, corresponding
to 60 % of the total number of chlor-alkali plants at which the ion exchange membrane
process has been installed by the company.
De Nora
De Nora104 was founded as an engineering company, specializing in electrochemistry. The
company’s activities have been focused for a long time on the manufacture of chlorine,
caustic soda (potash) and hydrogen by brine electrolysis with the mercury process. In
particular, the company has maintained a share of more than half of the world market of
coatings and support materials, with the dimensionally stable electrodes for chlor-alkali cells.
Other areas of its activities are also related to chlor-alkali products, including on-site
generation of active chlorine solution from seawater or brine for control of fouling in water
circuits and disinfection, granular high concentration calcium hypochlorite, cathodic
protection and fuel cells.
The company has conducted R&D activities on technologies related to electrochemistry
and its applications, particularly on cell designs and electrodes, anode as well as cathode, for
use in electrolysis. De Nora’s mercury process technologies have evolved through a series of
changes since they were first introduced in the 1950s. Subsequently, the company developed
electrolytic cells for the mercury process of a horizontal type in various sizes (Table 3-8). By
258

the early 1970s, more than 130 chlor-alkali plants with a total capacity of over five million
tonnes per year had been based on the mercury process provided by De Nora. That
corresponded to about one quarter of the world production capacities at that time, and the
company was one of the leading providers of the mercury process technologies to chlor-alkali
producers not only in Western Europe but also in the United States and Japan (see Table 3-11,
Table 3-15, and Table 3-18). Although the construction of new, green-field plants based on
the mercury process supplied by De Nora ended in 1985, expansions and relocations of
mercury-based plants continued until 1994. Currently, modification of the existing mercury
plants and provision of technical assistance for necessary adjustments at mercury-based plants
are still undertaken by the company.
Table 5-14 gives the chronology of the technological development of the ion exchange
membrane process by De Nora.
Table 5-14 Technological Development of the Ion Exchange Membrane Process at De Nora
Year Technological Development Late 1970s Start of R&D on the ion exchange membrane process
1979 Introduction of ion exchange membranes from Asahi Glass 1983 First supply of the ion exchange membrane process to outside chlor-alkali
producers
The company started to conduct its R&D activities on the ion exchange membrane
process in the late 1970s, following the development of ion exchange membranes suitable for
use in chlor-alkali electrolytic cells by several Japanese companies. A research agreement
was made between De Nora and Asahi Glass in 1979, and the ion exchange membranes
developed by the Japanese company was introduced for De Nora’s electrolytic cells. R&D
efforts on the ion exchange membrane process were reinforced in the early 1980s, when a
university professor with expertise on electrochemistry was invited to conduct innovative
research on the ion exchange membrane process at the company. R&D activities have been
intensified since then, increasing expenditures as well as personnel significantly. A result can
be observed in the increased patents successfully applied on technologies related to the ion
exchange membrane process in the 1980s (see Table 5-10).
104 This section is based on the author’s interview with Dr. Giuseppe Faita and Mr. Marco Tenconi of De Nora (Faita and Tenconi, 1999).
259

The trends in the supply of the ion exchange membrane process by De Nora are shown
in Table 5-30 in appendix to this chapter. De Nora’s first chlor-alkali plant based on the ion
exchange membrane process was constructed in 1983. Since then, approximately 40 chlor-
alkali plants have adopted the ion exchange membrane process provided by De Nora, with the
annual production capacities reaching nearly 1.3 million tonnes of chlorine in the world105.
Many of these chlor-alkali plants are located in developing countries, notably Asian countries
such as India and China, and the number of chlor-alkali plants which adopted De Nora’s ion
exchange membrane process is still limited in Western Europe.
Solvay
Solvay106 has been the largest chlor-alkali producer in Western Europe for a long time. In the
past its innovative activities had been placed on the mercury process, and Solvay’s mercury
process had been adopted by many chlor-alkali producers in Western Europe (see Table 3-11).
During the 1980s, when environmental regulations on mercury emissions were introduced,
Solvay continued to rely on the mercury process for its chlor-alkali production. On the other
hand, as Table 5-10 suggests, the company did not make any significant innovations on the
ion exchange membrane process in the same period. Then, in the early 1990s, Solvay started
to convert its mercury-based plants to the ion exchange membrane process by introducing
technologies developed by Asahi Glass, although a significant part of the company’s chlor-
alkali production is still based on the mercury process.
Krebs
Krebs had been one of the major engineering companies which had developed advanced
technologies for the mercury process, cooperating with BASF, one of the major chlor-alkali
producers in Germany. The company’s technology had been adopted by many chlor-alkali
producers not only in Western Europe but also in Japan, as we can see in Table 3-11 and
Table 3-18. Regarding the ion exchange membrane process, however, any remarkable
innovations have not been made by the company, as is suggested in Table 5-10. Rather than
developing its own technologies for the ion exchange membrane process, the company
introduced Asahi Glass’s technologies at the end of the 1980s (Krebs Swiss, 1997). Currently,
105 Recently, Krupp Uhde and De Nora have made public a plan to merge their chlor-alkali R&D, technology licensing, and plant construction activities into a 50-50 joint venture, named UhdeNora, in Milan (Alperowicz, D'Amico, and Westervelt, 2001; Chemical Week, 2001).
260

Krebs is a European representative of Asahi Glass and has been working to provide the ion
exchange membrane process technologies to chlor-alkali producers mainly located in Western
Europe (Krebs Swiss, 2001).
Technological Developments by Companies in Western Europe
As we have discussed in the proceeding section, several Western European companies which
had been previously innovative on the mercury process succeeded in developing their own
technologies for the ion exchange membrane process. Table 5-15 lists the technologies
developed by the innovative companies in Western Europe.
Table 5-15 Technologies Developed by Companies in Western Europe
Ion Exchange Membrane Process Company Mercury Process Ion Exchange Membrane Electrolytic Cell
ICI Steel Base - FM, BiChlor Uhde 10 m2
20 m2 31.5 m2
- Single Element
De Nora 14 x 3F 18 x 4 24 x 5
- DD
Solvay V-100F V-200F
- -
Krebs ZT 80-10-8 ZT 120-15-8
- -
Among the innovative companies based in Western Europe, three companies, namely,
ICI, Uhde, and De Nora, have developed technologies for the ion exchange membrane
process. Solvay and Krebs, on the other hand, did not make any significant innovations on the
ion exchange membrane process. As we have seen in Figure 4-2, the electrolyzer of the ion
exchange membrane process basically consists of the ion exchange membrane and the
electrolytic cell. While the three Japanese companies, that is, Asahi Chemical Industry, Asahi
Glass, and Tokuyama Soda, made innovations on both the ion exchange membrane and the
electrolytic cell, the Western European innovators, that is, Uhde, De Nora, and ICI developed
their technologies only for the electrolytic cell but not for the ion exchange membrane. These
European companies have introduced ion exchange membranes for their electrolytic cells
from the three Japanese companies.
106 Interviews with Solvay and Krebs were not possible to receive detailed information on their R&D activities.
261

The chronology of technological developments of chlor-alkali production processes by
companies in Western Europe is shown in Figure 5-6.
262

ICI
Uhde
62 63 ~ 75 76 77 78 79 80 81 82 83 84 85 86 87 88 89 90 91 92 93 94 95
De Nora
IM
IM
IM
• R&D • Pilot plant
• Commercial plant
• Pilot plant
• Demonstration plant • Commercial plant
• R&D
• Commercial plant
Hg
Hg
Solvay
Hg
Krebs
Hg
Hg: Mercury Process; IM: Ion Exchange Membrane Process
Hg
Construction/Operation of plants
Construction/Operation of plants
Construction of plants
Construction of plants
Construction of plants
• Membrane from Asahi Glass
• Membrane from Asahi Glass
IM
IM
• Process from Asahi Glass
• Process from Asahi Glass
• Membrane from Asahi Glass
• R&D
Figure 5-6 Technological Developments by Companies in Western Europe
263

As we have seen in Figure 4-6, in the case of the Japanese chlor-alkali industry, R&D
activities on the ion exchange membrane process were first initiated by Asahi Chemical
Industry in the late 1960s and by other innovative companies, including Asahi Glass,
Tokuyama Soda, in the early 1970s, and the commercial operation of chlor-alkali plants based
on the ion exchange membrane started in the middle of the 1970s at these companies’ own
production sites. In Western Europe, ICI started to undertake R&D activities on the ion
exchange membrane process as early as the beginning of the 1960s. With difficulties,
however, in obtaining ion exchange membranes which had sufficient chemical and
mechanical strength suitable for use in chlor-alkali electrolytic cells, the company had
stopped its innovative efforts on the ion exchange membrane process subsequently. Other
companies, including Uhde and De Nora, did not make any significant R&D efforts on the ion
exchange membrane process until the late 1970s. In the meantime, the operation of the
mercury process continued to be dominant for the production of chlor-alkali products in
Western Europe. And R&D efforts were directed towards developments of end-of-pipe
technologies for the reduction of mercury emissions, rather than alternative clean
technologies for the replacement of the existing mercury process.
By the late 1970s, the Japanese companies had made major innovations on ion
exchange membranes and had proved that the ion exchange membrane process was a well-
established technology which could be reliable utilized for commercial production. The rapid
progress in the technological performance of the ion exchange membrane process in Japan
provided strong incentives and technological basis to European companies. Several
innovative companies, namely, ICI, Uhde, and De Nora, then intensified R&D efforts to
develop their own technologies for the ion exchange membrane process in the late 1970s. By
that time, however, novel types of the ion exchange membrane had been already invented by
the Japanese companies, and there had been little room left to the later comers. That has
induced the European companies to focus their development efforts on the other important
components of the ion exchange membrane process, that is, the electrolytic cell. Ion exchange
membranes for use in their electrolytic cells were introduced from the Japanese companies.
Their technologies started to be applied for commercial plants in the middle of the 1980s.
In short, compared with the Japanese case, technological developments of the ion
exchange membrane process were delayed in Western Europe. These Western European firms,
including ICI, Uhde, and De Nora, had made significant innovations on the mercury process
264

by the beginning of the 1970s. With the introduction of emission standards on mercury
emissions, the strong technological expertise on chlor-alkali production was not devoted to
develop technologies for the ion exchange membrane process. That was in sharp contrast to
the Japanese case, in which the mandate for the phase out of the mercury process prompted
the equally innovative companies to develop and industrialize chlor-alkali production
technologies based on the ion exchange membrane process.
The chlor-alkali production technologies developed by Western European companies
have been subsequently adopted by other chlor-alkali producers. Figure 5-7 shows the trends
in the number of installations of the mercury process as well as the ion exchange membrane
process by companies in Western Europe. (Detailed data are given in Table 5-26 in Appendix
at the end of this chapter.)
0
5
10
15
20
1970 1975 1980 1985 1990 1995 2000
Year
Num
ber o
f Ins
talla
tions
Mercury Process
Ion ExchangeMembrane Process
Figure 5-7 Supply of the Mercury and the Ion Exchange Membrane Processes by Western European Firms
265

Figure 5-7 shows a contrast with the supply of the ion exchange membrane process by
the Japanese companies (Figure 4-7). During the 1970s there was a large amount of supplies
of the mercury process by Western European firms whereas the ion exchange membrane was
not yet developed to such an extent that it could be provided to chlor-alkali producers. Then
the supply of the ion exchange membrane started in the 1980s and maintained an upward
trend in the 1990s. Although the supply of the mercury process declined in the 1980s, it
continued until the middle of the 1990s.
Detailed data on the supply of the mercury and the ion exchange membrane processes
by ICI, Uhde, De Nora, Solvay, and Krebs are given in Table 5-16.
Table 5-16 Supply of the Mercury and the Ion Exchange Membrane Processes by Innovative Companies in Western Europe
ICI Uhde De Nora Solvay Krebs Year Hg IM Hg IM Hg IM Hg IM Hg IM
1970 0 0 7 0 1 0 1 0 2 0 1971 1 0 5 0 5 0 0 0 5 0 1972 0 0 6 0 6 0 1 0 0 0 1973 0 0 3 0 1 0 0 0 3 0 1974 0 0 2 0 2 0 2 0 3 0 1975 1 0 6 0 6 0 0 0 2 0 1976 0 0 5 0 4 0 0 0 6 0 1977 1 0 3 0 6 0 0 0 1 0 1978 0 0 2 0 0 0 0 0 0 0 1979 0 0 4 0 1 0 1 0 1 0 1980 0 0 0 0 4 0 0 0 1 0 1981 0 0 2 0 2 0 0 0 3 0 1982 0 0 0 0 1 0 0 0 0 0 1983 0 1 4 0 1 2 0 0 0 0 1984 0 3 0 2 0 0 0 0 0 0 1985 0 4 0 0 1 0 0 0 0 0 1986 0 0 0 1 0 1 0 0 0 0 1987 0 2 1 2 0 1 0 0 2 0 1988 0 1 0 3 2 1 0 0 0 0 1989 0 4 1 4 0 1 0 0 0 0 1990 0 3 0 3 2 1 0 0 0 0 1991 0 4 0 1 1 3 0 0 2 0 1992 0 3 0 4 0 2 0 0 0 0 1993 0 1 0 0 1 2 0 0 0 0 1994 0 2 0 5 1 6 0 0 0 0 1995 0 1 0 3 0 6 0 0 0 0 1996 0 1 0 6 0 5 0 0 0 0
266
1997 0 2 0 8 0 2 0 0 0 0 1998 0 5 0 6 0 3 0 0 0 0 Total 24 296 408 384 384 288 40 0 248 0
Hg: Mercury Process; IM: Ion Exchange Membrane Process. Figures refer to the number of installations. Pilot plants are excluded. Sources: Mercury Process: Chlorine Institute (1998a; 1998b). Ion Exchange Membrane Process: Imperial Chemical Industries (1999), Krupp-Uhde (1998), De Nora (1999).
While regulations on mercury emissions started to be imposed on the chlor-alkali
industry in Western Europe in the 1970s, the suppliers continued to provide their mercury
process technologies to chlor-alkali producers. Uhde, De Nora, and Krebs were particularly
active in providing their mercury process technologies to chlor-alkali producers during the
1970s. On the other hand, there was no commercial construction of the ion exchange
membrane process by these companies in the same decade. Industrial applications of the ion
exchange membrane process were started by ICI and De Nora in 1983 and by Uhde in 1984,
and since then installations by these companies at other chlor-alkali plants have followed
steadily. The mercury process, however, continued to be provided by the Western European
suppliers, although in a limited scale, during the 1980s. De Nora, in particular, continued to
supply its ion exchange membrane process technology until the last one was completed in the
middle of the 1990s. While new installations of the mercury process have been terminated,
the operation of the mercury process has been still maintained by many chlor-alkali producers
in Western Europe, including ICI, which has already developed and started to provide its own
technology for the ion exchange membrane process to other chlor-alkali producers.
The extent of the supply of the ion exchange membrane process by the Western
European firms can be seen by comparing with that by the Japanese firms. Figure 5-8 shows
the trend in the cumulative production capacities based on the ion exchange membrane
process which have been supplied by the Western European firms, including ICI, Uhde, and
De Nora, and the Japanese firms, including Asahi Chemical Industry, Asahi Glass, Tokuyama
Soda, and CEC. (Detailed data are given in Table 5-27).
267

0
2,000,000
4,000,000
6,000,000
8,000,000
10,000,000
12,000,000
14,000,000
1975 1980 1985 1990 1995 2000Year
Cum
ulat
ive
Prod
uctio
n C
apac
ities
(t N
aOH/
year
)
Japanese FirmsWestern European Firms
Figure 5-8 Supply of the Ion Exchange Membrane Process by Japanese and Western European Firms
From the middle of the 1970s to the early 1980s, while there was no supply of the ion
exchange membrane process by the Western European firms, it was installed by the Japanese
firms mainly at chlor-alkali plants operated by the innovative companies themselves. The
experienced obtained in this period provided the Japanese companies with expertise valuable
to improve their technologies, and that gave them advantages in supplying the ion exchange
membrane process to chlor-alkali plants in other parts of the world. Although the Western
European suppliers began to provide their technologies in the middle of the 1980s, their
delayed start has resulted in the large gap with the Japanese early movers.
268

5.4 Slow Diffusion of the Ion Exchange Membrane Process
As Figure 5-5 shows, the mercury process has continued to be the dominant technology in
Western Europe, whereas the share of the ion exchange membrane process, which is now the
most efficient technology without any emission of pollutants, is limited to less than 15 %.
Although a sign of increase has been observed recently in the adoption of the ion exchange
membrane process, its diffusion is still limited, particularly compared with the case of the
Japanese chlor-alkali industry, in which almost all of the production capacities are currently
based on the ion exchange membrane process.
In this section, we examine why the diffusion of the ion exchange membrane process
has been slow among chlor-alkali producers in Western Europe. As we discussed in Chapter 2,
there are basically two factors which would inhibit the diffusion of a new technology. They
concern the availability of information on the new technology and the profitability of its
adoption. We consider them in turn for the analysis of the adoption of the ion exchange
membrane process in Western Europe.
5.4.1 Availability of Information on the Ion Exchange Membrane Process
First, we examine whether the availability of information has been the limiting factor for the
diffusion of the ion exchange membrane process in Western Europe. An academic paper on a
successful commercial operation of chlor-alkali plant based on the ion exchange membrane
process was published for the first time on the journal, Industrial and Engineering Chemistry,
Product and Research Development, in 1976 by a researcher of Asahi Chemical Industry
(Seko, 1976). In the middle of the 1970s, however, the European chlor-alkali industry was
short of “credible” information on the performance and the reliability of the ion exchange
membrane process (Mellish, 1977). With fairly short experience of the new technology, chlor-
alkali producers needed good solid data on any change in technology before spending money
on new plants relying on it. Since 1979, the Electrochemical Technology Group of the
Society of Chemical Industry, a UK-based industry association of chemical companies, has
organized a symposium on chlor-alkali technologies in London every three years. The
organizing committees of these symposiums consisted of representatives of chlor-alkali
producers in Western Europe. The proceedings, edited by technological experts of chlor-alkali
manufacturers in UK, were published one year after each symposium. Table 5-17 gives the
trends in the number of presentations as well as participants of the symposiums.
269

Table 5-17 Presentations on Chlor-Alkali Production Processes at the London International Chlorine Symposiums
Year Mercury process Diaphragm process Ion Exchange Membrane process
Totala
1979 4 5 9 23 1982 0 4 9 24 1985 0 0 12 30 1988 0 1 15 29 1991 1 1 11 26 1994 0 5 9 28 1997 1 4 8 26 2000 1 2 7 25
* Presentations which were not included in the proceedings are excluded. Only for 2000 all the presentations are included. a: The total also includes presentations concerning general aspects such as economic, safety, and environmental issues. Sources: 1976: Society of Chemical Industry (1977). 1979: Coulter (1980). 1982: Jackson (1983). 1985: Wall (1986). 1988: Prout and Moorhouse (1990). 1991: Wellington (1992). 1994: Curry (1995). 1997: Sealey (1998). 2000: Society of Chemical Industry (2000).
Entering in the 1980s, paper presentations increasingly dealt with this new field of
technology and more detailed technical information started to be disclosed. By the late 1980s,
more than half of the presentations had come to focus on the ion exchange membrane process.
In contrast, very few presentations have been made on the mercury process since 1980s. At
each meeting, technical experts from process developers made presentations on their latest
technologies to the audience from chlor-alkali producing companies. The compositions of
participants in the meetings held in 1991 and 1994 are given in Table 5-18. As we can see in
the table, more than 200 people in each meeting, and the representatives of major chlor-alkali
companies in Western Europe, including ICI, Uhde, De Nora, Solvay, and Krebs, as well as
those in Japan, such as Asahi Chemical Industry, Asahi Glass, and CEC, were all present at
the meetings.
Table 5-18 Participants in the London International Chlorine Symposiums
Number of Participants Country Company 1991 1994
ICI 17 19 Hays 8 10 Roche 3 5 Octel 3 4
United Kingdom
British Salt 3 2
270

Badger Cat. 3 1 Others 14 18
51 59Uhde 3 5 Bayer 4 4 Lurgi 3 0 BASF 3 2 Dow (Stade) 6 3 Others 8 6
Germany
27 20Eka Nobel 7 5 Permescand 5 3 Others 5 4
Sweden
17 12De Nora 7 6 Others 7 3
Italy
14 9Rhone Poulenc 6 7 Elf Atochem 4 4 Others 2 3
France
12 14Akzo-Nobel 5 7 Others 4 0
Netherlands
9 7Solvay 3 3 Others 6 3
Belgium
9 6Finland 6 2Norway 5 5Switzerland 4 3Ireland 2 2Portugal 2 1Spain 1 2Austria 0 1Denmark 0 1
Western Europe 164 154CEC 7 5
Asahi Chemical 6 3 Asahi Glass 4 2
Mitsui Toatsu 4 1 Permelec Electrode 2 1
Du Pont 2 0
Japan
25 12Other regions 58 65
271

Total 247 231Source: Shiroki (1994).
In the meantime, following the publication of the seminal paper on the first commercial
application of the ion exchange membrane process in 1976, papers and articles showing
technical aspects of the ion exchange membrane process started to appear. They were mainly
published in trade journals, such as the Journal of Applied Electrochemistry (e.g. Bergner,
1982), Chemistry and Industry (e.g. Jackson and Kelham, 1984), Chemical Engineering (e.g.
Means and Beck, 1984), Chemical and Engineering News (e.g. Stinson, 1982), Chemical
Week (e.g. Brooks, 1986), Chemische Industrie (e.g. Luke, 1989), and Chemiker-Zeitung (e.g.
Bergner, 1977). At the same tine, there were an increasing number of reports on cases dealing
with conversions of the mercury process to the ion exchange membrane process undergoing
in the Japanese chlor-alkali industry. These various sources of information indicated that the
newly developed technology of the ion exchange membrane process had reached a stage
ready for industrial applications. Therefore, we could arguably conclude that it is highly
unlikely that chlor-alkali producers in Western Europe were not aware of the feasibility or
performance of the ion exchange membrane process. That would bring us to the second
reason why the diffusion of a new technology could be delayed; that is, the profitability of the
adoption of the ion exchange membrane process.
5.4.2 Profitability of the Adoption of the Ion Exchange Membrane Process
We discussed in Chapter 2 that a new clean technology is adopted when it is profitable to do
so. That means, in the case of technological change for pollution abatement, the existing
technology is replaced with a new clean technology when the total cost of operating the
existing technology with the end-of-pipe technology is larger than that operating the clean
technology:
TCe(a, t) > TCc(t),
that is,
PCo – PCc(t) > ICc – ICe – ACe(a, t).
With this model, we examine the diffusion of the ion exchange membrane process in Western
Europe.
272

Investment Cost of Introducing the Ion Exchange Membrane Process
We first consider the investment cost of introducing the ion exchange membrane process.
Capital costs required in the chemical process industries are often assumed to be subject to
economies of scale, with a scaling-up factor. One of the most frequently used empirical rules
is the so-called “sixth-tenth factor rule” (Bruni, 1964). This empirical rule has been justified
by noting that the cost of a piece of equipment or of an entire plant, at least in many industries
having a continuous production process, depends mainly on the surface area of the plant
equipment whereas production capacity depends on the volume. Assuming that plant
equipment of different capacity have walls of equal thickness and that the cost of the
equipment is proportional to their weight, the cost varies in proportion to their volume, i.e.
their capacity, taken to the power of 2/3107.
In contrast to this general rule of 2/3 scaling-up factor applied for a single large-scale
production unit, a chlor-alkali electrolytic plant has multiple cell elements into a single unit,
called electrolyzer. Each electrolyzer consists of a large number of cell elements, following
either of two basic designs, monopolar or bipolar. The elements are connected in series with
resultant low current and high voltage in a bipolar arrangement whereas in the monopolar
type cell all anodes and cathodes are connected in parallel, forming an electrolyzer with high
current and low voltage108. And then multiple electrolyzers are employed in a single direct
current circuit; usually bipolar electrolyzers are connected in parallel with low current and
high voltage whereas monopolar electrolyzers are often connected in series, resulting in a
high current circuit and low voltage. For example, one of the bipolar type electrolyzers
produces 15,000 tonnes of caustic soda per year, meaning that a plant with an annual capacity
of 120,000 tonnes of caustic soda would need eight electrolyzers (Schneiders and Luke, 1992).
One recent case of the process conversion required 848 cell elements, and another case
needed 1,536 cell elements (Kramer and Luke, 1990). In essence, electrolysis for chlor-alkali
107 This rule can be demonstrated in elementary geometry by considering spherical or cylindrical tanks whose height is constantly related to their diameter. The surface area A and the volume V of a spherical tank are
A = 4πR2 (5f-1) V = 4/3πR3, (5f-2)
where R is the diameter of the tank. The capital cost of the plant equipment C is C = coA = 4πcoR2, (5f-3)
where co is the unit cost of the equipment material. From equation (5f-2) we can derive R = (3/4π)1/3V1/3. (5f-4)
Hence we obtain C = 32/3(4π)1/3coV2/3 = kV2/3, (5f-5)
where k = 32/3(4π)1/3co, which is constant. 108 Data on various types of the electrolytic cell are given in Table 5-31 in Appendix at the end of this chapter.
273

manufacture is a two-dimensional process, which consists of a large number of relatively
small electrolytic cells connected with each other. We hence assume that the scaling-up factor
can be approximated to unity.
In converting chlor-alkali plants from the mercury process to the ion exchange
membrane process, while the rectifier, chlorine and hydrogen systems, and caustic storage
could continue to be used, several new facilities will be required to utilize the ion exchange
membrane process (Austin and Esayian, 1984). The use of high-performance ion exchange
membranes requires a new secondary brine purification step to remove calcium and
magnesium to a level of less than 50 ppb, but the cost of the brine system for the ion exchange
membrane process is relatively small, 4-7 % of the total capital investment (Schmittinger,
Curlin, Asawa, Kotowski, Beer, Greenberg, Zelfel, and Breitstadt, 1986). In addition, many
electrolyzer designs for the ion exchange membrane process include a caustic circulation loop
to provide temperature control as well as mixing to achieve a uniform concentration profile in
the cathode chamber. Deionized water is added to the catholyte loop to control the caustic
concentration. When 50 % caustic is required, evaporators will be needed to further
concentrate the 32-35 % caustic produced by the ion exchange membrane electrolyzers, and
additional steam generating facilities may also be required depending on the site situation.
The installation of these facilities cost 3-4 % of the total investment(Schmittinger, Curlin,
Asawa, Kotowski, Beer, Greenberg, Zelfel, and Breitstadt, 1986).
Taking these aspects into account, we assume here that the total investment cost of
process conversion can be basically represented by the cost for the electrolytic cells and ion
exchange membranes. Since the scaling-up factor can be approximated to be 1, the unit
capital investment will be almost constant for plants of varying capacities, and thus the total
capital investment will rise proportionately as the plant size increases. This treatment can be
justified by the fact that the capital investment cost is normally discussed in this way by
experts in the chlor-alkali industry, although not so much information has been disclosed on
the actual investment costs of converting the mercury process to the ion exchange membrane
process109.
109 Converting mercury cells to ion exchange membrane cells incrementally over a period of time within a mercury cellroom is not generally considered to be practical or cost effective by those working in the industry (Lindley, 1997). First, because for ion exchange membrane cells trace quantities of mercury can have a significant impact on the performance of the ion exchange membrane, a separate recirculated brine system would be required. Second, since the cell layouts are totally different for ion exchange membrane and mercury cells, with the power densities and heat loads different, a separate power supply system (rectifiers) would be needed. Furthermore, as the mercury cell room layout is designed to enable mercury to be contained, operating
274

At the end of the 1970s, when several plants based on the ion exchange membrane
process started to operate in Japan, the three technology providers, namely, Asahi Chemical
Industry, Asahi Glass, and Tokuyama Soda, reported that the investment cost of installing the
ion exchange membrane process would be approximately 7 billion yen for a plant of an
annual capacity of 100,000 tonnes of caustic soda (Expert Committee for Technical
Evaluation of the Ion Exchange Membrane Process, 1979). That corresponds to 320 US$/t
NaOH, which is equivalent to 360 US$/t Cl2110. While this conversion cost was probably
estimated to be lower, as this figure did not include a significant amount of investment costs
required for dismantling the existing mercury process.
In the United Kingdom, Associated Octel Company converted its chlor-alkali plant at
Ellesmere Port, Cheshire, with a capacity of 40,000 t Cl2 per year in 1992 from the mercury
process to the ion exchange membrane process (Lott, 1995). In this case, new electrolytic
cells could be installed in the existing cellroom, but the decontamination of mercury at the
site required a significant treatment. A completely new caustic recirculating system and a
holding tank had to be installed as a guard against iron and mercury contamination. Other
equipment included a secondary brine treatment plant reducing calcium and magnesium ions
in the brine down to ppb levels. As samples of the pure brine from the mercury cells system
indicated high levels of silicate, a salt dissolving pit and a brine handling tank were taken out
of service and relined with plastic. The reused brine system was subsequently demercurized.
The disposal of the mercury cell steelwork proved more time-consuming and costly. In total
the company made an investment of £ 11,583,000 in this conversion project, including
cellroom, new equipment, modifications to the existing plant, labor and administration, and
the disposal of the contaminated steel. This figure corresponds to an investment of 510 US$/t
Cl2 capacity.
A case of the conversion of the mercury process to the ion exchange membrane process
at the Borregaard plant in Norway in 1997 has shown that the total cost was around 200
million NOK, equivalent to US$ 28 million (Borregaard, 1998). A new electrolysis section
was constructed, and a brine circuit for filtration, secondary purification with ion exchange
and dechlorination, a unit for concentrating caustic soda, and units for chlorine gas drying and
ion exchange membrane cells within the same cellroom would require some mercury containment activities and some of the working practices. Therefore, conversion from mercury cells to ion exchange membrane cells is normally carried out for a complete cellroom at a single instance.
275

absorption were newly installed. Among the reused equipment were the rectifiers, the units
for hydrogen treatment and chlorine hydroxide production, and the sections for chlorine
liquefaction and compression. Mercury filtration units for caustic, hydrogen and process
exhaust were removed, and pumps, instruments and pipelines were replaced. A significant
portion of the total conversion cost was spent for cleaning the old plant and depositing, about
half of which was invested on constructing a mercury disposal facility. With the annual
production capacity of 40,000 tonnes of chlorine, the unit cost of the conversion was 710
US$/t Cl2.
Technology suppliers, on the other hand, suggest smaller figures for the investment cost
of installing the ion exchange membrane process. Asahi Chemical, one of the major
technology suppliers, estimates the current investment cost of converting an existing mercury
plant to the ion exchange membrane process is in the range of 300-350 million Japanese yen
for an annual capacity of 10,000 tonnes of caustic soda (Hamada, 2000). That roughly
corresponds to 280-320 US$/t NaOH, which is equivalent to 310-360 US$/t Cl2 capacity. In
this estimation it is assumed that only the mercury cells are replaced by the ion exchange
membrane cells, while reusing other equipment for salt solution, primary treatment of brine,
chlorine and hydrogen treatment. For construction of a new plant in a green field, the cost will
be 1.2-1.5 billion Japanese yen for a similar capacity. That means the unit cost of 990-1,200
US$/t NaOH, equivalent to 1,100-1,400 US$/t Cl2. Uhde takes 600 DM/t NaOH, equivalent
to 290 US$/t NaOH, as a current investment figure for the conversion of a mercury-based
plant to the ion exchange membrane process (Zimmermann, 2000). This figure, which
corresponds to 320 US$/t Cl2, is only for cellroom conversion, and various equipment are
assumed to be used from the existing plant. Uhde also cites a very rough estimate of the total
investment cost of 600-700 US$/t NaOH for a plant of 250,000-500,000 t NaOH per year
(Henson, 1997). This figure includes the total plant and equipment, piping, utilities and
constructions, excluding only the land cost.
As we can see, the investment cost quoted varies depending on the technical
requirements for any particular conversion as well as on what should be included in the
calculation of the necessary costs. Technology suppliers quote figures at the lower end for the
conversion costs, at around 350 US$/t Cl2. They have not changed so much since the first
110 The industry prefers terminology for capacity and power consumption expressed in tonnes of caustic soda (NaOH 100%) because chlorine gas flows are expensive to measure. The conversion factor used is 1.128 tonnes of NaOH 100% for every tonne of chlorine produced.
276

introduction of the ion exchange membrane process in the late 1970s. Considering inflation,
the real cost has indeed declined significantly, due partly to a decline in the price of ion
exchange membranes and partly to an increase in the current density, which reduced the
number of electrolytic cells (Bordoni, 2000; Luke and Beckmann, 1999). These figures,
however, represent the minimum costs necessary for the conversion of the existing mercury-
based plants to the ion exchange membrane process. They do not include expenditures for
cleanup and safe dismantling and disposal of equipment in contact with mercury, which is
increasingly important as mercury-containing wastes above a threshold concentration, for
example, 3 % in the European Union as mandated by Directives 91/689/EEC and 94/904/EC,
are classified as “hazardous” (Euro Chlor, 1999b).
It would hence be reasonable to take cost figures based on the actual cases of process
conversion including the costs of the cleaning and disposal of mercury. In that sense, the
investment cost of 700 US$/t Cl2 for the process conversion at Borregaard would be
appropriate as the representative figure for the total investment cost of converting the existing
mercury plants to the ion exchange membrane process, as it includes the costs necessary for
cleanup and disposal of equipment contaminated with mercury This figure roughly
corresponds to estimations made by those people working in the chlor-alkali industry in
Western Europe. For example, Straasheijm (2000) cites 1,500 NLG/t Cl2, equivalent to 630
US$/t Cl2 whereas Lindley (1997) estimates that a typical conversion cost would be in the
range between 560 and 610 ECU/t Cl2 for an average mercury plant capacity in Western
Europe. Euro Chlor (1996) estimates the capital cost of conversion of an average size mercury
plant (100,000 t Cl2/year) to its equivalent ion exchange membrane plant to be approximately
700 ECU/t Cl2 capacity. Therefore, considering that the nominal minimum investment cost
has been virtually unchanged since the late 1970s, we assume here that the nominal total
investment cost per unit capacity has been constant at the level of 700 US$/t NaOH.
For this kind of production plants in the chemical process industries, the depreciation
period is normally taken to be 10 years, although the physical lifetime of these plants can be
much longer. A major reason suggested by industry experts is that, given the unstable nature
of developments in the chlor-alkali industry, predicting the economic viability of this type of
plant much beyond 10-15 years is considered difficult, and prudent accounting practices tend
to be adopted (Lindley, 1997). Accordingly, we here assume a straight depreciation of 10
years. That means that, as the estimated cost for the conversion of the mercury process to the
277

ion exchange membrane process is about 700 US$/t NaOH, the annualized investment cost of
introducing the ion exchange membrane process ICc is 70 US$/t NaOH.
Cost of Reducing Mercury Emissions with End-of-Pipe Technologies
It is very difficult to assess exactly the costs associated with pollution abatement with end-of-
pipe technologies. We could see at least, however, that the scale of the cost of reducing
mercury emissions with end-of-pipe technologies has been much smaller than that of
converting the mercury process to the ion exchange membrane process. In the 1970s, the
investment cost of installing the calomel process for removing mercury from gases was
estimated to be 1.58 DM, equivalent to 0.79 US$, per tonne of chlorine capacity (Richter,
2000). A similar estimation of the cost of scrubbing with chlorine-containing brine or with
alkaline hypochlorite solution was in the range of 1.74-1.77 DM, corresponding to 0.87-0.88
US$, per tonne of chlorine capacity. The operating cost of these processes, on the other hand,
was reported to be in the range of 3-7 % of the investment (Rekers, 1973). The total cost of
reducing mercury in liquids with pre-coated carbon filters was also reported to be
approximately 1 US$ per tonne of caustic soda. These figures indicate that the cost of
reducing mercury emissions with end-of-pipe technologies in the 1970s was a little more than
0.1 % of the cost of plant conversion from the mercury process to the ion exchange membrane
process, which has been around 700 US$ per tonne of production capacity.
Currently, the cost of installing a sulfurized active carbon system, including the heat
exchanger necessary to increase the temperature after the cooling step, the equipped tower,
and the filters, to remove mercury from liquids is reported to be in the range of 0.45-0.5
million Euro for a plant with chlorine capacity of 166,000 tonne (European IPPC Bureau,
1999). That corresponds to 2.7-3.0 US$ per tonne of chlorine capacity. The cost of installing
the activated carbon filtration in pre-coated candle or plate filters is around 0.25 million Euro
for a production capacity of 100,000 tonne of chlorine per year, which is equivalent to 2.5
US$ per tonne of chlorine capacity. These figures still correspond to less than 1 % of the
investment cost of converting the mercury process to the ion exchange membrane process.
We could therefore conclude that, compared with the investment cost of converting the
mercury process to the ion exchange membrane process ICc, the cost of installing and
operating end-of-pipe technologies ICe + ACe has been much smaller; that is,
ICc >> ICe + ACe.
278

Saving in Production Cost from the Conversion of the Mercury Process to the Ion
Exchange Membrane Process
Next, we consider the saving in the production cost by the conversion of the mercury process
to the ion exchange membrane process. The fixed costs for operators and other personnel,
taxes, insurance, repairs, and maintenance have been approximately the same for the mercury
process and the ion exchange membrane process (Euro Chlor, 1996; Schmittinger, Curlin,
Asawa, Kotowski, Beer, Greenberg, Zelfel, and Breitstadt, 1986). Of the variable costs, the
expense for salt, chemicals (e.g. precipitants), and anode reactivation are almost equal for
both processes. The difference among the three processes shows up in the consumption of
energy, in the form of electricity and steam, which normally accounts for about two thirds of
the total operating cost. Therefore, we can focus on only one factor, that is, energy
consumption, in considering cost saving by switching from the mercury process to the ion
exchange membrane process.
As we have seen in Figure 4-8, the energy consumption of the ion exchange membrane
process has shown a remarkable improvement since the early 1970s. Concomitant with the
technological progress, the cost saving from the conversion of the mercury process to the ion
exchange membrane process has increased. Figure 5-9 shows the trends in the cost saving
from the conversion of the mercury process to the ion exchange membrane process in
Western Europe, as compared with the annualized investment cost necessary for it. (Detailed
data are given in Table 5-32 in Appendix at the end of this chapter.) It is constructed by using
the data on the extent of technological progress and the electricity price. As mentioned above,
we assumed that the energy consumption of the mercury process has been constant at the
level of 3,200 kWh/t NaOH. The data on the average electricity price in Western Europe is
obtained from International Energy Agency’s Energy Information (International Energy
Agency, 1992, 1993, 1999). Since the late 1970s, the electricity price in Western Europe has
increased steadily; between 1978 and 1995 it rose by about 100 %, measured in US dollars.
279

-60
-40
-20
0
20
40
60
80
1970 1975 1980 1985 1990 1995 2000
Year
Cos
t (US
$/t N
aOH)
Investment CostCost Saving
Figure 5-9 Cost Saving from the Conversion from the Mercury Process to the Ion Exchange Membrane Process and Annualized Investment Cost
Until the middle of the 1970s the ion exchange membrane process was less energy-
efficient than the mercury process, and thus the production of cost with the former was higher
than that of the latter. Accordingly, there was no incentive, at least for commercial purposes,
to adopt the ion exchange membrane process for chlor-alkali production in Western Europe.
As the energy efficiency of the ion exchange membrane process was improved steadily, the
operating cost of the ion exchange membrane process had become substantially lower than
that of the mercury process by the early 1980s. Thus, for newly constructed chlor-alkali plants,
the ion exchange membrane process has become the preferable technology since then. For the
existing plants based on the mercury process, however, considering that these plants can still
be used physically for chlor-alkali production, the expected cost saving needed to be large
enough to justify the investment cost necessary to convert the mercury process to the ion
exchange membrane process.
280

We can see Figure 5-9 in relation to Figure 2-10(b), which has been discussed in the
analytical framework. During the 1980s, the cost saving by process conversion PCo – PCc(t)
was in the range of 30-50 US$/t NaOH and thus remained short of completely offsetting the
investment cost for the ion exchange membrane process ICc of 70 US$/t NaOH; that is,
PCo – PCc(t) < ICc.
Although the investment expenditure for process conversion could be lower for some plants,
it has been still uneconomical for most of the mercury plant operators to convert their
mercury-based plants to the ion exchange membrane process. Thus there exist large
incentives to continue to use the mercury process at their existing plants as long as they can
be utilized for chlor-alkali production, while inhibiting the diffusion of the ion exchange
membrane process in Western Europe. That consideration leads us to examine the age of
chlor-alkali plants based on the mercury process.
5.4.3 Long Lifetime of Chlor-Alkali Plants Based on the Mercury Process
The construction of a chlor-alkali plant, whether it is based on the mercury process or the ion
exchange membrane process, is capital-intensive and requires dedicated buildings. The
lifetime of a plant depends in part on the functional life of the building in which it is housed.
While electrolytic cells and some other inventory are routinely maintained, refurbished, or
renewed, plants can operate in the same layout and fulfill the commercial needs for a long
period of time (Euro Chlor, 1998b). As we have discussed in the previous section, currently
the cost saving from the conversion of the mercury process to the ion exchange membrane
process is not sufficient to offset the necessary investment. Therefore, the introduction of the
ion exchange membrane process, although currently the most efficient technology for chlor-
alkali production, will be delayed until the existing mercury-based plants come to the end of
their physical lifetimes.
In this section, we compare the operating period of chlor-alkali plants based on the
mercury process and those based on the ion exchange membrane process in Western Europe.
We would like to see how long the chlor-alkali plants which had been originally based on the
mercury process were operated before conversion to the ion exchange membrane process. To
do that, we investigate the timing of the construction of the new membrane-based plants as
well as the original mercury-based plants. Then, by looking at the operating years of the
existing mercury-based plants, we can examine whether these plants are close to the end of
their lifetimes, that is, whether these plants are expected to be converted to the ion exchange
281

membrane process soon. The data on the construction and conversion of these plants were
basically obtained from the companies operating them.
Figure 5-10 shows the operating period of the mercury process before it was converted
to the ion exchange membrane process at 15 chlor-alkali plants in Western Europe. (Detailed
data on the start-up year of the mercury and the ion exchange membrane processes of each
plant are given in Table 5-33 in Appendix at the end of this chapter.)
1900 1910 1920 1930 1940 1950 1960 1970 1980 1990 2000
1
2
3
4
5
6
7
8
9
10
11
12
13
14
15
Plan
t
Year
Average: 51.5 years
Figure 5-10 Operating Period of the Mercury Process before Its Conversion to the Ion Exchange Membrane Process in the Western European Chlor-Alkali Industry
Most of the installations of the ion exchange membrane process in the 1980s were
undertaken for newly constructed chlor-alkali plants, rather than for the conversion of the
existing mercury process. As we have seen above, by the early 1980s the energy consumption
of the ion exchange membrane process had become much smaller than that of the mercury
process. Accordingly, given that the construction cost was almost the same for the two
production processes, it was reasonable for chlor-alkali producers to choose the ion exchange
282
membrane process when they constructed new plants. In the case of Akzo Nobel’s plant in
Botlek, the company decided to establish a new plant with the ion exchange membrane
process just next to a mercury-based plant. While the production capacity based on the ion
exchange membrane process was increased significantly in order to meet growing demands
for chlorine, the existing mercury plant was abolished subsequently (Straasheijm, 1999).
Although the storage and loading facilities which had been already established could be
utilized for the ion exchange membrane process, most of the infrastructures, including those
for cooling water supply, electrical provision, direct chlorination (for vinyl chloride monomer
production) had to be newly constructed (Straasheijm, 2000).
While the ion exchange membrane process was introduced to new plants during the
1980s, the conversion of the existing mercury-based plants was not economically attractive.
In all of the cases except for two, the original mercury process was operated for at least 40
years, and in some plants the operating period reached 60 years. On average, the mercury-
based plants which had been converted subsequently were utilized for more than 50 years.
This figure corresponds to the general view held by experts in the industry that the lifetime of
chlor-alkali plants based on the mercury process is normally in the range of 40-60 years (Euro
Chlor, 1998b). Once mercury-based plants had been constructed, the operators had strong
incentives to continue to utilize them as long as possible, and the conversion of these plants
did not take place until they reached their physical lifetimes, the average of which was
approximately 50 years.
Next we would like to know how long the existing chlor-alkali plants based on the
mercury process have been operating. Figure 5-11 shows the operating period of 51 chlor-
alkali plants currently operating with the mercury process in Western Europe. (Detailed data
on each plant are given in Table 5-34 in Appendix at the end of this chapter.)
283

1900 1910 1920 1930 1940 1950 1960 1970 1980 1990 2000123456789
101112131415161718192021222324252627282930313233343536373839404142434445464748495051
Plan
tYear
Average: 32.6 years
Figure 5-11 Operating Period of the Existing Chlor-Alkali Plants based on the Mercury Process in Western Europe
The figure indicates that many chlor-alkali plants were constructed in the 1960s and the
1970s by adopting the mercury process whereas at the beginning of the 1980s the mercury
process ceased to be adopted for newly constructed chlor-alkali plants in Western Europe.
The average of the operating years of the existing mercury-based plants is a little longer than
30 years, which is 20 years shorter than the average lifetime of 50 years for the mercury-
based plants which have been already converted to the ion exchange membrane process.
While new construction of chlor-alkali plants based on the mercury process have been already
terminated, most of the existing mercury-based plants have not yet reached the end of their
physical lifetimes.
284
In particular, we should note that there are many mercury plants which were built in the
1970s. In the same period, as we have discussed earlier, environmental regulations on
mercury emissions started to be introduced in Western Europe. As these regulations were not
so stringent as to require immediate phase out of the mercury process, chlor-alkali producers
chose to rely on this process for the construction of new production facilities during the 1970s,
rather than to try to innovate on new clean technologies such as the ion exchange membrane
process, which was still at its infant stage at that time. To comply with standards on mercury
emissions from chlor-alkali plants, innovative companies directed R&D efforts for end-of-
pipe technologies designed to be installed at the final stage of the mercury process.
Reasonably good end-of-pipe technologies have been developed and adopted to reduce
mercury emissions to the extent that the emission standards have been met by all of the
mercury-based chlor-alkali plants in Western Europe.
On the other hand, innovations on end-of-pipe technologies to reduce mercury
emissions helped chlor-alkali producers continue to build their new plants with the mercury
process during the 1970s. That has resulted in the current existence of many mercury-based
plants which have not yet reached the end of their lifetimes. The operators of these relatively
new plants have incentives to continue to use them as long as they can be utilized, avoiding
plant conversions from the mercury process to the ion exchange membrane process. The
success of end-of-pipe technologies in reducing mercury emissions has in effect prolonged
the lifetime of the mercury process, which is actually in the process of technological
obsolescence, while inhibiting the diffusion of advanced clean technologies such as the ion
exchange membrane process.
With this background, the European chlor-alkali industry is strongly opposed to the
implementation of the mandated phase-out of all the mercury plants in Western Europe by
2010 (Hain, 1999). In an attempt to convince the OSPAR Commission to reverse this decision,
the European industry association, Euro Chlor, organized a workshop in September 1999,
inviting the members of the OSPAR Commission (OSPAR Commission, 1999b). At this
workshop, where technical issues were mainly discussed without making any official decision,
Euro Chlor demanded that the recommendation for the phase-out of the mercury process by
2010 be dropped from the Decision 90/3. In place of it, the industry made a proposal for
voluntary actions, with the commitment of all of the chlor-alkali producers currently using the
mercury process. The voluntary actions specified that the European chlor-alkali industry will
not increase production capacity based on the mercury process and that at the same time it
285

will reduce mercury emissions further beyond the PARCOM Decision 90/3 standard of 2 g
Hg/t Cl2 capacity for emissions to the atmosphere (Euro Chlor, 1999c).
More concretely, the operators of mercury-based plants have pledged to achieve an
annual weighted average level of mercury emissions to air, water and in products not
exceeding 1.0 g Hg/t Cl2 capacity by the end of 2007 and to work towards a level not
exceeding 0.7 g Hg/t Cl2 capacity by 2010, “on condition that the plants concerned are
allowed to operate beyond the year 2010.” In addition, arguing that, depending on various
factors such as design, age and geography, some plants may not be able to achieve the
specified targets while others will be able to achieve even lower emission levels, the
companies have made a further commitment that individual plants will not exceed a level of
mercury emissions to air, water and in products of 1.5 g Hg/t Cl2 capacity by the end of 2007.
It has also been agreed that shutdown mercury-based plants will not be sold or transferred to
any third party for reuse111. Debates are still continued between the industry and the public
authorities, and it remains to be seen whether the requirement for the phase out of the
remaining mercury plants will be abandoned in Western Europe.
If we look at the situation in the world, the share of the ion exchange membrane process
in chlor-alkali production has been increasing steadily. Figure 5-12 shows the trends in the
installation of the mercury process, the diaphragm process, and the ion exchange membrane
process at chlor-alkali plants in the world. (Detailed data are given in Table 5-35 in Appendix
at the end of this chapter.)
111 Early in the 1990s a chlor-alkali producer in Pakistan, Ravi Alkalis Ltd., considered importing a Danish mercury-based chlor-alkali plant for rebuilding. The three-plant complex, owned by DS Industries ApS in Copenhagen had been the focus of controversy in Denmark for over 20 years because in the 1960s and 1970s it had a history of violating water emissions limits. Its environmental performance dramatically improved in the 1980s and met all environmental regulations by 1990, when the company decided to shut down the plant. Under the Danish law, the unit would not be considered hazardous if it were reopened or rebuilt and used, as intended (Siddiqi, 1994). In the end, however, the Pakistani producer installed the ion exchange membrane process, instead of the used mercury process (Krupp-Uhde, 1998).
286

0
10
20
30
40
1970 1975 1980 1985 1990 1995 2000
Year
Inst
alla
tions
Mercury Process
Diaphragm Process
Ion ExchangeMembrane Process
Figure 5-12 Installation of the Mercury, Diaphragm, and Ion Exchange Membrane Processes in the World
During the 1970s, the mercury process was the production technology which was
adopted almost exclusively at chlor-alkali plants around the world. The only exception was
Japan, where the newly established ion exchange membrane process started to be adopted by
several innovative companies in the middle of the 1970s. As the performance of the ion
exchange membrane process had been improved by the early 1980s, most of the chlor-alkali
production processes installed in the 1980s were based on the ion exchange membrane
process. On the other hand, the introduction of the mercury process has been virtually stopped,
due to its less energy efficiency compared with that of the ion exchange membrane process, as
well as due to the environmental and health concerns with mercury emissions.
These recent trends in the choice of chlor-alkali production technology are reflected in
the relative composition of the world production capacities. Although there is no official data
287

which covers detailed figures for the production capacities in different regions of the world,
Figure 5-13 shows an estimation of the trends in the shares of production capacities based on
the mercury process, the diaphragm process, and the ion exchange membrane process in the
world chlor-alkali industry since 1980. (Data are given in Table 5-36 in Appendix at the end
of this chapter.)
0%
10%
20%
30%
40%
50%
60%
70%
80%
90%
100%
1980 1990 1999
Year
Ion ExchangeMembrane ProcessDiaphragm Process
Mercury Process
Figure 5-13 Shares of the Mercury, Diaphragm, and Ion Exchange Membrane Processes in the World
We can see that the share of the ion exchange membrane process in the world has been
rising rapidly while the mercury process has been decreasing its share. In 1980, about a half
of the world chlor-alkali production capacities were based on the mercury process and another
half based on the diaphragm process, with the ion exchange membrane process almost
negligible. Since then, however, the technological choice of the world chlor-alkali industry as
a whole has been shifting steadily from the mercury and diaphragm processes towards the ion
exchange membrane process. Over the period between the late 1970s and the end of the 1990s,
288

the ion membrane process increased its share in the world from almost zero to 30 per cent.
That means that the newly established ion exchange membrane process has surpassed the
share of the century-old mercury process in just 20 years.
In developing countries, in particular, while the use of the pollution-laden mercury
process has been increasingly avoided, the ion exchange membrane process has been in a
process of rapid diffusion. In Taiwan, there are no chlor-alkali plants currently operating with
the mercury process (Nakanishi, 1993). China and India have been increasingly constructing
new chlor-alkali plants based on the ion exchange membrane process, and most of the chlor-
alkali production capacities have been already based on the ion exchange membrane process
in countries such as Indonesia, Thailand, South Africa, Egypt, and Saudi Arabia (Chlorine
Institute, 1999a). This case of technological change in the chlor-alkali industry demonstrates
an example of technological leapfrogging by choosing the clean technology over the end-of-
pipe technology. At the same time, this case indicates that the “pollution haven,” on which
intensive research has been made by researchers since the 1970s (see, for example, Leonard,
1988; Low and Yeats, 1992), may not necessarily be an unavoidable fate for developing
countries112.
5.5 Conclusion
In this chapter, we examined the effects of environmental regulation on technological change
in the Western European chlor-alkali industry. Since the end of the 19th century, the mercury
process had been the focus of technological development in Western Europe. By the early
1970s, advanced technologies had been developed for the mercury process by several
innovative companies, notably, ICI, Hoechst-Uhde, De Nora, Solvay, and Krebs. Their
technologies had been adopted not only by chlor-alkali producers in Western Europe but also
by those in other parts of the world.
Then we look at the environmental polices introduced in Western Europe to regulate
mercury emissions from chlor-alkali industry. Unlike Japan, there was no publicly reported
case in which human bodies were seriously affected by the intake of mercury in Western
Europe. Nevertheless, as public concerns on the potential impacts of mercury increased,
112 A recent empirical study shows that major urban areas in China, Brazil, and Mexico, instead of being the pollution haven, have all experienced significant improvement in air quality, contradicting the prediction of the pollution haven hypothesis (Wheeler, 2000).
289

regulations started to be imposed on mercury released to the environment, particularly to the
aquatic ecosystems, in the 1970s. While the introduction of environmental policies on
mercury occurred almost in the same period as that in Japan, Western Europe took a different
approach to the regulation of mercury emissions from chlor-alkali industry. Rather than
imposing a requirement for the phase out of the mercury process, the public authorities set
emission standards and environmental quality objectives for mercury released from chlor-
alkali plants. The levels of these standards were subsequently tightened during the 1980s.
We next examined the effects of these regulations on R&D activities undertaken by
companies in the chlor-alkali industry in Western Europe. With the imposition of regulations
limiting the amount of mercury released to the environment, chlor-alkali producers operating
plants with the mercury process were required to reduce their emissions. And at the same time
companies which had been innovative on chlor-alkali production technologies were
encouraged to make R&D efforts on technological measures for the abatement of mercury
emissions. The patent data we analyzed indicate that those innovative companies, including
ICI, Hoechst-Uhde, De Nora, Solvay, and Krebs, directed their R&D activities to end-of-pipe
technologies for the abatement of mercury emissions. Those technologies developed were
mainly designed to work for filtration, adsorption, and scrubbing of mercury released from
various points of the production facilities to air and waste water. The effects of these end-of-
pipe technologies were significant in reducing mercury emissions from chlor-alkali plants;
more than 90 % of mercury released to air, waste water, and products in Western Europe has
been eliminated since the late 1970s. With the success in reducing mercury emission by
adopting these end-of-pipe technologies, many chlor-alkali producers have continued to use
the mercury process, whose current share is more than 60 % of all the chlor-alkali production
capacities in Western Europe.
On the other hand, the relatively weak regulatory approach to mercury emissions did
not encourage innovative efforts to develop clean technologies which do not involve any use
of mercury, such as the ion exchange membrane process. Among the innovative companies in
the Western European chlor-alkali industry, ICI had been already involved in R&D activities
on the ion exchange membrane process since the early 1960s. The company, however, had
stopped their efforts to develop technologies for the ion exchange membrane process
subsequently, because of the unavailability of ion exchange membranes which had sufficient
physical as well as chemical strength to be reliably utilized in the electrolytic cells. In the
1970s, R&D activities of the companies which had technological expertise on the mercury
290
process, including De Nora, Hoechst-Uhde, Solvay, and Krebs, as well as ICI, were basically
focused on the mercury process, rather than the ion exchange membrane process. And these
companies continued to provide their technologies to other chlor-alkali producers in the 1980s.
In the meantime, encouraged by the strong regulation for the phase out of the mercury
process, the innovative companies in Japan invented new types of ion exchange membranes,
and the technological performance of the ion exchange membrane process was improved
rapidly. By the early 1980s, this newly developed process had advanced to such an extent that
it became effectively the only practical option when constructing new commercial plants.
Observing the invention of ion exchange membranes with improved physical and chemical
strength, which led to the remarkable progress in the ion exchange membrane process, several
innovative companies in Western Europe, particularly, ICI, Uhde, and De Nora, initiated
R&D activities on the ion exchange membrane process in the late 1970s. As advanced types
of ion exchange membranes had been already developed by the Japanese companies, the
focus of R&D activities of these European firms was placed on electrolytic cells to be used in
the ion exchange membrane process. Utilizing the ion exchange membranes introduced from
Japan, ICI, Uhde, and De Nora started to provide their ion exchange membrane process
technologies to other chlor-alkali producers in the middle of the 1980s.
We then considered why the diffusion of the ion exchange membrane process has been
slow and limited. Basically, we examined two factors which can be mainly considered to
affect the diffusion of a new technology, that is, the availability of information on the new
technology and the profitability of the adoption of the new technology. To see whether a
sufficient amount of information on the ion exchange membrane process has been available to
chlor-alkali producers in Western Europe, we look at the trends in presentations made at
industry conferences and papers published on technical and trade journals. We found that,
although only a limited amount of information was available in the 1970s regarding the newly
developed ion exchange membrane process, there has been a plenty of opportunities since the
1980s to obtain detailed and reliable data on this technology with advanced performance.
Therefore, we can reasonably conclude that the factor which has inhibited the adoption of the
ion exchange membrane process in Western Europe was not the lack of information on the
newly developed technology.
We next considered whether the adoption of the ion exchange membrane process has
been economically beneficial to chlor-alkali producers in Western Europe. Estimations of the
investment necessary for the installation of the ion exchange membrane process were
291
obtained from chlor-alkali producers who have introduced the new process and technology
suppliers. The investment and operating costs of end-of-pipe technologies adopted for the
reduction of mercury emissions were also estimated by using data on actual cases. We found
that the investment cost of adopting the ion exchange membrane process is much larger than
the cost necessary to install and operate end-of-pipe technologies to reduce mercury
emissions. Then we then examined the cost saving from the conversion of the mercury
process to the ion exchange membrane process. Although the energy consumption of the ion
exchange membrane process for chlor-alkali production was larger than that of the mercury
process in the early 1970s, as the performance of the ion exchange membrane process has
been improved rather quickly, by the middle of the 1980s the ion exchange membrane process
had come to consume much less energy than the mercury process. Accordingly, the operating
cost of the latter is currently larger than the former. We found, however, that the scale of the
cost saved by switching from the mercury process to the ion exchange membrane process has
not yet been sufficient to justify the necessary investment for the replacement of the mercury
process with the ion exchange membrane process. While it has been already economically
beneficial to adopt the ion exchange membrane process for new green-field plants, there is a
strong incentive to continue to use the existing mercury-based plants as long as they are can
be utilized to produce chlor-alkali products. That has discouraged the adoption of the ion
exchange membrane process by many operators of the mercury process in Western Europe.
What is of critical importance for the diffusion of the ion exchange membrane process is the
age of chlor-alkali plants based on the mercury process.
Hence we examined the operating years of the mercury-based plants which have already
been converted to the ion exchange membrane process as well as that of the existing plants
relying on the mercury process. Those mercury-based plants which have already been
switched to the ion exchange membrane process had been operated for a little longer than 50
years on average before the process conversion. That suggests that at least for this period of
time mercury-based plants can be utilized for chlor-alkali production. On the other hand, the
average of the operating years of the existing mercury-based plants is a little more than 30
years, a period which is about 20 years shorter than that in the case of the mercury-based
plants which have already been converted to the ion exchange membrane process. That means
that many of the existing plants relying on the mercury process have not yet reached the end
of their physical lifetime. Thus, the operators of these plants have strong incentives to
continue to use them for chlor-alkali production until they can no longer be utilized.
292
In particular, the data on the start-up year of these existing mercury-based plants shows
that there are many plants constructed with the mercury process in the 1970s. As we have
discussed above, during the same decade the R&D activities of the innovative companies in
Western Europe were focused on technological measures for the reduction of mercury
emissions. The patent data shows that there were actually many innovations on end-of-pipe
technologies for pollution abatement. While various types of end-of-pipe technologies were
successfully implemented in reducing mercury released to outside the production facilities,
many plants based on the mercury process continued to be built during the 1970s. These
relatively new plants can be utilized for commercial production for a long time before they
reach the end of their lifetime.
Currently, despite a recent recommendation made by the regulators that the existing
mercury-based plants be completely discarded by the year 2010, the mercury process is still
the dominant production technology in Western Europe, accounting for more than 60 % of the
total production capacities. The chlor-alkali industry has been consistently opposed to the
mandate for the phase out of the mercury process and strongly demanding the policy makers
to withdraw the deadline of 2010. The pace of converting the existing mercury plants has
been slow, and the diffusion of the ion exchange membrane process has been limited to a little
more than 10 % of the total production capacities in Western Europe. On the other hand, the
ion exchange membrane process has been adopted by many chlor-alkali producers outside
Western Europe, particularly in developing countries, leapfrogging the stage of employing the
mercury process. Accordingly, the share of the ion exchange membrane process in the world
production capacities has been increasing steadily.
In sum, the public authorities in Western Europe specified emission standards and
environmental quality standards with regard to mercury emissions from chlor-alkali plants.
This regulative approach, which was less stringent that that of the Japanese government,
induced innovative companies in Western Europe to undertake R&D activities on end-of-pipe
technologies for the abatement of mercury released from chlor-alkali plants. Operators of
mercury-based plants adopted these technologies, which worked successfully to reduce
mercury emissions steadily. Thus, most of the chlor-alkali producers in Western Europe
continued to use the mercury process supported with end-of-pipe technologies, a less
expensive option than converting to clean technologies which would require comprehensive
reorganization of the manufacturing process. During the 1970s, many more chlor-alkali plants
were built with the mercury process.
293

On the other hand, these relatively less stringent regulations implemented in Western
Europe did not clean did not create strong and secured demands for new clean technologies
and initially discouraged innovative companies to make R&D efforts on clean technologies
such as the ion exchange membrane process. Although the ion exchange membrane process
was ultimately to become better, economically as well as environmentally, than the mercury
process in the end, its future progress in the technological performance could not be predicted
with sufficient certainty, given the infant stage of technological development in the 1970s. It
was only after the ion exchange membrane process had been proved to be feasible for
industrial applications with the invention of advanced ion exchange membranes in Japan that
these R&D efforts on the ion exchange membrane process were intensified by these
innovative companies in Western Europe. By that time, however, many chlor-alkali plants
had been constructed by using the mercury process, and that has resulted in the slow
conversion of these relatively new plants to the ion exchange membrane process.
The environmental regulations which were aimed at the abatement of mercury
emissions encouraged the development and adoption of end-of-pipe technologies, which
indeed worked relatively well in reducing mercury emissions less expensively. This success,
however, effectively helped to prolong the lifetime of the mercury process, which was
actually in the process of technological obsolescence. This case of technological change in the
Western European chlor-alkali industry implies that, under the existence of uncertainty,
diversity, and rigidity of technological change, environmental regulations which are not very
stringent could succeed in reducing pollutant emissions by inducing the development and
adoption of end-of-pipe technologies. But at the same time innovations on clean technologies
which would be the most appropriate technology in terms of economic efficiency as well as
environmental protection could be discouraged, by prolonging the life of the existing,
pollution-laden technology.
Appendix
List of Interviewees in Western Europe
Imperial Chemical Industries (ICI)
• Mr. Steve Ingleby, Chlor-chemicals Senior Technologist
294
• Mr. R. W. Curry, Chlor-Alkali Technical Section Manager
• Mr. Cliff Broom, Manufacturing Manager, JKL Cellrooms
Uhde
• Dr.-Ing. Benno Lüke, Manager Process Department, Electrolysis Division
• Dipl.-Chem. Roland Beckmann, Head of Development Department, Electrolysis
Division
De Nora
• Mr. Giuseppe Faita, Director, Research & Technologies
• Mr. Marco Tenconi, Sales Manager (Plants)
Bayer
• Dr. Hermann Schubert, Corporate Staff, Quality, Environment and Safety Policy
Akzo Nobel
• Ir. F. G. Straasheijm, Technology & Manufacturing Manager, Chlor-Alkali
EniChem
• Mr. Antonio Pasquinucci, Research and Technology Manager, Polyurethanes and
Chlor-Alkali Division
• Mr. Manlio Inverardi, Environmental Balance and Certification, Safety Health
Environment Division
Euro Chlor
• Dr. Barrie S. Gilliatt, Executive Director
OSPAR Commission
• Dr. Stefan Hain, Deputy Secretary
295

Table 5-19 List of Chlor-Alkali Plants in Western Europe
Capacity (Cl2 103 t/year) Country Company Site (Basin) Hg D IM Other
Donau Chemie Brückl (D) 60 - - - Austria Total 60 60 0 0 0
BASF Antwerp (A) 100 - - - Bayer Antwerp (A) - - - 50 Solvay Antwerp (A) 230 - - - Solvay Jemeppe (A) 82 - 120 - Tessenderlo Chemie
Tessenderlo (A) 250 - - -
Belgium
Total 832 662 0 120 50 Akzo Nobel Oulu (C) 40 - - - Finnish Chemicals Joutseno (C) - - 75 -
Finland
Total 115 40 0 75 0 Albemarle Thann (A) 72 - - - ChlorAlp Pont de Claix (B) - 240 - - Elf Atochem Fos (B) - 160 110 - Elf Atochem Jarrie (B) 170 - - - Elf Atochem Lavera (B) 166 160 - - Elf Atochem Saint Auban (B) 184 - - - Métaux Spéciaux Pomblières (B) - - - 20 Prod. Chimiques d’Harbonnières
Harbonnières (A) 23 - - -
Solvay Tavaux (B) 241 - 122 - Tessenderlo Chemie
Loos (A) 18 - - -
France
Total 1,686 874 560 232 20 BASF Ludwigshafen (A) 150 210 - - Bayer Brunsbuttel (A) - - - 120 Bayer Dormagen (A) 300 - - 80 Bayer Leverkusen (A) 300 - - 30 Bayer Uerdingen (A) 130 - 90 - BSL Schkopau (A) 200 - - - Celanese Knapsack (A) 150 - - - Clariant Gersthofen (D) 60 - - - Dow Stade (A) - 1,040 200 - ECI Bitterfeld (A) 65 147 - - ECI Ibbenbüren (A) 120 - - - Hüls Lülsdorf (A) 98 - - - ICI Wilhelmshaven (A) 130 - - - LII Europe Frankfurt (A) 150 - - - Solvay Rheinberg (A) - 200 - -
Germany
Vestolit Marl (A) 180 - - -
296
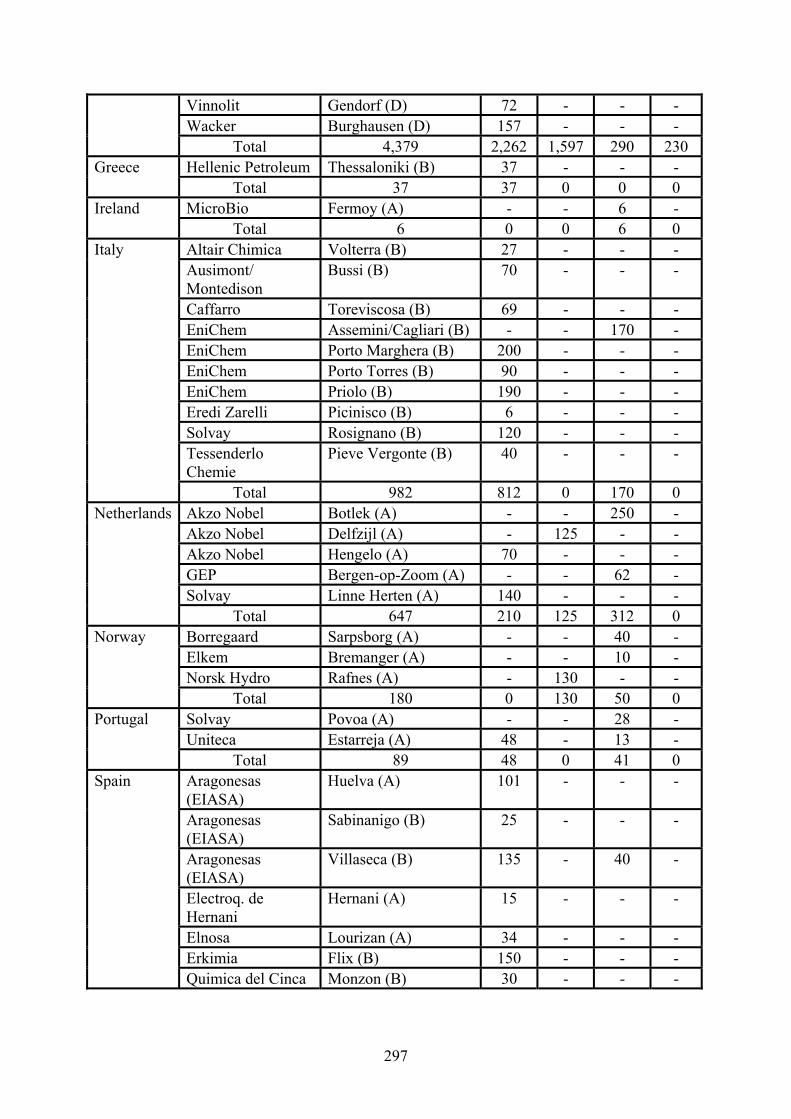
Vinnolit Gendorf (D) 72 - - - Wacker Burghausen (D) 157 - - -
Total 4,379 2,262 1,597 290 230 Hellenic Petroleum Thessaloniki (B) 37 - - - Greece
Total 37 37 0 0 0 MicroBio Fermoy (A) - - 6 - Ireland
Total 6 0 0 6 0 Altair Chimica Volterra (B) 27 - - - Ausimont/ Montedison
Bussi (B) 70 - - -
Caffarro Toreviscosa (B) 69 - - - EniChem Assemini/Cagliari (B) - - 170 - EniChem Porto Marghera (B) 200 - - - EniChem Porto Torres (B) 90 - - - EniChem Priolo (B) 190 - - - Eredi Zarelli Picinisco (B) 6 - - - Solvay Rosignano (B) 120 - - - Tessenderlo Chemie
Pieve Vergonte (B) 40 - - -
Italy
Total 982 812 0 170 0 Akzo Nobel Botlek (A) - - 250 - Akzo Nobel Delfzijl (A) - 125 - - Akzo Nobel Hengelo (A) 70 - - - GEP Bergen-op-Zoom (A) - - 62 - Solvay Linne Herten (A) 140 - - -
Netherlands
Total 647 210 125 312 0 Borregaard Sarpsborg (A) - - 40 - Elkem Bremanger (A) - - 10 - Norsk Hydro Rafnes (A) - 130 - -
Norway
Total 180 0 130 50 0 Solvay Povoa (A) - - 28 - Uniteca Estarreja (A) 48 - 13 -
Portugal
Total 89 48 0 41 0 Aragonesas (EIASA)
Huelva (A) 101 - - -
Aragonesas (EIASA)
Sabinanigo (B) 25 - - -
Aragonesas (EIASA)
Villaseca (B) 135 - 40 -
Electroq. de Hernani
Hernani (A) 15 - - -
Elnosa Lourizan (A) 34 - - - Erkimia Flix (B) 150 - - -
Spain
Quimica del Cinca Monzon (B) 30 - - -
297

Solvay Martorell (B) 209 - - - Solvay Torrelavega (A) 63 - - -
Total 802 762 0 40 0 Akzo Nobel Bohus (A) 95 - - - Akzo Nobel Skoghall (A) - - 85 - Norsk Hydro Stenungsund (A) 112 - - -
Sweden
Total 292 207 0 85 0 Novartis Monthey (B) 22 - - - Saürefabrik Schweizerhall
Pratteln (A) 27 - - -
Solvay Zurzach (A) 55 - - -
Switzerland
Total 104 104 0 0 0 Associated Octel Ellesmere Port (A) - - 40 35 Hays Sandbach (A) 89 - - - ICI Lostock (A) - 50 20 - ICI Runcorn (A) 738 - 25 - ICI Wilton (A) - 170 - - Rhodia Staveley (A) 29 - - - Roche Dalry (A) - - 20 -
UK
Total 1,216 856 220 105 35 Total 11,427 22,95
7 8,986 3,722 670
Data as of 1998. Basin A: North-East Atlantic and North Sea (OSPAR Commission) B: Mediterranean Sea (Barcelona Convention) C: Baltic Sea (Helsinki Commission) D: Black Sea (Black Sea Convention) Process Hg: Mercury process D: Diaphragm process IM: Ion Exchange Membrane process Sources: Euro Chlor (1998a), European IPPC Bureau (1999).
Table 5-20 Chlor-Alkali Plants in Western Europe within and outside the Catchment Area of the Paris Convention
Within catchment area Outside catchment area Country Mercury Non-mercury Mercury Non-mercury
Austria* - - 1 - Belgium 4 - - - Denmark - - - - Finland* - - 1 1 France 3 - 4 3 Germany 12 5 3 1
298
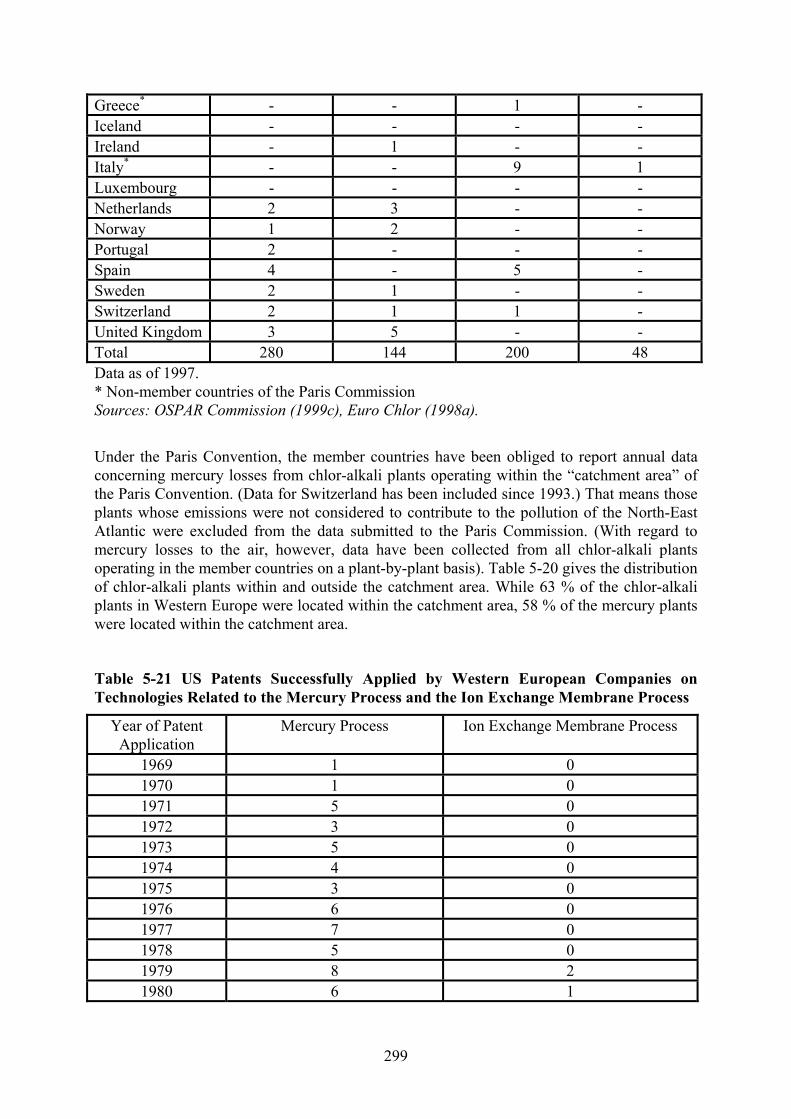
Greece* - - 1 - Iceland - - - - Ireland - 1 - - Italy* - - 9 1 Luxembourg - - - - Netherlands 2 3 - - Norway 1 2 - - Portugal 2 - - - Spain 4 - 5 - Sweden 2 1 - - Switzerland 2 1 1 - United Kingdom 3 5 - - Total 280 144 200 48 Data as of 1997. * Non-member countries of the Paris Commission Sources: OSPAR Commission (1999c), Euro Chlor (1998a).
Under the Paris Convention, the member countries have been obliged to report annual data concerning mercury losses from chlor-alkali plants operating within the “catchment area” of the Paris Convention. (Data for Switzerland has been included since 1993.) That means those plants whose emissions were not considered to contribute to the pollution of the North-East Atlantic were excluded from the data submitted to the Paris Commission. (With regard to mercury losses to the air, however, data have been collected from all chlor-alkali plants operating in the member countries on a plant-by-plant basis). Table 5-20 gives the distribution of chlor-alkali plants within and outside the catchment area. While 63 % of the chlor-alkali plants in Western Europe were located within the catchment area, 58 % of the mercury plants were located within the catchment area.
Table 5-21 US Patents Successfully Applied by Western European Companies on Technologies Related to the Mercury Process and the Ion Exchange Membrane Process
Year of Patent Application
Mercury Process Ion Exchange Membrane Process
1969 1 0 1970 1 0 1971 5 0 1972 3 0 1973 5 0 1974 4 0 1975 3 0 1976 6 0 1977 7 0 1978 5 0 1979 8 2 1980 6 1
299

1981 0 4 1982 2 0 1983 1 3 1984 1 1 1985 2 3 1986 0 0 1987 0 0 1988 1 2 1989 0 1 1990 1 0 1991 0 0 1992 1 0 1993 0 0 1994 0 0 1995 1 0 1996 0 0 1997 0 0 Total 512 136
* US patents issued in the period from 1971 to 1999.
Table 5-22 US Patents Successfully Applied for by Japanese Companies on Technologies Related to the Mercury Process and the Ion Exchange Membrane Process
Year of Patent Application
Mercury Process Ion Exchange Membrane Process
1968 1 0 1969 1 0 1970 0 0 1971 1 0 1972 2 0 1973 1 0 1974 1 1 1975 0 3 1976 0 6 1977 1 5 1978 0 14 1979 0 7 1980 0 9 1981 0 5 1982 0 1 1983 0 5 1984 0 8 1985 0 1 1986 0 0
300

1987 0 0 1988 0 1 1989 0 2 1990 0 1 1991 0 2 1992 0 0 1993 0 1 1994 0 1 1995 0 1 1996 0 0 1997 0 0 1998 0 0 Total 64 0
* US patents issued in 1971-1999.
Table 5-23 Mercury Emissions to Water, Products, and Air from Chlor-Alkali Plants in Western Europe
Year Water Products Air Total 1977 9.4 5.5 11.7 26.6 1978 4.6 2.7 8.8 16.1 1979 4.5 2.6 7.6 14.7 1980 4.6 2.3 7.3 14.2 1981 2.9 2.1 6.8 11.8 1982 2.9 1.9 6.0 10.8 1983 2.6 2.1 5.3 10.0 1984 2.5 1.7 4.9 9.1 1985 2.2 1.6 4.3 8.1 1986 1.9 1.5 4.6 8.0 1987 1.4 1.4 4.6 7.4 1988 0.9 1.2 3.8 5.9 1989 0.8 1.0 3.3 5.1 1990 0.6 0.8 2.7 4.1 1991 0.7 0.8 2.8 4.3 1992 0.5 0.7 2.4 3.6 1993 0.3 0.5 2.0 2.8 1994 0.2 0.4 1.9 2.5 1995 0.2 0.4 2.1 2.7 1996 0.1 0.2 1.7 2.0 1997 0.1 0.1 1.2 1.5
Figures are expressed in gram of mercury emitted per metric tonne of chlorine production capacity. Source: Euro Chlor (1998c).
301

Table 5-24 Mercury Emissions from Individual Chlor-Alkali Plants in Western Europe in 1999
Plant Products Waste Water Air Total Solvay Lillo, Belgium
0.050 0.020 0.680 0.750
Tessenderlo Tessenderlo, Belgium
0.083 0.010 0.617 0.710
BASF Antwerpen, Belgium
0.049 0.063 1.013 1.125
Solvay Jemeppe, Belgium
0.050 0.280 1.780 2.110
Eka Chemicals Oulu, Finland
0.127 0.125 1.322 1.574
PC de Loos Loos, France
0.100 0.100 1.380 1.580
Albemarle PPC Thann, France
0.102 0.090 1.600 1.792
Solvay Tavaux, France
0.090 0.011 1.330 1.431
Elf Atochem Jarrie, France
0.033 0.030 1.068 1.131
SPC Harbonnières Harbonnières, France
0.320 0.001 1.123 1.444
Elf Atochem Lavera, France
0.043 0.130 0.971 1.144
Elf Atochem St Auban, France
0.031 0.110 1.381 1.522
ECI Bitterfeld, Germany
0.095 0.002 1.610 1.707
Bayer Uerdingen, Germany
0.080 0.008 1.040 1.128
ECI Ibbenburen, Germany
0.080 0.004 0.322 0.406
Bayer Leverkusen, Germany
0.032 0.016 1.175 1.223
BASF Ludwigshafen, Germany
0.030 0.010 1.700 1.740
ICI Wilhelmshaven, Germany
0.025 0.005 0.510 0.540
Vestolit Marl, Germany
0.060 0.010 1.670 1.740
Hüls Lülsdorf, Germany
0.170 0.010 1.790 1.970
LII Frankfurt, Germany
0.063 0.012 0.995 1.070
Bayer 0.036 0.000 1.540 1.576
302

Dormagen, Germany Clariant Gersthofen, Germany
0.060 0.020 1.660 1.740
Wacker Chemie Burghausen, Germany
0.080 0.003 0.760 0.843
Celanese Knapsack, Germany
0.056 0.025 0.829 0.910
Vinnolit Gendorf, Germany
0.040 0.020 1.330 1.390
Akzo Nobel Hengelo, Netherlands
0.054 0.027 0.927 1.008
Solvay Linne-herten, Netherlands
0.100 0.030 1.270 1.400
Uniteca Estarreja, Portugal
0.500 0.300 1.900 2.700
Quimica del Cinca Monzon, Spain
0.300 0.480 1.260 2.040
Hernani Hernani, Spain
0.200 0.490 1.330 2.020
Elnosa Lourizan, Spain
0.440 0.020 1.510 1.970
Ercros Flix, Spain
0.330 0.130 1.450 1.910
Solvay Torrelavega, Spain
0.762 0.055 1.442 2.259
Solvay Martorell, Spain
0.070 0.050 0.750 0.870
Aragonesas Sabinanigo, Spain
0.400 0.300 1.400 2.100
Aragonesas Vilaseca, Spain
0.110 0.070 1.680 1.860
Aragonesas Huelva/Palos, Spain
0.150 0.080 1.500 1.730
Akzo Nobel Bohus, Sweden
0.012 0.006 0.250 0.268
Hydro Polymers Stenungsund, Sweden
0.011 0.004 0.139 0.154
Solvay Zurzach, Switzerland
0.040 0.080 1.370 1.490
Novartis Monthey, Switzerland
0.022 0.007 0.848 0.877
Säurefabrik Pratteln, Switzerland
0.140 0.050 0.370 0.560
Rhodia Staveley, UK
0.050 0.005 0.470 0.525
Hays 0.080 0.020 1.310 1.410
303

Sandbach, UK ICI Runcorn, UK
0.040 0.210 1.750 2.000
* Figures are expressed in gram of mercury per tonne of chlorine production capacity. ** Denmark, Luxembourg, and Iceland have no chlor-alkali plants. Ireland and Norway have only mercury-free chlor-alkali plants. Austria, Greece, and Italy are not Contracting Parties to the OSPAR Convention and thus are not required to provide data on mercury emissions to the OSPAR Commission. Source: OSPAR Commission (2001).
Table 5-25 Chlor-Alkali Production Capacities based on the Mercury Process and the Non-Mercury Processes in Western Europe
Year Mercury Process Non-Mercury Processes Total 1982 5,137 (72.6 %) 1,935 (27.4 %) 7,072 1983c 5,060 (71.1 %) 2,060 (28.9 %) 7,120 1984 5,079 (67.0 %) 2,505 (33.0 %) 7,584 1985 5,076 (66.9 %) 2,510 (33.1 %) 7,586 1986 5,094 (67.0 %) 2,510 (33.0 %) 7,603 1987 5,097 (67.0 %) 2,510 (33.0 %) 7,607 1988 5,012 (66.4 %) 2,538 (33.6 %) 7,550 1989 4,883 (66.6 %) 2,448 (33.4 %) 7,331 1990 4,810 (65.8 %) 2,498 (34.2 %) 7,308 1991 5,036 (68.3 %) 2,337 (31.7 %) 7,372 1992 4,788 (65.8 %) 2,473 (34.2 %) 7,281 1993 4,468 (63.6 %) 2,558 (36.4 %) 7,026 1994 4,438 (63.8 %) 2,519 (36.2 %) 6,957 1995 4,480 (62.2 %) 2,733 (37.8 %) 7,214 1996 4,481 (62.1 %) 2,734 (37.9 %) 7,215 1997 4,486 (62.0 %) 2,747 (38.0 %) 7,233
Figures are in thousand tonnes of chlorine per year. a: Data for France and Spain are not included. b: Data for Belgium, France, Spain and UK are not included. c: For the Netherlands, the average of two figures for January and December 1983 is used. Sources: 1982-1995: Oslo and Paris Commissions (1997). 1996-97: OSPAR Commission (1999c).
Table 5-26 Installations of the Mercury and the Ion Exchange Membrane Processes by Western European Firms
Year Mercury Process Ion Exchange Membrane Process 1970 11 0 1971 16 0 1972 13 0
304

1973 7 0 1974 9 0 1975 15 0 1976 15 0 1977 11 0 1978 2 0 1979 7 0 1980 5 0 1981 7 0 1982 1 0 1983 5 3 1984 0 5 1985 1 4 1986 0 2 1987 3 5 1988 2 5 1989 1 9 1990 2 7 1991 3 8 1992 0 9 1993 1 3 1994 1 13 1995 0 10 1996 0 12 1997 0 12 1998 0 14 Total 0 0
Calculation based on Chlorine Institute (1998a; 1998b), Imperial Chemical Industries (1999), Krupp-Uhde (1998), and De Nora (1999).
Table 5-27 Supply of the Ion Exchange Membrane Process by Japanese and Western European Firms
Year Japanese Firms Western European Firms 1975 40,000 0 1976 101,000 0 1977 181,000 0 1978 191,000 0 1979 201,000 0 1980 220,640 0 1981 250,455 0 1982 411,095 0 1983 1,279,645 61,016 1984 1,790,948 214,016
305

1985 2,403,497 342,366 1986 3,146,171 431,890 1987 3,730,937 517,954 1988 4,074,327 579,254 1989 4,833,022 995,606 1990 5,283,361 1,263,712 1991 5,796,600 1,379,600 1992 5,989,735 1,788,704 1993 6,774,759 1,889,772 1994 7,035,383 2,489,118 1995 7,334,650 2,776,286 1996 8,111,690 3,714,946 1997 9,066,993 4,681,326 1998 11,379,070 5,418,756 1999 13,241,560 6,133,156
Figures are cumulative production capacities (t NaOH/year). Calculation based on Table 4-27, Table 4-28, Table 4-29, Table 4-31, Table 4-32, Table 4-33, Table 5-28, Table 5-29, and Table 5-30.
Table 5-28 Supply List of the Ion Exchange Membrane Process by ICI
Plant Site Start-up Capacity (t NaOH/y)
Akzo Nobel Sweden
1983/85/89 81,000
Nippon Soda Japan
1984 920 (KOH)
Elkem Bremanger Norway
1984 12,000
CCM Malaysia
1984/92 34,000
Finnish Chemicals Finland
1984 89,000
Tessenderlo Belgium
1985 300 (KOH)
Fort James USA
1985 4,750
Procter & Gamble Green Bay, USA
1985 5,100
Mondi South Africa
1985 22,500
Elf Atochem Tacoma USA
1985 91,000
ICI Lostock UK
1986 18,000
Wesfarmers CSBP 1987 6,000
306
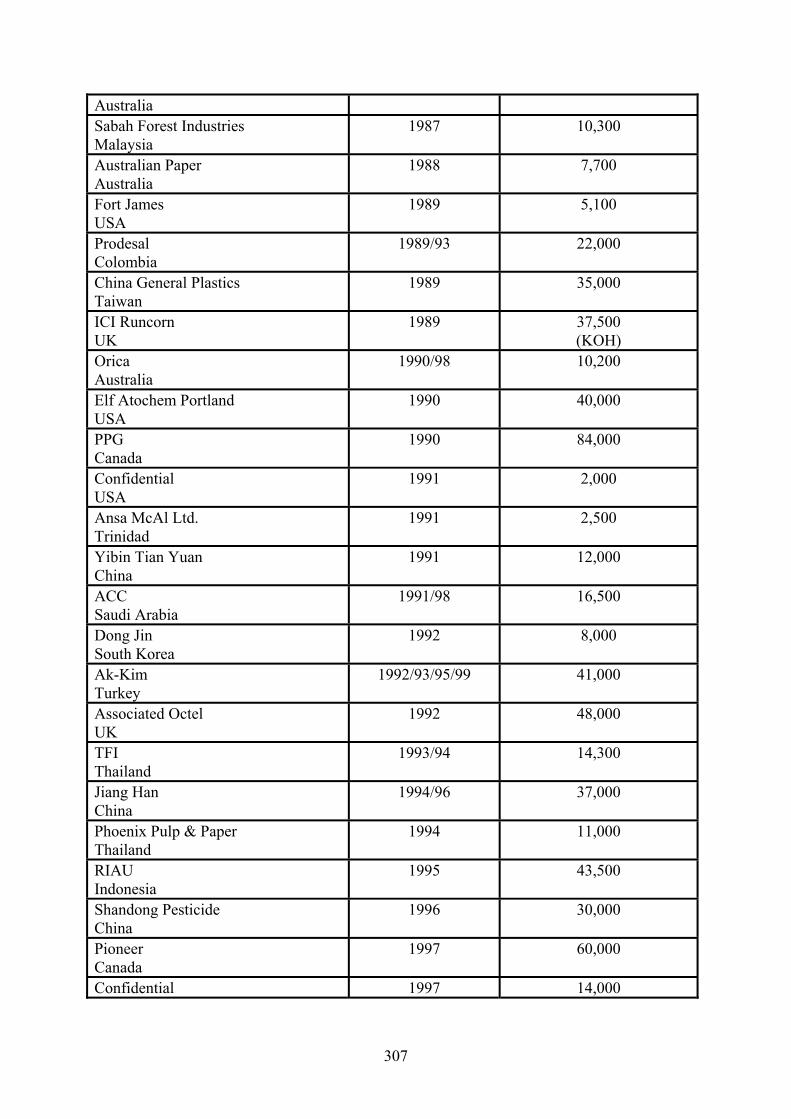
Australia Sabah Forest Industries Malaysia
1987 10,300
Australian Paper Australia
1988 7,700
Fort James USA
1989 5,100
Prodesal Colombia
1989/93 22,000
China General Plastics Taiwan
1989 35,000
ICI Runcorn UK
1989 37,500 (KOH)
Orica Australia
1990/98 10,200
Elf Atochem Portland USA
1990 40,000
PPG Canada
1990 84,000
Confidential USA
1991 2,000
Ansa McAl Ltd. Trinidad
1991 2,500
Yibin Tian Yuan China
1991 12,000
ACC Saudi Arabia
1991/98 16,500
Dong Jin South Korea
1992 8,000
Ak-Kim Turkey
1992/93/95/99 41,000
Associated Octel UK
1992 48,000
TFI Thailand
1993/94 14,300
Jiang Han China
1994/96 37,000
Phoenix Pulp & Paper Thailand
1994 11,000
RIAU Indonesia
1995 43,500
Shandong Pesticide China
1996 30,000
Pioneer Canada
1997 60,000
Confidential 1997 14,000
307

Indonesia Ya'an Pulp & Paper China
1998 4,000
Confidential Iran
1998 950
Shandong Ganglu China
1998 30,000
Confidential North America
1998 20,000
Shriram India
1998 91,000
Total - 8,823,810 Test plants and pilot plants are excluded from the table. Source: Imperial Chemical Industries (1999).
Table 5-29 Supply List of the Ion Exchange Membrane Process by Uhde
Plant Site Start-up Capacity (t NaOH/y)
24,000 1,800
Roche Products Dalry, UK
1984/89/91
+ 7 % 18,000 Tofte Industries
Norway 1984/87
+ 10 % Potasse et Produits Chimiques France
1984 700 (KOH)
P. N. Kertas Letjes Indonesia
1986 2,500
Confidential + 30 %
General Electric Plastics The Netherlands
1987/90/94
5,950 Bela Chemical Industries Pakistan
1988 16,000
Hoechst Germany
1988 12,500
AECI Limited/POLIFIN South Africa
1988 23,000
Gujarat Alkalies and Chemicals I India
1989 70,000
Gujarat Alkalies and Chemicals II India
1994 17,500 (KOH) 185,000 Formosa Plastics
Taiwan 1989/94
24,000 Bayer Leverkusen, Germany
1989 1,600
308

Paik Kwang Corp. Seoul, South Korea
1989 12,600
Ministry of Industry and Minerals Faluja, Iraq
1990 11,800
Cellulose Attisholz Switzerland
1990 9,500
17,800 17,800
Paik Kwang Corp. I Kunsan, South Korea
1990/93/95
17,800 Aracruz Celulose Brazil
1991 36,400
Riocell Brazil
1992 19,600
1992 68,200 Standard Alkali India 1995 5,700
35,000 EIASA/Aragonesas Spain
1992/97 10,600
Compania Manufacturera de Papeles y Cartones, Chile
1992 15,000
CQR Salgema Brazil
1994 275,000
91,000 Grasim Industries I India
1994/95 11,800 10,000 Chemfab Alkalies
India 1994/97
10,000 Quimica del Norte/CLOROX Argentina
1994 15,000
Hanwha Chemical Corp. Yeochun, South Korea
1995 60,000
National Chlorine Industries Jordan
1995 7,200
Punjab Alkalies Chemicals India
1995 36,000
Chimcomplex S.A. Borzesti Romania
1996 122,000
Saudi Petrochemical Company Saudi Arabia
1996 250,000
United Phosphorus I India
1996 20,000
Misr Chemical Industries Egypt
1996 59,500
United Phosphorus II India
1996 35,000
S. C. Chimcomplex S.A. Borzesti Romania
1996 122,000
309

Indian Petrochemicals India
1997 148,000
La Société National de Cellulose et de Papíer Alfa, Tunisia
1997 7,500
Indian Rayon India
1997 35,000
Gujarat Alkalies and Chemicals India
1997 105,000
Kothari Sugars and Chemicals Ltd. India
1997 20,000
Olin Corporation USA
1997 255,700
Bayer Uerdingen, Germany
1997 125,000
Polifin South Africa
1997 36,700
Ravi Chemicals Pakistan
1998 10,000
Oltchim Romania
1998 122,000
Hanwha Chemical South Korea
1998 140,000
Punjab Alkalies Chemicals II India
1998 70,000
Micro Bio Ireland
1998 8,680
Total - 23,819,340 Test plants and pilot plants are excluded from the table. Source: Krupp Uhde (1998).
Table 5-30 Supply List of the Ion Exchange Membrane Process by De Nora
Plant Site Start-up Capacity (t Cl2/y)
P.T. Kertas Letjes Probolinggo, Indonesia
1983 6,600
Basic Chemical Industries Dammam, Saudi Arabia
1983 7,700
77,700 EniChem Polimeri Cagliari, Italy
1986/90 73,130 22,200 8,800
Sree Rayalaseema Andhra Pradesh India
1987/89/96
16,000 EIASA Sabinanigo, Spain
1988 2,500 (KOH)
310

Sitara Chemical Industries Faisalabad, Pakistan
1989 13,300
Ballarpur Ind. Ballarpur, India
1991 13,300
Ballarpur Ind. Yamunanagar, India
1991 13,300
13,300 Malay-Sino Chemicals Ipoh, Malaysia
1991/96 15,000
Century Rayon Kalyan, India
1992 14,200
Atochem Fos-sur-Mer, France
1992 120,000
Sitara Chemical Industries Faisalabad, Pakistan
1993 42,200
Basic Chemical Industries Dammam, Saudi Arabia
1993 10,650
National Rayon Mohone, India
1994 24,800
Novel & Shenyang Chemical Plant Shenyang, China
1994 50,000
Sree Rayalaseema Andhra Pradesh, India
1994 17,000
Chloran Chemical Production Semnan, Iran
1994 3,500
Tecnimont Moshi, Tanzania
1994 3,500
Elf Atochem Colombia Santafé, Colombia
1994 2,000
Chlor-Pars Tabriz, Iran
1995 6,700
Nirouchlor Isfahan, Iran
1995 6,700
12,000 Hangzhou Electrochem. Factory Hangzhou, China
1995/97 8,000
TKI Hrastnik Hrastnik, Slovenia
1995 13,500
Tata Chemicals Mithapur, India
1995 35,000
Siping Chemical Complex Siping, China
1995 20,000
South Vietnam Basic Chemical Bien Hoa, Vietnam
1996 2,000
Qingdao Chemical Works Qingdao, China
1996 60,000
40,000 Beijing No. 2 Chemical Works Beijing, China
1996/97 80,000
311

Confidential
- 10,000
Mardia Chemicals Gujarat, India
1996 105,000
The Andhra Sugars Kovvur, India
1996 30,000
Taiko Occidental Chem. Kemaman, Malaysia
1997 20,000
S.N.E.P. Mohammedia, Morocco
1997 16,000
Chemical Industries Singapore
1998 20,000
Qilu Petrochemical Corporation Qilu, China
1998 50,000
P.T. Pindo Deli Pulp & Paper Mill Indonesia
1998 45,000
Total - 935,950 Source: De Nora (1999).
Table 5-31 Number of Cell Elements of Electrolyzers
Company Asahi Chemical Asahi Glass CEC De Nora Krupp UhdeCell type* ML 32 AZEC-B1 BiTAC 800 DN 350 BM 2.7 Max. No. of cell elements
150 80 80 90 160
* bipolar electrolyzers Source: Luke (2000).
Table 5-32 Cost Saving from the Conversion of the Mercury Process to the Ion Exchange Membrane Process in Western Europe
Year Energy Savings (kWh/t NaOH)
Electricity Price (US$/kWh)
Cost Saving (US$/t NaOH)
1970 -1,250 0.039 -49 1971 -1,150 0.039 -45 1972 -1,050 0.039 -41 1973 -950 0.039 -37 1974 -850 0.039 -33 1975 -750 0.039 -29 1976 50 0.039 2 1977 130 0.039 5 1978 180 0.039 7 1979 250 0.046 12 1980 480 0.053 25 1981 700 0.051 36
312

1982 700 0.049 34 1983 700 0.046 32 1984 800 0.043 34 1985 800 0.041 33 1986 800 0.055 44 1987 800 0.063 50 1988 800 0.065 52 1989 800 0.061 49 1990 800 0.076 61 1991 800 0.078 62 1992 800 0.075 60 1993 800 0.072 58 1994 800 0.071 57 1995 800 0.077 62 1996 800 0.074 59 1997 800 0.065 52 The improvement in the energy consumption from 1970 to 1975 is assumed to be linear. Source: Electricity price: International Energy Agency (1992; 1993; 1999). For 1970 to 1977, the price of 1978; for 1979, the average of the prices of 1978 and 1980; for 1981 the average of the prices of 1980 and 1982; for 1983, the average of the prices of 1982 and 1984; for 1992, the average of the prices of 1991 and 1993.
Table 5-33 Start-up Year of the Mercury Process and the Ion Exchange Membrane Process in Western Europe
Plant #a
Plant Site Start-up Year of Mercury
Process
Start-up Year of Ion Exchange
Membrane Process
Operating Years of Mercury
Process - Akzo Nobel
Botlek, Netherlands - 1983b -
1 Akzo Nobel Skoghall, Sweden
1918 1983 65
- Elkem Bremanger Svelgen, Norway
- 1984b -
- Tofte Industries Tofte, Norway
- 1984b -
- Finnish Chemicals Joutseno, Finland
- 1984b -
- Micro-Bio Fermoy, Ireland
- 1984b -
- General Electric Plastics Bergen op Zoom, NL
- 1987b -
2 ICI (KOH) Runcorn, UK
1930
1989
59
313

3 Solvay Povoa, Portugal
1938 1990 52
4 Solvay Tavaux, France
1930 1991 61
5 Associated Octel Ellesmere Port, UK
1956 1992 36
6 Solvay Jemeppe, Belgium
1951 1992 41
7 Uniteca Estarreja, Portugal
1944 1992 48
8 EIASA/Aragonesas Villaseca, Spain
1951 1992 41
9 Bayer Uerdingen, Germany
1955 1997 42
10 Bayer Dormagen, Germany
1966 1999 33
11 Donau Chemie Brückl, Austria
1943 1999 56
12 ECI Bitterfeld, Germany
1936 1999 63
13 Vestolit Marl, Germany
1939 1999 60
14 Clariant Gersthofen, Germany
1940 2000 60
15 Wacker Burghausen, Germany
1944 2000 56
- Average - - 1991.4 a: Plant # in Figure 5-10. b: Newly constructed plant based on the ion exchange membrane process. Sources: Year of the set-up of the mercury process: Akzo Nobel, Botlek: Straasheijm (1999). Akzo Nobel, Skoghall: Cederlund (1999). Elkem Bremanger, Svelgen: Bøsterud (2000). Tofte Industries, Tofte: Thun (1999). Finnish Chemicals, Joutseno: Cowell and Jackson (1986). Micro-Bio, Fermoy: O’Brien (2001). General Electric Plastics, Bergen op Zoom: Vos (1999). ICI, Runcorn: Ingleby, Curry, and Broom (1999). Solvay, Povoa: Chlorine Institute (1972). Solvay, Tavaux: Chlorine Institute (1972). Solvay, Jemeppe: Chlorine Institute (1997). Uniteca, Estarreja: Chlorine Institute (1972). EIASA/Aragonesas, Villaseca: Grupo Aragonesas (1999). Associated Octel, Ellesmere Port: Lott (1995). Borregaard Industries, Sarpsborg: De Flon (1998). Bayer, Uerdingen: Schubert (1999). Bayer, Dormagen: Schubert (1999). Donau Chemie, Brückl: Donau Chemie (2000). ECI, Bitterfeld: Herold (2000). Vestolit, Marl: Chlorine Institute (1972). Clariant, Gersthofen: Teufel (2000). Wacker, Burghausen: Chlorine Institute (1972). Year of the conversion to the ion exchange membrane process: Asahi Chemical Industry (1998), Asahi Glass (1999), Chlorine Engineer Corp. (2000), Krupp-Uhde (1998), Imperial Chemical Industries (1999), De Nora (1999), and Eltech Systems (2001).
314
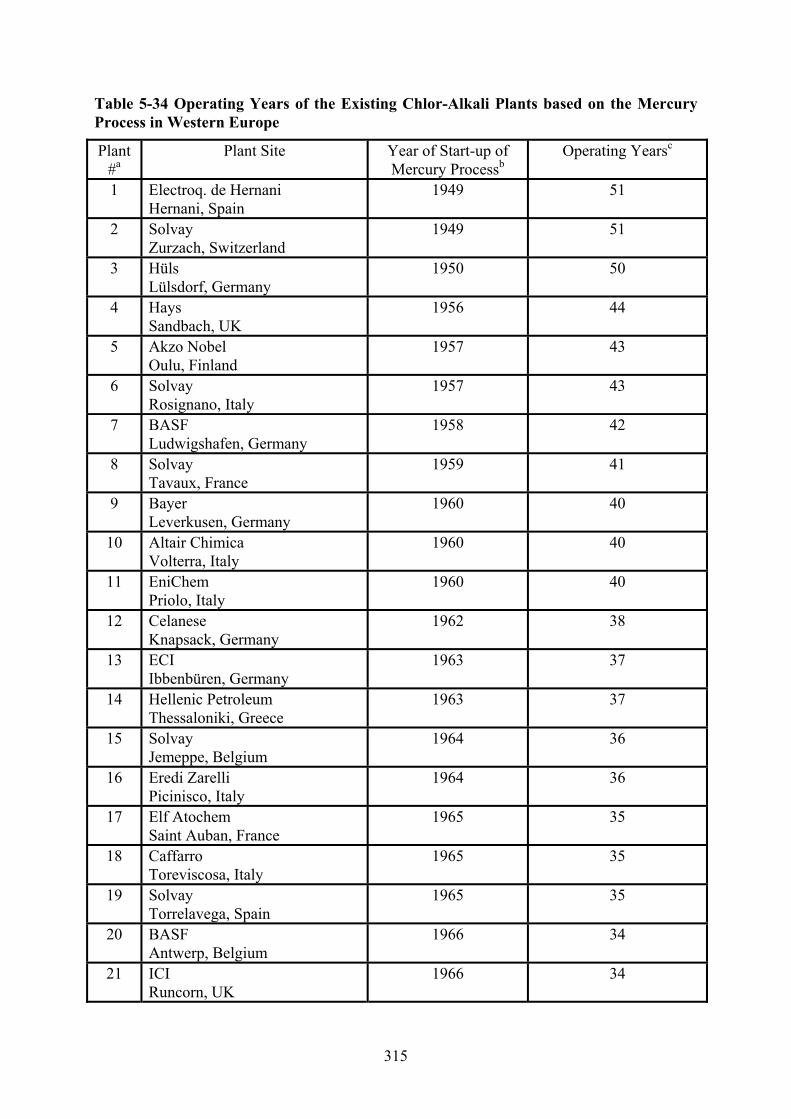
Table 5-34 Operating Years of the Existing Chlor-Alkali Plants based on the Mercury Process in Western Europe
Plant #a
Plant Site Year of Start-up of Mercury Processb
Operating Yearsc
1 Electroq. de Hernani Hernani, Spain
1949 51
2 Solvay Zurzach, Switzerland
1949 51
3 Hüls Lülsdorf, Germany
1950 50
4 Hays Sandbach, UK
1956 44
5 Akzo Nobel Oulu, Finland
1957 43
6 Solvay Rosignano, Italy
1957 43
7 BASF Ludwigshafen, Germany
1958 42
8 Solvay Tavaux, France
1959 41
9 Bayer Leverkusen, Germany
1960 40
10 Altair Chimica Volterra, Italy
1960 40
11 EniChem Priolo, Italy
1960 40
12 Celanese Knapsack, Germany
1962 38
13 ECI Ibbenbüren, Germany
1963 37
14 Hellenic Petroleum Thessaloniki, Greece
1963 37
15 Solvay Jemeppe, Belgium
1964 36
16 Eredi Zarelli Picinisco, Italy
1964 36
17 Elf Atochem Saint Auban, France
1965 35
18 Caffarro Toreviscosa, Italy
1965 35
19 Solvay Torrelavega, Spain
1965 35
20 BASF Antwerp, Belgium
1966 34
21 ICI Runcorn, UK
1966 34
315

22 Rhodia Staveley, UK
1966 34
23 Elf Atochem Lavera, France
1968 32
24 Quimica del Cinca Monzon, Spain
1969 31
25 Norsk Hydro Stenungsund, Sweden
1969 31
26 Solvay Antwerp, Belgium
1970 30
27 LII Europe Frankfurt, Germany
1970 30
28 Akzo Nobel Hengelo, Netherlands
1970 30
29 Akzo Nobel Bohus, Sweden
1970 30
30 Albemarle Thann, France
1971 29
31 Elf Atochem Jarrie, France
1971 29
32 EniChem Porto Marghera, Italy
1971 29
33 ICI Wilhelmshaven, Germany
1972 28
34 Vinnolit Gendorf, Germany
1972 28
35 Tessenderlo Chemie Pieve Vergonte, Italy
1972 28
36 EIASA/Aragonesas Villaseca, Spain
1972 28
37 Solvay Martorell, Spain
1972 28
38 Novartis Monthey, Switzerland
1972 28
39 Saürefabrik Schweizerhall Pratteln, Switzerland
1972 28
40 EIASA/Aragonesas Huelva, Spain
1973 27
41 Dow Schkopau, Germany
1974 26
42 Tessenderlo Chemie Loos, France
1974 26
43 EniChem Porto Torres, Italy
1974 26
44 Prod. Chimiques d’HarbonnièresHarbonnières, France
1975 25
316
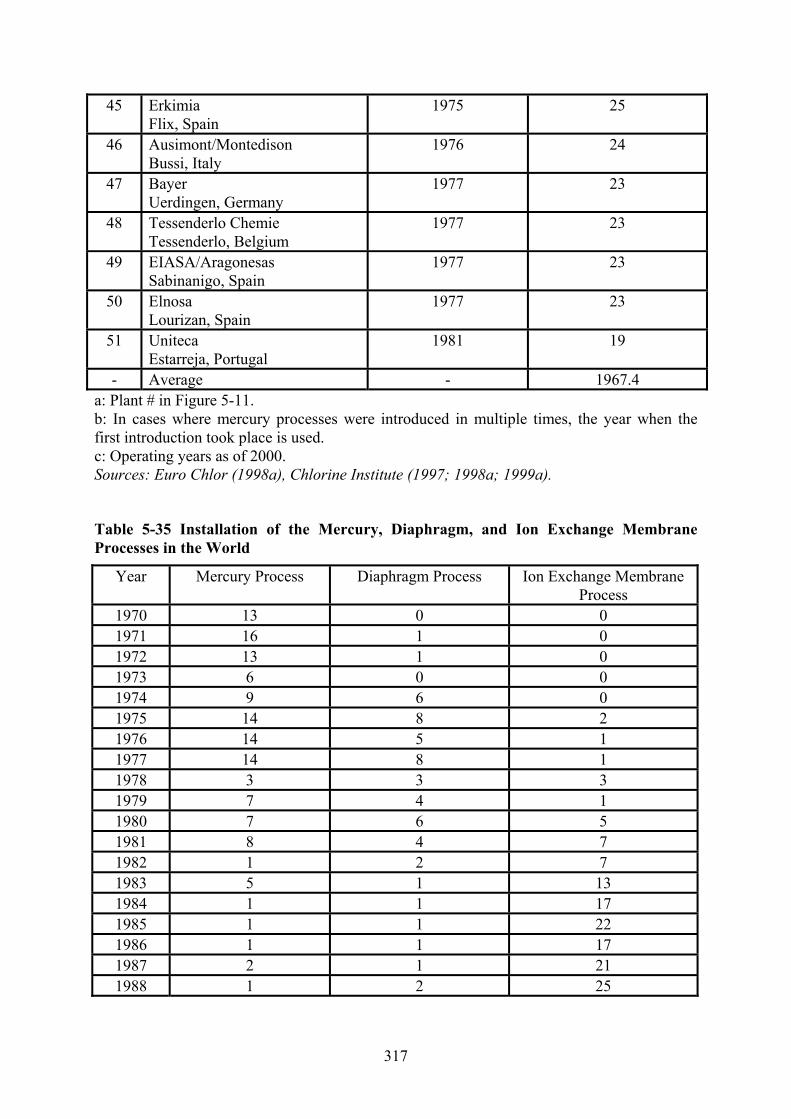
45 Erkimia Flix, Spain
1975 25
46 Ausimont/Montedison Bussi, Italy
1976 24
47 Bayer Uerdingen, Germany
1977 23
48 Tessenderlo Chemie Tessenderlo, Belgium
1977 23
49 EIASA/Aragonesas Sabinanigo, Spain
1977 23
50 Elnosa Lourizan, Spain
1977 23
51 Uniteca Estarreja, Portugal
1981 19
- Average - 1967.4 a: Plant # in Figure 5-11. b: In cases where mercury processes were introduced in multiple times, the year when the first introduction took place is used. c: Operating years as of 2000. Sources: Euro Chlor (1998a), Chlorine Institute (1997; 1998a; 1999a).
Table 5-35 Installation of the Mercury, Diaphragm, and Ion Exchange Membrane Processes in the World
Year Mercury Process Diaphragm Process Ion Exchange Membrane Process
1970 13 0 0 1971 16 1 0 1972 13 1 0 1973 6 0 0 1974 9 6 0 1975 14 8 2 1976 14 5 1 1977 14 8 1 1978 3 3 3 1979 7 4 1 1980 7 6 5 1981 8 4 7 1982 1 2 7 1983 5 1 13 1984 1 1 17 1985 1 1 22 1986 1 1 17 1987 2 1 21 1988 1 2 25
317
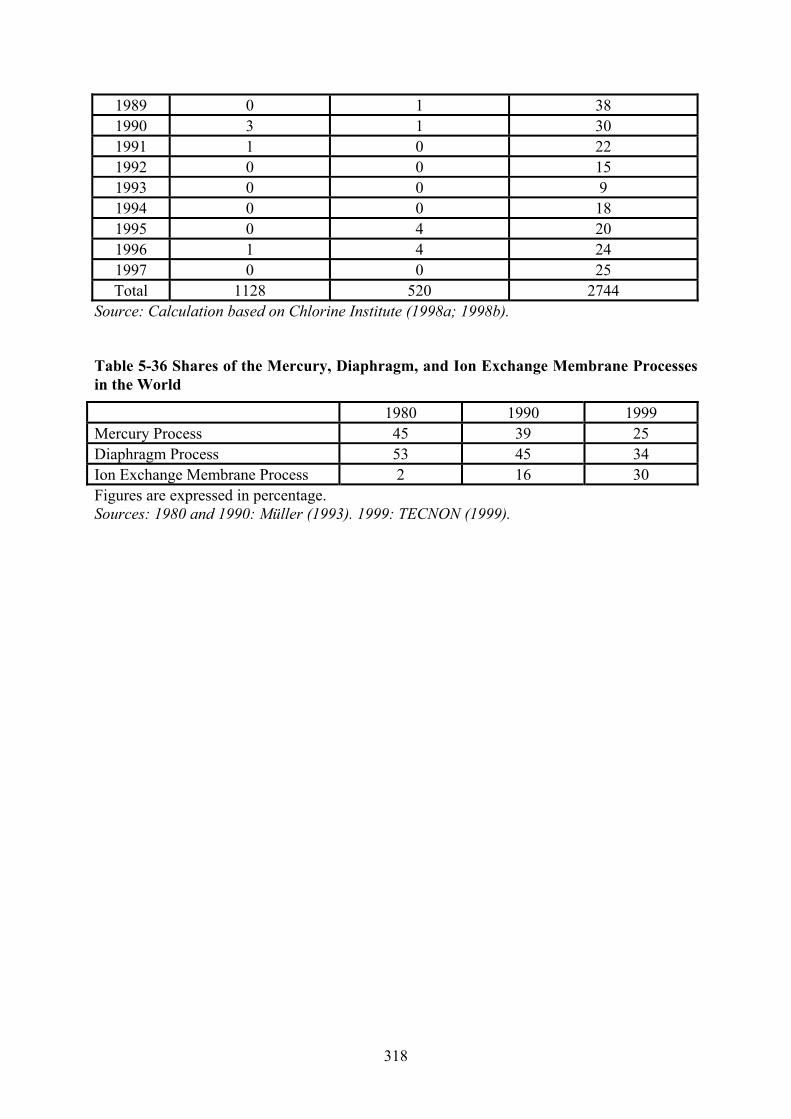
1989 0 1 38 1990 3 1 30 1991 1 0 22 1992 0 0 15 1993 0 0 9 1994 0 0 18 1995 0 4 20 1996 1 4 24 1997 0 0 25 Total 1128 520 2744
Source: Calculation based on Chlorine Institute (1998a; 1998b).
Table 5-36 Shares of the Mercury, Diaphragm, and Ion Exchange Membrane Processes in the World
1980 1990 1999 Mercury Process 45 39 25 Diaphragm Process 53 45 34 Ion Exchange Membrane Process 2 16 30 Figures are expressed in percentage. Sources: 1980 and 1990: Müller (1993). 1999: TECNON (1999).
318

6. Summary and Conclusion
In this research, we examined the effects of environmental regulation on technological change.
A particular emphasis was placed on the distinction between the end-of-pipe technology and
the clean technology, with its implications for diverging impacts of environmental regulations
on innovation. We first reviewed theoretical and empirical research which has been conducted
on this issue in the past. Previous theoretical models basically suggest that economic
instruments, including emission tax and tradable emission permits, are generally superior to
command-and-control regulation in encouraging technological change for pollution
abatement. Comparing relative scales of incentives under different policy instruments, they
claim that economic measures generally give a greater spur to innovate in pollution control
than direct controls.
These arguments, however, are based on several very restricted assumptions concerning
the nature and characteristics of technological change. Among them is that these theoretical
studies pay almost exclusive attention to end-of-pipe technologies as their measures for
emission reduction. They basically ignore the possibility of a different type of technological
change, namely, clean technologies, which will eliminate the formation of pollutants from
within the production processes. Some of these studies assume that there is a tradeoff in R&D
between improvement in output production technology and improvement in pollution
abatement technology. In this approach, the technologies considered for pollution abatement
are basically those of the end-of-pipe type, and the possibility of developing clean
technologies is not taken into account. Since clean technologies do not require any measures
for pollution abatement, it is not necessary to conduct R&D on end-of-pipe technologies.
Thus it could become possible to achieve improvement in both output production and
pollution abatement at the same time, and as a result the tradeoff between the two types of
improvement would disappear. What would be of critical importance then is to make an
appropriate choice between the end-of-pipe technology and the clean technology as the target
of R&D, rather than to find the optimal combination of R&D efforts between those for
pollution abatement and for output production.
In other theoretical models, marginal cost curves have been typically used for pollution
abatement, with an assumption that the marginal cost of pollution abatement increases as
emissions are reduced. And the scope for innovation is limited to technologies with which
marginal abatement costs are lowered. In other words, marginal abatement costs are
319

continuous and strictly increasing over a relevant region of emission reduction, and
technological change is modeled simply as a decline in marginal abatement costs. Effectively,
these assumptions mean that pollution abatement is implemented only through adoption of
end-of-pipe technologies. The other type of technologies for dealing with emissions from the
production process, that is, clean technologies, has been mostly ignored. Since clean
technologies eliminate the creation of pollutants from within the production process by
altering the chemical reactions producing the main products, there is no pollution emission in
the first place, and thus marginal cost curves for pollution abatement become inappropriate
for the analysis of clean technologies.
Empirical studies conducted previously produced mixed results concerning the effects
of environmental regulation on technological change. One of the crucial issues affecting the
results of these studies is what kinds of technology are included in the category of innovation.
As the range of clean technologies can hardly be identified clearly in general terms without
regard to details of specific production processes, earlier empirical studies either exclusively
focused on technologies of the end-of-pipe type or included all innovations observed in each
case. While consideration of only end-of-pipe technologies limits the scope of technological
change for pollution abatement too narrowly and excludes clean technologies, the group of all
innovations contains technologies that have little relevance to environmental aspects and is
too broad to be appropriately used for the analysis of the impacts of environmental regulation
on technological change. Previous empirical as well as theoretical studies have looked at only
end-of-pipe technologies as technological measures for pollution abatement, and the existence
of clean technologies has not been taken into account properly. It is thus of critical
importance to incorporate into analysis the possibility of pollution elimination with clean
technologies, in contrast to pollution reduction with end-of-pipe technologies.
A detailed analysis of the end-of-pipe technology and the clean technology based on
chemical reaction equations clarifies the qualitative differences between the two types of
technological change. Basically, the end-of-pipe technology is designed to be installed at the
end of manufacturing plants and will not affect the manufacturing process producing the main
products. Its pollution abatement cost is relatively small when the level of emission reduction
is low and normally starts to rise as the emission standard becomes more stringent. While
innovations on the end-of-pipe technology will reduce the cost of complying with any fixed
level of the emission standard, the total cost of manufacturing with the use of the end-of-pipe
technology will not become smaller than the original output production cost. The cost of
320

output production will remain unchanged as the end-of-pipe technology does not affect the
main production process, whereas the cost of pollution abatement, which will not become
zero by whatever innovation, is added to the output production cost.
The clean technology, in contrast, eliminates the formation of pollution from within the
production process by altering the whole chemical reactions. Thus the use of the marginal
pollution abatement cost curve becomes inappropriate for the analysis of the clean technology,
which does not produce any pollutant emission in the first place. As the clean technology is a
radical innovation involving the whole production facilities, the capital investment for its
installation is normally large and its cost of output production will be larger, at least initially,
than that using the end-of-pipe technology. It is possible that the output production cost with
the clean technology will later become smaller than that with the original production cost as
the performance of the clean technology improves significantly through R&D and learning.
On the other hand, there are usually more than one options of the clean technology replacing
the original production technology, and the uncertainty concerning future progress in the
performance of the multiple alternatives will be large.
Based on the distinctive characters of the end-of-pipe technology and the clean
technology, our analytical framework is established for the effects of environmental
regulation on technological change (Figure 2-11). When an environmental issue occurs,
normally there is a large degree of uncertainty concerning where the sources of pollutant
emissions are located, what mechanisms of physical, chemical, and biological transformation
of the pollutants are involved, and how much damage has been or is expected to be made on
the human body and other living organisms. Given the existence of these various types of
uncertainty, it would be rare that scientific arguments can exclusively determine
environmental regulations, and other factors, including historical, political, and social
backgrounds, will inevitably influence the outcome of policy discussions. Reflecting the
diversity of the surrounding conditions, different regulations could be imposed in relation to
the same environmental issue.
When the regulations are so stringent as to effectively require the abolishment of the
existing production technology, firms will be prompted to find new clean technologies. There
are normally multiple alternatives, and a large degree of uncertainty exists concerning which
technology will progress to become the most efficient in the long run. Thus, to the extent that
the stringent regulations are implemented with a rigidly fixed schedule, it is possible that
insufficient time and opportunities allowed for R&D and learning will lead to a technological
321

choice that is not the most efficient. Yet this will only become apparent ex ante, after it has
been adopted widely and used for a certain period of time. Only when the regulations
maintain some flexibility in schedule and timing, will there be time to test and experiment
with various types of the clean technology, and the chance will be high that the most efficient
clean technology will be picked up for development and adoption.
When the environmental regulation is relatively weak, in contrast, firms will be induced
to choose end-of-pipe technologies because it is less expensive, at least initially, to reduce
emissions by using them than by adopting clean technologies that involve radical changes in
the whole production process. R&D efforts will be directed toward improving the
performance of end-of-pipe technologies, and as long as these technologies work successfully
to comply with the target of emission reduction, companies will continue to rely on the
original, pollution-laden production technology. By the time when the most efficient clean
technology becomes available from a region where more stringent regulations were
implemented, more plants have already been established utilizing the present production
technology. Unless the saving in the operating cost from the conversion to the clean
technology is sufficiently larger than the capital investment necessary to install it, the
operators of the relatively new plants will have strong incentives to continue to use the
existing production technology, equipped with end-of-pipe technologies for pollution
abatement, until the end of the physical life time of their plants, inhibiting the diffusion of the
most efficient clean technology.
Figure 6-1 shows in this analytical framework the effects of environmental regulation
on technological change in the chlor-alkali industry in Japan and Western Europe. Mercury
emissions from chlor-alkali production plants have been subject to intensive environmental
regulations in the two regions since the 1970s. Under the influence of different regulatory
approaches to mercury emissions, diverging courses of technological change have been
observed between the two regions.
322

Uncertainty concerning the mechanism and impact of mercury emissions on the
environment Requirement for phase-out of the mercury process
Japan (Chapter 4)
Western Europe(Chapter 5)
Standards for mercury emissions from the mercury process
R&D on clean technologies (diaphragm process and ion
exchange membrane process)
R&D on end-of-pipe technologies for abatement
of mercury emissions
Adoption of end-of-pipe technologies
Rigid and short-term schedule for the phase out
of the mercury process
Interruption and postponement of the phase-out mandate
Premature choice of the diaphragm
process
Further investment in plants based on the
mercury process
Diffusion of the ion exchange membrane
process
Continuing use of the mercury process until the
end of plant lifetime
Costly shift Slow shift
Insufficient time and opportunities for R&D
and learning
Technological progress in the ion exchange
membrane process
Dominant use of the mercury process in Western Europe and Japan (Chapter 3)
Figure 6-1 Diverging Impacts of Environmental Regulations on Technological Change in the Chlor-Alkali Industry in Japan and Western Europe
323

There are basically three types of technologies used for commercial production of chlor-
alkali products: the mercury process, the diaphragm process, and the ion exchange membrane
process. The mercury process and the diaphragm process were invented at the end of the 19th
century. In Europe and later in Japan, technologies for the mercury process were improved
further through learning and knowledge accumulation based on increased use in the industry,
and more chlor-alkali producers adopted the mercury process. By the end of the 1960s, the
mercury process had come to dominate the chlor-alkali industry in both Western Europe and
Japan. In each region, there were several innovative companies which made successful
technological developments for the mercury process. In Western Europe these included De
Nora, Uhde, Krebs, Solvay, and ICI whereas in Japan these were Osaka Soda, Kureha
Chemical Industry, Asahi Glass, Tokuyama Soda, Asahi Chemical Industry, and Mitsui
Engineering and Shipbuilding. In the early 1970s, just before regulations started to be
introduced to reduce mercury emissions into the environment, these companies in the two
regions were equally innovative on the mercury process technologies. That means that the
initial technological conditions in the chlor-alkali industry were similar between Western
Europe and Japan prior to any regulatory influence.
Japan had a tragic experience of the Minamata disease in the 1950s and 1960s. The
disease caused damages on the nerve system of those people who ate fish poisoned with
dimethyl mercury, a chemical substance which belongs to the category of organic mercury. It
had been contained in the waste water emitted to the sea by a chemical plant producing
acetaldehyde nearby. As most of the chlor-alkali plants at that time were based on the
mercury process, concerns rose among the general public on the environmental effects of
their emissions. What was discharged from mercury-based chlor-alkali plants, however, was
actually inorganic mercury, a substance whose chemical characteristics are distinctively
different from those of organic mercury, and there was no confirmed incident or scientific
evidence showing that the inorganic mercury emitted from chlor-alkali plants caused any
symptoms of the Minamata disease. Nevertheless, the public pressure was very intense, and
several chlor-alkali plants were forced to suspend their operation because of mass
demonstrations.
The increasing public pressure pushed the Japanese government to take a tough stance
on mercury emissions from chlor-alkali plants. That resulted in such as stringent regulation
set by the government as to demand chlor-alkali producers to completely abolish the mercury
process in just a few years, despite the chlor-industry’s strong oppositions. While financial
324
support was given for the adoption of clean technologies through preferential tax treatment
and low-interest public loans, the government did not provide any subsidies for R&D on clean
technologies. On the other hand, the stringent policy to abandon the mercury process created
a large, secured demand for mercury-free technologies, in stead of end-of-pipe technologies
aimed at reducing mercury emissions from the mercury process, and thus provided strong
incentives for innovative companies to work on new clean technologies and to supply them to
other chlor-alkali producers.
As the original process conversion program was implemented in a tight, inflexible
schedule, many of the leading companies in developing chlor-alkali production technologies
initially chose the diaphragm process as the alternative clean technology, because its
technological performance and reliability was considered to be superior to that of the ion
exchange membrane process at that time. Mitsui Shipbuilding and Engineering established a
specialized company, CEC, to introduce the diaphragm process developed by foreign
companies and provided it to chlor-alkali manufacturers. Kureha Chemical Industry also
chose the diaphragm process to replace the mercury process and subsequently developed its
own technology. Those companies which had been innovative on the diaphragm process, that
is, Nippon Soda, Tsurumi Soda, and Showa Denko, expanded their production capacities with
the diaphragm process and provided their technologies to outside companies. Only those
companies with less expertise on chlor-alkali production technologies, namely, Asahi
Chemical Industry, Asahi Glass, and Tokuyama Soda, directed their R&D efforts toward the
ion exchange membrane process, a production process which was not yet sufficiently
developed as to be utilized for industrial applications when the decision was made for the
phase out of the mercury process. Relying on their earlier experiences of developing ion
exchange membranes used in different fields, these companies utilized the opportunity offered
by the stringent regulation to innovate on the still infant ion exchange membrane process for
chlor-alkali production.
As the regulatory schedule for the conversion of the mercury process was initially set
with a rigid, short-term deadline, most of the chlor-alkali manufacturers had no choice other
than to adopt the diaphragm process, which had been long established at the level of industrial
applications. With the amount of time and learning limited, however, the technologies
developed by the Japanese companies could not be improved sufficiently as to be used for
commercial purposes. By the time that the first phase of the government conversion program
was ended, two thirds of the chlor-alkali production capacities in Japan had been converted to
325

the diaphragm process, but most of the technologies adopted were those introduced from
foreign companies. While the mercury process in Japan was mostly converted to the
diaphragm process, the disadvantage of the diaphragm process in terms of the production cost
was getting worse, as the energy price soared following the oil crisis. Moreover, it was
becoming clear that the quality of caustic soda produced by the newly introduced diaphragm
process was not high enough as to be used for some industrial applications.
In the meantime, the ion exchange membrane process was undergoing a rapid
technological advancement. Under these circumstances, the government interrupted the
implementation of the process conversion program for a while and established an expert
committee consisting of academic researchers to evaluate the extent of technological progress
in the emerging ion exchange membrane process. By conducting interviews and visiting
companies for detailed information on on-going technological developments, the committee
concluded that the ion exchange membrane process had reached a stage ready for industrial
applications. Following the technological assessment of the expert committee, the
government modified the original schedule for process conversion and postponed the deadline
for complete abolishment of the mercury process. This adjustment of the regulatory schedule
allowed more time for innovative companies to undertake R&D activities on the ion exchange
membrane process and to gain learning experiences through actual operations of chlor-alkali
plants, promoting further progress in the promising, but not yet fully established technology.
The ion exchange membrane process had advanced to become the best technology in the end
among the three chlor-alkali processes economically as well as environmentally, and
subsequently the remaining mercury-based plants were all converted to this process.
Currently the majority of chlor-alkali plants located in Japan are relying on the ion exchange
membrane process, and its technologies are increasingly adopted by chlor-alkali producers in
other countries.
On the other hand, those mercury-based plants which had been converted to the
diaphragm process immediately following the government decision on the phase out of the
mercury process were later converted again to the ion exchange membrane process. The
operating period of these plants based on the diaphragm process turned out to be significantly
shorter than that of plants operated in normal conditions. This implies that the substantial
amount of capital investment made to introduce the diaphragm process was not utilized to the
full extent until the end of the plant lifetime and thus effectively ended up wasted. Although
the evaluation of technological development on the ion exchange membrane process by
326

independent experts finally made it possible to change the regulatory schedule, the transition
was costly, going through the conversion of the mercury process initially to the diaphragm
process and then to the ion exchange membrane process. In retrospect, the large-scale shift
from the mercury process to the diaphragm process could have been avoided if the initial
government policy for the phase out of the mercury process had maintained a certain degree
of flexibility in the regulatory schedule, taking into account possibilities of future progress in
alternative clean technologies. As radical breakthroughs on the ion exchange membrane
process were perceived to be on the horizon by several innovative companies at the time of
the government decision, if the deadline for the phase out of the mercury process had been set
on a later period from the beginning, there could have been more time for detailed
experiments and evaluations of multiple choices of clean technologies, and most of the
existing mercury-based plants could have been converted directly to the ion exchange
membrane process, without devoting large investments in the diaphragm process.
In Western Europe, unlike the Japanese case, there was no reported incident in which
human bodies were seriously affected by the intake of mercury, and a less stringent approach
was taken to the regulation of mercury released into the environment. Rather than imposing a
mandate for complete abolishment of the mercury process, the public authorities specified
standards for mercury emissions from chlor-alkali plants, and their levels were gradually
tightened in the subsequent periods. As required by the emission standards, companies were
encouraged to develop technological measures for pollution abatement. Most of the
innovative companies in Western Europe, including ICI, Hoechst-Uhde, De Nora, Solvay, and
Krebs, directed their R&D activities to end-of-pipe technologies for the reduction of mercury
emissions, rather than to clean technologies which would eliminate the use of any mercury
within the production process. Various types of end-of-pipe technologies were successfully
developed, and they worked adequately to such an extent that they could meet the imposed
emission standards. With a remarkable reduction in mercury emission by using end-of-pipe
technologies, chlor-alkali producers in Western Europe mostly have continued to use the
mercury process. Although several companies had previously been engaged in R&D on the
ion exchange membrane process, the relatively weak regulatory regulations on mercury
emissions did not encourage further innovative efforts to develop the clean technology which
does not involve any use of mercury.
In the same period, the ion exchange membrane process was under rapid technological
progress in Japan, promoted by the strong regulation for the phase out of the mercury process,
327
and was on a way to become the most efficient technology among the three production
technologies. Observing this, the innovative companies in Western Europe started to intensify
their R&D activities on the ion exchange membrane process. As advanced types of ion
exchange membranes had been already developed by the Japanese companies, however, the
focus of R&D activities was placed on electrolytic cells for use in the new process. Relying
on ion exchange membranes introduced from outside, the Western European companies
began to industrialize the ion exchange membrane process much later.
Although the ion exchange membrane process has become the best clean technology
economically as well as environmentally, its diffusion in Western Europe has been slow and
limited. There are basically two factors that theoretically could affect the diffusion of a new
technology, that is, the availability of information on the new technology and the profitability
of replacing the existing technology with the new one. In terms of the amount of information
on the ion exchange membrane process, there have been ample opportunities for chlor-alkali
producers to obtain detailed and reliable data on its technological performance through
presentations made at industry conferences and papers published on technical and trade
journals. Thus lack of information could not be a major factor inhibiting a wide diffusion of
the ion exchange membrane process in Western Europe. With regard to the profitability of
replacing the mercury process with the ion exchange membrane process, the investment cost
of adopting the ion exchange membrane process has been much larger than the cost necessary
for the installation of end-of-pipe technologies to reduce mercury emissions, whereas the
operating cost of the ion exchange membrane process has become lower than that of the
mercury process. The scale of the cost saving by switching from the mercury process to the
ion exchange membrane process, however, has not yet been sufficient to justify the initial
investment necessary for the process conversion, although it is already economical to adopt
the ion exchange membrane process for new chlor-alkali plants.
What has been the critical factor influencing the diffusion of the ion exchange
membrane process in Western Europe is then the age of the existing chlor-alkali plants based
on the mercury process. Compared with chlor-alkali plants which had been constructed
previously, the operating period is still considerably short for most of the present mercury-
process plants, and that suggests that these plants have not yet reached the end of their
physical lifetime. While complying successfully with the emission standards through end-of-
pipe technologies, the operators of mercury-process plants have strong incentives to continue
to use them as long as they work physically. Particularly during the 1970s, after regulations
328

were introduced to limit mercury emissions into the environment, chlor-alkali plants
continued to be constructed using the mercury process. By the time that the ion exchange
membrane process with efficient and reliable performance became available to chlor-alkali
producers, many mercury-based plants had been already established. It will still take a long
period of time before these relatively new plants reach the end of their lifetime. Although the
regulators have recently recommended that the existing mercury-based plants be completely
discarded by 2010, the mercury process is still the dominant production technology in
Western Europe. The environmental regulations aimed at limiting mercury released to the
environment did encourage the development and adoption of end-of-pipe technologies, which
indeed worked relatively well in reducing mercury emissions. This success, however,
effectively helped to prolong the lifetime of the mercury process, which actually has been in a
process of technological obsolescence.
Indeed, the use of the mercury process has been increasingly avoided in the chlor-alkali
industry in other parts of the world, including many developing countries. In the past there
have been intense debates on the so-called pollution haven hypothesis, which basically claims
that developing countries will lower the level of their environmental regulations to attract
foreign direct investment by companies in pollution-intensive industries located in developed
countries to avoid stringent environmental regulations. The case of the chlor-alkali industry
shows that developing countries have been increasingly constructing new plants by adopting
the clean ion exchange membrane process, rather than the mercury process equipped with
end-of-pipe technologies aimed at reducing mercury emissions, as the ion exchange
membrane process has become more efficient without any use of mercury than the pollution-
laden mercury process. The case of technological change in the chlor-alkali industry suggests
that, given the existence of the two types of technological change to deal with pollutant
emissions, pollution haven may not necessarily be an unavoidable fate for developing
countries, which instead could leapfrog to the most efficient clean technology.
The case of technological change in the chlor-alkali industry has important implications
for analyzing the impacts of environmental regulation on industrial competitiveness. There
have been intensive debates between two opposite positions on this issue. On the one hand,
concerns have been raised about the negative effects of increasingly stringent regulations on
industries. That is, stringent environmental regulations will force firms to invest a
considerable amount of financial resources for compliance, and consequently their
competitiveness will be lost against those in countries with lax environmental regulations.
329

Environmental regulations impose significant costs, slow productivity, and thereby hinder the
ability of companies to compete in international markets by requiring firms to spend
additional resources for pollution abatement and control without increasing the output of main
products. On the other hand, the so-called Porter hypothesis claims that stringent
environmental regulations will actually enhance the competitive position of firms by
encouraging them to undertake more R&D activities and consequently to produce better
innovations in the long run. In other words, the necessity to comply with increasingly
stringent environmental regulations will prompt companies to re-examine their products and
production processes carefully and will ultimately lead to technological improvements.
Spurred by strong regulations, companies will go beyond mere compliance and could succeed
in creating radically new technologies which have not been realized previously.
Our analysis shows that what is critical in addressing this issue is to ask what kinds of
technological change would be promoted by environmental regulations. Since end-of-pipe
technologies are designed to be installed at the end of production processes, the costs
necessary for their adoption and operation are added to the original production costs, which
will only increase the total costs of manufacturing. Thus, we could say that those who argue
that environmental regulations decrease industrial competitiveness basically have end-of-pipe
technologies in mind. Clean technologies in contrast have the potential to achieve a better
performance than present technologies. Then an important question is how to encourage
companies to make innovations on a clean technology which will only be known to be the
best in the long run. When an environmental regulation is introduced, unless it is so stringent
as to require the existing production technologies be abolished, manufacturing companies
have two technological choices, that is, end-of-pipe technologies and clean technologies.
With the regulation fixed on a short-term schedule, companies will have incentives to comply
with the requirement of emission reduction with end-of-pipe technologies, an option which is
relatively easy and less costly to develop and adopt than clean technologies. As a result, the
present pollution-laden technologies, with emissions reduced through end-of-pipe
technologies, will continue to be used, whereas innovative activities will not be actively
pursued on clean technologies under the existence of uncertainty concerning the potential for
a better performance from a long term perspective.
This situation could be discussed in terms of what Clayton Christensen calls
“innovator’s dilemma” (Christensen, 1997). The concept basically says that a sound business
practice of focusing investments on technologies which meets the current demand of
330
customers profitably, which are defined as sustaining technologies, can ultimately weaken a
good company. Breakthrough innovations, or disruptive technologies, are initially rejected by
customers because of the lack of sufficient technological performance. That will lead firms
with strong focus on the current market demand to allow innovations which would be
strategically important in the future to languish. In a similar manner, we could argue that the
strategy of focusing investments on the most efficient measures for pollution abatement, that
is, end-of-pipe technologies, to meet the current demand of environmental regulations would
function to miss the opportunity of making radical innovations on technologies of critical
importance in the long run, that is, clean technologies. That is the case of the Western
European companies which had been previously innovative on the mercury process. These
companies initially focused on end-of-pipe technologies to reduce mercury emissions, and
their technological success in meeting the regulatory requirement effectively led to sustaining
the mercury process. The opportunity of inventing new ion exchange membranes was missed,
however, inhibiting subsequent technological developments on the ion exchange membrane
process, a truly disruptive technology for chlor-alkali production.
We could draw some policy implications from the experience in the chlor-alkali
industry. Environmental regulations should seek to encourage innovations on clean
technologies, which have the possibility of achieving economic and environmental objectives
at the same time, rather than innovations on end-of-pipe technologies, which will only lead to
incurring additional costs. At the same time, they need to avoid inducing wrong technological
choices prematurely in the presence of uncertainty, diversity, and rigidity inherent in the
process of technological change. Therefore, stringent regulations will be effective to create
strong and secured demands for clean technologies, shifting away from end-of-pipe
technologies which would only sustain the trajectory of the traditional, pollution-laden
production processes, but they should be implemented in a long-term framework to allow
sufficient time for experience and experiment on alternative clean technologies. To do that, it
would be necessary that regulations accommodate a certain degree of flexibility in schedule to
reflect accurate and up-to-date information on the state of technological developments
undergoing in industry. What would be important is that institutional mechanisms are set up
for appropriate information collection and assessment concerning clean technologies, which
involve a much larger level of uncertainty than end-of-pipe technologies, particularly in cases
where the speed of technological change is high and the uncertainty concerning future
progress is large.
331

We could argue that the Japanese government made a mistake in initially prompting the
companies to choose the diaphragm process effectively by implementing excessively
stringent regulations, especially given that there was no confirmed incident of Minamata-like
disease caused by inorganic mercury emissions from chlor-alkali plants. This occurred
because of the unusually strong public pressure, which allowed little time for careful
consideration on the potential of alternative clean technologies. At a later stage, only by
acquiring and evaluating accurate and up-to-date information on the rapid technological
progress through an independent expert committee consisting of researchers in academia, the
government could modify the regulatory schedule to accommodate further improvement on
the ion exchange membrane process and its subsequent adoption by chlor-alkali producers.
Since it is normally difficult for policy makers to closely keep up with the rapidly changing
state of technological development in industry, direct support to R&D activities focusing on a
specific clean technology would not be appropriate, as a wrong technology could be picked
up, given the existence of large uncertainty concerning the extent of technological progress in
the future. Rather, it would be more desirable to create and maintain demands for clean
technologies through regulatory incentives. When innovative companies are convinced that
there will be large and stable demands for clean technologies, they will be encouraged to
make innovative efforts on these technologies, as the Japanese companies did, even without
receiving any direct support to their R&D activities. What is important is to maintain the
diversity of options for clean technologies, avoiding a particular technological target at an
initial stage.
One caveat needs to be mentioned here regarding the technological impact of stringent
regulations. Stringent regulations do not necessarily promote totally new technologies which
have never been imagined. In the case of the ion exchange membrane process, ion exchange
membranes had been used for other purposes previously, and the idea of applying them for
chlor-alkali production had existed for a long time. The strong regulation for the phase out of
the mercury process, giving an assurance of a large market for clean technologies by
eliminating the possibility of end-of-pipe solutions, provided confidence sufficient to
overcome the barrier of uncertainty concerning potential progress in the ion exchange
membrane process which could be seen on the horizon. Thus what would be crucial is that
detailed information and knowledge on the state of technological development currently
occurring in industries is utilized appropriately in the process of policy making.
332

In acquiring accurate and delicate information on and making proper assessment of
evolving technologies, the way in which communication and information exchange are
practiced among policy makers and experts in industry and academia will be particularly
important. In this context, the recent emergence of voluntary agreements between industry
and government in industrialized countries is an interesting phenomenon deserving careful
examinations113. Our analysis suggests that voluntary approaches could have potential to
make it possible to utilize knowledge and information effectively and to adjust investment
schedules efficiently. At the same time, on the other hand, they need to maintain objectively
and transparency in setting the targets and monitoring the results through independent actors,
avoiding the problem of regulatory capture. As each country has its own peculiarity in the
relationship between government, industry, and academia, institutional mechanisms in which
information on the situation of technological development is acquired and assessed would be
different114. Accordingly, the appropriate mode of information acquisition and assessment to
encourage innovations on clean technologies could be diverse, depending on the distinct
institutional structure 115 . In other words, the structural coherence of the institutional
arrangements could prove increasingly central to the emergence of the most appropriate clean
technologies. Further research on international comparative analysis of institutional
arrangements will be invaluable to deepen our understanding of the effects of environmental
regulation on technological change116. We hope that this will help us ultimately to make a
step toward sustainable development through a transition from end-of-pipe technology to
clean technology.
113 See, for example, Carraro and Leveque (1999) for theoretical and empirical analyses on voluntary approaches in environmental policy. 114 For an interesting approach to the analysis of the role of information in institutional evolution and diversity, see Aoki (2000; 2001). 115 Various types of voluntary agreements have been already observed in the chemical industry in the United States, Europe, and Japan, which could be considered to reflect institutional differences between these regions (Baba and Yarime, 2000). 116 Vogel (1986) argues that there are “national styles” of regulation by examining environmental regulations in Great Britain and the United States. A recent study by Wallace (1995) is an attempt to analyze the relationship between environmental policy and industrial innovation in Europe, Japan, and the United States in a comparative framework.
333
Appendix. Effects of Environmental Regulation on Technological
Change of the Chemical Processes for Chlor-Alkali Production
In the evolution of production technologies in the chlor-alkali industry, there was another
opportunity in which divergent courses of technological trajectory were observed. That
happened between the Leblanc process and the ammonia process, both of which belonged to
the chemical process of chlor-alkali production. In this Appendix, we examine in a
preliminary way how environmental regulations influenced the divergent courses of
technological changes between the two processes by paying a particular attention to the chlor-
alkali industry in Britain in the 19th century.
A.1 Leblanc Process
The Leblanc process, invented by Nicolas Leblanc in France in 1787, was the first process for
the soda production which worked satisfactorily on an industrial scale117. In Britain its first
operation started in 1822. The Leblanc process had two distinct stages. The first step involved
the decomposition of common salt (sodium chloride, NaCl) with sulfuric acid (H2SO4) to
produce salt cake (sodium sulfate, Na2SO4):
2NaCl + H2SO4 -> Na2SO4 + 2HCl*.
The sodium sulfate was used directly for the glass manufacturer, in its purified form, sold as
the purgative Glauber’s salts. The vigorous reaction involved also produced large quantities
of hydrochloric acid gas (HCl), which had been simply emitted to the atmosphere as waste.
In the second step, the salt cake is fluxed with limestone (calcium carbonate, CaCO3)
and charcoal or coal (carbon, C) to produce black ash, a mixture of sodium carbonate
(Na2CO3) and calcium sulfide (CaS), together with a number of other impurities:
Na2SO4 + CaCO3 + 2C -> Na2CO3 + CaS + 2CO2.
The black ash is dissolved by water and then concentrated by evaporation to produce
commercially pure soda ash.
Prior to 1850, caustic soda (sodium hydroxide, NaOH) was not available commercially.
Processes such as soap making and paper making which required caustic soda had to obtain
117 For detailed treatments of the history of the Leblanc process and the ammonia-soda process, see Derry and Williams (1960) and Clow and Clow (1992).
334

this by causticizing a solution of purchased soda ash with slacked lime (calcium hydroxide,
Ca(OH)2) in the causticization or lime soda process:
Na2CO3 + Ca(OH)2 -> 2NaOH + CaCO3.
The flow diaphragm of the whole integration of the Leblanc and other related processes
is given in Figure A-1. As the Leblanc process developed and got more integrated, it became
the source of many other bulk inorganic materials and laid the foundations of the chemical
industry for more than a century afterwards. As Hardie and Pratt (1966) put, “during the first
half of the nineteenth century, and even later, the alkali industry was the chemical industry.”
335

Sulfur(S)
Oxygen(O2)
Steam(H2O)
Saltpeter(KNO3)
+ + +
Sulfuric acid(H2SO4)
Lead chamber process
+ Salt(NaCl)
Hydrochloric acid(HCl*)
Manganese dioxide(MnO2)
+ Salt cake(Na2SO4)
Limestone(CaCO3)
Coal(C)
Chlorine(Cl2)
+Slacked lime(Ca(OH)2)
Glassmaking
Black ash
Bleaching powder(Ca(ClO)2, CaCl2)
Tank waste(CaS*)
Soda ash(Na2CO3)
Slaked lime(Ca(OH)2)
Caustic soda(NaOH)
H2O+
Sulfur(S)
Soda crystals(Na2CO3)
Carbonic acid(H2CO3)
Sodium bicarbonate(NaHCO3)
+ +
Nitrogen oxides(NO*, NO2
*)
Glovertower
Gay-Lussactower
Cotton industry
Paper making
Domestic use
Medicine and baking
CO2 +
Manganese(Mn)
+
Weldonprocess
Hydrogen sulfide(H2S)
+
Chanceprocess
Leblanc process
Calcium carbonate(CaCO3)
Manganese chloride(MnCl2)
Slacked lime(Ca(OH)2)
+
Tennantprocess
Lime soda process
Figure A-1 Flow Diagram of the Leblanc Process
Based on Clow and Clow (1992).
336

A.1.1 Hydrogen Chloride Emissions
While caustic soda was produced in this way until the advent of electrolytic methods at the
end of the century, the Leblanc process was very inefficient and produced large amounts of
various wastes, which were initially dumped to air and water in the surrounding environment.
The overwhelming waste products littered landscapes that had once been productive
agriculturally and fouled the air with noxious gases. Among the most serious problems of the
Leblanc process was the hydrogen chloride (HCl) gas. For each ton of sodium carbonate
produced, about ¾ of a ton of hydrogen chloride was discharged. Initially, the hydrogen gas
was passed directly up factory flues and into the atmosphere. In the presence of moisture, it
was converted into rapidly into droplets of hydrochloric acid. These “noxious vapours”
damaged agricultural property as well as posed a health hazard, and, because of their impact,
the airborne emissions from alkali manufacture were called “the monster nuisance of all.” In
Britain, the effects of the growing alkali industry were so offensive, to the smell as well as to
the sight, that the protection of the neighboring communities became a matter of urgent
attention. Some of the major technological measures are given in Table A-1.
Table A-1 Regulation and Technological Development for the Treatment of Hydrogen Chloride Emissions from the Leblanc Process
Year Regulatory and Technological Development 1787 Invention of the Leblanc process in France 1822 Start of the operation of the Leblanc process in Britain 1836 Invention of the Gossage tower to absorb hydrogen chloride 1863 Enactment of the Alkali Act, which required 95% reduction of the hydrogen
chloride emission 1866 Development of the Weldon process for recovering manganese 1868 Development of the Deacon process for producing chlorine directly from
hydrochloric acid with catalyst 1874 Amendment of the Alkali Act to impose an absolute emission standard of 0.2 g
HCl/ft and to cover other gases
In 1836 the so-called Gossage tower was invented to prevent the escape of hydrogen
chloride. When the hydrogen chloride gas was passed down through the tower, it was
absorbed by a descending stream of water and converted into hydrochloric acid. By using
coke or other porous material, the Gossage tower was significantly improved to such an
extent that emissions of the hydrogen chloride gas could be significantly reduced if it was
used properly. While hydrochloric acid began to be used for making bleaching powder and
337

for other purposes, it was made in such quantities that the supply of hydrochloric acid far
outstripped demand. Moreover, since it was difficult and costly to transport the hydrochloric
acid, its market was highly localized. Production costs were increased to condense the
gaseous wastes, but the resultant liquid wastes still had to be disposed of in some way. Thus
the economic incentive for alkali manufacturers to condense the hydrogen chloride gas
effectively was very limited (Dingle, 1982). Although some manufactures had begun to
condense the hydrogen chloride gas since the 1830s, others were still not doing so even in the
late 1850s.
As the damage to vegetation was considerable while the abatement of fumes from alkali
works came to be considered as practicable, the government introduced a bill in 1863, and the
Act for the more effectual Condensation of Muriatic Acid Gas in Alkali Works came into
force on 1 January next year for a trial period of five years. The act provided that alkali works
were to condense 95 per cent of their hydrochloric acid gas by whatever method they
preferred. A substantial decrease in pollution from hydrochloric acid was achieved rather
quickly; by the end of 1964 the average escape of hydrogen chloride was reduced to 1.28 per
cent, which was well within the legally permissible value of 5 per cent (Reed, 1998). This
meant a reduction in the weekly escape of gas from roughly 4,000 tons in 1863 to 43 tons by
the end of 1864.
Then the Alkali Act was made perpetual in 1868, and its scope was enlarged later. The
Alkali Act of 1874 set a volumetric standard of 0.2 g of hydrochloric acid per cubic foot, and
extended the definition of noxious gases to cover fumes from sulfuric, sulfurous, and nitric
acids, hydrogen sulfide, and chlorine. All alkali manufacturers were required to use the “best
practicable means” to prevent their discharges into the atmosphere or render them harmless
when discharged (Reed, 1998). At that time 99 per cent recovery rates were common. By
1887 hydrochloric acid gas liberated into the atmosphere amounted to no more than 0.1 per
cent of the total gas produced (Warren, 1980). Subsequently, the Alkali, etc. Works
Regulation Act of 1881 set fixed standards for sulfur and nitrogen acid gases and included
prohibition on deposit and drainage of all alkali sulfur waste118.
118 In 1892 another Alkali Act extended the provisions of previous acts not only to all branches of the chemical industry, but also to a great number of other industries. Finally, a bill repealing previous alkali acts and replacing them by a single, consolidated act was introduced in 1894 and passed two years later (Haber, 1958).
338

Table A-2 Emissions of Hydrogen Chloride from the Leblanc Plants in Britain
Year 1863 1864 1874 1887 Regulation 5 % - 0.2 g HCl/ft3 -
Actual emissions - 1.28 % 1 % > 0.1 %
These introductions of regulations on emissions of hydrogen chloride made available a
large amount of hydrochloric acid recovered from the Leblanc process. That encouraged
technological developments for turning it into chlorine, which could be used directly for
preparing bleach. The method used to manufacture chlorine was to oxidize hydrochloric acid
by the use of manganese dioxide (MnO2):
MnO2 + 4HCl -> MnCl2 + Cl2 + 2H2O.
This process, however, was wasteful and costly, because all the manganese as well as much of
the chlorine as manganese chloride (MnCl2) was lost. While the profitability of bleaching
manufacture depended on the recovery of manganese and the maximization of the yield of
chlorine, the residual liquid, which contained both hydrochloric acid and chlorine, caused
great nuisance in watercourses and drains.
While manganese chloride could be neutralized with lime in the middle of the 1850s, a
more efficient process was invented in 1866. The essential feature of the Weldon process was
the use of excess lime, precipitating a mixture which contains manganese dioxide:
MnCl2 + Ca(OH)2 -> Mn(OH)2 + CaCl2
Mn(OH)2 + ½O2 -> MnO2 (recycled) + H2O.
By constantly recirculating the slurry of manganese, the so-called Weldon mud, losses were
kept within 4 to 10 per cent. For manufacturing one ton (1,016 kg) of bleaching powder,
Weldon’s process reduced the use of manganese from 16 cwt. (813 kg) to about 30 lb. (14 kg)
by the late 1880s (Warren, 1980). While most of the manganese dioxide was recovered in this
way, only one third of the available chlorine was liberated. Although it became possible to
make a ton of bleaching powder from 45 to 50 cwt. of salt, instead of 60 cwt. as hitherto,
much of the chlorine was still lost as the solid waste calcium chloride (CaCl2).
A direct process for recovering manganese was developed in 1868. The Deacon process
produced chlorine and water directly by passing hydrochloric acid gas and air over hot
brickwork impregnated with a catalyst of copper chloride (CuCl2).
4HCl + O2 (air) –(450-460°C, CuCl2)-> 2Cl2 + 2H2O
339

The Deacon process used salt more efficiently, as a ton of bleach could be made from 32 to
40 cwt. of salt. This process, however, had the disadvantage of requiring much more costly
and complicated equipment than the Weldon process; a plant with a capacity of 100 tons of
bleaching powder a week cost £13,000 whereas a comparable Weldon plant required £12,000
(Warren, 1980). As a result, despite its deficiencies, the Weldon process was adopted for most
of the world’s chlorine production up to the early year of the twentieth century.
Other countries took different approaches to legislation against atmospheric pollution
by chemical and allied works, without specifying any mission standards (Haber, 1958). In
France, an Imperial decree issued in 1810 empowered the prefect to control the building of
certain works and to prescribe their layout. Industries were classified according to the impact
they made on their surroundings, and the most noxious ones were banished to areas where
they could do least harm. Chemical plants hence could not be built alongside dwellings, and
the police had orders to enforce the decree. In the 1850s they were assisted by “Conseils
d’Hygiène,” which could investigate abuses and submit recommendations as to their removal
to the Ministry of the Interior. In Belgium a royal decree laid down that official permission
had to be granted before the building of a works emitting smoke and fumes could be started.
As far as is known, however, no action was taken to implement it. Prussia had no regulations
of any kind, but from 1861 onwards the public were entitled to state their objections to any
new project threatening the amenities. In Basle, 1853, certain types of works, including those
preparing chemicals, could not be established without the prior consent of the municipality.
The city’s sanitary inspector took energetic action against those found guilty of polluting
streams and emitting gases and, if the need arouse, called in outside experts to investigate and
offer advice.
A.1.2 Tank Waste
Another major waste produced in the Leblanc process was tank waste or alkali waste, of
which the main constituent was calcium sulfide (CaS). Every ton of Leblanc soda ash was
accompanied with about 1.4 tons of tank waste, an insoluble residue which remained after the
soda ash had been extracted from the black ash. This smelly waste was dumped around the
works, causing a great loss of space and polluted air and water. The Alkali Inspector
estimated in the early 1880s that there were nearly 4.5 million tons of alkali waste in
Lancashire alone and that it was increasing at the rate of 1,000 tons a day (Haber, 1958). In
Widnes tips began to appear after 1865, and by 1888 it was estimated that 680 acres of land
340

had been covered with waste to a depth of from 8 to 25 feet, amounting to 9 million tons
(Warren, 1980). The loss of sulfur, which consisted of 20 to 25 per cent of the tank waste, was
considerable; indeed, it was well known that all the sulfur, in the form of sulfuric acid,
employed in the production of Leblanc soda was lost. As sulfur was a substance that was
expensively imported to make sulfuric acid, there was a great incentive to recover sulfur from
the solid waste.
Attempts were made as early as in the 1830s to liberate hydrogen sulfide from calcium
sulfide and to convert this gas to sulfurous acid (Table A-3). Other similar investigations in
the 1860s achieved a measure of success. They converted calcium sulfide to hyposulfite and
then precipitated sulfur by treatment with excess hydrochloric acid. It was claimed that 50 to
60 per cent of the available sulfur could be recovered, but in practice it was not possible to
obtain more than 40 per cent. The process was expensive and troublesome and therefore was
only in limited use (Haber, 1958).
Table A-3 Technological Developments for the Treatment of Tank Waste form the Leblanc Process
Year Technological Development 1837 Gossage’s attempts to recover sulfur from calcium sulfide 1862 Mond’s and Schaffner’s attempts to recover sulfur from calcium sulfide 1882 Invention of the Claus kiln 1888 Development of the Chance process for recovering sulfur from the waste of
calcium sulfide
The decisive breakthrough came only in the 1880s. About forty years earlier it had been
already realized that an excess of carbonic acid was necessary to liberate hydrogen sulfide
from tank waste, but suitable equipment to accomplish this purpose was not successfully
devised. Owing to the availability of improved machinery and appliances, an efficient
apparatus was invented by Chance in 1888. In the Chance process, tank waste was made into
slurry and passed through an arrangement of cylinders, “carbonators”, where it came into
contact with flue gas containing carbon dioxide. Hydrogen sulfide (H2S) of the desired
concentration was evolved in the last cylinder:
2CaS + H2O + CO2 -> Ca(SH)2 + CaCO3
Ca(SH)2 + H2O + CO2 -> CaCO3 + 2H2S.
The hydrogen sulfide was then transferred to a kiln, which was invented by Claus in 1882, in
which the catalytic action of ferric oxide liberated sulfur (S):
341
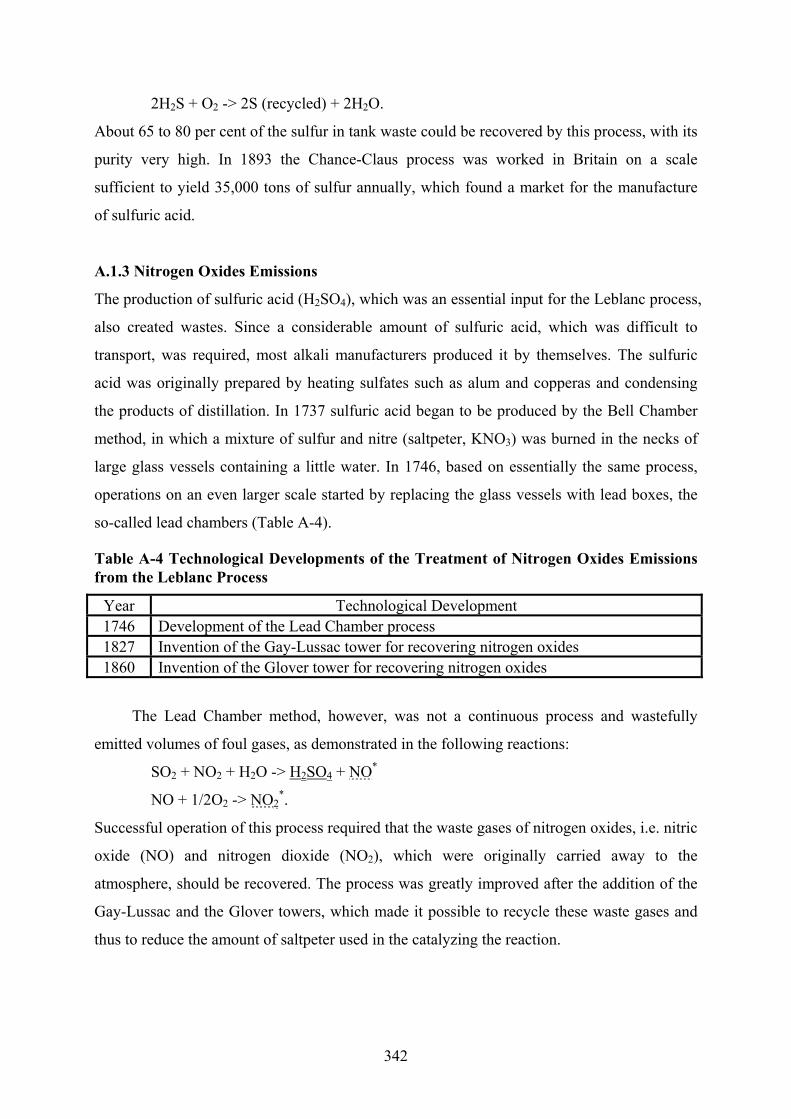
2H2S + O2 -> 2S (recycled) + 2H2O.
About 65 to 80 per cent of the sulfur in tank waste could be recovered by this process, with its
purity very high. In 1893 the Chance-Claus process was worked in Britain on a scale
sufficient to yield 35,000 tons of sulfur annually, which found a market for the manufacture
of sulfuric acid.
A.1.3 Nitrogen Oxides Emissions
The production of sulfuric acid (H2SO4), which was an essential input for the Leblanc process,
also created wastes. Since a considerable amount of sulfuric acid, which was difficult to
transport, was required, most alkali manufacturers produced it by themselves. The sulfuric
acid was originally prepared by heating sulfates such as alum and copperas and condensing
the products of distillation. In 1737 sulfuric acid began to be produced by the Bell Chamber
method, in which a mixture of sulfur and nitre (saltpeter, KNO3) was burned in the necks of
large glass vessels containing a little water. In 1746, based on essentially the same process,
operations on an even larger scale started by replacing the glass vessels with lead boxes, the
so-called lead chambers (Table A-4).
Table A-4 Technological Developments of the Treatment of Nitrogen Oxides Emissions from the Leblanc Process
Year Technological Development 1746 Development of the Lead Chamber process 1827 Invention of the Gay-Lussac tower for recovering nitrogen oxides 1860 Invention of the Glover tower for recovering nitrogen oxides
The Lead Chamber method, however, was not a continuous process and wastefully
emitted volumes of foul gases, as demonstrated in the following reactions:
SO2 + NO2 + H2O -> H2SO4 + NO*
NO + 1/2O2 -> NO2*.
Successful operation of this process required that the waste gases of nitrogen oxides, i.e. nitric
oxide (NO) and nitrogen dioxide (NO2), which were originally carried away to the
atmosphere, should be recovered. The process was greatly improved after the addition of the
Gay-Lussac and the Glover towers, which made it possible to recycle these waste gases and
thus to reduce the amount of saltpeter used in the catalyzing the reaction.
342

In 1827 Gay-Lussac developed the absorption tower that then made it possible to
capture nitrogen oxides from the sulfuric acid chambers to produce nitrosyl sulfuric acid
(ONOSO3H), so-called “nitrous vitriol”:
NO + NO2 +2H2SO4 -> 2ONOSO3H + H2O.
This improved not only the environmental but also the economic aspects of the process, as
more than 50 per cent of the saltpeter used could be saved. However, it was not easy to return
the active nitrogen oxides to the working chambers without diluting the solution of nitrosyl
sulfuric acid in sulfuric acid with water. Because of the high cost of reconcentrating the
diluted acid to commercial strength after the release of nitrogen oxides, most producers did
not put the Gay-Lussac’s invention into practice (Hocking, 1998). With nitrate of soda at £ 12
a ton in the early 1860s, it did not pay to collect and absorb the waste oxides of nitrogen
(Warren, 1980).
The development of the Glover tower in 1860 allowed, in the same unit, both the
release of nitrogen oxides by water dilution and the reconcentration of the acid via the hot
gases generated from sulfur combustion:
ONOSO3H + H2O -> H2SO4 + HNO2 (recycled).
This additional innovation made the combination of the two towers more attractive to sulfuric
acid producers: the Glover tower at the front-end unit, as a generator-concentrator, and the
Gay-Lussac tower at the tail gas recovery unit. A rise in saltpeter prices between 1868 and
1870 led to the widespread adoption of the Glover-Gay-Lussac system in Britain (Haber,
1958).
A.1.4 Improvement of the Leblanc Process through End-of-Pipe Technologies
The years between 1860 and 1880 have been called the golden years of the Leblanc soda
industry. The problems of waste and pollution were overcome gradually by technological
improvements, which were basically end-of-pipe equipment. That also brought about great
savings in raw materials at the same time. The Leblanc process had reached a modicum of
efficiency as a self-contained series of interlocking processes by the 1880s. By the end of the
19th century, the cost of raw materials required to make a ton of soda ash had fallen to less
than £2, as shown by the trends in the consumption of materials for the Leblanc process in
Table A-5.
343

Table A-5 Consumption and Cost of Raw Materials for the Unit Production of Soda Ash in the Leblanc Process
1861 1876 1886 1894 quant. £ s. d. quant. £ s. d. quant. £ s. d. quant. £ s. d.
Pyrites 24 cwt. 1 15 0 17 cwt. 15 4 13.5 cwt. 9 3 - - Saltpeter 112 lb. 12 0 32 lb. 3 4 23 lb. 2 0 - - Salt 25 cwt. 10 0 25 cwt. 1 0 0 25 cwt. 10 0 - - Saltcake - - - - - - 33 cwt. 16 8Limestone 30 cwt. 10 0 32 cwt. 4 4 26 cwt. 6 6 n/a 6 6Coal (slack)
70 cwt. 1 1 0 60 cwt. 16 6 55 cwt. 12 6 n/a 13 9
Total - 4 8 0 - 2 19 6 - 2 0 3 - 1 16 111861 and 1886: the costs are for a works in Lancashire. 1876: the costs are for a medium-sized business in Tyneside. Source: Haber (1958).
A.2 Ammonia Soda Process
On the other hand, it was shown theoretically as early as 1811 that ammonium salts could be
used to generate soda in the so-called ammonia soda process (Table A-6). Although the
apparent simplicity of the process was quite attractive, for many years the complexity of the
equipment and the problem of the loss of ammonia defeated attempts to develop it on an
industrial scale.
Table A-6 Technological Developments of the Ammonia Soda Process
Year Technological Development 1811 Theoretical investigation on the ammonia soda process by Fresnel 1861 Invention of the Solvay tower for the recovery of ammonia 1864 Operation of the first ammonia soda plant by Solvay 1872 Operation of the first ammonia soda plant in Britain 1880 Operation of the first ammonia soda plant in Germany 1884 Operation of the first ammonia soda plant in the United States
The flow diagram of the ammonia soda process is given in Figure A2-2. First, calcium
carbonate (CaCO3) is heated to give calcium oxide (CaO) and carbon dioxide (CO2):
CaCO3 -> CaO + CO2.
The carbon dioxide is then bubbled into a solution of sodium chloride (NaCl) in ammonia
(NH3), and sodium bicarbonate (sodium bicarbonate, NaHCO3) is precipitated:
NaCl + NH3 + CO2 + H2O -> NaHCO3 + NH4Cl.
344

The sodium bicarbonate is converted into soda ash (sodium carbonate, Na2CO3) by the
application of heat:
2NaHCO3 -> Na2CO3 + CO2 + H2O.
The ammonium chloride (NH4Cl) is heated with calcium oxide, which is obtained from the
first stage of the process, to regenerate the ammonia:
2NH4Cl + CaO -(heat)-> CaCl2 + 2NH3 (reuse) + H2O.
Coke ovens
Coke + Limestone (CaCO3)
Ammonia (NH3)
Concentrated brine (NaCl, H2O)
+
Ammoniacal salt (NaCl, NH3, H2O)
Carbon dioxide (CO2)
Sodium bicarbonate (NaHCO3)
Ammonium chloride (NH4Cl)
Heat
Soda ash(Na2CO3)
Carbon dioxide (CO2)
Calcium chloride (CaCl2)
Ammonia (NH3)
Quicklime (CaO)+
Solvay tower
Figure A-2 Flow Diagram of the Ammonia-Soda Process
Based on Warren (1980).
A similar process was patented in Britain in 1838 and was practiced subsequently. A
number of other chemical manufacturers in Britain, France, and Germany attempted to
manufacture soda by this ammonia soda method, on which at least eight patents were granted
between 1838 and the early 1860s (Warren, 1980). All the efforts, however, proved to be
commercial failures, because of practical difficulties, namely, imperfect conversion of the salt
345

and, more importantly, the loss of ammonia, a light and volatile gas, which was relatively
costly to manufacture.
In 1861 the Belgian chemist, Ernst Solvay designed a tower to recover ammonia
successfully. In the so-called Solvay tower, a solution of ammoniacal salt was met by an up
current of carbon dioxide. By periodic withdrawal of part of the solution from the Solvay
tower and its replacement by a fresh solution of ammoniacal salt, the process was made
continuous. Ammonia was initially provided from gasworks, but the supply was later
increased by installation of by-product coke ovens. Solvay’s work on this involved the
scrubbing of by-product gases and led to the development of the Semet-Solvay oven design.
His other developments included improvements in the kilns for liberating carbon dioxide
from limestone and for calcining the sodium bicarbonate. Solvay formed a company in
Belgium to work the process, and the first works was built in 1863. It was four years before
the Solvay process was finally working satisfactorily.
The ammonia soda process was licensed and introduced into Britain in 1873, and the
soda production started one year later. The initial failure of the ammonia soda process was
due to the lack of an efficient method of recovering ammonia from the mother liquor and the
inability to minimize ammonia losses during operation. Since ammonia was a comparatively
expensive commodity, the heavy losses of ammonia in the cycle made it impossible for the
process to compete with the Leblanc process. A column distiller designed by Mond and built
in 1883 made the recovery of ammonia possible by reacting ammonium chloride with
quicklime, leaving calcium chloride as waste material (Hou, 1942). As a result, the loss of
ammonia in the ammonia soda process was almost halved between 1862 and 1887 (Warren,
1980).
The ammonia soda process, however, had a weakness that the chlorine used in the salt
remained locked up in the calcium chloride (CaCl2). It had to be dumped as solid waste,
although on a very much smaller scale than that of the tank waste of the Leblanc process. In
1886 Mond developed a method to make it possible to recover the chlorine by passing
calcium chloride over a nickel oxide catalyst. In practice, his method was still ineffective and
was superseded by Carl Höpfner’s process, in which the chlorine was recovered as zinc
chloride and then decomposed electrolytically, making it possible to produce bleaching
powder. In 1895 the Löwig process was adopted for making caustic soda by furnacing soda
346

ash with ferric oxide119 and separating the resulting sodium ferrite, by leaching with water,
into caustic soda and ferric oxide120, which was reused in the process (Warren, 1980).
The ammonia soda process was to a high degree self-contained, and the raw materials of
brine and ammonia were readily available. Less fuel was used than in the Leblanc process,
and no sulfur or nitre was involved. The ammonia soda process hence had enormous
advantages over the Leblanc process. A comparison of costs between the Leblanc and the
ammonia soda processes in 1872 is given in Table A-7.
Table A-7 Production Costs of the Leblanc and Ammonia Soda Processes in 1872
Leblanc processa Ammonia soda processb Materials and
overheads Quantity per ton Cost per ton
£ s. d.Quantity per ton Cost per ton
£ s. d.Pyrites 17.5 cwt.c 1 10 8 - -Saltpeter 56 lb. 7 0 - -Salt 29 cwt. 12 4 40 cwt. (brine) 1 6Limestone 35 cwt. 11 4 44 cwt. 14 4Coal (slack) 88 cwt. 1 15 2 39 cwt. 17 3Coke - - 5.5 cwt. 5 0Ammonia sulfate - - 202 lb. 1 16 0Total material costs - 4 16 6 - 3 14 1Wages - 1 12 0 - 15 0Salaries, rents, rates - 1 5 0 - 14 8Insurance - 14 0 - 11 0Packages - 18 0 - 1 2 0Freight to Liverpool - 2 0 - 3 6Royalty - - - 8 0Grand total - 9 7 0 - 7 8 3(55% Na2O equivalent) a: a plant at Widnes b: a projected plant at Winsford c: 1 hundredweight (cwt.) = 112 pounds (lbs.) = 50.8 kg Source: Cohen (1956).
He drew on his experience with Hutchinson at Widnes for the Leblanc figures and on
Solvay and Mond for the ammonia soda estimates. The table shows that there was a
difference of nearly £2 per ton in favor of the ammonia soda process. As regards the capital
investment, it was estimated that an ammonia soda plant with a weekly output of 60 tons cost
119 Na2CO3 + Fe2O3 -> 2NaFeO3 + CO2 120 2NaFeO2 + H2O -> 2NaOH + Fe2O3
347

£13,500 and a Leblanc installation of the same capacity, £10,000 (Haber, 1958). Assuming
plants were operated for 50 weeks a year, their annual output was
60 tons/week x 50 weeks/year = 3,000 tons/year.
Hence the annual saving in operating cost was
£2/ton x 3,000 tons/year = £6,000/year.
On the other hand, the difference in capital investment between the ammonia soda and the
Leblanc processes was
£13,500 – £10,000 = £3,500.
Thus, it did not take one year to recover the initial excess investment in the ammonia process.
As another cost estimation made in 1894 shows in Table A-8, the difference in
operating costs between the two processes remained significantly wide and, as far as the
Leblanc process was concerned, irreducible. Accordingly, the Leblanc process started to
experience severe competition from the ammonia soda process.
Table A-8 Production Costs of the Leblanc and Ammonia Soda Processes in 1894
Leblanc processa Ammonia soda processb £ s. d. £ s. d.
Raw materials 1 16 11 1 1 6Saltcake 16 8 -Brine and pumping charges - 9Limestone 6 6 4 6Slack 13 9 9 0Coke - 1 3Loss of ammonia - 6 0Wages 14 0 14 3Management, laboratory, and office expenses 2 0 3 6Repairs, wages, and materials 4 6 5 6General charges 4 6 14 0Total £3 1 11 £2 18 9a: 55% Na2O equivalent b: 58% Na2O equivalent Source: Warren (1980).
Significantly, however, many alkali producers in Britain continued to use the Leblanc
process. The British Leblanc soda production increased throughout the 1870s, with the
highest point achieved in 1880 (Table A-9). Thereafter, the Leblanc process maintained its
position as the dominant technology for the British chlor-alkali industry, although its
348

production shrank by 10 per cent from 1884 to 1994, from 380,000 tons to 340,000 tons in
1894.
Table A-9 Soda Productions by the Leblanc and the Ammonia Soda Processes in Britain
Leblanc process Year Soda asha Caustic soda Totalc
Ammonia soda processd
1874 - - - 800 1875 - - - 2,400 1878 196,900 100,800b 330,460 11,100 1880 266,100 106,400 407,080 18,800 1882 233,200 116,900 388,093 - 1884 204,100 141,600 391,720 - 1885 - - - 77,500 1886 165,900 153,900 369,818 - 1890 - - - 179,700 1894 - - 340,000 181,000 1898 - - - 181,000 1903 - - - 240,000
Figures are expressed in British tons. a: as 48 % Na2O b: Including production by non-members of the Alkali Association. (Later statistics of the Leblanc soda industry have not been published.) c: Total production of the Leblanc process was calculated as equivalent to soda ash121. d: Production figures of the ammonia soda process are those of Brunner, Mond & Co. Sources: 1894: Warren (1980). All other years: Haber (1958).
Operators of the Leblanc process made heavy capital investments in plants and had
strong incentives to continuing to use it. Over 90 per cent of the British Leblanc
manufacturers combined forces to form the United Alkali Company (UAC) in 1890 and began
to modernize their obsolescent plants. The new company established a Central Research
Laboratory in 1891, which was unusual in any chemical company at that time except for the
German dyestuffs industry122, to conduct a research program to improve the efficiency of the
Leblanc process. Hence for a limited period of time UAC could remain viable and
increasingly efficient by reducing its output of soda ash and maximizing its output of sulfuric
acid, bleach and caustic soda, and the Leblanc process was still the dominant technology at
the end of the 19th century.
121 As the reaction involved is Na2CO3 + Ca(OH)2 -> 2NaOH + CaCO3, 1 molecule of soda ash is consumed to produce 2 molecules of caustic soda. Since the molecular weight of soda ash, Na2CO3, is 106 and that of caustic soda, NaOH, is 40, 1 ton of caustic soda is equivalent to 106/(40 x 2) = 1.325 tons of soda ash.
349

In contrast, the manufacture of soda in France was transformed by the introduction of
the ammonia soda process, as shown in Table A-10. While 30 to 40 Leblanc plants produced
about 50,000 to 60,000 tonnes of alkali at around the time of 1870, only three plants operated
in 1899, whose combined output had declined significantly to 20,000 tonnes. On the other
hand, soda production by the ammonia-soda process increased rapidly. Its share in soda
production in France surpassed that of the Leblanc process in the middle of the 1880s and had
reached more than 80 % by 1993. Solvay, in particular, quickly obtained a dominant position
in operating the ammonia soda process; by the end of the century, the company had accounted
for over four fifths of the French ammonia soda production.
Table A-10 Soda Productions by the Leblanc and the Ammonia Soda Processes in France
Year Leblanc process Ammonia soda process Total 1874 56,000 (77 %) 17,000 (23 %) 73,000 1880 55,000 (56 %) 44,000 (44 %) 99,000 1883 50,000 (53 %) 44,000 (47 %) 94,000 1888 32,000 (25 %) 97,000 (75 %) 129,000 1893 27,000 (18 %) 120,000 (82 %) 147,000 1896 22,000 (12 %) 168,000 (88 %) 190,000 1899 20,000 (9 %) 195,000 (91 %) 215,000a 1902 15,000 (7 %) 215,000 (93 %) 230,000 1905 6,000 (2 %) 270,000 (98 %) 276,000b
Figures are expressed in metric tonnes. a: 2,000 tonnes of electrolytic alkali were made in addition. b: 4,000 tonnes of electrolytic alkali were made in addition. Sources: Ogburn and Jaffé (1929), Haber (1958).
Table A-11 shows the world trends in soda production by the Leblanc and the ammonia
soda processes from the middle of the 19th century to 1940. From the early 19th century, the
alkali industry was a growth industry in the world. In 1863 soda ash production reached an
estimated 300,000 tons, all of which were produced by the Leblanc process. The world
production had passed 1 million tons by 1890, by which time the ammonia soda process had
stolen the edge over the Leblanc process in output. In 1900, of the world total production of
1,500,000 tons, only 200,000 tons were produced by the Leblanc process. In 1920 the last
Leblanc plant in Britain was closed whereas by that time the production by the ammonia soda
process had already surpassed three million tons.
122 Meyer-Thurow (1982) discusses the decisive role that scientific research played in the development of the
350
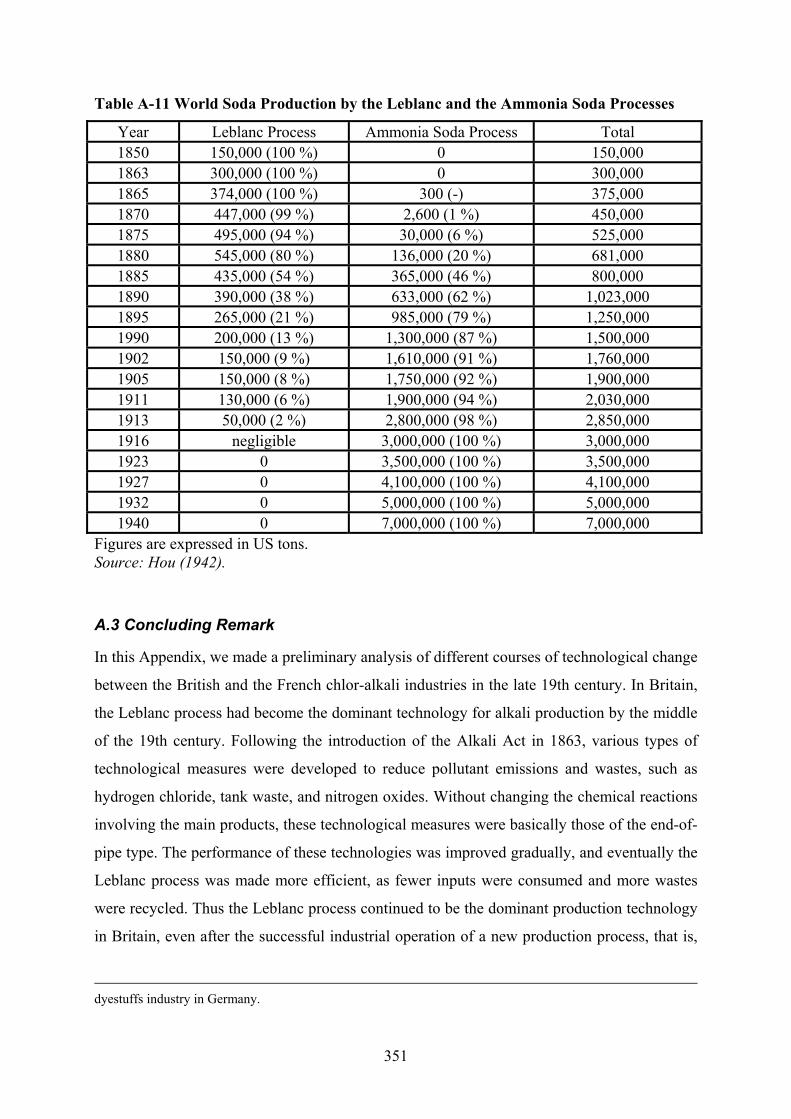
Table A-11 World Soda Production by the Leblanc and the Ammonia Soda Processes
Year Leblanc Process Ammonia Soda Process Total 1850 150,000 (100 %) 0 150,000 1863 300,000 (100 %) 0 300,000 1865 374,000 (100 %) 300 (-) 375,000 1870 447,000 (99 %) 2,600 (1 %) 450,000 1875 495,000 (94 %) 30,000 (6 %) 525,000 1880 545,000 (80 %) 136,000 (20 %) 681,000 1885 435,000 (54 %) 365,000 (46 %) 800,000 1890 390,000 (38 %) 633,000 (62 %) 1,023,000 1895 265,000 (21 %) 985,000 (79 %) 1,250,000 1990 200,000 (13 %) 1,300,000 (87 %) 1,500,000 1902 150,000 (9 %) 1,610,000 (91 %) 1,760,000 1905 150,000 (8 %) 1,750,000 (92 %) 1,900,000 1911 130,000 (6 %) 1,900,000 (94 %) 2,030,000 1913 50,000 (2 %) 2,800,000 (98 %) 2,850,000 1916 negligible 3,000,000 (100 %) 3,000,000 1923 0 3,500,000 (100 %) 3,500,000 1927 0 4,100,000 (100 %) 4,100,000 1932 0 5,000,000 (100 %) 5,000,000 1940 0 7,000,000 (100 %) 7,000,000
Figures are expressed in US tons. Source: Hou (1942).
A.3 Concluding Remark
In this Appendix, we made a preliminary analysis of different courses of technological change
between the British and the French chlor-alkali industries in the late 19th century. In Britain,
the Leblanc process had become the dominant technology for alkali production by the middle
of the 19th century. Following the introduction of the Alkali Act in 1863, various types of
technological measures were developed to reduce pollutant emissions and wastes, such as
hydrogen chloride, tank waste, and nitrogen oxides. Without changing the chemical reactions
involving the main products, these technological measures were basically those of the end-of-
pipe type. The performance of these technologies was improved gradually, and eventually the
Leblanc process was made more efficient, as fewer inputs were consumed and more wastes
were recycled. Thus the Leblanc process continued to be the dominant production technology
in Britain, even after the successful industrial operation of a new production process, that is,
dyestuffs industry in Germany.
351

the ammonia soda process. Following its successful invention in the 1860s, the new ammonia
soda process became more efficient than the Leblanc process as early as the 1870s and came
to dominate the chlor-alkali industry. In other countries such as France, the Leblanc process
was replaced with the ammonia soda process rather quickly while the Leblanc process
remained as a major production technology in the British alkali industry for a long time.
Although this case of technological change needs more detailed and careful analysis, it
suggests the possibility that environmental regulations on pollutant emissions in Britain
induced alkali producers to develop end-of-pipe technologies for pollution reduction, which
in effect delayed the diffusion of the newly developed, more efficient ammonia soda process.
The chemical processes, however, were only to be superseded by the electrolytic routes,
including the mercury process and the diaphragm process, which at that time were rapidly
becoming established, concomitant with the development of the large-scale methods for the
production and distribution of electricity.
352

References
Adar, Zvi and James M. Griffin. 1976. "Uncertainty and the Choice of Pollution Control
Instruments." Journal of Environmental Economics and Management, 3, 178-188.
Aftalion, Fred. 1991. A History of the International Chemical Industry. Philadelphia:
University of Philadelphia Press.
Ahlqvist, Harald. 1936. "Alkali Industries Girdle the Globe." Chemical & Metallurgical
Engineering, 43 (5), 278-281.
Aikawa, Hiroaki. 1998. "Kagaku Kogyo ni okeru Enso no Yakuwari: Iwarenaki 'Kankyo
Osen no Genkyo'-setsu ni taishite (The Role of Chlorine in the Chemical Industry:
Against the Unfounded Theory of 'The Cause of Environmental Pollution')." Soda to
Enso, (10), 18-22.
Alperowicz, Natasha, Esther D'Amico, and Robert Westervelt. 2001. "Engineering &
construction: Still a buyers' market." Chemical Week, 163 (21), 23-26.
Anastas, Paul T. and John C. Warner. 1998. Green Chemistry: Theory and Practice. New
York: Oxford University Press.
Aoki, Masahiko. 2000. Information, Corporate Governance, and Institutional Diversity:
Competitiveness in Japan, the USA, and the Transitional Economies. New York:
Oxford University Press.
Aoki, Masahiko. 2001. Toward a Comparative Institutional Analysis. Cambridge,
Massachusetts: MIT Press.
Arora, Ashish. 1997. "Patents, licensing, and market structure in the chemical industry."
Research Policy, 26, 391-403.
353

Arrow, Kenneth J. 1962. "The Economic Implications of Learning by Doing." Review of
Economic Studies, 29, 155-173.
Arthur, W. Brian. 1989. "Competing Technologies, Increasing Returns, and Lock-in by
Historical Small Events." Economic Journal, 99, 116-131.
Asahi Chemical Industry. 1998. "Chlor-Alkali Plant Capacity Employing Asahi Chemical
Bipolar Process." Asahi Chemical Industry.
Asahi Glass. 1999. "AZEC Electrolyzer Supply Record." Asahi Glass.
Asahi Shinbun. 1973a. "Ariake-kai ni 'Daisan Minamata-byo' ('The Third Minamata Disease'
in the Ariake Sea)." Asahi Shinbun, May 22.
Asahi Shinbun. 1973b. "Tokuyama-wan Engan, Jumin ni Minamata-byo no Utagai (An
Allegation of the Minamata Disease in the Tokuyama Bay area)." Asahi Shinbun, June
11.
Austin, John H. and Manuel Esayian. 1984. "Membrane Technology for Existing Chloralkali
Plants." in Milton M. Silver and Everett M. Spore eds. Proceedings of the Symposium
on Advances in the Chlor-Alkali and Chlorate Industry. Pennington, NJ:
Electrochemical Society.
Avery, Ruth Butler, Mary Lou Conant, and Helen F. Wiessenborn. 1959. "Selected Annotated
Bibliography of Asbestos Resources in the United States and Canada," in United
States Geological Survey ed. Contribution to Bibliography of Mineral Resources
1955-59. Washington, D.C.: United States Government Printing Office.
Baba, Yasunori and Masaru Yarime. 2000. "Bringing forth Green Innovation: Role of
Industry's Voluntary Actions." in. Proceedings of the International Symposium 'The
21st Century: How Can the Circulatory Society be Achieved?' Graduate School of
Agricultural and Life Sciences, University of Tokyo.
354

Baba, Yasunori, Masaru Yarime, and Hiroyuki Hatashima. 1997. "Realising the Shift towards
Closed-loop Recycling: Strategies of the Japanese Firms." International Journal of
Innovation Management, 1 (1), 89-110.
Balmann, Alfons, Martin Odening, Hans-Peter Weikard, and Wilhelm Brandes. 1996. "Path-
dependence without increasing returns to scale and network externalities." Journal of
Economic Behavior and Organization, 29, 159-172.
Bartzokas, Anthony and Masaru Yarime. 1997. "Technology Trends in Pollution Intensive
Industries: A Review of Sectoral Trends." Discussion Paper. 9706. United Nations
University Institute for New Technologies.
Baumol, William and Wallace Oates. 1988. The Theory of Environmental Policy, Second ed.
Cambridge, UK: Cambridge University Press.
Bellas, Allen S. 1998. "Empirical evidence of advances in scrubber technology." Resource
and Energy Economics, 20, 327-343.
Bergner, Dieter. 1977. "Elektrolytische Chlorerzeugung nach dem Membranverfahren."
Chemiker-Zeitung, 101 (10), 433-447.
Bergner, Dieter. 1982. "Membrane cells for chlor-alkali electrolysis." Journal of Applied
Electrochemistry, 12, 631-644.
Bhanagar, Smita B. and Mark A. Cohen. 1999. "The Impact of Environmental Regulation on
Innovation: A Panel Data Study." Working Paper. Vanderbilt Center for
Environmental Management Studies, Vanderbilt University.
Bird, R. Byron, Warren E. Stewart, and Edwin N. Lightfoot. 1960. Transport Phenomena.
New York: John Wiley.
355
Block, Jacob, Leonard E. Dolhert, Leonidas Petrakis, and Ronald P. Webster. 2000.
"Eliminating asbestos from fireproofing materials." Chemical Innovation, 30 (6), 21-
29.
Bordoni, Valter. 2000. "Technological change in the chlor-alkali industry - your e-mail dated
March 6, 2000." E-mail to the author. Proposal Manager, De Nora S.p.A., Milan, Italy,
March 30.
Borregaard. 1998. "Conversion of Borregaard Chlor-Alkali Plant." Information paper
submitted to European IPPC Bureau. Borregaard.
Bosterud, Ola. 2000. "Re: Chlor-Alkali Plant." E-mail to the author. Elkem, Bremanger,
Norway, February 28.
Bouveng, H. O. 1972. "Control of Mercury in Effluents from Chlorine Plants." Pure and
Applied Chemistry, 29, 75-91.
Brickman, Ronald, Sheila Jasanoff, and Thomas Ilgen. 1985. Controlling Chemicals: The
Politics of Regulation in Europe and the United States. Ithaca, NY: Cornell University
Press.
Brooks, J. David. 1988. "Membrane Technology: A Revolution in Chloralkali." in Fumio
Hine, W. Bruce Darlington, Robert E. White and Richard D. Varjian eds. Proceedings
of the Symposium on Electrochemical Engineering in the Chlor-Alkali and Chlorate
Industries. Pennington, NJ: Electrochemical Society.
Brooks, Kenneth (with Anne Watzman). 1986. "New entries vie in chlorine technology."
Chemical Week, 22-23.
Bruni, L. 1964. "Internal Economies of Scale with a Given Technique." Journal of Industrial
Economics, 12, 175-190.
Buchanan, James M. and Gordon Tullock. 1975. "Polluters' Profits and Political Response:
Direct Controls Versus Taxes." American Economic Review, 65 (1), 139-147.
356

Carraro, Carlo and Francois Leveque eds. 1999. Voluntary Approaches in Environmental
Policy. Dordrecht: Kluwer Academic Publishers.
Cederlund, Peo. 1999. "Question about Chlor-Alkali Plant -Svar." E-mail to the author. Base
Chemicals, Bohus, Sweden, December 20.
Chatterjee, S. N. 1984. "Design and Development of Electrochemical Chlor-Alkali Cells," in
Ralph E. White ed. Electrochemical Cell Design. New York: Plenum Press.
Chemical Week. 2001. "Krupp Uhde, De Nora Form Chlor-Alkali JV." Chemical Week, 163
(6), 5.
Chlorine Engineers Corp. 1998. "Chlorine Engineers Corp., Ltd." Chlorine Engineers Corp.
Chlorine Engineers Corp. 1999a. "CME Supply Record." Chlorine Engineers Corp.
Chlorine Engineers Corp. 1999b. "Diaphragm Cell Supply Record." Chlorine Engineers Corp.
Chlorine Engineers Corp. 1999c. "MBC Supply Record." Chlorine Engineers Corp.
Chlorine Engineers Corp. 2000. "Supply Record of CEC's IEM Electrolyzer." Chlorine
Engineers Corp.
Chlorine Institute. 1972. "Chlor-Alkali Producers outside North America." Chlorine Institute.
Chlorine Institute. 1995. "Guidelines: Asbestos Handling for the Chlor-Alkali Industry,
Edition 3." Chlorine Institute.
Chlorine Institute. 1997. "Chlor-Alkali Plants Outside North America." Chlorine Institute.
Chlorine Institute. 1998a. "Chlor-Alkali Plants Outside North America." Chlorine Institute.
Chlorine Institute. 1998b. "North American Chlor-Alkali Industry Plants and Production Data
Report - 1997." Chlorine Institute.
Chlorine Institute. 1999a. "Chlor-Alkali Plants Outside North America." Chlorine Institute.
Chlorine Institute. 1999b. "North American Chlor-Alkali Industry Plants and Production Data
Report - 1998." Chlorine Institute.
357
Christensen, Clayton M. 1997. The Innovator's Dilemma: When New Technologies Cause
Great Firms to Fail. Boston: Harvard Business School Press.
Clow, Archibald and Nan L. Clow. 1992. The Chemical Revolution: A Contribution to Social
Technology. Philadelphia: Gordon and Breach Science Publishers.
Coase, Ronald H. 1960. "The Problem of Social Cost." Journal of Law and Economics, 3, 1-
44.
Cohen, J. M. 1956. The Life of Ludwig Mond. London: Methuen.
Cole, Daniel H. and Peter Z. Grossman. 1999. "When is Command-and-Control Efficient?:
Institutions, Technology, and the Comparative Efficiency of Alternative Regulatory
Regimes for Environmental Protection." Wisconsin Law Review, 887-938.
Collins, J. H. and J. H. Entwisle. 1980. "The Development and Operation of High Current
Density Mercury Cells," in M. O. Coulter ed. Modern Chlor-Alkali Technology.
Chichester: Ellis Horwood.
Committee for the Promotion of Process Conversions in the Soda Industry. 1973. "Soda
Kogyo Seiho Tenkan Suishin Taisaku Iinkai Hokoku (Kinyu, Zeisei ni tsuite) (Report
of the Committee for the Promotion of Process Conversion in the Soda Industry (On
Finance and Tax))." Committee for the Promotion of Process Conversions in the Soda
Industry.
Convention for the Prevention of Marine Pollution from Land-Based Sources. 1974.
"Convention for the Prevention of Marine Pollution from Land-Based Sources (Paris
Convention)."
Convention for the Protection of the Marine Environment of the North-East Atlantic. 1992.
"Convention for the Protection of the Marine Environment of the North-East Atlantic
(OSPAR Convention)."
358

Coulter, M. O. ed. 1980. Modern Chlor-Alkali Technology (Proceedings of the International
Chlorine Symposium, London, June 1979). Chichester: Ellis Horwood.
Council for the Promotion of Countermeasures against Mercury Pollution. 1973. "Dai 3-kai
Suigin-to Osen Taisaku Suishin Kaigi Giji Yoshi (Abstract of the Note of the 3rd
Meeting of the Council for the Promotion of Countermeasures against Mercury
Pollution)." Council for the Promotion of Countermeasures against Mercury Pollution.
Council for the Promotion of Countermeasures against Mercury Pollution. 1977. "Dai 4-kai
Suigin-to Osen Taisaku Suishin Kaigi Kettei (Decisions of the 4th Meeting of the
Council for the Promotion of Countermeasures against Mercury Pollution)." Council
for the Promotion of Countermeasures against Mercury Pollution.
Council for the Promotion of Countermeasures against Mercury Pollution. 1979. "Dai 5-kai
Suigin-to Osen Taisaku Suishin Kaigi Kettei (Decisions of the 5th Meeting of the
Council for the Promotion of Countermeasures against Mercury Pollution)." Council
for the Promotion of Countermeasures against Mercury Pollution.
Council for the Promotion of Countermeasures against Mercury Pollution. 1980. "Dai 6-kai
Suigin-to Osen Taisaku Suishin Kaigi Kettei (Decisions of the 6th Meeting of the
Council for the Promotion of Countermeasures against Mercury Pollution)." Council
for the Promotion of Countermeasures against Mercury Pollution.
Council for the Promotion of Countermeasures against Mercury Pollution. 1981. "Dai 7-kai
Suigin-to Osen Taisaku Suishin Kaigi ni tsuite (On the 7th Meeting of the Council for
the Promotion of Countermeasures against Mercury Pollution)." Council for the
Promotion of Countermeasures against Mercury Pollution.
Council for the Promotion of Countermeasures against Mercury Pollution. 1982. "Dai 8-kai
Suigin-to Osen Taisaku Suishin Kaigi ni tsuite (On the 8th Meeting of the Council for
359

the Promotion of Countermeasures against Mercury Pollution)." Council for the
Promotion of Countermeasures against Mercury Pollution.
Council for the Promotion of Countermeasures against Mercury Pollution. 1983. "Dai 9-kai
Suigin-to Osen Taisaku Suishin Kaigi ni tsuite (On the 9th Meeting of the Council for
the Promotion of Countermeasures against Mercury Pollution)." Council for the
Promotion of Countermeasures against Mercury Pollution.
Council of the European Communities. 1973. "Environmental Action Programme." Official
Journal of the European Communities, C (112).
Council of the European Communities. 1976. "Council Directive76/464/EEC of 4 May 1976
on pollution caused by certain dangerous substances discharged into the aquatic
environment of the Community." Official Journal of the European Communities, L
(129), 23-.
Council of the European Communities. 1982. "Council Directive of 22 March 1982 on limit
values and quality objectives for mercury discharged by the chlor-alkali electrolysis
industry (82/176/EEC)." Official Journal of the European Communities, L (81), 29-34.
Council of the European Communities. 1983. "Council Directive of 26 September 1983 on
limit values and quality objectives for cadmium discharges (83/513/EEC)." Official
Journal of the European Communities, L (291).
Council of the European Communities. 1984a. "Council Directive of 8 March 1984 on limit
values and quality objectives for mercury discharges by sectors other than the chlor-
alkali electrolysis industry (84/156/EEC)." Official Journal of the European
Communities, L (74).
360

Council of the European Communities. 1984b. "Council Directive of 9 October 1984 on limit
values and quality objectives for discharges of hexachlorocyclohexane
(84/491/EEC)." Official Journal of the European Communities, L (274).
Cowan, Robin and Philip Gunby. 1996. "Sprayed to Death: Path Dependence, Lock-in and
Pest Control Strategies." Economic Journal, 106 (436), 521-542.
Cowan, Robin and Staffan Hulten. 1996. "Escaping Lock-in: The Case of the Electric
Vehicle." Technological Forecasting and Social Change, 53, 61-79.
Cowell, G. W. and C. Jackson. 1986. "Operating experience with the ICI FM21 Electrolyzer,"
in K. Wall ed. Modern Chlor-Alkali Technology, Volume 3. Chichester: Ellis Horwood.
Craig, Paul and Grainne de Burca. 1995. EC Law: Text, Cases, and Materials. Oxford:
Clarendon Press.
Curlin, Calvert L., Tilak V. Bommaraju, and Constance B. Hansson. 1991. "Alkali and
Chlorine Products: Chlorine and Sodium Hydroxide." Kirk-Othmer Encyclopedia of
Chemical Technology, Fourth ed., vol. 1. New York: John Wiley.
Curlin, Calvert L., Thomas F. Florkiewicz, Benno Luke, Hans-Rudolf Minz, and Peter
Schmittinger. 2000. "Comparison of the Processes," in Peter Schmittinger ed.
Chlorine: Principles and Industrial Practice. Weinheim: Wiley-VCH.
Currey, J. E. and J. W. Ahern. 1974. "Hooker's Membrane Cell at Reed Paper Ltd.'s Dryden,
Ontario Plant." in. Proceedings of the Nineteenth Meeting of Chlorine Plant Managers
Seminar. Washington, D.C.: Chlorine Institute.
Curry, R. W. ed. 1995. Modern Chlor-Alkali Technology, vol. 6. Cambridge, UK: Royal
Society of Chemistry.
David, Paul A. 1975. Technical Choice, Innovation and Economic Growth: Essays on
American and British Experience in the Nineteenth Century. Cambridge, UK:
Cambridge University Press.
361

David, Paul A. 1985. "Clio and the Economics of QWERTY." AEA Papers and Proceedings,
75 (2), 332-337.
De Flon, R. 1998. "Conversion of Borregaard Chlor-alkali Plant." mimeo.
De Nora. 1999. "Chlor-Alkali Plants Contracted by De Nora in the Latest Decades." De Nora.
Dean, Thomas J. and Robert L. Brown. 1995. "Pollution Regulation as a Barrier to New Firm
Entry: Initial Evidence and Implications for Future Research." Academy of
Management Journal, 38 (1), 288-303.
Derry, T. K. and Trevor I. Williams. 1960. A Short History of Technology: From The Earliest
Times to A.D. 1900. Oxford: Oxford University Press.
Dia Salt. 2001. "History." Dia Salt.
Diamond, Peter A. and Jerry A. Hausman. 1994. "Contingent Valuation: Is Some Number
Better than No Number?" Journal of Environmental Perspectives, 8 (4), 45-64.
Dingle, A. E. 1982. "The Monster Nuisance of All: Landowners, Alkali Manufacturers, and
Air Pollution, 1828-64." Economic History Review, 35, 529-548.
Donau Chemie AG. 2000. Fax message to the author. Bruckl, Austria, April 21.
Dorfner, Konrad. 1990. "Introduction to Ion Exchange and Ion Exchangers," in Konrad
Dorfner ed. Ion Exchangers. Berlin: Walter de Gruyter.
Downing, Paul B. and Lawrence J. White. 1986. "Innovation in Pollution Control." Journal of
Environmental Economics and Management, 13, 18-29.
Edwards, Perter. 1979. ""Nafion' Seihin no Genkyo to Shorai" (The Present and Future of
'Nafion' Products)." Soda to Enso, (2), 1-11.
Ehlers, Peter. 1990. "The History of the International North Sea Conferences." International
Journal of Coastal and Estuarine Law, 5 (1-3), 3-14.
Eltech Systems. 2001. "Membrane Cell Projects Licensed by ELTECH." Eltech Systems.
362

Engelhardt, Jr., H. Tristram, and Arthur L. Caplan eds. 1987. Scientific Controversies: Case
Studies in the Resolution and Closure of Disputes in Science and Technology.
Cambridge, UK: Cambridge University Press.
EniChem. 2001. "Profile - Our History." EniChem.
Euro Chlor. 1993. "Memorandum on Mercury Emissions to Atmosphere from Chloralkali
Cell Room Ventilation Air, 2nd edition." Euro Chlor.
Euro Chlor. 1996. "Chlor-Alkali Mercury Cells: Economics and the Environment, 2nd
Edition." Euro Chlor.
Euro Chlor. 1997. "Chlorine Industry Review 1996-1997." Euro Chlor.
Euro Chlor. 1998a. "Chlorine Industry Review 1997-1998." Euro Chlor.
Euro Chlor. 1998b. "Mercury Process for Making Chlorine." Euro Chlor.
Euro Chlor. 1998c. "Reduction of Mercury Emissions from the West European Chlor Alkali
Industry, 2nd Edition." Euro Chlor.
Euro Chlor. 1999a. "Chlorine Industry Review 1998-1999." Euro Chlor.
Euro Chlor. 1999b. "Decommissioning of Mercury Chlor-Alkali Plants, 2nd Edition." Euro
Chlor.
Euro Chlor. 1999c. "Voluntary Commitments by each Western European Chlor-Alkali
Producer (Mercury cells)." Euro Chlor.
European Chemical News. 1972. "Uhde details chlorine cell mercury recovery processes."
European Chemical News, 22.
European Chemical News. 1974. "Electrolytic Chlor-Alkali Plants in Japan Licensed by
Hooker." European Chemical News.
European Fertilizers Manufacturers' Association. 1995. "Best Available Techniques for
Pollution Prevention and Control in the European Fertilizer Industry - Booklet No.2 of
8: Production of Nitric Acid." European Fertilizers Manufacturers' Association.
363

European IPPC Bureau. 1999. "Integrated Pollution Prevention and Control (IPPC): Best
Available Techniques Reference Document on the Chlor-Alkali Industry (Draft)."
European IPPC Bureau.
European IPPC Bureau. 2000. "Integrated Pollution Prevention and Control (IPPC):
Reference Document on Best Available Techniques in the Chlor-Alkali
Manufacturing Industry." European IPPC Bureau.
European Patent Office. 2000. "Facts and Figures 2000." European Patent Office.
Expert Committee for Examination of the Closed System. 1977. "Suigin-ho Denkai Kojo no
Kurozudo-Shisutemu no Anzen-sei ni kansuru Chosa Kekka (Bassui) (Results of the
Examination of the Safety of the Closed System in Electrolytic Plants Based on the
Mercury Process (Excerpt))."
Expert Committee for Examination of the Closed System. 1979. "Suigin-ho Denkai Kojo no
Kurozudo-Shisutemu no Anzen-sei ni kansuru Hyoka Kekka (Yoshi) (Results of the
Evaluation of the Safety of Closed System in Electrolytic Plants Based on the Mercury
Process (Abstract))."
Expert Committee for Technical Evaluation of the Ion Exchange Membrane Process. 1977.
"Ion Kokanmaku-ho Gijutsu Hyoka Kekka (Results of Technical Evaluation of the Ion
Exchange Membrane Process)." Committee for the Promotion of Process Conversions
in the Soda Industry.
Expert Committee for Technical Evaluation of the Ion Exchange Membrane Process. 1979.
"Ion Kokanmaku-ho Gijutsu Hyoka Kekka (Results of the Technical Evaluation of the
Ion Exchange Membrane Process)." Committee for the Promotion of Process
Conversions in the Soda Industry.
Faita, Giuseppe and Marco Tenconi. 1999. Personal Interview. De Nora, Milan, September 28.
364

Farrell, Joseph. 1987. "Information and the Coase Theorem." Journal of Economic
Perspectives, 1 (2), 113-129.
Fischer, Carolyn, Ian W. H. Parry, and William A. Pizer. 1998. "Instrument Choice for
Environmental Protection When Technological Innovation is Endogenous."
Discussion Paper. 99-04. Resources for the Future.
Fishelson, Gideon. 1976. "Emission Control Policies under Uncertainty." Journal of
Environmental Economics and Management, 3, 189-197.
Flagan, Richard C. and John H. Seinfeld. 1988. Fundamentals of Air Pollution Engineering.
Englewood Cliffs, NJ: Prentice Hall.
Florkiewicz, Thomas F. 1998. "The Future of Diaphragm Cell Technology." in. Proceedings
of the 41st Chlor-Alkali Plant Operations Seminar. Washington, D.C.: Chlorine
Institute.
Foray, Dominique and Arnulf Grubler. 1990. "Morphological Analysis, Diffusion and Lock-
out of Technologies: Ferrous Casting in France and the FRG." Research Policy, 19,
535-550.
Foreman-Peck, James. 1996. "Technological Lock-In' and the Power Source for the Motor
Car." Discussion Paper in Economic and Social History. 7. University of Oxford.
Frankel, Marvin. 1955. "Obsolescence and Technological Change in a Maturing Economy."
American Economic Review, 45, 296-319.
Freeman, Christopher. 1982. The Economics of Industrial Innovation, Second ed. London:
Pinter.
Freeman, Christopher. 1994. "The economics of technical change." Cambridge Journal of
Economics, 18, 463-514.
365
Gardiner, William C. 1978. "Advances in Electrolytic Production of Industrial Chemicals
from 1952 to 1977." Journal of Electrochemical Society, 125 (1), 22C-29C.
Gates, Bruce C. 1992. Catalytic Chemistry. New York: John Wiley.
Goldwater, Leonard J. 1972. Mercury: A History of Quicksilver. Baltimore: York Press.
Gray, Wayne B. and Ronald J. Shadbegian. 1993. "Environmental Regulation and
Manufacturing Productivity at the Plant Level." Working Paper. 4321. National
Bureau of Economic Research.
Gray, Wayne B. and Ronald J. Shadbegian. 1995. "Pollution Abatement Costs, Regulation,
and Plant-Level Productivity." Working Paper. 4994. National Bureau of Economic
Research.
Gray, Wayne B. and Ronald J. Shadbegian. 1998. "Environmental Regulation, Investment
Timing, and Technological Change." Journal of Industrial Economics, XLVI (2),
235-256.
Green, Kenneth and Alan Irwin. 1996. "Clean Technologies," in Peter Groenewegen, Kurt
Fischer, Edith G. Jenkins and Johan Schot eds. The Greening of Industry Resource
Guide and Bibliography. Washington, D.C.: Island Press.
Griliches, Zvi. 1957. "Hybrid Corn: An Exploration in the Economics of Technological
Change." Econometrica, 25 (4), 501-522.
Griliches, Zvi. 1990. "Patent Statistics as Economic Indicators: A Survey." Journal of
Economic Literature, 28, 1661-1707.
Grot, Walther G. F. 1986. "NAFION as a Separator in Electrolytic Cells." in John W. Van
Zee, Ralph E. White, Kim Kinoshita and Harry S. Burney eds. Proceedings of the
Symposium on Diaphragms, Separators, and Ion-Exchange Membranes. Pennington,
NJ: Electrochemical Society.
366

Grubler, Arnulf. 1998. Technology and Global Change. Cambridge, UK: Cambridge
University Press.
Grupo Aragonesas. 1999. "Productos: Cloro / Sosa Caustica."
Haas, Peter M. 1993. "Protecting the Baltic and North Seas," in Peter M. Haas, Robert O.
Keohane and Marc A. Levy eds. Institutions for the Earth: Sources of Effective
International Environmental Protection. Cambridge, MA: MIT Press.
Haber, L. F. 1958. The Chemical Industry During the Nineteenth Century: A Study of the
Economic Aspect of Applied Chemistry in Europe and North America. Oxford:
Clarendon Press.
Haber, L. F. 1971. The Chemical Industry 1900-1930: International Growth and
Technological Change. Oxford: Clarendon Press.
Hahn, Robert W. 1990. "The political economy of environmental regulation: Towards a
unifying framework." Public Choice, 65, 21-47.
Haigh, Nigel. 1987. EEC Environmental Policy and Britain, 2nd ed. Essex: Longman.
Hain, Stefan. 1999. Personal interview. OSPAR Commission, London, October 11.
Hamada, Masao. 2000. "Chlor-Alkali Technology." E-mail to the author. Asahi Chemical
Industry, April 4.
Hanafusa, Fumiyuki. 1998. "Ion Kokanmaku-ho heno Seiho Tenkan no Omoide (Memory of
the Process Conversion to the Ion Exchange Membrane Process)," in Research Group
on the Japanese Salt Industry ed. Research on the Japanese Salt Industry. Tokyo:
Japan Salt Industry Association.
Hanemann, W. Michael. 1994. "Valuing the Environment Through Contingent Valuation."
Journal of Economic Perspectives, 8 (4), 19-43.
Hanmer, Rebecca. 1997. "Policy Approaches for Promoting Cleaner Production and Waste
Minimisation in OECD Member Countries." Cleaner Production and Waste
367

Minimisation in OECD and Dynamic Non-Member Economies. Paris: Organisation
for Economic Co-operation and Development.
Hardie, D. W. F. and J. Davidson Pratt. 1966. A History of the Modern British Chemical
Industry. Oxford: Pergamon Press.
Harris, Florence E. 1960. "Economics of the Salt Industry," in Dale W. Kaufmann ed. Sodium
Chloride: The Production and Properties of Salt and Brine. New York: Reinhold.
Heaton, Alan. 1996. "Research and Development," in Alan Heaton ed. An Introduction to
Industrial Chemistry, Third ed. Glasgow: Blackie Academic & Professional.
Henson, David. 1997. Letter to Sara Stenhammar, Swedish Environmental Protection Agency,
Industry and Ecocycles Department, Stockholm. February 13.
Herold, W. 2000. "Antwort: RE: Question about the Chlor-Alkali Plants." E-mail to the
author. ECI, Germany, January 28.
Hettige, Hemamala, Paul Martin, Manjula Singh, and David Wheeler. 1994. "IPPS: The
Industrial Pollution Projection System." Policy Research Working Paper. 1431. World
Bank.
Hocking, Martin B. 1998. Handbook of Chemical Technology and Pollution Control. San
Diego: Academic Press.
Hou, Te-Pang. 1942. Manufacture of Soda with Special Reference to the Ammonia Process: A
Practical Treatise. New York: Reinhold Publishing.
Houghton, J. T., Y. Ding, D. J. Griggs, M. Noguer, P. J. van der Linden, X. Dai, K. Maskell,
and C. A. Johnson eds. 2001. Climate Change 2001: The Scientific Basis. Cambridge,
UK: Cambridge University Press.
Houghton, J. T., L. G. Meira Filho, B. A. Callander, N. Harris, A. Kattenberg, and K. Maskell
eds. 1996. Climate Change 1995: The Science of Climate Change. Cambridge, UK:
Cambridge University Press.
368
Hutcheson, P., A. W. Pearson, and D. F. Ball. 1996. "Sources of technical innovation in the
network of companies providing chemical process plant and equipment." Research
Policy, 25, 25-41.
Iijima, Takashi. 1990a. "Wagakuni no Asechiren-ho Asetoarudehido Seizou Gijutsu no
Hatten, Sono 1 (The Development of Acetaldehyde Manufacturing Technology in
Japan, Part 1)." Kagaku-shi Kenkyu, 17, 61-79.
Iijima, Takashi. 1990b. "Wagakuni no Asechiren-ho Asetoarudehido Seizou Gijutsu no
Hatten, Sono 3 (The Development of Acetaldehyde Manufacturing Technology in
Japan, Part 3)." Kagaku-shi Kenkyu, 17, 151-172.
Ikeda, Minoru, Takashi Tokutomi, and Yasutaka Nakajima. 1998. "Methyl Methacrylate," in
Society of Chemical Engineers of Japan ed. Kagaku Purosesu: Kiso kara Gijutsu
Kaihatsu made (Chemical Processes: From Fundamentals to Technological
Developments). Tokyo: Tokyo Kagaku Dojin.
Imperial Chemical Industries. 1999. "Supply Record." Imperial Chemical Industries.
Industrial Structure Council. 1972. "Report of the Soda Group of the Chemical Industry
Section." Industrial Structure Council.
Information Centre for Environmental Licensing. 1998. "Dutch Notes on BAT for the Chlor-
Alkali Industry." Final Report. Dutch Ministry of Housing, Spatial Planning and the
Environment, Directorate for Air and Energy, Department of Industry; and Dutch
Ministry of Transport, Public Works and Water Management, Institute for Inland
Water Management and Waste Water Treatment RIZA.
Ingleby, Steve, R. W. Curry, and Cliff Broom. 1999. Personal interview. ICI, Runcorn,
October 8.
International Energy Agency. 1992. "Electricity Information 1992." Organisation for
Economic Co-operation and Development / International Energy Agency.
369

International Energy Agency. 1993. "Electricity Information 1992." Organisation for
Economic Co-operation and Development / International Energy Agency.
International Energy Agency. 1999. "Electricity Information 1998." Organisation for
Economic Co-operation and Development / International Energy Agency.
Irukayama, Katsuro. 1977. "Countermeasures and Unresolved Problems," in Tadao Tsubaki
and Katsuro Irukayama eds. Minamata Disease: Methylmercury Poisoning in
Minamata and Niigata, Japan. Tokyo: Kodansha.
Jackson, C. ed. 1983. Modern Chlor-Alkali Technology, vol. 2. Chichester: Ellis Horwood.
Jackson, C., B. A. Cooke, and B. J. Woodhall. 1971. "Diaphragms and Electrolytes," in A. T.
Kuhn ed. Industrial Electrochemical Processes. Amsterdam: Elsevier Publishing.
Jackson, Colin and Stephen F. Kelham. 1984. "Developments and trends in the chlor-alkali
industry." Chemistry and Industry, 397-402.
Jackson, T. 1994. "Principles of Clean Production - developing an operational approach to the
preventive paradigm," in T. Jackson ed. Clean Production Strategies: Developing
Preventive Environmental Management in the Industrial Economy. Boca Raton, FL:
Lewis Publishers.
Jaffe, Adam B., Richard G. Newell, and Robert N. Stavins. 1999. "Energy-Efficient
Technologies and Climate Change Policies: Issues and Evidence." Climate Issue Brief.
19. Resources for the Future.
Jaffe, Adam B. and Karen Palmer. 1997. "Environmental Regulation and Innovation: A Panel
Data Study." Review of Economics and Statistics, 79 (4), 610-619.
Jaffe, Adam B., Steven R. Peterson, Paul R. Portney, and Robert N. Stavins. 1995.
"Environmental Regulation and the Competitiveness of U.S. Manufacturing: What
Does the Evidence Tell Us?" Journal of Economic Literature, 33, 132-163.
Japan Salt Industry Association. 2001. "The Japanese Salt." Japan Salt Industry Association.
370

Japan Soda Industry Association. 1952. Zoku Nihon Soda Kogyo-shi (A Sequel to the History
of the Japanese Soda Industry). Tokyo: Japan Soda Industry Association.
Japan Soda Industry Association. 1973a. "Denkai Soda Kogyo no Jitsujo (Real Situation of
the Electrolytic Soda Industry)." Statement. Japan Soda Industry Association.
Japan Soda Industry Association. 1973b. "Request to the Minister of the Environmental
Agency Regarding the Real Situation of the Soda Industry." Japan Soda Industry
Association.
Japan Soda Industry Association. 1974a. "Seiho Tenkan ni kansuru Sho-Mondai ni tsuite
(Various Issues on the Process Conversion)." Soda to Enso, (2), 1-13.
Japan Soda Industry Association. 1974b. "Seiho Tenkan no Sho-Mondai ni tsuite (On Various
Issues Related to the Process Conversion)." Soda to Enso, (10), 1-8.
Japan Soda Industry Association. 1974c. "Soda Kogyo Seiho Tenkan Setsubi Shikin Kakuho
ni kansuru Chinjo (Request Regarding Financial Resources for the Process
Conversion in the Soda Industry)." Japan Soda Industry Association.
Japan Soda Industry Association. 1975. Soda Handobukku (Soda Handbook). Tokyo: Japan
Soda Industry Association.
Japan Soda Industry Association. 1976. "Tokkyo kara mita Shokuen Denkai ni okeru Kinzoku
Yokyoku/Ion Kokanmaku-ho Kanren Gijutsu no Genjo, Bessatsu 2: Tokkyo Gaiyo
Ichiran-hyo (Current Situation of Technologies Related to the Metal Electrode and the
Ion Exchange Membrane Process for Brine Electrolysis In Terms of Patents,
Supplement Volume 2: Lists of Patent Abstracts)." Technology Examination
Document. 351. Japan Soda Industry Association.
Japan Soda Industry Association. 1977. "Shokuen Denkai ni okeru Kinzoku Yokyoku/Ion
Kokanmaku-ho Kanren Tokkyo no Genjo, Tsuiroku-ban I: Showa 57.7-12
Kokoku/Kokai-bun (Current Situation of Patents Related to the Metal Electrode and
371

the Ion Exchange Membrane Process for Brine Electrolysis, Sequel Edition I:
Publications from July 1976 to December 1976)." Technology Examination Document.
361. Japan Soda Industry Association.
Japan Soda Industry Association. 1978a. "Shokuen Denkai ni okeru Ion Kokanmaku-ho
narabini Kakumaku-ho Kanren Tokkyo no Genjo, Tsuiroku-ban III: Showa 52.1-12
Kokoku, Kokai-bun (Current Situation of Patents Related to the Ion Exchange
Membrane Process and the Diaphragm Process for Brine Electrolysis, Sequel Edition
III: Publications from January 1977 to December 1977)." Technology Examination
Document. 383. Japan Soda Industry Association.
Japan Soda Industry Association. 1978b. "Shokuen Denkai ni okeru Kakumaku-ho Kanren
Tokkyo no Genjo, Tsuiroku-ban II: Showa 30-51 nen Kokoku/Kokai-bun (Current
Situation of Patents Related to the Diaphragm Process for Brine Electrolysis, Sequel
Edition II: Publications from 1955 to 1976)." Technology Examination Document.
373. Japan Soda Industry Association.
Japan Soda Industry Association. 1979a. "Dai-2-ki Seiho Tenkan Shisaku ni taisuru Yobo
(Request Regarding Policies for the Second Phase of the Process Conversion)." Japan
Soda Industry Association.
Japan Soda Industry Association. 1979b. "Shokuen Denkai ni okeru Ion Kokanmaku-ho
narabini Kakumaku-ho Kanren Tokkyo no Genjo, Tsuiroku-ban V: Showa 53.1-12
Kokoku, Kokai-bun (Current Situation of Patents Related to the Ion Exchange
Membrane Process and the Diaphragm Process for Brine Electrolysis, Sequel Edition
V: Publications from January 1978 to December 1978)." Technology Examination
Document. 397. Japan Soda Industry Association.
Japan Soda Industry Association. 1980a. "Dai-2-ki Seiho Tenkan Mondai no Shuhen (Around
the Issue of the Second Phase of the Process Conversion)." Soda to Enso, (8), 17-29.
372

Japan Soda Industry Association. 1980b. "Dai-2-ki Seiho Tenkan ni kansuru Yobosho
(Request Regarding the Second Phase of the Process Conversion)." Japan Soda
Industry Association.
Japan Soda Industry Association. 1982. Nihon Soda Kogyo Hyakunen-shi (Centennial History
of the Japanese Soda Industry). Tokyo: Japan Soda Industry Association.
Japan Soda Industry Association. 1985. "Soda Kogyo Kankei no Kinyu oyobi Zeisei Sochi ni
tsuite (On the Financial and Tax Measures Related to the Soda Industry)." Soda to
Enso, (1), 20-25.
Japan Soda Industry Association. 1988. "Denryoku (Electric Power)." Soda to Enso, (5), 46-
55.
Japan Soda Industry Association. 1991a. "Shokuen Denkai ni okeru Ion Kokanmaku-ho
Kanren Tokkyo no Genjo, Tsuiroku-ban VI: Showa 54 - 63 nen Kokoku/Kokai-bun,
Dai 1 Bunsatsu: Denkai Hoho oyobi Kanren Gijutsu, C-1 Sotai Kozo (Current
Situation of Patents Related to the Ion Exchange Membrane Process for Brine
Electrolysis, Sequel Edition VI: Publications from 1979 to 1988, Volume 1:
Electrolytic Methods and Related Technologies, C-1 Cell Structure)." Technology
Examination Document. 558. Japan Soda Industry Association.
Japan Soda Industry Association. 1991b. "Shokuen Denkai ni okeru Ion Kokanmaku-ho
Kanren Tokkyo no Genjo, Tsuiroku-ban VI: Showa 54 - 63 nen Kokoku/Kokai-bun,
Dai 2 Bunsatsu: Denkai Hoho oyobi Kanren Gijutsu, C-2 Denkai Hoho, C-3 Sonota
(Current Situation of Patents Related to the Ion Exchange Membrane Process for
Brine Electrolysis, Sequel Edition VI: Publications from 1979 to 1988, Volume 2:
Electrolytic Methods and Related Technologies, C-2 Electrolytic Methods, C-3
Other)." Technology Examination Document. 559. Japan Soda Industry Association.
373

Japan Soda Industry Association. 1992a. "Shokuen Denkai ni okeru Ion Kokanmaku-ho
Kanren Tokkyo no Genjo, Tsuiroku-ban VI: Showa 54 - 63 nen Kokoku/Kokai-bun,
Dai 3 Bunsatsu: Ion Kokanmaku, M (Current Situation of Patents Related to the Ion
Exchange Membrane Process for Brine Electrolysis, Sequel Edition VI: Publications
from 1979 to 1988, Volume 3: Ion Exchange Membranes, M)." Technology
Examination Document. 572. Japan Soda Industry Association.
Japan Soda Industry Association. 1992b. "Shokuen Denkai ni okeru Ion Kokanmaku-ho
Kanren Tokkyo no Genjo, Tsuiroku-ban VI: Showa 54 - 63 nen Kokoku/Kokai-bun,
Dai 4 Bunsatsu: Denkyoku (E), Ensui Seisei (B), Sono-ta (T) oyobi Kakumaku (D)
(Current Situation of Patents Related to the Ion Exchange Membrane Process for
Brine Electrolysis, Sequel Edition VI: Publications from 1979 to 1988, Volume 4:
Electrodes (E), Brine Purification (B), Other (T), and Diaphragms (D))." Technology
Examination Document. 573. Japan Soda Industry Association.
Japan Soda Industry Association. 1995. "Soda Now '95: Nihon no Soda Kogyo (Japan's Soda
Industry)." Japan Soda Industry Association.
Japan Soda Industry Association. 1998a. "Denryoku (Electric Power)." Soda to Enso, (12),
42-48.
Japan Soda Industry Association. 1998b. Soda Handobukku 1998 (Soda Handbook 1998).
Tokyo: Japan Soda Industry Association.
Japan Soda Industry Association. 1999a. "Soda Kogyo no Genjo (Current Situation of the
Soda Industry)." Japan Soda Industry Association.
Japan Soda Industry Association. 1999b. "Soda Now: Nihon no Soda Kogyo (Japan's Soda
Industry)." Japan Soda Industry Association.
Japanese Ministry of International Trade and Industry. 1973. "Soda Kogyo ni okeru Suigin-ho
kara Kakumaku-ho eno Tenkan Kijun (Criteria for the Conversion from the Mercury
374

Process to the Diaphragm Process in the Soda Industry)." Ministry of International
Trade and Industry.
Japanese Ministry of International Trade and Industry. 1974. "Suigin-ho Denkai Soda Setsubi
oyobi Suigin no Yushutsu ni tsuite (On Exporting Mercury Process Facilities for
Electrolytic Soda and Mercury)." Division of Basic Chemicals, Bureau of Basic
Industries, Ministry of International Trade and Industry.
Japanese Ministry of International Trade and Industry. 1975a. "Kasei Soda Seiho Tenkan no
Genjo to Kongo no Susume-kata ni tsuite (On the Current Situation of the Caustic
Soda Process Conversion and the Procedure in the Future)." Ministry of International
Trade and Industry.
Japanese Ministry of International Trade and Industry. 1975b. "Kasei Soda Yuzu Jisshi Yoko
(Outline for the Implementation of Barter Trades of Caustic Soda)." Division of Basic
Chemicals, Bureau of Basic Industries, Ministry of International Trade and Industry.
Japanese Ministry of International Trade and Industry. 1979. "Kasei Soda Kogyo Seiho
Tenkan Kankei Shiryo (Documents on Process Conversions in the Caustic Soda
Industry)." Division of Basic Chemicals, Bureau of Basic Industries, Ministry of
International Trade and Industry.
Japanese Ministry of International Trade and Industry. 1985. "Kasei Soda Kogyo no Genjo
(Current Situation of the Caustic Soda Industry)." Division of Basic Chemicals,
Bureau of Basic Industries, Ministry of International Trade and Industry.
Japanese Ministry of International Trade and Industry. 1989. "Soda Kogyo no Genjo to Kadai
(Current Situation and Problems in the Soda Industry)." Division of Basic Chemicals,
Bureau of Basic Industries, Ministry of International Trade and Industry.
375

Japanese Ministry of International Trade and Industry. 1990. "Soda Kogyo no Genjo (Current
Situation of Soda Industry)." Division of Basic Chemicals, Bureau of Basic Industries,
Ministry of International Trade and Industry.
Jensen, S. and A. Jernelov. 1969. "Biological Methylation of Mercury in Aquatic Organisms."
Nature, 223, 753.
Juda, W. and W. A. McRae. 1950. "Coherent ion exchange gels and membranes." Journal of
American Chemical Society, 72, 1044.
Jung, Chulho, Kerry Krutilla, and Roy Boyd. 1996. "Incentives for Advanced Pollution
Abatement Technology at the Industry Level: An Evaluation of Policy Alternatives."
Journal of Environmental Economics and Management, 30, 95-111.
Kanto Denka Kogyo. 1998. Kanto Denka Kogyo Rokuju-Nenshi (Sixty-Year History of Kanto
Denka Kogyo). Toyo: Kanto Denka Kogyo.
Karshenas, Massound and Paul Stoneman. 1995. "Technological Diffusion," in Paul
Stoneman ed. Handbook of the Economics of Innovation and Technological Change.
Oxford: Blackwell.
Katsumura, Tatsuo. 1979. "Soda Seiho Tenkan o Isoguna (Do not rush into process
conversions for the soda production)." Asahi Shinbun, July 30.
Kawate, Hideo, Kazuo Tsuzura, and Hiroshi Shimizu. 1990. "Ion Exchange Membranes," in
Konrad Dorfner ed. Ion Exchangers. Berlin: Walter de Gruyter.
Kelham, Steve. 1996. "Chlor-alkali Products," in Alan Heaton ed. An Introduction to
Industrial Chemistry, Third ed. Glasgow: Blackie Academic & Professional.
Kemp, Rene. 1995. "Environmental Policy and Technical Change: A Comparison of the
Technological Impact of Policy Instruments." Ph.D. Dissertation. Department of
Economics and Business Administration, University of Maastricht.
376

Kemp, Rene. 1998. "The Diffusion of Biological Waste-Water Treatment Plants in the Dutch
Food and Beverage Industry." Environmental and Resource Economics, 12, 113-136.
Keohane, Nathaniel O., Richard L. Revesz, and Robert N. Stavins. 1998. "The Choice of
Regulatory Instruments in Environmental Policy." Harvard Environmental Law
Review, 22, 313-367.
Kircher, Morton S. 1962. "Electrolysis of Brines in Diaphragm Cells," in J. S. Sconce ed.
Chlorine: Its Manufacture, Properties and Uses. New York: Robert E. Krieger.
Kleijn, Rene, Arnold Tukker, and Ester van der Voet. 1997. "Chlorine in the Netherlands,
Part I: An Overview." Journal of Industrial Ecology, 1 (1), 95-116.
Kline, Stephen J. and Nathan Rosenberg. 1986. "An overview of innovation," in Ralph
Landau and Nathan Rosenberg eds. The Positive Sum Strategy. Washington, D.C.:
National Academy Press.
Koch, T. A., K. R. Krause, L. E. Manzer, M. Mehdizadeh, J. M. Odom, and S. K. Sengupta.
1996. "Environmental Challenges Facing the Chemical Industry." New Journal of
Chemistry, 20, 163-173.
Kopp, Raymond J., Paul Portney, and Dianne E. DeWitt. 1990. "International Comparison of
Environmental Regulation." Discussion Paper. QE90-22-REV. Resources for the
Future.
Koyama, Jiro. 1972. "Kaigai Denkai Soda Kogyo Jittai Chosa-dan Hokoku-sho (Report of the
Fact-Finding Mission on Foreign Electrolytic Chlor-Alkali Industries)."
Kramer, W. and B. Luke. 1990. "Hoechst-Uhde Single Element Membrane Electrolyzer:
Concept-Experiences-Applications," in N. M. Prout and J. S. Moorhouse eds. Modern
Chlor-Alkali Technology, vol. 4. London: Elsevier Applied Science.
Krebs Swiss. 1997. "Chlorine Production: PT. Industri Soda Employs Asahi Glass's Bipolar
Membrane Cell Technology." News Release. Krebs Swiss.
377

Krebs Swiss. 2001. "Reference List." Krebs Swiss.
Krupp Uhde. 2001. "Krupp Uhde - a company overview." Krupp Uhde.
Krupp-Uhde. 1998. "References: Membrane-cell electrolysis plants." Krupp Uhde.
Kuhn, A. T. 1971. "The Chlor-Alkali Industry," in A. T. Kuhn ed. Industrial Electrochemical
Processes. Amsterdam: Elsevier.
Lanjouw, Jean Olson and Ashoka Mody. 1996. "Innovation and the International Diffusion of
Environmentally Responsive Technology." Research Policy, 25, 549-571.
Leonard, H. Jeffrey. 1988. Pollution and the Struggle for the World Product: Multinational
Corporations, Environment, and International Comparative Advantage. Cambridge,
UK: Cambridge University Press.
Levenspiel, Octave. 1962. Chemical Reaction Engineering. New York: Wiley.
Levin, Richard C., Alvin K. Klevorick, Richard R. Nelson, and Sidney G. Winter. 1987.
"Appropriating the Returns from Industrial Research and Development." Brookings
Papers on Economic Activity, 3, 783-820.
Levinson, Arik. 1996. "Environmental regulations and manufacturers' location choices:
Evidence from the Census of Manufacturers." Journal of Public Economics, 62, 5-29.
Liebowitz, S. J. and Stephen E. Margolis. 1990. "The Fable of the Keys." Journal of Law and
Economics, 33 (April), 1-25.
Liebowitz, S. J. and Stephen E. Margolis. 1995. "Path Dependence, Lock-in, and History."
Journal of Law, Economics, & Organization, 11 (1), 205-226.
Lindley, Andrew A. 1997. "An Economic and Environmental Analysis of the Chlor-Alkali
Production Process: Mercury Cells and Alternative Technologies." Final Report
prepared for the European Commission (DG III C-4, Chemicals, plastics, rubber).
378

Lott, Brian. 1995. "Practical Experiences on the Conversion of Mercury Cells to Membrane
Technology," in R. W. Curry ed. Modern Chlor-Alkali Technology, vol. 6. London:
Society of Chemical Industry.
Low, Patrick and Alexander Yeats. 1992. "Do Dirty Industries Migrate?," in Patrick Low ed.
International Trade and the Environment. Washington, D.C.: World Bank.
Luke, Benno. 1989. "Die spezifischen Kosten sinken." Chemische Industrie, 8, 56-60.
Luke, Benno. 2000. "Membrane Process," in Peter Schmittinger ed. Chlorine: Principles and
Industrial Practice. Weinheim, Germany: Wiley-VCH.
Luke, Benno and Roland Beckmann. 1999. Personal interview. Krupp-Uhde, Dortmund, 31
August.
MacMullin, R. B. 1962. "Electrolysis of Brines in Mercury Cells," in J. S. Sconce ed.
Chlorine: Its Manufacture, Properties and Uses. Litton Educational Pub.
MacMullin, Robert B. 1947. "A CI Report on Diaphragm vs. Amalgam Cells for Chlorine-
Caustic Production." Chemical Industries, (July), 41-50.
Magat, Wesley A. 1978. "Pollution Control and Technological Advance: A Dynamic Model
of the Firm." Journal of Environmental Economics and Management, 5, 1-25.
Manzer, L. E. and V. N. M. Rao. 1993. "Catalytic Synthesis of Chlorofluorocarbon
Alternatives." Advances in Catalysis, 39, 329-350.
Marin, Alan. 1991. "Firm Incentives to Promote Technological Change in Pollution Control:
Comment." Journal of Environmental Economics and Management, 21, 297-300.
Martin, R. P. and G. J. Martens. 1996. "IUPAC White Book on Chlorine: A Contribution to
the Debate on the Effect of Chlorine and Chlorine-containing Compounds on the
Environment." Pure and Applied Chemistry, 68 (9).
Matsuura, Shunji. 2002. Personal Interview. Tokuyama, Tokyo, February 19.
379

McKelvey, Maureen. 1996. Evolutionary Innovations: The Business of Biotechnology.
Oxford: Oxford University Press.
McMeekin, Andrew and Ken Green. 1995. "Defining Clean Technology." Futures, 1.
McRae, W. A. 1974. "Ion Kokan-maku Chlor-Alkali Denkai-so no Genjo (Current Situation
of Chlor-Alkali Cells with Ion Exchange Membranes)." Soda to Enso, (3), 10-14.
Means, R. E. and T. R. Beck. 1984. "A techno/economic review of chlor-alkali technology."
Chemical Engineering, 91 (22), 46-51.
Mellish, S. F. 1977. "Membrane Cells - Where Are We Now?," in Society of Chemical
Industry ed. Diaphragm cells for chlorine production. London: Society of Chemical
Industry.
Mendelsohn, Robert. 1984. "Endogenous Technical Change and Environmental Regulation."
Journal of Environmental Economics and Management, 11, 202-207.
Meyer-Thurow, Georg. 1982. "The Industrialization of Invention: A Case Study From the
German Chemical Industry." Isis, 73, 363-381.
Milliman, Scott R. and Raymond Prince. 1989. "Firm Incentives to Promote Technological
Change in Pollution Control." Journal of Environmental Economics and Management,
17, 247-265.
Milliman, Scott R. and Raymond Prince. 1992. "Firm Incentives to Promote Technological
Change in Polluting Control: Reply." Journal of Environmental Economics and
Management, 22, 292-296.
Mitsubishi Chemical. 2001. "Enkaku (Chronology)." Mitsubishi Chemical.
Mitsubishi Chemical MKV. 2001. "Enkaku (Chronology)." Mitsubishi Chemical MKV.
Mitsubishi Gas Chemical. 2001. "Rekishi - Kojo to Seihin no Enkaku (History - Chronology
of the Plants and Products)." Mitsubishi Gas Chemical.
380

Mizsey, Peter. 1994. "Waste Reduction in the Chemical Industry: A Two Level Problem."
Journal of Hazardous Materials, 37, 1-13.
Morris, Gregory J. 1990. "Improving Membrane Cell Operation," in N. M. Prout and J. S.
Moorhouse eds. Modern Chlor-Alkali Technology, vol. 4. London: Elsevier Applied
Science.
Motani, K. and T. Sata. 1980. "The Tokuyama Soda membrane - caustic-chlorine process," in
M. O. Coulter ed. Modern Chlor-Alkali Technology. Chichester: Ellis Horwood.
Motani, Kensuke. 1982. "Tokuyama Soda Ion Kokanmaku-ho Shokuen Denkai Purosesu ni
tsuite (On the Ion Exchange Membrane Process for Brine Electrolysis of Tokuyama
Soda)." in. Proceedings of the 8th Seminar on the Current Situation of the Ion
Exchange Membrane Process. Association for the Promotion of Installations of the
Diaphragm Process Facilities.
Muller, W. D. 1993. "General Technology Overview." in. Proceedings of the Third Euro
Chlor Technical Seminar: Responsible Care in Practice. Paris: Euro Chlor.
Murray, R. L. 1949. "The Chlor Alkali Industry in the United States." Industrial and
Engineering Chemistry, 41 (10), 2155-2164.
Nagamura, Masao, Hiroshi Ukihashi, and Osamu Shiragami. 1980. "Chlor-alkali process with
Flemion," in M. O. Coulter ed. Modern Chlor-Alkali Technology. Chichester: Ellis
Horwood.
Nagamura, Masao, Hiroshi Ukihashi, and Osamu Shiragami. 1983. "AZEC System - New
Ion-exchange Membrane Chlor-alkali Process," in C. Jackson ed. Modern Chlor-
Alkali Technology, vol. 2. Chichester: Ellis Horwood.
Nakanishi, Junko. 1993. "Gijutsu-ya no Kankyo Seisaku Iron: Nihon no Kankyo Tokusei (A
Different View on Environmental Policy of a Technologist)." Sekai, (1), 312-321.
381
Nakao, M. and H. Miyake. 1995. "Advanced Cell Operation with Flemion Membranes," in R.
W. Curry ed. Modern Chlor-Alkali Technology, vol. 6. Cambridge, UK: Royal Society
of Chemistry.
Nakao, M., T. Shimohira, and Y. Takechi. 1998. "High Performance Operation with Flemion
Membranes and the AZEC-B1 Electrolyzer," in S. Sealey ed. Modern Chlor-Alkali
Technology, vol. 7. Cambridge, UK: Royal Society of Chemistry.
Nelkin, Dorothy ed. 1992. Controversy: Politics of Technical Decisions, Third ed. Newbury
Park, CA: SAGE.
Nihon Keizai Shinbun. 1982. "Nissan Kagaku ga Genryo Seisan Itaku - Soda/Enso ha Asahi
Garasu, Nisanka Echiren ha Toyo Soda ni (Nissan Chemical Transfer Raw Material
Production - Soda and Chlorine to Asahi Glass, Ethylene Dichloride to Toyo Soda)."
Nihon Keizai Shinbun, March 27.
Nikkei Kinyu Shinbun. 1987. "Nissoda, 3-nen-buri Keijo Kuroji ni - Gorika to Shikyo Kaifuku
ga Kiyo (Nippon Soda, Operating Profit First in 3 Years - Due to Rationalization and
Strong Market Demand)." Nikkei Kinyu Shinbun, December 8.
Nikkei Sangyo Shinbun. 1975a. "Shoden Kawasaki Kojo no Kakumaku-ho niyoru Kasei Soda
Seizo Setsubi Kansei - Jisha Gijutsu de Seisan Kaishi (Showa Denko Completes
Construction of Caustic Soda Production Facilities with Diaphragm Process - Start of
Production with Own Technology)." Nikkei Sangyo Shinbun, June 19.
Nikkei Sangyo Shinbun. 1975b. "Tsurumi Soda, Soda Setsubi wo Isshin, Noryoku 20% Appu
(Tsurumi Soda Renews Soda Facilities, 20% Increase in Capacity)." Nikkei Sangyo
Shinbun, December 2.
Nikkei Sangyo Shinbun. 1976. "Shoden/Hitachi-zo, Kasei Soda no Asubesuto Kakumaku-ho
de Makikaeshi (Showa Denko and Hitachi Engineering and Shipbuilding Return with
382

Asbestos Diaphragm Process to Caustic Soda Production)." Nikkei Sangyo Shinbun,
May 13.
Nippon Paper Industries. 2001. "Nippon Seishi (kabu) Shareki (Corporate History of Nippon
Paper Industries)." Nippon Paper Industries.
Nippon Soda. 2001. "Enkaku (Chronology)." Nippon Soda.
Nishimura, Hajime and Tatsuaki Okamura. 2001. Minamata-byo no Kagaku (The Science of
the Minamata Disease). Tokyo: Nihon Hyoron-sha.
Nishino, Hiroshi. 1998. "Sakusan (Acetic Acid)," in Japan Society of Chemical Engineers ed.
Kagaku Purosesu: Kiso kara Gijutsu Kaihatsu made (Chemical Processes: From
Fundamentals to Technological Developments). Tokyo: Tokyo Kagaku Dojin.
Nriagu, Jerome. 1994. "Industrial Activity and Metal Emissions," in R. Socolow, C. Andrews,
F. Berkhout and V. Thomas eds. Industrial Ecology and Global Change. Cambridge,
UK: Cambridge University Press.
Nriagu, Jerome O. 1979. "Global inventory of natural and anthropogenic emissions of trace
metals to the atmosphere." Nature, 279, 409-411.
O'Brien, Denis. 2001. Fax message to the author. Technical & QA Manager, Micro-Bio,
Fermoy, Ireland, January 29.
Occupational Safety and Health Administration. 1993. "Better Production Against Asbestos
in the Workplace." OSHA Fact Sheet. 93-06. U.S. Department of Labor.
Ogburn, William F. and William Jaffe. 1929. The Economic Development of Post-War
France: A Survey of Production. New York: Columbia University Press.
Oh-hama, Hiroshi, Masato Hamada, and Mitsuo Yoshida. 1998. Personal interview. Asahi
Chemical Industries, Tokyo, June 12.
383
Organisation for Economic Co-operation and Development. 1974. "Mercury and the
Environment: Studies of Mercury Use, Emission, Biological Impact and Control."
Organisation for Economic Co-operation and Development.
Organisation for Economic Co-operation and Development. 1981. "Measures to Reduce All
Man-Made Emissions of Mercury to the Environment: Summary Report of
Information Exchange for the Years 1973, 1974, 1975 and 1976." Organisation for
Economic Co-operation and Development.
Organisation for Economic Co-operation and Development. 1994. "Managing the
Environment: The Role of Economic Instruments." Organisation for Economic Co-
operation and Development.
Organisation for Economic Co-operation and Development. 1997. "Cleaner Production and
Waste Minimization in OECD and Dynamic Non-Member Economies." Organisation
for Economic Co-operation and Development.
Orr, Lloyd. 1976. "Incentive for Innovation as the Basis for Effluent Charge." American
Economic Review, 66 (2), 441-447.
Oslo and Paris Commissions. 1984. "The First Decade: International Co-operation in
Protecting Our Marine Environment." Oslo and Paris Commissions.
Oslo and Paris Commissions. 1997. "Report on Mercury Losses from the Chlor-Alkali
Industry (1982-1995)." Oslo and Paris Commissions.
OSPAR Commission. 1999a. "Assessment of Implementation of PARCOM Decision 90/3 on
Reducing Atmospheric Emissions from Existing Chlor-Alkali Plants." Implementation
Report Dec. 90/3. OSPAR Commission.
OSPAR Commission. 1999b. "Note of Proceedings of the OSPAR Workshop on the Chlor-
Alkali Industry, Madrid, 27-29 September." OSPAR Commission.
384

OSPAR Commission. 1999c. "Report on Mercury Losses from the Chlor-Alkali Industry
(1982-1997)." OSPAR Commission.
OSPAR Commission. 2001. "Mercury Losses from the Chlor-Alkali Industry in 1999."
OSPAR Commission.
Palmer, Karen, Wallace E. Oates, and Paul R. Portney. 1995. "Tightening Environmental
Standards: The Benefit-Cost or the No-Cost Paradigm?" Journal of Economic
Perspectives, 9 (4), 119-132.
Paris Commission. 1977. "Summary Record of the Fifth Meeting of the Technical Working
Group, Stockholm, 21-23 September." Paris Commission.
Paris Commission. 1978a. "Environmental Quality Objectives and Uniform Emission
Standards Approaches in Relation to Mercury." Report presented at the First Meeting
of the Commission, Convention for the Prevention of Marine Pollution from Land-
Based Sources, The Hague, 27-30 November. Paris Commission.
Paris Commission. 1978b. "No New Waste Brine Plants be Built." PARCOM
Recommendation 78/1, The Hague. OSPAR Commission.
Paris Commission. 1980a. "Adoption of a 'standstill principle' for mercury concentrations in
water." Agreement 1980-03, Stockholm. OSPAR Commission.
Paris Commission. 1980b. "Environmental Quality Standard for Mercury in Organisms."
PARCOM Decision 80/1, Stockholm. OSPAR Commission.
Paris Commission. 1980c. "Limit Values for Mercury Emissions in Water from Existing and
New Brine Recirculation Chloralkali Plants (exit of the purification plant)." PARCOM
Decision 80/2, Stockholm. OSPAR Commission.
Paris Commission. 1981a. "Limit Values for Existing Brine Recirculation Chlor-Alkali Plants
(exit of the factory site)." PARCOM Decision 81/2, Brussels. OSPAR Commission.
385

Paris Commission. 1981b. "Limit Values for Existing Waste Brine Chlor-Alkali Plants."
PARCOM Decision 81/1, Brussels. OSPAR Commission.
Paris Commission. 1982. "New Chloralkali Plants using Mercury Cells." PARCOM Decision
82/1, Copenhagen. OSPAR Commission.
Paris Commission. 1983a. "Mercury in the Paris Convention Area." Paris Commission.
Paris Commission. 1983b. "Third Annual Report on the Activities of the Paris Commission."
Paris Commission.
Paris Commission. 1984. "Fourth and Fifth Annual Reports on the Activities of the Paris
Commission." Paris Commission.
Paris Commission. 1985a. "First and Second Annual Reports on the Activities of the Paris
Commission." Paris Commission.
Paris Commission. 1985b. "Limit Values for Mercury Emissions in Water from Existing
Brine Recirculation Chlor-Alkali Plants (exit of factory site)." PARCOM
Recommendation 85/1, Brussels. OSPAR Commission.
Paris Commission. 1985c. "Seventh Annual Report on the Activities of the Paris
Commission." Paris Commission.
Paris Commission. 1989. "Tenth Annual Report on the Activities of the Paris Commission."
Paris Commission.
Paris Commission. 1990. "Reducing Atmospheric Emissions from Existing Chlor-Alkali
Plants." PARCOM Decision 90/3, Reykjavik. OSPAR Commission.
Patel, Pari and Keith Pavitt. 1995. "Patterns of Technological Activity: Their Measurement
and Interpretation," in Paul Stoneman ed. Handbook of the Economics of Innovation
and Technological Change. Oxford: Basil Blackwell.
386

Pauli, Gunter. 1995. "Industrial Clusters of the Twenty-first Century," in Fritjof Capra and
Gunter Pauli eds. Steering Business Toward Sustainability. Tokyo: United Nations
University Press.
Porter, Michael and Claas van der Linde. 1995a. "Green and Competitive: Ending the
Stalemate." Harvard Business Review, (September-October), 120-134.
Porter, Michael and Claas van der Linde. 1995b. "Toward a New Conception of the
Environment-Competitiveness Relationship." Journal of Economic Perspectives, 9 (4),
97-118.
Portney, Paul R. 1994. "The Contingent Valuation Debate: Why Economists Should Care."
Journal of Economic Perspectives, 8 (4), 3-17.
PPG Industries. 1981. "Cl2: Chlorine." PPG Industries.
Prout, N. M. and J. S. Moorhouse eds. 1990. Modern Chlor-Alkali Technology, vol. 4.
London: Elsevier Applied Science.
Ratnayake, Ravi. 1999. "Does Environmental Regulation Stimulate Innovative Responses?
Evidence from U.S. Manufacturing." Working Paper Series. 188. Department of
Economics, University of Auckland.
Reed, Peter. 1998. "Robert Angus Smith and the Alkali Inspectorate," in Ernst Homburg,
Anthony S. Travis and Harm G. Schroter eds. The Chemical Industry in Europe, 1850-
1914: Industrial Growth, Pollution, and Professionalization. Dordrecht: Kluwer
Academic Publishers.
Rekers, C. J. N. 1973. "Some New Developments in the Field of Mercury Pollution
Abatement by Akzo." in. Proceedings of the 16th Meeting of Chlorine Plant
Managers. Washington, D.C.: Chlorine Institute.
Richter, Steffi. 2000. "AW: Chloro - Alkali- Industry." E-mail to the author. German Federal
Environmental Agency, March 10.
387
Roberts, Marc J. and Michael Spence. 1976. "Effluent Charges and Licenses under
Uncertainty." Journal of Public Economics, 5, 193-208.
Robinson, H. David. 1985. "Who Pays for Industrial Pollution Abatement?" Review of
Economics and Statistics, 67, 702-706.
Rosenberg, Nathan. 1982. Inside the Black Box: Technology and Economics. Cambridge, UK:
Cambridge University Press.
Ruttan, Vernon W. 2001. Technology, Growth, and Development: An Induced Innovation
Perspective. New York: Oxford University Press.
Sakota, Masaaki. 1977. "Reyon Kogyo no Genkyo to Kongo no Mitoshi (Current Situation
and Future Prospect of the Rayon Industry)." Soda to Enso, (3), 18-24.
Sata, T., K. Motani, and Y. Ohashi. 1983. "Perfluorinated Ion Exchange Membrane,
Neosepta-F and Its Properties," in D. S. Flett ed. Ion Exchange Membranes.
Chichester: Ellis Horwood.
Sata, Toshikatsu. 2002. Personal Interview. Tokuyama Soda, Tokuyama, February 8.
Sato, Kimihiko. 1998. Personal interview. Asahi Glass, Tokyo, June 16.
Schmalensee, Richard. 1994. "The Cost of Environmental Protection." Balancing Economic
Growth & Environmental Goals. Washington, D.C.: American Council for Capital
Formation Center for Policy Research.
Schmittinger, Peter. 2000. "Mercury Cell Process," in Peter Schmittinger ed. Chlorine:
Principles and Industrial Practice. Weinheim: Wiley-VCH.
Schmittinger, Peter, L. Calvert Curlin, Tatsuro Asawa, Stephan Kotowski, Henri Bernhard
Beer, Arthur M. Greenberg, Erich Zelfel, and Rolf Breitstadt. 1986. "Chlorine," in
Wolfgang Gerhartz ed. Ullmann's Encyclopedia of Industrial Chemistry, Fifth,
Completely Revised ed., vol. Volume A6: Ceramics to Chlorohydrins. Weinheim:
VCH.
388
Schneiders, K. and B. Luke. 1992. "Safety and Economy of Membrane Cell Electrolyzers," in
T. C. Wellington ed. Modern Chlor-Alkali Technology, vol. 5. London: Elsevier
Applied Science.
Schubert, Hermann. 1999. Personal interview. Bayer, Leverkusen, September 21.
Sealey, S. ed. 1998. Modern Chlor-Alkali Technology, vol. 7. Cambridge, UK: Royal Society
of Chemistry.
Seko, M., A. Yomiyama, and S. Ogawa. 1983. "Chlor-alkali Electrolysis using
Perfluorocarboxylic Acid Membrane," in D. S. Flett ed. Ion Exchange Membranes.
Chichester, UK: Ellis Horwood.
Seko, Maomi. 1976. "The Ion-Exchange Membrane, Chlor-Alkali Process." Industrial and
Engineering Chemistry, Product Research and Development, 15 (4), 286-292.
Seko, Maomi. 1980. "New Development of the Asahi Chemical membrane chlor-alkali
process," in M. O. Coulter ed. Modern Chlor-Alkali Technology. Chichester: Ellis
Horwood.
Seko, Maomi, Shinsaku Ogawa, Hiroshi Ono, and Osamu Suzuki. 1984. "Important Aspects
of Membrane Chlor-Alkali Process." in Milton M. Silver and Everett M. Spore eds.
Proceedings of the Symposium on Advances in the Chlor-Alkali and Chlorate Industry.
84-11. Pennington, NJ: Electrochemical Society.
Seko, Maomi, Jukichi Omura, and Mitsuo Yoshida. 1986. "Recent developments in ion
exchange membranes for chlor-alkali electrolysis," in K. Wall ed. Modern Chlor-
Alkali Technology, vol. 3. Chichester, UK: Ellis Horwood.
Seko, Maomi, Akira Yomiyama, Shinsaku Ogawa, and Hiroshi Ono. 1983. "Development of
Asahi Chemical Chlor-alkali Technology," in C. Jackson ed. Modern Chlor-Alkali
Technology, vol. 2. Chichester: Ellis Horwood.
389

Shibata, Hiroshi, Y. Kokubu, and I. Okazaki. 1977. "The Nobel Diaphragm Cell: A Flexible
Design for High Currents and Its Performance Characteristics at 330 kA." in.
Proceedings of the Symposium on Diaphragm Cells for Chlorine Production. London:
Society of Chemical Industry.
Shimizu, Hiroshi. 1992. "Nihon ni okeru Ion Kokan Gijutsu no Hatten ni tsuite, Sono 1 (On
the Development of Ion Exchange Membranes in Japan, Part 1)." Journal of Ion
Exchange, 3 (2), 40-50.
Shimizu, Hiroshi. 1993. "Nihon ni okeru Ion Kokan Gijutsu no Hatten ni tsuite, Sono 2 (On
the Development of Ion Exchange Membranes in Japan, Part 2)." Journal of Ion
Exchange, 4 (1), 2-22.
Shimohira, Tetsuji, Yoshihiko Saito, Kazuhiko Saito, and Haruhisa Miyake. 1993. "A
Membrane for Production of 50% Caustic Soda." in T. C. Jeffery, K. Ota, J. Fenton
and H. Kawamoto eds. Proceedings of the Symposium on Chlor-Alkali and Chlorate
Production and New Mathematical and Computational Methods in Electrochemical
Engineering. 93-14. Pennington, NJ: Electrochemical Society.
Shin-Nihon Salt. 2001. "Shio Jigyo Bumon (Salt Business Division)." Shin-Nihon Salt.
Shiroki, Hiroyuki. 1994. "Rondon Kokusai Enso Shinpojiumu ni Sanka shite (Having
Attended the London International Chlorine Symposium)." Soda to Enso, 11 (16-21).
Showa Chemical. 2001. "Nenpu (Chronology)." Showa Chemical.
Siddiqi, Abdul-Rauf. 1994. "Chloralkali plant in Pakistan arouses environmentalists' ire."
Chemical Engineering, (December), 46-48.
Skjarseth, Jon Birger. 1998. "The Making and Implementation of North Sea Commitments:
The Politics of Environmental Participation," in David G. Victor, Kal Raustiala and
Eugene B. Skolnikoff eds. The Implementation and Effectiveness of International
Environmental Commitments: Theory and Practice. Cambridge, MA: MIT Press.
390

Smith, J. M. and H. C. Van Ness. 1959. Introduction to Chemical Engineering
Thermodynamics. New York: McGraw-Hill.
Smith, W. Watson. 1968. "Comparison of Modern Mercury and Diaphragm Type Chlorine
Cells." Chemical Engineer, (March), CE54-CE57.
Smith, W. Watson. 1975. "Electrolytic Manufacture of Chemicals from Salt, Second Edition."
Chlorine Institute.
Society of Chemical Engineers of Japan. 1998. Kagaku Purosesu: Kiso kara Gijutsu Kaihatsu
made (Chemical Processes: From Fundamentals to Technological Development).
Tokyo: Tokyo Kagaku Dojin.
Society of Chemical Industry ed. 1977. Diaphragm cells for chlorine production. London:
Society of Chemical Industry.
Society of Chemical Industry. 2000. "The 2000 London International Chlorine Symposium,
Final Circular and Registration Form." SCI Electrochemical Technology Group.
Society of Environmental Toxicology and Chemistry. 1991. "A Technical Framework for
Life-Cycle Assessment." Society of Environmental Toxicology and Chemistry.
Sommers, H. A. 1957a. "Chlorine Caustic Cell Development in Europe and the United
States." Chemical Engineering Progress, 53 (9), 409-417.
Sommers, H. A. 1957b. "Chlorine Caustic Cell Development in Europe and the United
States." Chemical Engineering Progress, 53 (10), 506-510.
Sommers, H. A. 1965. "The chlor-alkali industry." Chemical Engineering Progress, 61 (3),
94-109.
Sommers, Howard A. 1967. "The Design of Large Mercury Cells." Electrochemical
Technology, 5 (3-4), 108-124.
SRI. 1996. "Chlorine/Sodium Hydroxide." CEH Marketing Research Report. SRI.
391
Stadig, William. 1993. "Chlor-alkali producers evaluate safer alternatives to asbestos."
Chemical Processing, (March), 41-46.
Stavins, Robert N. 1995. "Transaction Costs and Tradeable Permits." Journal of
Environmental Economics and Management, 29, 133-148.
Stavins, Robert N. 2000. "Experience with Market-Based Environmental Policy Instruments,"
in Karl-Goran Maler and Jeffrey Vincent eds. The Handbook of Environmental
Economics. Amsterdam: North-Holland/Elsevier Science.
Stinson, Stephen C. 1982. "Electrolytic cell membrane development surges." Chemical and
Engineering News, 22-25.
Stokes, Donald E. 1997. Pasteur's Quadrant: Basic Science and Technological Innovation.
Washington, D.C.: Brookings Institution.
Stoneman, Paul L. and Paul A. David. 1986. "Adoption Subsidies vs. Information Provision
as Instruments of Technology Policy." Economic Journal, 96 (Supplement), 142-150.
Straasheijm, Fred G. 1999. Personal interview. Akzo Nobel, Amersfoort, September 24.
Straasheijm, Fred G. 2000. "Chlor-Alkali Plant in Rotterdam." E-mail to the author. Akzo
Nobel, Amersfoort, The Netherlands, March 27.
Suckling, C. J. 1994. "Clean Synthesis," in R. C. Kirkwood and A. J. Longley eds. Clean
Technology and the Environment. Glasgow: Blackie Academic & Professional.
Sugino, Toshiyuki. 1991. "PB Repoto to Suigin-ho no Kindai-ka (PB Report and the
Modernization of the Mercury Process)." Soda to Enso, (6), 10-21.
Sumitomo Chemical. 1998. "Enka Biniru Monoma Kanren Jigyo no Saikochiku ni tsuite (On
the Restructuring of the Business Related to Vinyl Chloride Monomer)." Press
Release. Sumitomo Chemical.
Tajima, Keizo. 1997. Personal interview. Ministry of International Trade and Industry, Tokyo,
November 25.
392

Takeshita, Tetsuo. 1990. "Showa Denko Diaphragm Chlor-Alkali Technology." in.
Proceedings of the 33rd Chlorine Plant Operations Seminar and Workshop Sessions.
Washington, D.C.: Chlorine Institute.
Teufel, Hermann. 2000. "Further question about the Chlor-Alkali plant at Gersthofen." E-mail
to the author. Plant Manager, Clariant, Gersthofen, Germany, February 2.
Third International Conference on the Protection of the North Sea. 1990. "Ministerial
Declaration." Third International Conference on the Protection of the North Sea, The
Hague, The Netherlands, 8 March.
Thornton, Joe. 2000. Pandora's Poison: Chlorine, Health, and a New Environmental Strategy.
Cambridge, MA: MIT Press.
Thun, Ivar. 1999. "Ad: Question about Chlorine Plant at Tofte." E-mail to the author. Head of
Education and Information, Norske Skog, Tofte, Norway, November 25.
Tobey, James A. 1990. "The Effects of Domestic Environmental Policies on Patterns of
World Trade: An Empirical Test." Kyklos, 43 (2), 191-209.
Tokuyama. 2002. "Research and Development Themes and Electrolytic Plants at Tokuyama."
Tokuyama.
Tosoh. 2001. "Enkaku (Chronology)." Tosoh.
Trettin, Peter. 1997. "Asbestos - Availability & Safety: A Supplier's Perspective." in.
Proceedings of the 40th Chlor-Alkali Plant Operations Seminar Meeting. Washington,
D.C.: Chlorine Institute.
Tsubaki, Tadao and Katsuro Irukayama eds. 1977. Minamata Disease: Methylmercury
poisoning in Minamata and Niigata, Japan. Tokyo: Kodansha.
Tsurumi Soda. 2001. "Kaisha Enkaku (Corporate Chronology)." Tsurumi Soda.
393

Ukihashi, H., T. Asawa, and H. Miyake. 1983. "The Progress of Membrane Technology for
Chlor-alkali Production," in D. S. Flett ed. Ion Exchange Membranes. Chichester:
Ellis Horwood.
Ukihashi, Hiroshi and Kimihiko Sato. 1986. "Operational cell technology," in K. Wall ed.
Modern Chlor-Alkali Technology, vol. 3. Chichester: Ellis Horwood.
Ulph, David. 1997. "Environmental Policy and Technological Innovation," in Carlo Carraro
and Domenico Siniscalco eds. New Directions in the Economic Theory of the
Environment. Cambridge, UK: Cambridge University Press.
United States Department of the Interior, Bureau of Mines. 1968. Minerals Yearbook 1967.
Washington, D.C.: United States Government Printing Office.
United States Environmental Protection Agency. 2000. "Asbestos Worker Protection: Final
Rule." Federal Register. 40 CFR Part 763. United States National Archives and
Records Administration.
United States Environmental Protection Agency, National Center for Environmental
Economics, Office of Policy, Economics, and Innovation, Office of the Administrator.
2001. "The United States Experience with Economic Incentives for Protection the
Environment." Report. EPA-240-R-01-001. United States Environmental Protection
Agency.
United States Tariff Commission. 1951. "Asbestos: A Summary of Information on Uses,
Production, Trade, and Supply." Industrial Material Series Report. M-3.
van Beers, Cees and Jeroen C. J. M. van den Bergh. 1997. "An Empirical Multi-Country
Analysis of the Impact of Environmental Regulations on Foreign Trade Flows."
Kyklos, 50 (1), 29-46.
Vogel, David. 1986. National Styles of Regulation: Environmental Policy in Great Britain
and the United States. Ithaca: Cornell University Press.
394

Vos, Ad. 1999. "FW: Question about Chlor-Alkali Plant." E-mail to the author. GE Plastics,
Bergen op Zoom, The Netherlands, November 30.
Wall, K. ed. 1986. Modern Chlor-Alkali Technology, vol. 3. Chichester: Ellis Horwood.
Wallace, David. 1995. Environmental Policy and Industrial Innovation: Strategies in Europe,
the US and Japan. London: Royal Institute of International Affairs.
Warren, Kenneth. 1980. Chemical Foundations: The Alkali Industry in Britain to 1926.
Oxford: Clarendon Press.
Watanabe, Chihiro. 1995. "The Feedback Loop between Technology and Economic
Development: An Examination of Japanese Industry." Technological Forecasting and
Social Change, 49, 127-145.
Weitzman, Martin L. 1974. "Prices vs. Quantities." Review of Economic Studies, 41 (4), 477-
491.
Wellington, T. C. ed. 1992. Modern Chlor-Alkali Technology, vol. 5. London: Elsevier
Applied Science.
Wenders, John T. 1975. "Methods of Pollution Control and the Rate of Change in Pollution
Abatement Technology." Water Resources Research, 11 (3), 393-396.
Wheeler, David. 2000. "Racing to the Bottom?: Foreign Investment and Air Quality in
Developing Countries." Working Paper. Development Research Group, World Bank.
World Commission on Environmental and Development. 1987. Our Common Future. Oxford:
Oxford University Press.
Xing, Yuquing and Charles D. Kolstad. 1995. "Do Lax Environmental Regulations Attract
Foreign Investment?" Working Paper in Economics. 6-95. Department of Economics,
University of California, Santa Barbara.
Yamaguchi, Kenzo. 1999a. Personal interview. Chlorine Engineers Corp., Tokyo, December
8.
395

Yamaguchi, Kenzo. 1999b. "Chlor-Alkali Electrolysis Technologies Applied in Japan." in
Electrochemical Society ed. Proceedings of the Joint International Meeting. Honolulu,
Hawaii.
Yamaguchi, Kenzo and Isao Kumagai. 1990. "Development of Large Monopolar Type
Membrane Electrolyzers," in N. M. Prout and J. S. Moorhouse eds. Modern Chlor-
Alkali Technology, vol. 4. London: Elsevier Applied Science.
Yanagioka, Hiroshi. 1993. "Kankyo Mondai ni okeru Gijutsu no Keizai-sei: Nihon-gata
Taisaku ni Saiteki-ka Hyoka wo (Economics of Technologies in Environmental
Issues: For Optimality Evaluation of the Japanese Countermeasures)." Kagaku Keizai,
(3), 1-5.
Yarime, Masaru. 1999. "Uncertainty and Lock-in in Technological Dynamics: Some
Implications for Zero Emissions," in K. Iiyama, J. Gravitis and A. Sakoda eds.
Targeting Zero Emissions for the Utilization of Renewable Resources (Biorefinery,
Chemical Risk Reduction, Lignocellulosics Economy). Tokyo: Asian Natural
Environmental Sciences Center, University of Tokyo.
Yelle, Louis E. 1979. "The Learning Curve: Historical Review and Comprehensive Survey."
Decision Sciences, 10, 302-328.
Yomiyama, Akira. 1982. "On the Current Situation of the Technological Development of Ion
Exchange Membrane Process for Brine Electrolysis of Asahi Chemical." in.
Proceedings of the 8th Seminar on the Current Situation of the Ion Exchange
Membrane Process. Tokyo: Association for the Promotion of Installations of the
Diaphragm Process Facilities.
Zerbe, Richard O. 1970. "Theoretical Efficiency in Pollution Control." Western Economic
Journal, 8, 364-376.
396

Zimmermann, Albert. 2000. "Your e-mail from 6.3.2000." E-mail to the author. EL-PR,
Krupp-Uhde, Dortmund, Germany, March 30.
397

Samenvatting
Dit proefschrift gaat over de invloed van milieureguleringen op technologische verandering in
de chloor- en alkali-industrie in Japan en West-Europa.
In hoofdstuk 2 wordt een overzicht gegeven van eerder uitgevoerd theoretisch en
empirisch onderzoek naar de effecten van milieureguleringen op technologische verandering.
De kritiek in dit proefschrift spitst zich toe op de manier waarop deze studies technologische
verandering behandelen waar het gaat om het terugdringen van milieuvervuiling. Bij de
analyse van de technologische invloed van milieuregulereingen werd in eerdere publicaties
onder andere onvoldoende aandacht besteed aan een cruciaal onderscheid tussen end-of-pipe
technologieën en schone technologieën. De meeste theoretische modellen gaan uit van
technologieën die zijn gericht op incrementele emissievermindering bij stijgende kosten van
marginale vervuilingsbestrijding. Effectief betekent dit dat de technologieën die in de
modellen worden gebruikt, eigenlijk end-of-pipe technologieën zijn. Anderzijds is in vrijwel
geen enkele studie aandacht besteed aan de mogelijkheid om emissies tegen te gaan vanuit het
productieproces door het gebruik van schone technologieën. Bij het gebruik van schone
technologieën komen geen emissies vrij. De marginale analyse van de kostencurve van
vervuilingsbestrijding, die veelvuldig wordt toegepast in theoretische modellen, is daarom
ongeschikt als we uitgaan van het bestaan van schone technologieën.
Ook hebben de meeste empirische studies geen aandacht besteed aan het onderscheid
tussen de verschillende soorten technologieën bij het bestuderen van de effecten van
milieureguleringen op technologische verandering. Een groot aantal van deze studies kijken
naar patenten als indicator van innovaties op een hoog aggregatieniveau en zijn dan ook
vooral gericht op end-of-pipe technologieën, zoals emissiebehandelingstechnieken en filters,
of op alle soorten innovaties die de onderzoekers waren tegengekomen. Zonder gedetailleerde
informatie over specifieke productieprocessen is het namelijk erg moeilijk om een duidelijk
beeld te krijgen van de verscheidenheid aan schone technologieën. Door schone
technologieën buiten beschouwing te laten, wordt de verscheidenheid aan technologische
veranderingen t.b.v. vervuilingsbestrijding te sterk beperkt tot de groep van end-of-pipe
technologieën. Aan de andere kant zal, als we alle soorten innovaties in aanmerking nemen,
de groep ook technologieën omvatten die weinig te maken hebben met ecologische aspecten
en te breed zijn om te kunnen worden aangeduid als ‘groene’ innovaties. Naar onze mening is
398

een gedetailleerde studie van de aard en het karakter van technologieën belangrijk voor een
gedegen analyse van groene innovatie.
Daarna tonen we aan dat er in principe twee soorten technologie zijn voor de verminde-
ring van emissies als gevolg van bedrijfsactiviteiten: end-of-pipe technologieën en schone
technologieën. End-of-pipe technologieën zijn gericht op emissiereductie aan het eind van de
productiefaciliteiten, en hebben geen invloed op de reacties waarbij het hoofdprodukt wordt
geproduceerd. Bij schone technologieën worden de belangrijkste procesreacties vervangen
door andere reacties, en worden ongewenste bijprodukten die vrijkomen tijdens het
productieproces, op effectieve wijze teniet gedaan. In het verleden zijn veelal end-of-pipe
technologieën ontwikkeld om emissies van industriële processen te reduceren. Deze
technologieën behandelen milieuverontreinigende stoffen aan het eind van de emissiepijp
zonder het productieproces te beïnvloeden, en zijn relatief eenvoudig te installeren en te
gebruiken; er zijn dan ook vele soorten end-of-pipe technologieën in de industrie. End-of-pipe
technologieën maken de productie duurder vanwege de extra kosten die nodig zijn om ze te
installeren aan het eind van de productiefaciliteiten. Dit in tegenstelling tot schone
technologieën, die de vorming van milieuverontreinigende stoffen vanaf het begin voorkomen
door alle faciliteiten te veranderen en zo het productieproces kunnen verbeteren en op termijn
de productiekosten kunnen verlagen.
In het analytisch raamwerk dat wij hebben ontwikkeld om de effecten van
milieureguleringen op technologische veranderen te bestuderen, wordt dit onderscheid tussen
end-of-pipe en schone technologie wel gemaakt. Op basis van onze bevindingen stellen wij
dat verschillende milieureguleringen kunnen leiden tot uiteenlopende soorten technologische
verandering. Bij relatief soepele milieureguleringen zullen bedrijven sneller overgaan op end-
of-pipe technologieën, die – aanvankelijk althans – waarschijnlijk minder duur zullen
uitvallen dan schone technologieën. Dit zal weer leiden tot meer investeringen in de
bestaande productietechnologie, waarbij de emissies naar verwachting worden gereduceerd
door de installatie van end-of-pipe technologieën. Bedrijven zullen hierdoor niet snel
overgaan op schone technologieën, zelfs wanneer later blijkt dat schone technologieën
efficiënter zijn in de productie; bedrijven zullen geneigd zijn deze bestaande fabrieken te
laten voortbestaan tot het eind van hun levensduur tenzij de schone technologieën extreem
efficiënt blijken te zijn.
Anderzijds kunnen bedrijven niet voldoen aan strenge reguleringen door uitsluitend
end-of-pipe technologieën te installeren. Ze zullen dus bestaande productietechnologieën
399

moeten vervangen en investeren in R&D t.b.v. innovaties gericht op schone technologieën.
Hoewel er doorgaans diverse schone technologieën voorhanden zijn, zullen bedrijven bij
strenge regels waaraan ze op korte termijn moeten voldoen, echter worden ‘gedwongen’
vroegtijdig beslissingen te nemen over alternatieve technologieën, die op de langere termijn
misschien niet de meest geschikte blijken te zijn. Het vervangen van deze technologieën door
een betere technologie later betekent extra kosten.
We gebruiken dit analytische raamwerk in onze empirische studie van de chlooralkali-
industrie. In hoofdstuk 3 gaan we meer dan honderd jaar terug in de geschiedenis van de
technologische evolutie in de chloor- en alkali-industrie. Sinds het begin van de negentiende
eeuw hebben zich bij de productietechnologieën die werden gebruikt in de chloor- en alkali-
industrie een aantal grote innovaties voorgedaan in de vorm van chemische en electrolytische
processen. Wat betreft de laatste zien we dat aan het begin van de jaren zeventig de
kwiktechnologie het meest werd gebruikt in West-Europa en Japan, voordat hier voor het
eerst sprake was van milieureguleringen voor kwikemissies. Diverse bedrijven in West-
Europa en Japan hadden hoogwaardige technologieën ontwikkeld voor deze kwiktechnologie,
die in de meeste chloor-alkali-fabrieken werd gebruikt. In beide gebieden waren dus bedrijven
actief die vóór de introductie van milieureguleringen even innovatief waren wat betreft
chloor-alkali productietechnologieën. Dit wijst erop dat de technologische omstandigheden in
deze industrie in West-Europa en Japan, aanvankelijk vergelijkbaar waren.
Sinds de milieureguleringen voor het verminderen van kwikemissies afkomstig van
chloor-alkali-fabrieken in het begin van de jaren zeventig lopen de technologische
veranderingspaden in Japan en West-Europa echter uiteen. In de overige hoofdstukken van dit
proefschrift zien we hoe een verschillend milieubeleid heeft bijgedragen tot de verschillende
technologische situaties in de twee gebieden. In hoofstuk 4 kijken we naar Japan, waar de
regering de chloor- en alkali-industrie via strikte regelgeving dwong over te schakelen op
andere processen, waardoor innovatieve bedrijven werden aangespoord alternatieve schone
technologieën te ontwikkelen. Deze strenge regelgeving, aanvankelijk vastgelegd in een strak
tijdsschema, leidde ertoe dat een groot aantal producenten van chloor-alkali overging op het
diafragmaproces, dat in die tijd relatief goed bleek te functioneren vergeleken met het
ionwisselingsmembraanproces, dat toen nog in de kinderschoenen stond. Later bleek het
diafragmaproces echter een zeer inefficiënte technologie, minder efficiënt dan het
membraanproces dat in rap tempo werd verbeterd. Op basis van nieuwe informatie over deze
technologische ontwikkelingen vanuit de industrie onderbraken de Japanse autoriteiten
400

tijdelijk de implementatie van de oorspronkelijke regulering in afwachting van verdere
ontwikkelingen in het membraanproces. Na een evaluatie door experts van de haalbaarheid
van het membraanproces in de industrie werd bedrijven meer tijd gegeven hun processen aan
te passen. Door deze wijziging in de regelgeving kregen de overgebleven kwikproces-
fabrieken de gelegenheid direct over te schakelen op het membraanproces, die zich sindsdien
zowel economisch als ecologisch heeft ontwikkeld tot de beste technologie. De kwikprocesfa-
brieken die eerder waren overgegaan op het diafragmaproces, moesten echter weer
overschakelen op het membraanproces. Dit leidde tot aanzienlijke investeringen in fabrieken
waarbij bestaande processen ruim voor het einde van hun eigenlijke levensduur buiten
werking werden gesteld.
In hoofdstuk 5 komen de technologische veranderingen in de chloor- en alkali-industrie
in West-Europa aan de orde. Hier werden minder strenge reguleringen in de vorm van
emissiestandaarden opgelegd aan chloor-alkali fabrieken die hun kwikemissies moesten
verminderen. De meeste bedrijven in deze industrie kozen voor end-of-pipe technologieën,
die veel goedkoper waren en meer zekerheid boden dan nieuwe, kostbare schone
technologieën waarvan het effect niet duidelijk was. Het grotendeel van de kwikproces-
bedrijven ging over op de ontwikkeling en installatie van end-of-pipe technologieën teneinde
te voldoen aan de regels voor de reductie van kwikemissies. Er werden veel chloor-alkali-
fabrieken gebouwd die functioneerden op basis van kwikprocessen en waren uitgerust met
end-of-pipe technologieën om vervuiling tegen te gaan. Deze fabrieken hebben het eind van
hun fysieke levensduur, die normaal gesproken zo’n 40 jaar of langer is, nog niet bereikt.
Daarom zijn de chloor-alkali producenten in WestEuropa ook nu nog sterk geneigd deze
kwikfabrieken te blijven gebruiken, hoewel het membraanproces de meest efficiënte
productietechnologie is gebleken en in andere landen wordt toegepast, ook in veel
industrialiserende landen. Kortom, de betrekkelijk soepele milieureguleringen in West-
Europa hebben geleid tot aanzienlijke vooruitgang in end-of-pipe technologieën om
kwikemissies te reduceren, maar hebben ook de ontwikkeling van het membraanproces
ontmoedigd, een voorbeeld bij uitstek van een schone technologie, ook al waren er een aantal
innovatieve bedrijven die zich richtten op chloor-alkali productietechnologieën. Omdat veel
chloor-alkali fabrieken, uitgerust met end-of-pipe technologieën om kwikemissies te
reduceren, het kwikproces zijn blijven gebruiken, is de diffusie van het efficiënte
membraanproces langzaam en beperkt geweest.
401

Tenslotte worden in hoofdstuk 6 een samenvatting en de conclusies van ons onderzoek
gepresenteerd. Relatief soepele milieureguleringen gericht op betere vervuilingsbestrijding
van industriële activiteiten, bevorderen innovaties van end-of-pipe technologieën. In feite zou
dit de levensduur van bestaande, acherhaalde productieprocessen kunnen verlengen. Strenge
regelgeving bevordert weliswaar innovatieve activiteiten ten behoeve van schone
technologieën maar kunnen tevens leiden tot een vroegtijdig keuze voor ongeschikte
technologieën. Alleen wanneer in geval van strenge regelgeving de implementatietijd flexibel
wordt gehanteerd en ruimte wordt geboden voor technologische experimenten, kunnen
bedrijven op efficiënte wijze schone technologieën ontwikkelen en breed toepassen. Op basis
van onze bevinding m.b.t. de uiteenlopende effecten van milieureguleringen op
technologische verandering gaat dit proefschrift ook in op implicaties voor bedrijfsstrategieën,
besluitvorming, en beleidsarrangementen die bedrijven helpen over te schakelen van end-of-
pipe op schone technologieën.
402

Curriculum Vitae
Masaru Yarime was born in Akita, Japan on 3 October 1969. He received his Bachelor of
Science in Chemical Engineering from the University of Tokyo, Tokyo, Japan in 1993 and
Master of Science in Chemical Engineering from the California Institute of Technology,
Pasadena, California, the United States in 1995. He is currently a Research Associate of the
Research Center for Advanced Economic Engineering of the University of Tokyo. His
research interests include Economics of Technological Change, Environmental Economics,
Science and Technology Policy, and University-Industry Collaboration.
403