Embed Size (px)
Citation preview

From Exclusives to Brandless: Exploring Brand Loyalty to Retail Stores
GREY MATTER RESEARCH & CONSULTING PHOENIX, ARIZONA
January 2009
FROM EXCLUSIVES TO
BRANDLESS:
Exploring Loyalty to Drug Store Brands versus
Other Retail Store Categories

GREY MATTER RESEARCH REPORT – EXPLORING LOYALTY TO DRUG STORE BRANDS 1
INTRODUCTION Collectively, retailers spend billions of dollars each year trying to establish their brand in the hearts and minds of consumers. From establishing brand awareness, to building brand preference, to eventually achieving brand loyalty and even brand advocacy, retailers seek to separate their brand from the competition. How successful are they? The answer depends on the individual brand, of course, but much of the answer also depends on the retail category. The loyalty and preference Americans show to different retail store brands is much different for drug stores than for the grocery or convenience store categories, for instance. Most brand managers and executives at individual companies have at least some idea about customer loyalty to their particular brand, and some also know how their own brand’s loyalty figures compare to those of direct competitors within their own category. But there is often relatively little “big picture” awareness across different retail categories. Over the years, Ellison Research has had an opportunity to work with major brands across an array of categories: retail, automotive, entertainment, sports, financial services, and many others. Working in so many categories, rather than focusing on just one, has led us to a variety of anecdotal and observational comparisons of brand loyalty across retail categories. But, like true researchers, for us anecdotal and observational evidence simply serves as the basis for developing theories that we then try to prove or disprove through research. The result of our desire for knowledge is this brief report on how brand loyalty to drug stores compares to other major retail categories.

GREY MATTER RESEARCH REPORT – EXPLORING LOYALTY TO DRUG STORE BRANDS 2
STUDY BACKGROUND AND DETAILS This study was privately developed, conducted, and funded by Grey Matter Research & Consulting. In the research, we compared Americans’ self-reported brand loyalty and consideration in 12 different major retail categories: We used the following question:
Think about the brand names of different types of stores where you might shop. For instance, there are nationwide brands of toy stores such as Toys R Us and KB Toys, as well as local brands with only one or two stores. For each type of store listed below, which statement best describes how you choose where you shop?
We provided the toy store example in the question for a few reasons. First, consumers don’t always think of stores as “brands” – they are sometimes more comfortable with the idea of a brand being an actual product (such as Crest or Colgate in toothpaste), or a manufacturer (such as Nissan or Chevrolet in vehicles). Second, we wanted to make sure they didn’t just think of major national retailers as “brands,” but included in their answer local retailers that may have a strong presence in their particular market. Third, we wanted to make sure respondents understood the question was asking about brands, and not store locations (e.g. a preference for shopping at Toys R Us, not specifically the Toys R Us store on 3rd and Main). However, individual brands were not mentioned in relation to each category. In other words, the question did not ask about “drug stores such as CVS or Walgreens,” since using examples could have biased respondents based on their awareness of or reaction to those specific brands. Unfortunately, it’s impossible to include every retail category in a study such as this. Many consumers shop at more specialized retailers such as bakeries, swimming pool supply stores, hobby stores, greeting card stores, and nurseries, among many others. However, we attempted
Drug stores Department stores Convenience stores Christian or religious book stores General interest book stores Home improvement stores Pet product stores Grocery stores Furniture stores Clothing stores Consumer electronics stores Shoe stores

GREY MATTER RESEARCH REPORT – EXPLORING LOYALTY TO DRUG STORE BRANDS 3
to include a broad spectrum of retail categories in which a majority of consumers shop at least occasionally. This study was conducted among a representative sample of 1,007 American adults, through a demographically balanced pre-recruited online panel. The final sample was further weighted by age, geography, race/ethnicity, and household income, to assure a completely representative sample. The margin of error for the total sample size is ±3.0 percentage points at a 95% confidence interval with a 50% response distribution. Within the study, we first determined whether respondents were users of each retail category. It’s important to note that “users” was not defined as “regular users” or “frequent users.” Essentially, people who said they don’t shop in a particular kind of retail outlet “at all” were eliminated from the brand loyalty measurement for that category. Some categories, such as grocery or drug stores, are likely to have many frequent users, while others, such as furniture or consumer electronic stores, are likely to see much less frequent use. But only the people who said they don’t shop a particular category “at all” were excluded from that category’s loyalty measurement. This is important to remember, because all too often, repeat brand use is confused with actual brand loyalty. For instance, a consumer may stop at the same convenience store every morning for a cup of coffee, because it’s the first such store she encounters on her way to work. This person has frequent use of that brand, and she may even be fully satisfied as a consumer. However, that doesn’t mean she has any actual loyalty to that brand. She may not even be able to recall whether that particular store is a 7-Eleven, AM PM, or Circle K. One poor experience with the product or service could drive her to another nearby convenience store. A competitor opening up even closer to her house could get her to switch brands. A great experience at a competitor store could do the same thing, as could something as simple as a change in her daily route to work. Our example consumer may be a regular user of the brand, but that doesn’t mean she’s brand loyal at all, or even has a particular preference for the brand she uses. Because of the need to avoid confusing usage and loyalty, we did not include frequency of usage as part of the loyalty measurement. We simply asked people what is their general shopping preference for each retail category if they use that category at all, dividing category users into five unique groups:

GREY MATTER RESEARCH REPORT – EXPLORING LOYALTY TO DRUG STORE BRANDS 4
THE EXCLUSIVES: Within a category, Exclusives have only one brand of store where they will
consider shopping. Example: “When it comes to grocery stores, I’ll only shop at Kroger.”
THE FAVORITES:
Within a category, Favorites have a favorite brand of store, but will also shop at others.
Example: “I prefer to shop at Kroger, but for various reasons sometimes I shop at Safeway or Albertson’s.”
THE SELECTIVES:
Within a category, Selectives have a small number of brands where they will consider shopping, with no particular favorite among those.
Example: “I divide my grocery store shopping among Kroger, Safeway, and Albertson’s. Where I go on any given trip depends on what items I need and who has a good sale.”
THE AVOIDERS:
Avoiders have certain brands of stores they avoid, but no particular brands they prefer.
Example: “I don’t really have a favorite grocery store, but I will not shop at Albertson’s or Kroger. Anywhere but those two.”
THE BRANDLESS:
True to their name, the Brandless don’t really pay attention to the brand or name of the store when they shop within a particular category.
Example: “I look at the ads and see what’s on sale, then buy what I need wherever it’s cheapest. I couldn’t care less if I’m shopping at Safeway, Albertson’s, or anywhere else.”
There are a couple of things to note about the terminology and definitions used in this report. First, we need to make it clear that in this report, a “store brand” means a brand of store; it is not any reference to a private label brand sold only in one store chain. Second, keep in mind that the questionnaire was asking people about brands, not about individual stores. In other words, an Exclusive in the home improvement category might have told us he would only shop at Home Depot when shopping in home improvement stores, not that he would only shop at the particular Home Depot located at 5th and Elm.

GREY MATTER RESEARCH REPORT – EXPLORING LOYALTY TO DRUG STORE BRANDS 5
THE DRUG STORE CATEGORY The first thing we learned is that just 2% of all Americans said they are complete and total non-users of this category. Out of the 12 different retail categories included in this study, drug stores were among the most likely to be used. Department stores and clothing stores (98% each) were at the same proportion of use as drug stores, and only grocery stores (almost 100%) were more likely to be used.
At first glance, the usage numbers may seem surprisingly high. But remember that this does not mean 98% of Americans shop in drug stores on a regular basis, such as weekly or monthly. What it means is that 98% of Americans either do shop there, have shopped there, or feel they may shop there in the future; therefore, they are unwilling to call themselves complete non-users of this category. This figure is not at all comparable to other studies that report frequency of use of the category. Among users of the drug store category (both frequent and
infrequent), there was relatively strong loyalty to individual store brands. Seven percent of all category users qualified as Exclusives, meaning they have one and only one brand of drug store where they will shop. Another 48% said they do have a favorite store brand, but they are willing to shop at other brands. This means over half of all category users (55%) could identify one favorite store brand within this category. Twenty-eight percent were Selectives – they have a small group of brands where they will shop, but no particular favorite. Nine percent were Avoiders, meaning while they have no particular favorite drug store brand, there is at least one they avoid using. Finally, 8% of category users were truly Brandless. If they need something from a drug store, they feel equally likely to walk into Walgreens, Rite Aid, a small local chain, an independent, or any other brand within the category. They simply do not pay attention to the brand at all when it comes to drug stores.
Users, 98%
Non-users,
2%
Use of Drug Stores

GREY MATTER RESEARCH REPORT – EXPLORING LOYALTY TO DRUG STORE BRANDS 6
Exclusives: will only shop in one store brand. Favorites: have a favorite brand, but will shop others. Selectives: have a small number of brands they will shop, with no particular favorite. Avoiders: no
favorite, but certain brands they avoid. Brandless: don’t pay attention to brands when choosing where to shop in this category.
Loyalty to different drug store brands showed a few demographic differences that are worth exploring. One significant difference was by gender. Sixty-two percent of all female category users could identify one particular brand of drug store that is their favorite (as either Exclusives or Favorites), compared to only 49% of men. Another difference was according to age group. The older the respondent, the more likely they were to have a favorite drug store brand. The trend starts to become noticeable around age 45. Among younger people, 48% had a favorite drug store brand. This rises to 54% among people 45 to 59, and to 67% among people 60 or older. Although the reasons were not specifically explored in the research, a logical hypothesis for at least some of this difference would be the greater likelihood of using prescription drugs among older consumers. Once a given pharmacy has a person’s prescription coverage information, it becomes more convenient simply to return to that same pharmacy for additional medication, which encourages repeat use, as well as the opportunity for greater brand loyalty. Another interesting and possibly unexpected difference was based on race or ethnicity. There was not much difference in positive loyalty by race/ethnic group, but definitely one in negative brand loyalty. Just six percent of Caucasian respondents were Avoiders, meaning they don’t have a specific brand they prefer among drug stores, but they do have one or more they try not
0%
10%
20%
30%
40%
50%
60%
70%
80%
90%
100%
Exclusives Favorites Selectives Avoiders Brandless
7%
48%
28%
9% 8%
Brand Loyalty to Drug Store Brands

GREY MATTER RESEARCH REPORT – EXPLORING LOYALTY TO DRUG STORE BRANDS 7
to use. This proportion tripled to 18% among all non-Caucasian respondents. The number was 24% among African-Americans and 18% among Latinos. There was no discernible difference in brand loyalty when comparing the type of community in which people live (small town, rural, suburban, or urban). However, there was a small difference when comparing the region of the country (Midwest, South, Northeast, or West). Consumers in the West and South were almost twice as likely to be either Avoiders or Brandless – unable to name even a small circle of brands they prefer – as were people in the Midwest or Northeast. Twenty-two percent of West residents, along with 20% in the South, were either Avoiders or Brandless, compared to 12% in the Northeast and 11% in the Midwest. Projected onto the entire U.S. adult population, there are approximately 16,508,000 Americans who at least occasionally shop at drug stores and are completely loyal to one brand – they won’t shop anywhere else. Another 107,186,000 do have a preferred store brand, but will shop at others. There are also 61,960,000 Selectives, with 20,352,000 Avoiders, and 17,412,000 who are truly Brandless – they’ll shop at any drug store without selecting based on the brand. Again, these figures do not cover only regular or frequent drug store shoppers, but people who do not say they are complete non-users of this category.

GREY MATTER RESEARCH REPORT – EXPLORING LOYALTY TO DRUG STORE BRANDS 8
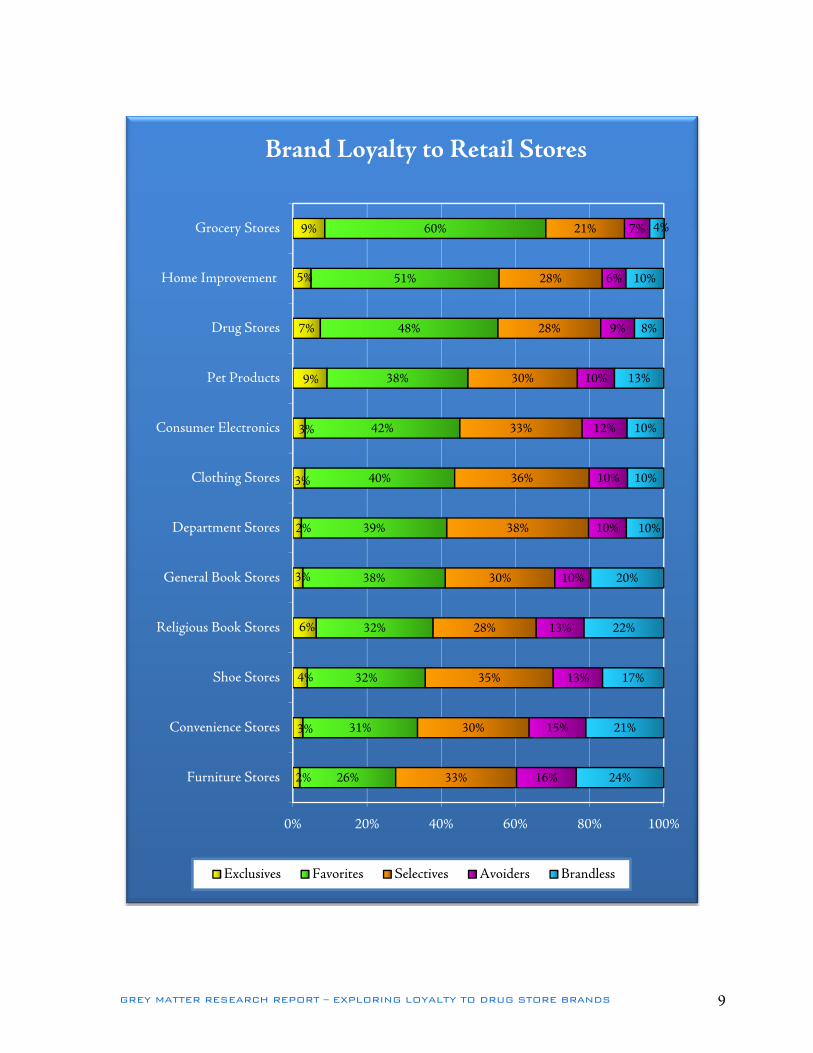
COMPARISON WITH OTHER CATEGORIES Brand loyalty to drug stores was among the highest for any of the 12 retail categories included in this study. Only grocery stores had consistently higher brand loyalty, although the home improvement category had loyalty figures that were similar to drug stores. Overall, by far the highest level of brand loyalty was to grocery stores, a category for which 69% of all category users could identify one favorite store brand. This was followed by home improvement stores (56% had one favorite brand) and drug stores (55%). Next in line were pet product stores (47% had a favorite brand), consumer electronics stores (45%), clothing stores (43%), department stores (41%), and general interest book stores (41%). Toward the bottom were Christian/religious book stores (38%), shoe stores (36%), convenience stores (34%), and furniture stores (28%). Very few consumers were Exclusives within any of these retail categories; however, drug stores did have among the highest Exclusive numbers, at 7%. Only grocery stores (9%), pet product stores (9%) Christian/religious book stores (6%) and home improvement stores (5%) were similar. On the negative side, 17% of drug store users could not identify even a small set of preferred brands – they were either Brandless or Avoiders. Only grocery stores had a lower proportion (11%), while home improvement stores (16%), clothing stores (20%), and department stores (20%) were similar. One additional step we took in this study was to compare drug stores and grocery stores directly. While obviously these are two different retail categories, there is considerable crossover between the two categories. Consumers who go to a drug store for pain reliever, hair gel, and a prescription refill can just as easily accomplish the same thing at many grocery stores. Among users of both categories (which included most Americans), 62% had the same level of brand loyalty in both categories. For instance, they were Brandless in both, Selectives in both, etc. Breaking it down further, we find that 3% were Exclusives in both drug stores and grocery stores, while 38% were Favorites in both, 13% were Selectives in both, 4% were Avoiders in both, and 3% were Brandless in both. However, 27% had stronger levels of loyalty to grocery store brands than to drug store brands, while only 11% had stronger levels of loyalty to drug store brands than to grocery store brands. Whether examined by comparing the numbers for both categories among all Americans, or by directly comparing users of both categories, grocery stores in general have done a better job of creating brand loyalty than have drug stores.
GREY MATTER RESEARCH REPORT – EXPLORING LOYALTY TO DRUG STORE BRANDS 9
2%
3%
4%
6%
3%
2%
3%
3%
9%
7%
5%
9%
26%
31%
32%
32%
38%
39%
40%
42%
38%
48%
51%
60%
33%
30%
35%
28%
30%
38%
36%
33%
30%
28%
28%
21%
16%
15%
13%
13%
10%
10%
10%
12%
10%
9%
6%
7%
24%
21%
17%
22%
20%
10%
10%
10%
13%
8%
10%
4%
0% 20% 40% 60% 80% 100%
Furniture Stores
Convenience Stores
Shoe Stores
Religious Book Stores
General Book Stores
Department Stores
Clothing Stores
Consumer Electronics
Pet Products
Drug Stores
Home Improvement
Grocery Stores
Brand Loyalty to Retail Stores
Exclusives Favorites Selectives Avoiders Brandless

GREY MATTER RESEARCH REPORT – EXPLORING LOYALTY TO DRUG STORE BRANDS 10
BRAND LOYALTY AMONG CONSUMERS Brand loyalty can vary widely from brand to brand and from category to category, but there are some common traits we can evaluate through this research. Although this study does not encompass every possible retail category, it does cover 12 different categories that are commonly used by American consumers. To test across categories, Grey Matter Research used a regression model that evaluated a total of 10,801 observations across the 12 retail categories. When we look beyond the findings for individual retail categories and search for common themes about brand loyalty to retail categories among U.S. consumers, one of the most notable findings is that there are few notable findings. What we mean is that when brand loyalty is viewed across all 12 retail categories (among users of each category), there are not strong differences in levels of loyalty according to things such as age, gender, household income, race/ethnicity, marital status, or geography. For years, marketers have been looking for some sort of “Holy Grail” of loyalty. They’ve tried to find a particular type of person who has a high propensity for brand loyalty. Consultants who specialize in reaching certain segments of the population often like to tout how, if you just spend money reaching the segment they specialize in, that segment will be especially loyal (or how, since the segment they specialize in is rarely loyal to brands, you need their help to reach that segment effectively). You’ve probably heard generalizations such as, “Older consumers tend to be very brand loyal, while younger consumers have little loyalty.” Or maybe, “Latino consumers form much stronger loyalties to brands than do other types of consumers.” Unfortunately, at least when it comes to these 12 retail categories, there was very little differentiation in brand loyalty likelihood among various demographic segments. Actually, there was no overall tendency to be more loyal or less loyal to store brands according to either age or race/ethnicity. And while there were differences according to gender, household income, region of the country, and education, these differences were relatively small. In the regression model, the dependent variable (or outcome variable) in this case is ordered categories. An Exclusive in the grocery store category, for example, was given the highest possible score (5), while a Brandless grocery store shopper was given the lowest possible score (1). This same process was used to create the dependent variable, from all respondents across all of the tested retail categories. An ordered logit model was used to predict the outcome of the dependent variable (level of loyalty) given the range of independent variables (e.g. demographics, geography) in the model. In addition to the independent variables, each of the tested retail categories was controlled for in the model. This type of regression analysis allows for the prediction of probabilities, meaning the chances of someone exhibiting greater levels of brand loyalty across categories, based on the independent variables in the model. Of all the independent variables, five were found to be

GREY MATTER RESEARCH REPORT – EXPLORING LOYALTY TO DRUG STORE BRANDS 11
statistically significant. They were gender, educational attainment, household income, geographic region, and whether the respondent regularly attends religious worship services. Everything else equal, women were slightly more likely to be brand loyal than were men. Individuals with lower levels of education were more likely to be brand loyal than were people with higher levels of education. People with higher household incomes were more likely to be brand loyal than were those with lower household incomes. And respondents living in the Northeast and South were more likely to be brand loyal than were residents of the West or Midwest. The following table captures the probability that a respondent will be an Exclusive or a Favorite across the 12 retail categories, when all other independent variables are held constant at their respective means or medians.
Cross-category Brand Loyalty Variable Chances of Being Exclusives/Favorites Net Difference
Gender Women Men
5 points or 12% 46% 41%
Education No High School Degree Graduate Degree
5 points or 13% 38% 43%
Household
Income Under $20K More than $149K
6 points or 15% 45% 39%
Region Northeast Region Non-Northeast Region
8 points or 20% 49% 41%
Region Southern Region Non-Southern Region
4 points or 10% 45% 41%
Worship Services
Attends Services Does Not Attend Services 4 points or 11%
41% 37%
The data shows there are differences. But it also shows that these differences are relatively minor. For instance, women are 12% more likely than men to show loyalty to brands within these 12 tested categories. That is a statistically significant figure, but probably not enough of a difference on a practical level to make a dramatic change in most companies’ branding plans. The data is not suggesting that if an individual brand makes a targeted, concerted effort to reach a particular population segment that this effort will not be rewarded with greater brand loyalty. The branding process is full of anecdotal evidence that a determined effort to reach and speak relevantly to a particular population segment is often rewarded. The study is also not saying that there are no demographic differences in loyalty toward individual brands.

GREY MATTER RESEARCH REPORT – EXPLORING LOYALTY TO DRUG STORE BRANDS 12
What the data is saying is that there are no demographic segments of the population that already tend toward dramatically greater levels of loyalty regardless of the retail category or brand. This study helps explode the myth that older adults are naturally more brand loyal than younger adults, or that certain racial or ethnic groups tend towards greater levels of brand loyalty in general, or that higher-income consumers have very different levels of brand loyalty in general than do lower-income consumers – at least when it comes to retail categories. There are a few demographic differences when we examine the big picture, but these differences are modest and have a relatively soft impact on the likelihood of brand loyalty within individual retail categories. In essence, if younger adults or African-Americans or any other demographic group is highly loyal to your brand, it’s not because of their natural tendency toward brand loyalty – it’s because of their connection to your brand specifically. For drug store brands specifically, this says a couple of things. First, the difference in loyalty levels that existed for drug stores by age is relatively unique to drug stores – it is not just a trait that is common across different retail categories. The same is true of the difference for the drug store category by race/ethnicity. While differences exist by geography both for the drug store category specifically and for store brands overall, the differences were not the same. Across all categories, brand loyalty tended to be weakest in the West and the Midwest; for drug stores, brand loyalty was slightly weaker in the Northeast and Midwest. The second thing this regression model does is confirm that there are not that many individuals who are “brand loyal” or “not brand loyal” overall – loyalty depends largely on specific store brands, as well as on particular retail categories. It was not at all uncommon for a specific consumer to be an Avoider on drug stores, an Exclusive on book stores, a Favorite on shoe stores, and a total non-user on pet product stores, for example. Because someone has a high level of brand loyalty to Safeway, Menards, and Barnes & Noble (for instance) does not mean they’ll necessarily have any loyalty whatsoever to Walgreens.

GREY MATTER RESEARCH REPORT – EXPLORING LOYALTY TO DRUG STORE BRANDS 13
ALL ABOUT GREY MATTER Since 1996, Grey Matter Research & Consulting has been conducting both qualitative and quantitative research for a wide variety of clients, including numerous Fortune 500 companies. Our clients are highly diverse and our work is very broad-based, with experience in retail, financial services, grocery, publishing, automotive, health services, and a number of other sectors.
Results from these studies have been covered in the international media, such as USA Today, The Financial Times of London, Associated Press, MSNBC, Los Angeles Times, USA Radio Network, Dallas Morning News, Salem Radio Network, Manila Times, and many other outlets in the USA, China, England, Canada, Russia, New Zealand, Norway, Korea, Sweden, Hungary, the Philippines, Australia, and other parts of the world. Grey Matter Research is available to serve clients through privately commissioned research studies such as brand awareness, customer satisfaction, concept testing, and customer loyalty. More information on the company is available at www.greymatterresearch.com.
CLIENTS WE HAVE SERVED INCLUDE:
General Motors Caremark Macy’s Department Stores Coca-Cola LifeWay Christian Stores Suzuki BMW American Red Cross Dove Chocolates World Vision Hancock Bank Electronic Retailing Association Navistar Alzheimer’s Association Pulte Homes Audi Basha’s Supermarkets