Embed Size (px)
Citation preview

©20
14 N
atu
re A
mer
ica,
Inc.
All
rig
hts
res
erve
d.
brief communications
nature methods | VOL.11 NO.11 | NOVEMBER 2014 | 1127
interrogate the mechanical behavior of different proteins in a parallel and streamlined format with the same cantilever would offer distinct advantages. Such a screening approach could char-acterize single-molecule properties such as unfolding forces, interdomain mechanical signatures and mechanically activated catch-bond behavior1. Screening of these properties could find applications in biotechnology and human health studies in which mechanical dysregulation or misfolding is suspected to play a role in pathology11.
Here we developed a platform for parallel characterization of individual protein mechanics in a single experiment (Fig. 1). Microspotted gene arrays were used to synthesize fusion proteins in situ using cell-free gene expression. Proteins were covalently immobilized inside multilayer microfluidic circuits. A single can-tilever was then positioned above the protein array and used to probe the mechanical response of each individual protein via a common C-terminal dockerin (Doc) fusion tag. Genes of interest were chosen such that each gene product exhibited an identifiable unfolding pattern when loaded from the N to the C terminus. Each target protein was expressed with an N-terminal 11-amino-acid ybbR tag, which was used to covalently and site-specifically link the protein to the surface via Sfp synthase–catalyzed reaction with coenzyme A (CoA)12. At the C terminus the proteins contained a 75-amino-acid cellulosomal Doc from Clostridium thermocellum13 as a specific handle targeted by the cohesin (Coh)-modified cantilever.
The gene microarray was aligned and reversibly bonded to a microfluidic chip known as MITOMI (mechanically induced trapping of molecular interactions). The chip has been used in the past for screening transcription factors14,15 and mapping interac-tion networks16. More recently, our group employed MITOMI chips for molecular force assays17. In this work, MITOMI chips featured 640 dumbbell-shaped unit cells in a flow layer and 2,004 micromechanical valves in a control layer. Each unit cell was equipped with pneumatic ‘neck’, ‘sandwich’ and ‘button’ valves (Fig. 1a) according to design principles of soft lithography18. Each neck valve protected the microspotted DNA in the back cham-ber from exposure to other reagents during surface patterning in the front chamber. The sandwich valves prevented chamber- to-chamber cross contamination, ensuring that only a single protein variant was present in each sample spot. For surface chemistry in the front chamber, the button valves were actuated to shield the sample spots, allowing n-dodecyl β-d-maltoside passivation in the surrounding area. Releasing the button valves allowed subsequent functionalization with CoA-poly(ethylene glycol) (CoA-PEG) in the sample area under the buttons serving as the protein immobilization site. We expressed the genes by
from genes to protein mechanics on a chipMarcus Otten1,2,4, Wolfgang Ott1,2,4, Markus A Jobst1,2,4, Lukas F Milles1,2, Tobias Verdorfer1,2, Diana A Pippig1–3, Michael A Nash1,2 & Hermann E Gaub1,2
single-molecule force spectroscopy enables mechanical testing of individual proteins, but low experimental throughput limits the ability to screen constructs in parallel. We describe a microfluidic platform for on-chip expression, covalent surface attachment and measurement of single-molecule protein mechanical properties. a dockerin tag on each protein molecule allowed us to perform thousands of pulling cycles using a single cohesin-modified cantilever. the ability to synthesize and mechanically probe protein libraries enables high-throughput mechanical phenotyping.
Mechanical forces play a pivotal role in biological systems by performing tasks such as guiding cell adhesion1, inducing gene expression patterns2 and directing stem cell differentiation3. At the molecular level, mechanosensitive proteins act as sensors and transducers, communicating the presence and direction of applied forces to downstream signaling cascades. Conformational changes in response to mechanical forces4 and energetic barriers along unfolding pathways can be probed by single-molecule force spec-troscopy (SMFS) techniques4. Such techniques, including optical tweezers, magnetic tweezers and atomic force microscopy (AFM), have been used to interrogate high-affinity receptor-ligand bind-ing5, measure unfolding and refolding dynamics of individual protein domains6–8, observe base-pair stepping of RNA polymer-ases9 and identify DNA stretching and twisting moduli10.
Despite these successes, SMFS experiments have been limited by low throughput. Experimental data sets typically contain a majority of unusable force-distance traces owing to the measure-ment of multiple molecular interactions in parallel or a lack of spe-cific interactions. Typical yields of interpretable single-molecule interaction traces in SMFS experiments vary between 1% and 25%. The incapacity of SMFS to quickly screen libraries of molecular variants has hindered progress toward understanding sequence-structure-function relationships at the single-molecule level. In particular, the need to prepare each protein sample and cantilever separately increases experimental workload and gives rise to calibration uncertainties. Therefore, methods to
1Lehrstuhl für Angewandte Physik, Ludwig-Maximilians-Universität, Munich, Germany. 2Center for Nanoscience (CeNS), Ludwig-Maximilians-Universität, Munich, Germany. 3Center for Integrated Protein Science Munich (CIPSM), Ludwig-Maximilians-Universität, Munich, Germany. 4These authors contributed equally to this work. Correspondence should be addressed to M.A.N. ([email protected]).Received 3 MaRch; accepted 29 July; published online 7 septeMbeR 2014; coRRected aFteR pRint 5 noveMbeR 2014; doi:10.1038/nMeth.3099
©20
14 N
atu
re A
mer
ica,
Inc.
All
rig
hts
res
erve
d.
1128 | VOL.11 NO.11 | NOVEMBER 2014 | nature methods
brief communications
incubating an in vitro transcription and translation cell extract at 37 °C with the spotted DNA in the back chamber. The syn-thesized proteins then diffused to the front chamber, where they were covalently linked to the surface via an Sfp-catalyzed reac-tion of surface-bound CoA with solution-phase N-terminal ybbR peptide tags (Fig. 1b). Partial pressurization of the button valve19 was used for tagging an outer concentric portion of the sample area with a fluorescently (TagRFP) tagged Coh that specifically bound to the C-terminal Doc tag of each target protein, thereby confirming successful protein synthesis and surface immobiliza-tion (Supplementary Fig. 1). Finally, the microfluidic device was removed from the glass slide to provide access to the protein array from above. Using this approach, we generated microarrays of site-specifically and covalently immobilized proteins for subsequent SMFS experiments, starting from a conventional gene array.
An inverted three-channel total-internal-reflection fluorescence/atomic force microscope (TIRF-AFM)20 was used to position the cantilever in the center of the fluorescent rings in the protein array and perform SMFS measurements (Fig. 1c). The Coh-modified cantilever was used to probe the surface for expressed target proteins containing the C-terminal Doc tag. Upon surface contact of the cantilever, formation of a Coh-Doc
complex allowed measurement of target-protein unfolding in a well-controlled pulling geometry (N to C terminus). We retracted the probe at constant velocity and recorded force-extension traces that characterized the unfolding fingerprint of the target protein. This approach-retract process could be repeated many times at each array address to characterize each expression construct.
Several unique features of the C-terminal Doc tag make it particularly suitable as a protein handle for SMFS. Its small size of 8 kDa does not notably add to the molecular weight of the gene products, which is advantageous for cell-free expression. Additionally, Doc exhibits a specific and high-affinity inter-action with Coh domains from the C. thermocellum scaffold protein CipA. Coh was used both for fluorescence detection of the expression constructs and for modification of the cantilever. On the basis of our prior work, the Coh-Doc interaction is character-ized to be high affinity, with a dissociation constant Kd in the low nanomolar range and rupture forces >125 pN at a loading rate of 10 nN/s (ref. 21). Our prior work also indicated that upon forced dissociation, Doc exhibited a characteristic double sawtooth rup-ture peak with a contour length increment of 8 nm separating the two peaks. We used this two-pronged double rupture event at the end of each force-extension trace as a positive indicator
DNAmicroarraya b cMicrofluidic
chip
PDMS chip
Glass slide
DNAchamber
Sandwich valves
Buttonvalve
DNAExpression
andimmobilization
15 p.s.i.
13 p.s.i.
Force assay
TIRFalignment
Siliconnanoprobe
T7 promoterRBSybbR tagHis (×6)
Geneof interest
Dockerin
T7 term.
DDM PEG-CoA TagRFP Cohesin DockerinProtein
of interest
Neckvalve
SpottedDNA
Surfacechemistry
In vitroexpression
Proteinmicroarray
Single-moleculeAFM
Protein
cha m ber
figure 1 | Method workflow. (a) A gene array was spotted onto a glass slide. Genes were designed with a common set of flanking sequences, including a T7 promoter region, ybbR tag, dockerin tag and T7 terminator (term.). The multilayer microfluidic chip featuring 640 unit cells was aligned to the DNA microarray and bonded to the glass slide. Each unit cell comprised a DNA chamber, a protein chamber, and superseding elastomeric control valves actuated by pneumatic pressure. PDMS, poly(dimethylsiloxane). (b) Control valves were used for spatially selective surface modification of each protein chamber with poly(ethylene glycol)–coenzyme A (PEG-CoA) and for fluidic isolation of each chamber before in vitro expression of the microspotted DNA. Fluorescence labeling with TagRFP-cohesin was achieved by partial button-valve pressurization, leaving only an outer concentric ring of immobilized gene products exposed to the labeling solution. DDM, n-dodecyl β-d-maltoside. (c) After removal of the microfluidic device, the resulting well-defined, covalently attached protein microarray was accessed from above with a cohesin-functionalized atomic force microscope (AFM) cantilever. Single-molecule unfolding traces of each of the protein constructs were thus acquired sequentially at each corresponding array address with a single cantilever in a single experiment.
a b c dFibronectin tetramer
Glass slide
For
ce (
pN) 150
150 200
Spectrin dimer Xylanase monomer sfGFP monomer
100
100
50
50
0
0 150 200100500 150 200100Distance (nm)
500 150 200100500
∆LcFBN ∆Lc
SPN ∆LcXYL ∆Lc
GFP
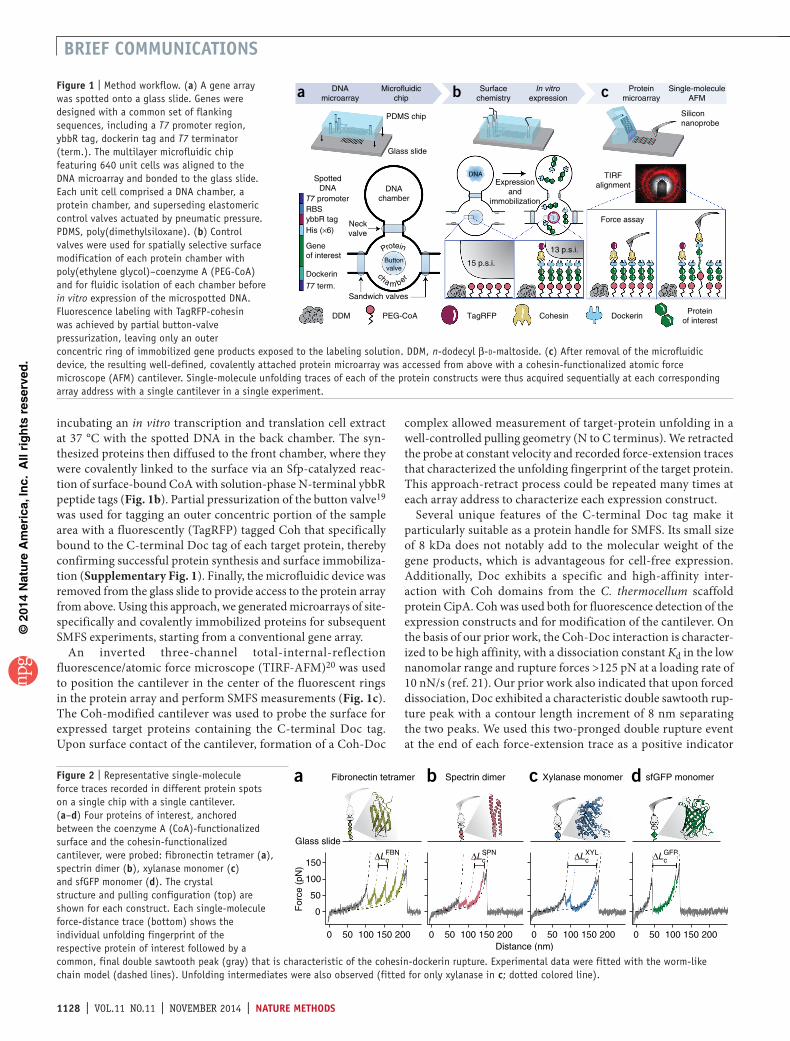
figure 2 | Representative single-molecule force traces recorded in different protein spots on a single chip with a single cantilever. (a–d) Four proteins of interest, anchored between the coenzyme A (CoA)-functionalized surface and the cohesin-functionalized cantilever, were probed: fibronectin tetramer (a), spectrin dimer (b), xylanase monomer (c) and sfGFP monomer (d). The crystal structure and pulling configuration (top) are shown for each construct. Each single-molecule force-distance trace (bottom) shows the individual unfolding fingerprint of the respective protein of interest followed by a common, final double sawtooth peak (gray) that is characteristic of the cohesin-dockerin rupture. Experimental data were fitted with the worm-like chain model (dashed lines). Unfolding intermediates were also observed (fitted for only xylanase in c; dotted colored line).

©20
14 N
atu
re A
mer
ica,
Inc.
All
rig
hts
res
erve
d.
nature methods | VOL.11 NO.11 | NOVEMBER 2014 | 1129
brief communications
that the gene of interest was completely expressed through to the C terminus (Fig. 2). Furthermore, this double rupture peak indicated that the interaction with the Coh-modified cantilever was specific and that the pulling geometry was strictly controlled such that force was applied to the molecule of interest from the N to the C terminus.
To validate and demonstrate our approach, we expressed genes of interest comprising well-known fingerprint domains in the SMFS literature. We produced multimeric polyproteins including tetra-meric human type-III fibronectin (FBN)22 and dimeric chicken brain α-spectrin (SPN)23. We also synthesized monomers of endo-1,4-xylanase T6 from Geobacillus stearothermophilus (XYL)21, superfolder GFP (GFP)24 and twitchin kinase25. In all cases, the target proteins were fused to N-terminal ybbR and C-terminal Doc tags (Supplementary Figs. 2–6). Unfolding data for FBN, SPN, XYL and GFP were obtained using a single cantilever to probe a single microarray (Figs. 2 and 3). Twitchin kinase was found not to express in sufficient yield to provide reliable unfolding statistics.
We transformed force-extension data (Fig. 2) into contour length space26 using the worm-like chain model and compared the measured contour length increments with the amino acid sequence lengths of each protein and literature values. The observed con-tour lengths and rupture forces were consistent with our expec-tations. FBN showed a fourfold-repeated sequence of rupture peaks at contour length increments of 32 nm (∆Lc
FBN; Fig. 2a) frequently interrupted by an intermediate peak at 10–12 nm, both features characteristic of FBN22. SPN showed two regular sawtooth-like peaks with contour lengths of 33 nm (∆Lc
SPN; Fig. 2b)23. XYL exhibited a decreasing multipeaked unfolding fingerprint with a contour length increment of 92 nm (∆Lc
XYL; Fig. 2c), occasionally showing additional increments corresponding to unfolding of remaining XYL subdomains, a result consistent with the prior study and accounting for N-terminal immobilization of XYL21. GFP unfolding showed a contour length increment of 74 nm (∆Lc
GFP; Fig. 2d)24. As each protein in the array contained the same C-terminal Doc tag, the final two rupture peaks in all force traces represented rupture of the Coh-Doc complex regard-less of the protein of interest.
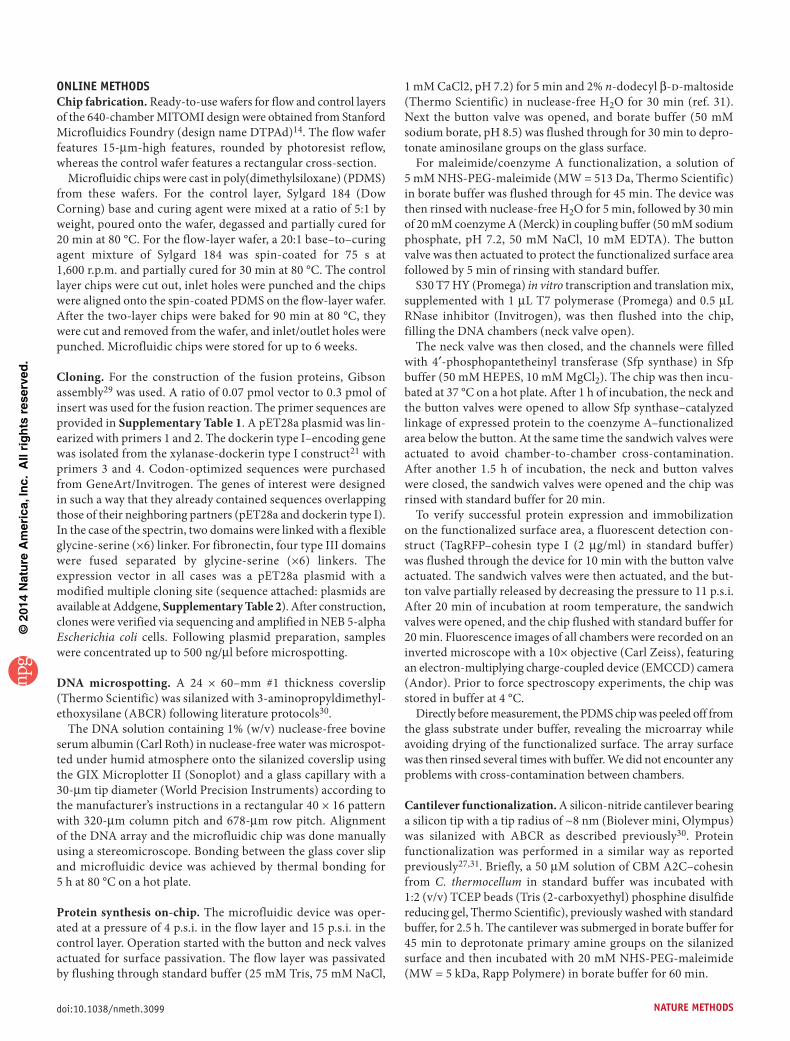
In our system, surface densities of expressed proteins were comparable to those obtained in conventional SMFS experiments. Uninterpretable and nonspecific interactions were excluded from the analysis (Supplementary Fig. 7). By collecting multiple unfolding traces, we assembled contour length diagrams for each protein of interest26,27 (Fig. 3a) and confirmed the predicted con-tour length increments on the basis of the encoded amino acid sequences in each DNA spot. Coh-Doc rupture events for all protein constructs in the array clustered to the same population in the force-loading rate plot, independently of the preceding
rupture peaks from the protein of interest (Fig. 3b). The Coh-Doc ruptures agreed with previously reported values at similar loading rates21. The unfolding events of the proteins of interest produced distinct populations in the force-loading rate plots (Fig. 3c). The unfolding events depended on the internal structure and the unfold-ing pathway of the fingerprint domain when stretched between its N and C termini. SPN, for example, an elongated 3-helix bundle, was previously reported to exhibit a broader energy well (∆x = 1.7 nm; ref. 23) and showed a flatter distribution of unfolding forces than that of the more compact globular FBN domain with a shorter, steeper potential (∆x = 0.4 nm; ref. 22).
In summary, our flexible approach efficiently streamlines pro-tein expression, purification and SMFS into a single integrated platform (Supplementary Discussion). The approach should be compatible with other in vitro expression systems including extracts derived from insects, rabbit reticulocytes and human cell lines, and it is capable of introducing post-translational modifications and non-natural amino acids, allowing, for exam-ple, the screening of site-directed mutants. Our method allows for synthesis of cytotoxic proteins or proteins with a tendency to form inclusion bodies during bulk expression. In addition to provid-ing greatly improved throughput, our system has the advantage of measuring multiple constructs with one cantilever, thereby eliminating errors introduced when performing multiple cali-brations on different samples with uncertainties of ~10% (ref. 28). Detecting subtle differences in mechanical stability with this high-throughput approach could therefore be used to perform mechanical phenotyping experiments on similarly stable families of mutant proteins. This workflow opens the door to large-scale screening studies of protein nanomechanical properties.
methodsMethods and any associated references are available in the online version of the paper.
Accession codes. Addgene: pET28a-ybbR-HIS-sfGFP-DocI, 58708; pET28a-ybbR-HIS-CBM-CohI, 58709; pET28a-StrepII-TagRFP-CohI, 58710; pET28a-ybbR-HIS-Xyl-DocI, 58711;
0.8 160
Cohesin-dockerinfibronectinCohesin-dockerinspectrinCohesin-dockerinxylanaseCohesin-dockerinsfGFP
FibronectinSpectrinXylanasesfGFP
120
80
Rup
ture
forc
e (p
N)
Unf
oldi
ng fo
rce
(pN
)
40
0
160
120
80
40
0
102 103 104
Force loading rate (pN/s)
Fibronectintetramer
a b
c
Spectrindimer
Xylanasemonomer
sfGFPmonomer
Fre
quen
cy (
a.u.
)
∆LcFBN
∆LcSPN
∆LcXYL
∆LcGFP
0.4
0
0.8
0.4
0
0.8
0.4
0
0.8
0.4
00 50 100 150 200 250 300
Contour length (nm)
figure 3 | Unfolding and rupture statistics from multiple force traces. (a) Relative frequency of observing given contour lengths determined by transforming and aligning multiple force traces into contour length space via the worm-like chain model. Shown are diagrams for the fibronectin tetramer (n = 27, ∆Lc
FBN = 33 nm), spectrin dimer (n = 50, ∆LcSPN = 34 nm),
xylanase monomer (n = 91, ∆LcXYL = 93 nm) and sfGFP monomer (n = 25,
∆LcGFP = 79 nm). (b) Rupture force versus loading rate of the final cohesin-
dockerin dissociation event. (c) Unfolding force versus loading rate for each protein of interest. The populations in b and c were fitted with two-dimensional Gaussians. Respective means and s.d. are plotted in the corresponding colors as solid symbols and error bars. a.u., arbitrary units.

©20
14 N
atu
re A
mer
ica,
Inc.
All
rig
hts
res
erve
d.
1130 | VOL.11 NO.11 | NOVEMBER 2014 | nature methods
brief communications
pET28a-ybbR-HIS-10FNIII(x4)-DocI, 58712; pET28a-ybbR-HIS-Spec(x2)-DocI, 58713.
Note: Any Supplementary Information and Source Data files are available in the online version of the paper.
acknoWledgmentsM.O. is grateful to the Elite Network of Bavaria (IDK-NBT) for a doctoral fellowship. M.A.N. acknowledges support from Society in Science—The Branco Weiss Fellowship administered by the ETH Zürich. The authors acknowledge support from the DFG Sonderforschungsbereich 1032 and the European Research Council Grant Cellufuel (Advanced Grant 294438). The authors thank E. Bayer (Weizmann Institute) for starting genetic materials used for Doc and Coh modules.
author contributionsM.O., M.A.N. and H.E.G. designed the research; M.O., W.O., M.A.J. and T.V. performed experiments; D.A.P. helped with immobilization strategies; M.O., W.O., M.A.J., L.F.M. and M.A.N. performed data analysis; M.O., W.O., M.A.J., M.A.N. and H.E.G. cowrote the manuscript.
comPeting financial interestsThe authors declare no competing financial interests.
reprints and permissions information is available online at http://www.nature.com/reprints/index.html.
1. Thomas, W.E., Trintchina, E., Forero, M., Vogel, V. & Sokurenko, E.V. Cell 109, 913–923 (2002).
2. Li, C. & Xu, Q. Cell. Signal. 12, 435–445 (2000).3. Engler, A.J., Sen, S., Sweeney, H.L. & Discher, D.E. Cell 126, 677–689 (2006).4. Müller, D., Helenius, J., Alsteens, D. & Dufrêne, Y.F. Nat. Chem. Biol. 5,
383–390 (2009).5. Florin, E.-L., Moy, V.T. & Gaub, H.E. Science 264, 415–417 (1994).
6. Rief, M., Gautel, M., Oesterhelt, F., Fernandez, J. & Gaub, H. Science 276, 1109–1112 (1997).
7. Fernandez, J.M. & Li, H. Science 303, 1674–1678 (2004).8. Oesterhelt, F. et al. Science 288, 143–146 (2000).9. Abbondanzieri, E.A., Greenleaf, W.J., Shaevitz, J.W., Landick, R. &
Block, S.M. Nature 438, 460–465 (2005).10. Bryant, Z. et al. Nature 424, 338–341 (2003).11. Linke, W.A. Cardiovasc. Res. 77, 637–648 (2008).12. Yin, J. et al. Proc. Natl. Acad. Sci. USA 102, 15815–15820 (2005).13. Bayer, E.A., Belaich, J.-P., Shoham, Y. & Lamed, R. Annu. Rev. Microbiol.
58, 521–554 (2004).14. Maerkl, S.J. & Quake, S.R. Science 315, 233–237 (2007).15. Rockel, S., Geertz, M., Hens, K., Deplancke, B. & Maerkl, S.J. Nucleic Acids
Res. 41, e52 (2013).16. Gerber, D., Maerkl, S.J. & Quake, S.R. Nat. Methods 6, 71–74 (2009).17. Otten, M., Wolf, P. & Gaub, H.E. Lab Chip 13, 4198–4204 (2013).18. Thorsen, T., Maerkl, S.J. & Quake, S.R. Science 298, 580–584 (2002).19. Garcia-Cordero, J.L. & Maerkl, S.J. Chem. Commun. 49, 1264–1266 (2013).20. Gumpp, H., Stahl, S.W., Strackharn, M., Puchner, E.M. & Gaub, H.E. Rev.
Sci. Instrum. 80, 063704 (2009).21. Stahl, S.W. et al. Proc. Natl. Acad. Sci. USA 109, 20431–20436
(2012).22. Li, L., Huang, H.H.-L., Badilla, C.L. & Fernandez, J.M. J. Mol. Biol. 345,
817–826 (2005).23. Rief, M., Pascual, J., Saraste, M. & Gaub, H.E. J. Mol. Biol. 286, 553–561
(1999).24. Dietz, H. & Rief, M. Proc. Natl. Acad. Sci. USA 103, 1244–1247 (2006).25. Greene, D.N. et al. Biophys. J. 95, 1360–1370 (2008).26. Puchner, E.M., Franzen, G., Gautel, M. & Gaub, H.E. Biophys. J. 95,
426–434 (2008).27. Jobst, M.A., Schoeler, C., Malinowska, K. & Nash, M.A. J. Vis. Exp. 82,
e50950 (2013).28. Gibson, C.T., Smith, D.A. & Roberts, C.J. Nanotechnology 16, 234–238
(2005).
©20
14 N
atu
re A
mer
ica,
Inc.
All
rig
hts
res
erve
d.
doi:10.1038/nmeth.3099 nature methods
online methodsChip fabrication. Ready-to-use wafers for flow and control layers of the 640-chamber MITOMI design were obtained from Stanford Microfluidics Foundry (design name DTPAd)14. The flow wafer features 15-µm-high features, rounded by photoresist reflow, whereas the control wafer features a rectangular cross-section.
Microfluidic chips were cast in poly(dimethylsiloxane) (PDMS) from these wafers. For the control layer, Sylgard 184 (Dow Corning) base and curing agent were mixed at a ratio of 5:1 by weight, poured onto the wafer, degassed and partially cured for 20 min at 80 °C. For the flow-layer wafer, a 20:1 base–to–curing agent mixture of Sylgard 184 was spin-coated for 75 s at 1,600 r.p.m. and partially cured for 30 min at 80 °C. The control layer chips were cut out, inlet holes were punched and the chips were aligned onto the spin-coated PDMS on the flow-layer wafer. After the two-layer chips were baked for 90 min at 80 °C, they were cut and removed from the wafer, and inlet/outlet holes were punched. Microfluidic chips were stored for up to 6 weeks.
Cloning. For the construction of the fusion proteins, Gibson assembly29 was used. A ratio of 0.07 pmol vector to 0.3 pmol of insert was used for the fusion reaction. The primer sequences are provided in Supplementary Table 1. A pET28a plasmid was lin-earized with primers 1 and 2. The dockerin type I–encoding gene was isolated from the xylanase-dockerin type I construct21 with primers 3 and 4. Codon-optimized sequences were purchased from GeneArt/Invitrogen. The genes of interest were designed in such a way that they already contained sequences overlapping those of their neighboring partners (pET28a and dockerin type I). In the case of the spectrin, two domains were linked with a flexible glycine-serine (×6) linker. For fibronectin, four type III domains were fused separated by glycine-serine (×6) linkers. The expression vector in all cases was a pET28a plasmid with a modified multiple cloning site (sequence attached: plasmids are available at Addgene, Supplementary Table 2). After construction, clones were verified via sequencing and amplified in NEB 5-alpha Escherichia coli cells. Following plasmid preparation, samples were concentrated up to 500 ng/µl before microspotting.
DNA microspotting. A 24 × 60–mm #1 thickness coverslip (Thermo Scientific) was silanized with 3-aminopropyldimethyl-ethoxysilane (ABCR) following literature protocols30.
The DNA solution containing 1% (w/v) nuclease-free bovine serum albumin (Carl Roth) in nuclease-free water was microspot-ted under humid atmosphere onto the silanized coverslip using the GIX Microplotter II (Sonoplot) and a glass capillary with a 30-µm tip diameter (World Precision Instruments) according to the manufacturer’s instructions in a rectangular 40 × 16 pattern with 320-µm column pitch and 678-µm row pitch. Alignment of the DNA array and the microfluidic chip was done manually using a stereomicroscope. Bonding between the glass cover slip and microfluidic device was achieved by thermal bonding for 5 h at 80 °C on a hot plate.
Protein synthesis on-chip. The microfluidic device was oper-ated at a pressure of 4 p.s.i. in the flow layer and 15 p.s.i. in the control layer. Operation started with the button and neck valves actuated for surface passivation. The flow layer was passivated by flushing through standard buffer (25 mM Tris, 75 mM NaCl,
1 mM CaCl2, pH 7.2) for 5 min and 2% n-dodecyl β-d-maltoside (Thermo Scientific) in nuclease-free H2O for 30 min (ref. 31). Next the button valve was opened, and borate buffer (50 mM sodium borate, pH 8.5) was flushed through for 30 min to depro-tonate aminosilane groups on the glass surface.
For maleimide/coenzyme A functionalization, a solution of 5 mM NHS-PEG-maleimide (MW = 513 Da, Thermo Scientific) in borate buffer was flushed through for 45 min. The device was then rinsed with nuclease-free H2O for 5 min, followed by 30 min of 20 mM coenzyme A (Merck) in coupling buffer (50 mM sodium phosphate, pH 7.2, 50 mM NaCl, 10 mM EDTA). The button valve was then actuated to protect the functionalized surface area followed by 5 min of rinsing with standard buffer.
S30 T7 HY (Promega) in vitro transcription and translation mix, supplemented with 1 µL T7 polymerase (Promega) and 0.5 µL RNase inhibitor (Invitrogen), was then flushed into the chip, filling the DNA chambers (neck valve open).
The neck valve was then closed, and the channels were filled with 4′-phosphopantetheinyl transferase (Sfp synthase) in Sfp buffer (50 mM HEPES, 10 mM MgCl2). The chip was then incu-bated at 37 °C on a hot plate. After 1 h of incubation, the neck and the button valves were opened to allow Sfp synthase–catalyzed linkage of expressed protein to the coenzyme A–functionalized area below the button. At the same time the sandwich valves were actuated to avoid chamber-to-chamber cross-contamination. After another 1.5 h of incubation, the neck and button valves were closed, the sandwich valves were opened and the chip was rinsed with standard buffer for 20 min.
To verify successful protein expression and immobilization on the functionalized surface area, a fluorescent detection con-struct (TagRFP–cohesin type I (2 µg/ml) in standard buffer) was flushed through the device for 10 min with the button valve actuated. The sandwich valves were then actuated, and the but-ton valve partially released by decreasing the pressure to 11 p.s.i. After 20 min of incubation at room temperature, the sandwich valves were opened, and the chip flushed with standard buffer for 20 min. Fluorescence images of all chambers were recorded on an inverted microscope with a 10× objective (Carl Zeiss), featuring an electron-multiplying charge-coupled device (EMCCD) camera (Andor). Prior to force spectroscopy experiments, the chip was stored in buffer at 4 °C.
Directly before measurement, the PDMS chip was peeled off from the glass substrate under buffer, revealing the microarray while avoiding drying of the functionalized surface. The array surface was then rinsed several times with buffer. We did not encounter any problems with cross-contamination between chambers.
Cantilever functionalization. A silicon-nitride cantilever bearing a silicon tip with a tip radius of ~8 nm (Biolever mini, Olympus) was silanized with ABCR as described previously30. Protein functionalization was performed in a similar way as reported previously27,31. Briefly, a 50 µM solution of CBM A2C–cohesin from C. thermocellum in standard buffer was incubated with 1:2 (v/v) TCEP beads (Tris (2-carboxyethyl) phosphine disulfide reducing gel, Thermo Scientific), previously washed with standard buffer, for 2.5 h. The cantilever was submerged in borate buffer for 45 min to deprotonate primary amine groups on the silanized surface and then incubated with 20 mM NHS-PEG-maleimide (MW = 5 kDa, Rapp Polymere) in borate buffer for 60 min.

©20
14 N
atu
re A
mer
ica,
Inc.
All
rig
hts
res
erve
d.
doi:10.1038/nmeth.3099nature methods
The cantilever was rinsed sequentially in three beakers of deionized H2O. TCEP beads were separated from the protein solution by centrifugation at 1,000g for 1 min. Next the cantilever was incubated for 60 min with reduced protein solution, which was diluted to a concentration of 1 mg/mL with standard buffer. Finally the cantilever was rinsed sequentially in three beakers of standard buffer and stored submerged in standard buffer in humid atmosphere at 4 °C for up to 24 h before use.
Force spectroscopy. A custom-built TIRF (total internal reflec-tion fluorescence)-AFM (atomic force microscope) hybrid20,30 was used to conduct the force spectroscopy measurements. The TIRF microscope was used to image fluorophores in up to three different color channels simultaneously using an iChrome MLE-S four-color laser (Toptica Photonics), an Optosplit III triple emis-sion image splitter (Cairn Research) and a Xion3 EMCCD camera (Andor). A long-range stick-slip xy piezo nanopositioning sys-tem (ANC350, Attocube Systems) allowed access to the whole microchip array as well as fine spatial sampling of different sur-face molecules on the nanometer scale within each protein spot. Cantilever actuation in the z direction was performed by a LISA piezo-actuator (Physik Instrumente) driven by an MFP3D AFM controller (Asylum Research).
The following force spectroscopy protocol was performed repeatedly in each functionalized protein target area. The canti-lever approach velocity was 3,000 nm/s, dwell time at the surface was 10 ms and retract velocity was 800 nm/s. Data were recorded with 6,250-Hz sampling rate. The cantilever typically had a spring constant in the range of 100 pN/nm and a resonance frequency of 25 kHz in water. Accurate calibration of the system was performed by the nondestructive thermal method32,33 using corrections to account for discrepancies from the original theory27,34.
Data and statistical analysis. The raw data were converted from photodiode voltages into force values in newtons, and the follow-ing standard corrections were applied. The zero force value for the unloaded cantilever in each curve was determined by averaging over 40-nm extension after the final complex rupture and sub-tracting this value from each force value in the curve. The position of the surface was determined by finding the force value closest to 0 in a small neighborhood of the first non-negative force value in the force-extension trace. The z piezo position was corrected for the true tip-sample separation due to deflection of the lever as a function of the force for a Hookean spring.
A pattern-recognition software based on a package described previously26 and adapted in-house chose the curves show-ing worm-like chain force responses of the stretched protein constructs. Example curves showing multiple, unspecific or no interactions are shown in Supplementary Figure 7, together with a single xylanase trace for comparison. The expected protein backbone contour length increments for each construct were detected in contour length space: the real part of the following numerically solved inverse worm-like chain (WLC) formula27
was used to transform force-extension data into force–contour length space for every measured force curve:
L xx
uu
u u
g ug u( )
( )( )= + + − + +
6
3 49 3 4 2
where
g u u u u u u( ) ( )= − + − + − − −( )
27
27
236 8
3 3
24 3 1082 3 2 3
1
3
and
u F
L
kT= p
with L the contour length, x the extension, F the force, Lp the persistence length, k Boltzmann’s constant and T the temperature. Transformed data points were combined in a Gaussian kernel density estimate with a bandwidth of 1 nm and plotted with a resolution of 1 nm. In these resulting energy-barrier position dia-grams, the contour length increments could easily be determined. The transformation was performed with the following parameters: persistence length Lp = 0.4 nm, thermal energy kT = 4.1 pN nm. Force and distance thresholds were applied at 10 pN and 5 nm, respectively. The measurement data sets in each protein spot on the chip typically showed a yield of 0.5–5% specific interactions.
The force peaks corresponding to protein domain unfolding events, as well as those corresponding to final ruptures, were line fitted in force-time space to measure the loading rate of each individual event.
WLC fits for demonstrative purposes in Figure 2 were done by using the following formula:
F x
kT
L x L
x
L( )
( / )=
−+ −
p
1
4 1
1
42
with F the force, k the Boltzmann’s constant, T the temperature, Lp the persistence length, x the extension and L the contour length.
Discrepancies between contour length increments in fitted single-molecule traces and aligned contour length diagrams are artifacts caused by the fixed persistence length in the contour length transformation, whereas the WLC fits to single force traces treat both contour length and persistence length of each stretch as free parameters. An overview of the yield of interpretable curves of all constructs is available in Supplementary Table 3.
29. Gibson, D.G. et al. Nat. Methods 6, 343–345 (2009).30. Zimmermann, J.L., Nicolaus, T., Neuert, G. & Blank, K. Nat. Protoc. 5,
975–985 (2010).31. Huang, B., Wu, H., Kim, S. & Zare, R.N. Lab Chip 5, 1005–1007 (2005).32. Hutter, J.L. & Bechhoefer, J. Rev. Sci. Instrum. 64, 1868 (1993).33. Cook, S.M. et al. Nanotechnology 17, 2135–2145 (2006).34. Proksch, R., Schäffer, T.E., Cleveland, J.P., Callahan, R.C. & Viani, M.B.
Nanotechnology 15, 1344–1350 (2004).

Corrigendum: From genes to protein mechanics on a chipMarcus Otten, Wolfgang Ott, Markus A Jobst, Lukas F Milles, Tobias Verdorfer, Diana A Pippig, Michael A Nash & Hermann E GaubNat. Methods 11, 1127–1130 (2014); published online 7 September 2014; corrected after print 5 November 2014
In the version of this article initially published, the grant “European Research Council Grant Cellufuel (Advanced Grant 294438)” was mistakenly left out of the Acknowledgements. The error has been corrected in the HTML and PDF versions of the article.
NATURE METHODS
CORRIGENDAnp
g©
2014
Nat
ure
Am
eric
a, In
c. A
ll rig
hts
rese
rved
.