Embed Size (px)
Citation preview

From Grand Bargain to beneficiaryAn analysis of funding flows through the humanitarian systemTasneem Mowjee, Lydia Poole and Barnaby Willitts-King
May 2017
HPG Commissioned Report
HPGHumanitarianPolicy Group
About the authorsBarnaby Willitts-King is a Senior Research Fellow with the Humanitarian Policy Group (HPG) at the Overseas Development Institute (ODI).
Tasneem Mowjee is Director of the Policy2Practice Team
Lydia Poole is an independent humanitarian consultant
AcknowledgmentsThis study has been produced with the financial assistance of the European Commission. Sole responsibility for the views, interpretations or conclusions contained in it lies with the authors.
The document is protected by copyright. Permission is granted to reproduce for personal and educational use only. Commercial copying, hiring, lending is prohibited.
Humanitarian Policy GroupOverseas Development Institute203 Blackfriars RoadLondon SE1 8NJUnited Kingdom
Tel. +44 (0) 20 7922 0300Fax. +44 (0) 20 7922 0399E-mail: [email protected]: http://www.odi.org/hpg
© Overseas Development Institute, 201
i
Executive summary 1
1 Introduction 5
2 Methodology 7
2.1 Project selection 7
2.2 Data collection 8
2.3 Risks and limitations 9
3 Study findings 11
3.1 How much funding is going to beneficiaries? 11
3.2 What each stage in the chain cost in total? 16
3.3 What is the total volume of funding spent by implementing partners? 19
3.4 What are the principal roles of each actor 20
4 Summary of findings and options for further research 23
4.1 Options for further research 24
Annex 1. Terms of reference 25
Contents
1
The Directorate-General for European Civil Protection and Humanitarian Aid Operations (ECHO) commissioned this study through the Inspire Consortium policy support agreement. The Humanitarian Policy Group (HPG) undertook the research.
The study undertook a financial analysis of a range of projects that received ECHO funding in order to answer the following questions listed in full in the terms of reference (Annex 1):
• How much donor money (net) gets to the beneficiary?
• What are the total costs of each stage in the chain?1 • What is the total volume of funding implemented
by a local partner and how much of this reaches the beneficiary?
• What are the principal role(s) of each actor in the chain?
The study contributes to the discussions around the Grand Bargain – an agreement between donors and aid providers that aims to get more resources into the hands of those in need. The Grand Bargain includes steps towards improving the transparency and efficiency of the humanitarian system. By providing a better understanding of different types of costs and how donor funding flows through the humanitarian system. It will also help to inform efforts towards empowering national and local humanitarian action – a core commitment at the World Humanitarian Summit..
This study focuses on the classification and analysis of expenditure. It has not sought to make any judgements about the value or benefit of these expenditures to the aid recipients. While this approach does not capture the quality of assistance provided to crisis-affected populations the study aims to lay the foundation for further discussions about cost-efficiency, the quality of humanitarian assis-tance and the added value of each actor in the chain.
MethodologyThis report is based on analysis of 28 projects implemented by five ECHO partners: two international non-governmental organisations (NGOs) and three UN agencies. The study analysed the total expenditure of €302.2 million reported by partners for these 28 projects. ECHO’s contribution to these projects totalled €69.3 million (23% of the total expenditure).
The team developed a data input sheet or ‘fiche’ for each project and classified the expenditure that partners reported to ECHO into ‘tiers’, as follows:
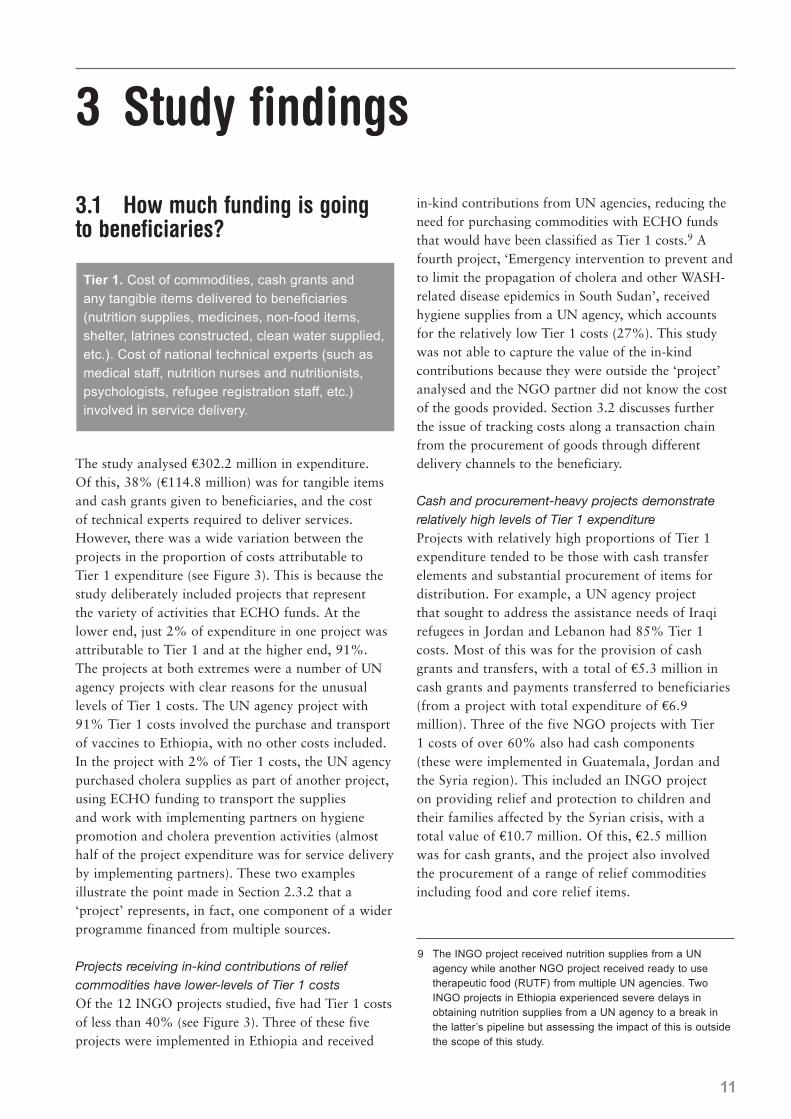
Tier 1. Cost of commodities, cash grants and any tangible items delivered to beneficiaries (nutrition supplies, medicines, non-food items, shelter, latrines constructed, clean water supplied, etc.). This also includes the cost of national technical experts (such as medical staff, nutrition nurses and nutritionists, psychologists, refugee registration staff, etc.) involved in service delivery, since this is a critical part of what beneficiaries receive.
Tier 2. Delivery costs, including transport, distribution (for example, bank charges for cash transfers), and warehousing.
Tier 3. Support costs such as office and equipment costs, utilities, stationery, communications, support staff, etc.
Tier 4. Seven per cent indirect cost and visibility costs. In addition to the tiers, costs of implementing partners which were not attributed to specific tiers were recorded.
National/local implementing partner costs. This includes a breakdown of staff, transport/travel, office, and other direct and indirect costs for government and national/local NGO implementing partners, if available.
International implementing partner costs. This includes a breakdown of staff, transport/travel, office, and other direct and indirect costs for international NGO implementing partners, if available.
Executive summary
1 The Terms of Reference make it clear that the term ‘stage in the chain’ refers to each level or actor in a funding chain that runs from donor to grant recipient, to implementing partner to aid recipient.

2 From Grand Bargain to beneficiary: an analysis of funding flows through the humanitarian system
Data considerationsTo interpret the findings of the study accurately, it is important to take into account of certain charac-teristics of the data that the study team was able to collect and analyse. For example, while this study analysed the full project expenditure of €302.2 million reported to ECHO, in many cases, this still does not represent the full costs of activities incurred by partners.
UN agencies, in particular, take a programme, which means that the expenditure reported does not necessarily represent the full costs incurred by the agency but simply what it has presented as a ‘project’ For example, one UN agency project comprised procuring measles vaccines but the costs reported to ECHO did not include any staffing or delivery costs, which were covered by other sources of funding. The Tier 1 costs of some NGO service provision projects also underestimate the total cost of what reached beneficiaries directly as they typically do not include the cost of commodities that they received in-kind, usually from UN agencies. Tier 1, 2 and 3 costs as a proportion of total costs should therefore be seen in the context of funding from other sources. A country-programme approach is required to obtain data on the extent to which partners have used funding from other sources, including un-earmarked funding, to cover the full range of costs.
The study obtained limited data on NGO funding to implementing partners. This is because only 4 of the 12 NGO projects included in the study involve local implementing partner costs reported to ECHO and, of these, two had very minor costs for government partners. As such, analysis of funding to implementing partners is based mainly on UN project data.
Partners are not always able to provide a breakdown of the different types of implementing partner costs. ECHO’s funding is usually a contribution to the full costs of these partners so the financial reports analysed rarely provided a complete list of implementing partner costs per project. Due to this variability in reporting, the study was unable to analyse patterns in implementing partner costs across the projects.
The study also found limited information in partner narrative reports to ECHO on the roles of, and value added by, implementing partners. This made it harder to answer the question about the role(s) of each actor in the chain.
The findingsHow much donor money reaches beneficiaries?A substantial portion of the €302.2 million either reached beneficiaries directly (€114.8 million or 38% Tier 1 costs), or enabled the direct delivery of goods and services (€130 million or 43% Tier 2 costs). Cash and voucher-based activities and projects involving large amounts of procurement typically had higher Tier 1 expenditure. Procured goods then needed to be distributed to beneficiaries or delivered through medical, nutrition and other services in order to be useful. Forty-three per cent of the total costs of the expenditure analysed was for transport, warehousing, and other costs associated with delivering goods and services. The findings of the study are influenced by the fact that almost 79% of the expenditure analysed (€237.7 million) was through projects that mainly involved the procurement and delivery of food commodities.
Challenging operating environments influence delivery (Tier 2) and support (Tier 3) costs. Projects delivered in the most insecure, remote and costly settings had the highest delivery and support costs – such as in Afghanistan, Somalia, South Sudan and the Gambella border region of Ethiopia. This underlines the need to take account of operating environments to understand the proportions of costs across the different tiers. Tier 3 support costs comprised 9% of the €302.2 million analysed. UN projects tended to have much lower support costs but the amounts reported to ECHO did not reflect the full extent of their Tier 3 costs. The UN projects analysed for this study tended to spend a smaller proportion of total costs on support cost than the NGO projects. However, analysis of Tier 3 costs shows that these do not cover the full range of costs, and UN partners often cover their Tier 3 costs from other funding sources, including un-earmarked funding.
What does each stage in the chain cost in total?The projects analysed for this study had short transaction chains, with 8 of the 12 NGO projects implemented directly. This meant that funding flowed from ECHO through the NGO to the beneficiaries. UN agencies tended to channel a higher proportion of total costs to implementing partners but the proportions varied across projects. For the purposes of this study, expenditure for Tiers 1–4 represents the costs of the first stage in the chain. This comprised €289.4 million or 95.8% of the costs analysed.
3
Implementing partners represent the second stage of the chain, which this study was not able to analyse in sufficient detail.
What is the total volume of funding implemented by a local partner and how much of this reaches the beneficiary?Within the set of 28 projects analysed, the role of implementing partners was relatively modest. 18 of the 28 projects involved local partners and channelled just 1.5% (€4.4 million) of the total €302.2 million to local and national actors. These projects channelled €8.4 million (2.8%) through international NGO partners. This study found a lower level of funding to implementing partners, particularly national actors, than that found by other analyses. This is probably due to the direct implementation modality favoured by the NGO partners, and because partners are likely to cover some implementing partner costs from other funding sources.
The study does not address the sub-question on how much of the funding implemented by local partners reaches the beneficiary because this does not apply to the way that partners report their costs to ECHO. The cost of items that reach beneficiaries is captured in Tier 1 and not separated out by implementing partner. The variability in partner reporting on implementing partner costs meant that it was not possible to separate funding out into Tiers 2–4 either. Therefore, in the context of the Grand Bargain discussions, donors need to get agreement from partners that they will be more transparent about their funding to, and relationships with, implementing partners.
A first step in implement-ing the Grand Bargain commitment to ‘Empower national and local humanitarian action by increasing the share of financing available to them’ is being clear about what types of implementing partner costs international agencies do or do not cover. This is particularly important if this highlights if some donors are unwilling to finance certain types of implementing partner costs.
What are the principal role(s) of each actor in the chain?Partners’ narrative reports to ECHO contain limited information about the added value of implementing partners. The data that was available showed that one of the NGO partners in the study worked with local partners to gain access to affected communities in insecure areas. UN agency implementing partners also undertook a wide variety of activities including transport of relief items, distribution of cash grants, maintenance of water systems or hygiene promotion.
Future research
The study aimed to lay the foundations for future discussions relating to the Grand Bargain. Further research would complement the findings presented here. There are various options for future research, the most comprehensive of which would be a study that adopted a systemic and country programme approach, analysing the country programmes of a set of partners in two to three country contexts. This could include a qualitative analysis of the value-added of different partners or modalities, particularly from the perspective of local and national actors. Such a study would therefore not only assess whether a project is low cost but also the quality of the service provided and the quality of relationships with implementing partners.
Another option would be to analyse the value of what reaches beneficiaries from a beneficiary perspective. This could take 2-3 aid recipient communities (whether a displaced persons camp or a village) and use participatory techniques to analyse what they have received, from whom, and how they assess the quality of the assistance. It could also include an analysis of the goods and services that beneficiaries source of their own accord, in addition to the humanitarian assistance.

5
1 Introduction
The Directorate-General for European Civil Protection and Humanitarian Aid Operations (ECHO) commissioned this study through the Inspire Consortium policy support agreement, and the Humanitarian Policy Group (HPG) of the Overseas Development Institute undertook the research. The purpose of the study is to examine different types of costs across a range of ECHO-funded projects, and to better understand how funding flows through the humanitarian system. The terms of reference (ToR) of this study (see Annex 1) listed the following questions:
• How much donor money (net) gets to the beneficiary2 • What does each stage in the chain cost in total?3 • What is the total volume of funding implemented
by a local partner and how much of this reaches the beneficiary?
• What are the principal role(s) of each actor in the chain?
This study contributes to two critical themes raised by the High Level Panel on Humanitarian Financing and the Secretary-General’s report in preparation for the World Humanitarian Summit (WHS), which became key outcomes of the Summit.4 The first is the Grand Bargain between donors and humanitarian agencies – an agreement between donors and aid providers that aims to get more resources into the hands of those in need. The Grand Bargain
includes steps towards improving the transparency and efficiency of the humanitarian system. By providing a better understanding of the different types of costs of donor funding and how it flows through the humani-tarian system, this study aims to contribute to this increase in transparency. The second theme is the core commitment to ‘Empower national and local humani-tarian action by increasing the share of financing available to them’.5 This requires understanding the share of financing that local actors receive currently, which is one area of analysis.
This study focuses on the classification and analysis of expenditure, as indicated by the question ‘How much donor money gets to the beneficiary?’. It has not sought to make any judgements about the value or benefit of these expenditures to the aid recipients, and approach which has limitations because it does not capture the quality of assistance provided to crisis-affected populations and nor does it reflect any of the added value of the manner in which assistance is provided.6 However, the aim of this study is to lay the foundations for further discussions about cost-efficiency, the quality of humanitarian assistance and the added value of each actor in the chain.
ECHO secured agreement from five partners to participate in this study, which comprised two international NGOs and three UN agencies. This report is based on an analysis of 28 projects implemented by these organisations.
2 For the purpose of this study, the term, beneficiary, is used to refer to the recipients of humanitarian assistance, as reported by partners in their narrative reports to ECHO. These may be the direct recipients of goods and services or indirect beneficiaries of activities such as the rehabilitation of water supplies or the construction/rehabilitation of health facilities.
3 The ToR make it clear that the term ‘stage in the chain’ refers to each level or actor in a funding chain that runs from donor to grant recipient, to implementing partner to aid recipient.
4 High Level Panel on Humanitarian Financing (2016) Too important to fail – addressing the humanitarian financial gap and United Nations (2016) One humanity: shared responsibility. Report of the Secretary-General for the World Humanitarian Summit, United Nations General Assembly Seventieth Session Item 73 (a).
5 WHS (2016) Commitments to Action. Available: https://worldhumanitariansummit.org/key-documents#chairsummary-linking
6 ECHO partners also expressed concern that donors may regard projects with a high level of expenditure on items delivered to beneficiaries (whether as cash or in-kind) as ‘good’ projects because more money reached the beneficiaries. In reality, these projects may be simply providing high-cost products rather than cost-efficient ones, or not spending enough on appropriate delivery mechanisms. Therefore, they felt that donors should be careful not to use the study’s findings to incentivise expenditures that may not be relevant to beneficiary needs or cost-effective.
7
The study team developed and piloted a methodology for analysing the costs of diverse projects – providing cash or in-kind assistance or services in different sectors – implemented by actors working in different ways – such as direct implementation or through partners. The cost classification and analysis approach worked across diverse projects and could be applied to a much larger sample of projects, and possibly across different donors.
2.1. Project selection
The team used ECHO’s HOPE database to identify relevant projects, using the following criteria:
• Three crisis contexts – Ethiopia, the South Sudan refugee crisis and the Syria region – to facilitate comparability within each, since the costs of response vary greatly by context. Projects were drawn from other geographical areas such as Ecuador, Guatemala and Myanmar to ensure a sufficient number of cash transfer programmes and to include an NGO project implemented through partners, rather than directly.
• Projects funded/implemented in 2013, 2014 and 2015 for which final narrative and financial reports
were available (to facilitate clarification or the need for additional data).
• Projects that represent different types of assistance – cash-based assistance, in-kind assistance and service provision (such as protection, health and/or nutrition services or education). Often, a project had several different components, for example, distribution of in-kind assistance and service provision or the provision of both cash grants and in-kind assistance.
• Total of five to six projects per partner to ensure a fair spread across partners.
Based on these criteria listed, the study initially selected 30 projects. It excluded two UN agency projects for a regional response to the Syria crisis and an education project in Turkey because of challenges with obtaining sufficient information to categorise the costs accurately. The team also excluded a very large UN agency project implemented in Syria and neighbouring countries, to avoid a disproportionate influence on the data analysis since the expenditure through this one project (over €766 million) was more than double the total expenditure of all the projects analysed. The team added an international non-governmental organisation (INGO) project in Myanmar
2 Methodology
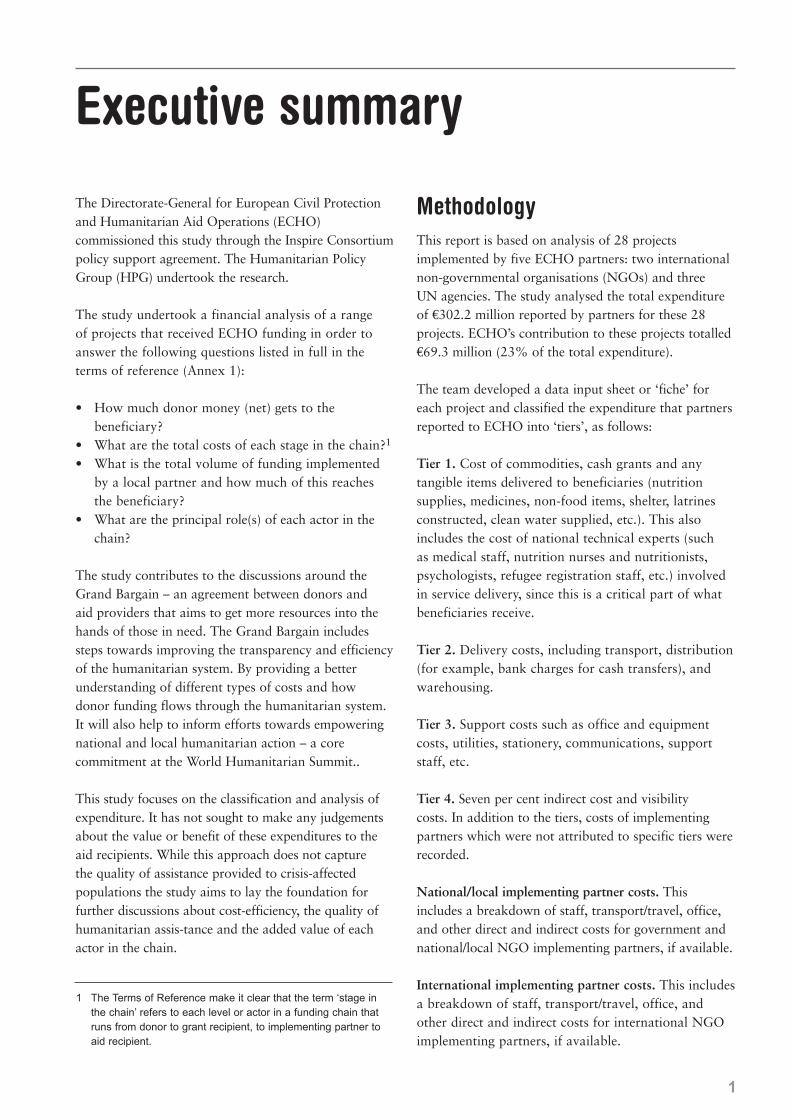
Figure 1: ECHO contributions as a share of final project expenditure amounts
8 From Grand Bargain to beneficiary: an analysis of funding flows through the humanitarian system
to supplement the one other such INGO project that had data on implementing partners. The analysis in this report is therefore based on 28 projects – six each for the two NGOs and two UN agencies, and a further four projects from the third UN agency. The team and ECHO agreed that, given the time needed for a detailed analysis of the costs of each project, this was an appropriate sample size to identify a set of findings that could be tested by larger samples, if necessary. The expenditure through the 28 projects totals €302.2 million. ECHO’s funding contribution to these projects totals €69.3 million or 23% of the total expenditure. As partners provided a breakdown of costs for project expenditure, and not simply ECHO’s contribution, this study is based on analysis of the reported expenditure of €302.2 million. ECHO has tended to finance a very high proportion of the expenditure of INGO and some of the UN agency projects included in this study (100% in 7 out of 12 cases and over 75% in all cases – see Figure 1). However, its contribution to the majority of UN agencies’ project costs reported is much lower.
2.2. Data collection
The team developed an Excel ‘fiche’ or standard data input sheet for each project to capture data on beneficiary numbers and classify the costs reported by
each partner to ECHO. The team completed a fiche for each project based on financial and narrative reports submitted to ECHO and with additional data provided by partners in response to questions of clarification. One UN agency opted to complete the project fiches themselves.
The cost classification developed for this study accepts partner categorisation of costs as direct or indirect, and did not seek any breakdown of the 7% indirect costs. It uses the detailed breakdown of direct costs provided by partners to ECHO to categorise expenditures into ‘tiers’ to ensure that these groups of costs are comparable across the projects. The study is not an audit as it does not aim to verify the accuracy of the costs reported to ECHO. Rather, it involves a classification of costs to understand the cost of items given directly to beneficiaries and the cost of staff required to deliver services, the cost of delivering goods and services to beneficiaries and other costs. Partners provided clarification to ensure these classifications were correct, and were also given the opportunity to review project fiches as part of the review process for the draft report.
Based on ECHO’s requirement that the study identify separately the cost of items or commodities that reached beneficiaries directly from the cost of delivering assistance, the study team used the following criteria
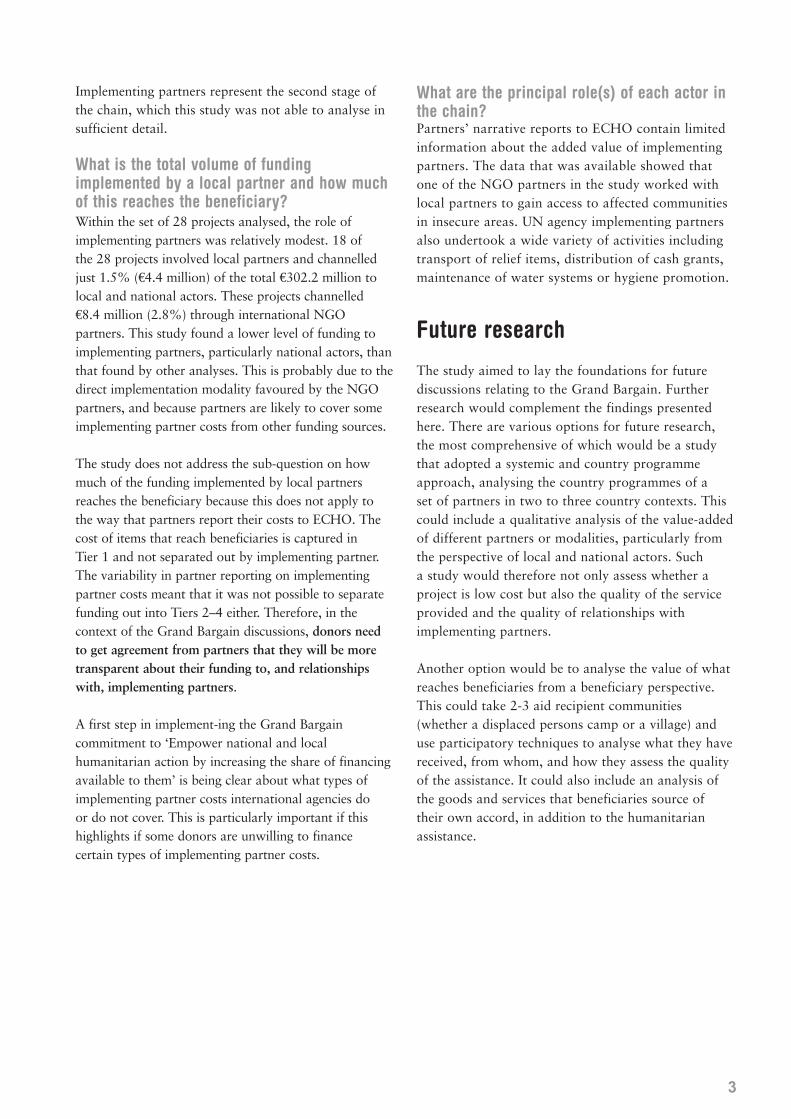
Figure 2: Project cost classification methodology
Tier 1: Sector 1
Goods and services received by beneficiaries
Tier 1: Sector 2
Goods and services received by beneficiaries
Tier 1: Sector 3
Goods and services received by beneficiaries
Local partner
cost
Inter-nationalpartnercosts
Tier 3In-country suppory costs
Tier 47% overhead + visibility costs
Tier 2Delivery costs

9
listed to categorise reported costs according to four tiers with separate implementing partner costs.
Tier 1. Cost of commodities, cash grants and any tangible items delivered to beneficiaries (nutrition supplies, medicines, non-food items, shelter, latrines constructed, clean water supplied, etc.). This also includes the cost of national technical experts (such as medical staff, nutrition nurses and nutritionists, psychologists, refugee registration staff, etc.) involved in service delivery, as this is a critical part of what beneficiaries receive.7
Tier 2. Delivery costs, including transport, distribution (for example, bank charges for cash transfers) and warehousing. Each of these items is shown separately in the project fiches (see template in Annex 2) to provide ECHO with a clear understanding of the different types of costs involved in delivering assistance.
Tier 3. Support costs such as office and equipment costs, utilities, stationery, communications, support staff, etc. As with Tier 2, staffing, office and other costs are separated out.
Tier 4. Seven per cent indirect cost and visibility costs. The rationale for including visibility costs in Tier 4 is that this is not required to support project implementation but is an ECHO requirement.
The project fiches record implementing partner costs separately to help answer the question ‘What is the total volume of funding implemented by a local partner?’ ECHO partners do not always provide a breakdown of implementing partner costs so it was not feasible to analyse the costs in details. The fiches distinguish between national/local and international implementing partner costs, as follows:
National implementing partner costs. This includes a breakdown of staff, transport/travel, office, and other direct and indirect costs for government and national/local NGO implementing partners, to the extent that this is available.
International implementing partner costs. This includes a breakdown of staff, transport/travel, office, and other direct and indirect costs for international NGO implementing partners, to the extent that this is available.
2.3. Risks and limitations
2.3.1. Data availability There were some initial challenges with obtaining data from UN partners due to their concerns about sharing information – particularly on funding – particularly additional financial data on funding to implementing partners. The study team addressed this by providing a more detailed methodology document, clarifying questions and proposing solutions. With these assurances, the agencies agreed to provide the additional data that would allow the team to accurately classify costs, including implementing partner costs. In some cases, obtaining information from country offices took longer because field staff members have prioritised humanitarian responses.
2.3.2 Data considerationsTo interpret the findings accurately, it is important to consider certain characteristics of the data that was collected and analysed. While this study analysed the full project expenditure of €302.2 million reported to ECHO, in many cases, this still does not represent the full costs of activities incurred by partners. In particular, UN agencies have a programme approach, which means that the project expenditure reported does not necessarily represent the full costs incurred by the agency, but what is presented as a ‘project’. For example, one of the UN agencies reported expenditure of just under €7 million for a project that sought to address the assistance needs of Iraqi refugees in Jordan and Lebanon. However, this did not include the cost of staffing, which was covered by another project or by the UN agency’s existing country programmes.
In another example, ECHO financed 100% of the expenditure of a UN agency project based in South Sudan on cholera preparedness and response. However, this did not include any office rental costs and covered only 30% of the cost of 11 boreholes because the remaining 70% of the borehole costs were covered by another project. NGO projects also do not always reflect the full cost of commodities provided in a project report to ECHO. One INGO project that provided relief and protection to children and their families affected by the Syrian crisis spent 60% of
7 One of the UN agencies included 30% of the cost of field monitors in its Tier 1 costs, as they perform a protection role. This cost represents a very small percentage of Tier 1 costs for the agency’s projects (usually around 0.5% but as low as 0.18% in the case of a project implemented in Syria). It was not possible to identify frontline staff costs for another UN agency providing health or hygiene promotion services since it does not report a breakdown of staff by role to ECHO.

10 From Grand Bargain to beneficiary: an analysis of funding flows through the humanitarian system
project funding on items for beneficiaries. Yet this did not include the full cost of 626 baby kits that the NGO distributed, or the cost of food baskets for 9,260 people in north-west Syria because some or all of the costs for this was funded by a previous ECHO project and carried over. Therefore, levels of Tier 1, 2 and 3 costs (commodity, delivery and support costs) as a proportion of total costs need to be seen in the context of funding from other sources. A country programme approach is required to obtain data on the extent to which partners have used funding from other sources, including un-earmarked funding, to cover the full range of costs.
The study also obtained limited data on NGO funding to implementing partners. This is because only 4 of the 12 NGO projects included involve local implementing partner costs reported to ECHO and, of these, two had very minor costs for government partners. Therefore, analysis on funding to implementing partners is based mainly on UN project data.
Analysis of the data showed that partners are not always able to provide a breakdown of the different types of implementing partner costs.8 ECHO’s funding is also usually a contribution to the full costs of these partners so the financial reports analysed rarely provided a complete list of implementing partner costs per project. For example, one UN agency generally only reports on partner staffing, travel and training costs to ECHO while other costs such as office or indirect costs are not reported. Due to
this variability of reporting, the study was unable to analyse patterns in implementing partner costs across the projects or to categorise the costs in terms of Tiers 2, 3 and 4. The Tier 1 costs presented in this report include all the costs of items delivered to beneficiaries, although there may be a very small amount of costs for implementing partner technical experts that are not reflected. However, the amount of funding channelled through implementing partners generally is a very small proportion of the total costs analysed so this does not affect the study’s findings.
In addition, there was limited information in partner narrative reports to ECHO on the roles and value added of implementing partners. This made it harder to answer the question about the role(s) of each actor in the chain. If ECHO wishes to get a better understanding of the role of implementing partners in future, partners will need to consistently complete section 6.7.2 of the ECHO standard narrative report on the added value of implementing partners.
Delivery costs, categorised as Tier 2, are an important part of the provision of humanitarian assistance. Affected populations could not receive assistance without goods being transported and stored, or the payment of charges for cash transfers. When beneficiaries received cash to purchase relief items, they are paying the cost of transport and storage in the price charged by the market, which may not necessarily be the same as the cost of relief items. Section 3.1.1 examines these Tier 2 delivery costs. Section 3.1.2 then assesses Tier 3 support costs, such as office rental and support staffing, which are necessary for the ultimate delivery of assistance but not directly incurred in delivering that assistance. This report does not analyse Tier 4 as since they only comprise a fixed 7% for indirect costs and visibility costs, where applicable.
8 One of the UN agencies does not show implementing partner costs separately in its financial reports to ECHO but, for this study, it provided a clear breakdown of implementing partner staffing, travel, office, programme and indirect costs. Some project financial reports simply showed a lump sum payment to implementing partners.
11
3 Study findings
3.1 How much funding is going to beneficiaries?
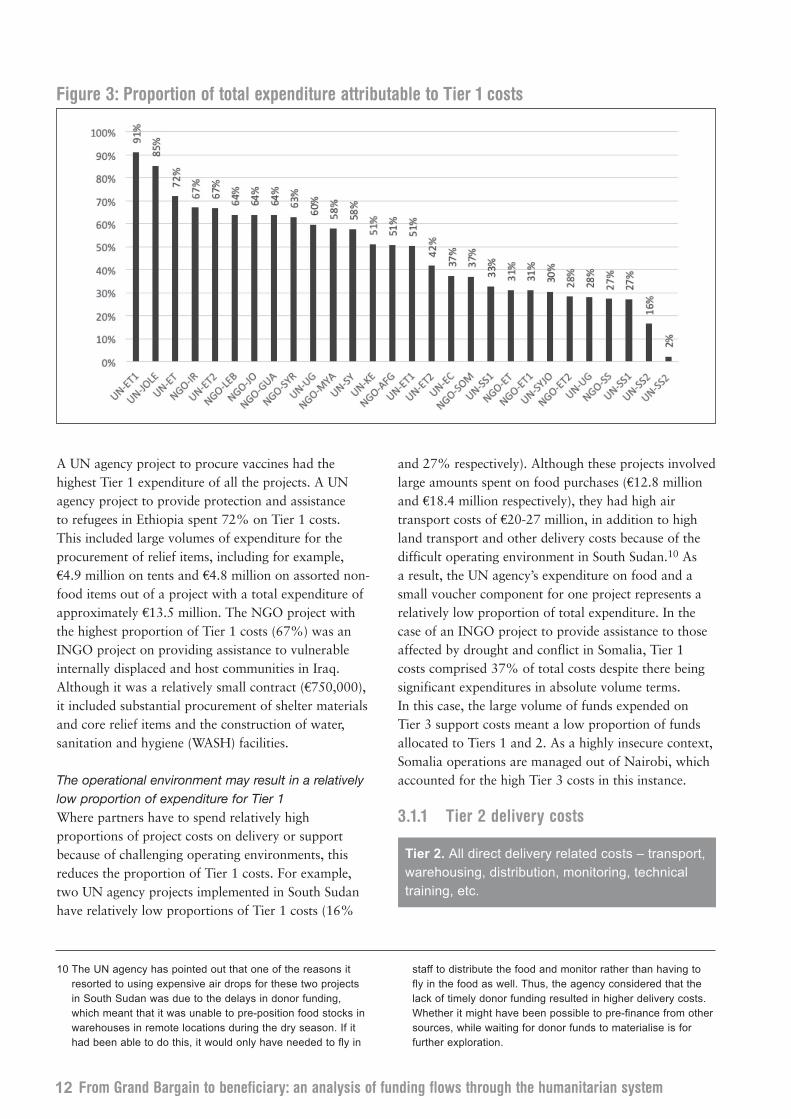
The study analysed €302.2 million in expenditure. Of this, 38% (€114.8 million) was for tangible items and cash grants given to beneficiaries, and the cost of technical experts required to deliver services. However, there was a wide variation between the projects in the proportion of costs attributable to Tier 1 expenditure (see Figure 3). This is because the study deliberately included projects that represent the variety of activities that ECHO funds. At the lower end, just 2% of expenditure in one project was attributable to Tier 1 and at the higher end, 91%. The projects at both extremes were a number of UN agency projects with clear reasons for the unusual levels of Tier 1 costs. The UN agency project with 91% Tier 1 costs involved the purchase and transport of vaccines to Ethiopia, with no other costs included. In the project with 2% of Tier 1 costs, the UN agency purchased cholera supplies as part of another project, using ECHO funding to transport the supplies and work with implementing partners on hygiene promotion and cholera prevention activities (almost half of the project expenditure was for service delivery by implementing partners). These two examples illustrate the point made in Section 2.3.2 that a ‘project’ represents, in fact, one component of a wider programme financed from multiple sources.
Projects receiving in-kind contributions of relief commodities have lower-levels of Tier 1 costs Of the 12 INGO projects studied, five had Tier 1 costs of less than 40% (see Figure 3). Three of these five projects were implemented in Ethiopia and received
in-kind contributions from UN agencies, reducing the need for purchasing commodities with ECHO funds that would have been classified as Tier 1 costs.9 A fourth project, ‘Emergency intervention to prevent and to limit the propagation of cholera and other WASH-related disease epidemics in South Sudan’, received hygiene supplies from a UN agency, which accounts for the relatively low Tier 1 costs (27%). This study was not able to capture the value of the in-kind contributions because they were outside the ‘project’ analysed and the NGO partner did not know the cost of the goods provided. Section 3.2 discusses further the issue of tracking costs along a transaction chain from the procurement of goods through different delivery channels to the beneficiary.
Cash and procurement-heavy projects demonstrate relatively high levels of Tier 1 expenditure Projects with relatively high proportions of Tier 1 expenditure tended to be those with cash transfer elements and substantial procurement of items for distribution. For example, a UN agency project that sought to address the assistance needs of Iraqi refugees in Jordan and Lebanon had 85% Tier 1 costs. Most of this was for the provision of cash grants and transfers, with a total of €5.3 million in cash grants and payments transferred to beneficiaries (from a project with total expenditure of €6.9 million). Three of the five NGO projects with Tier 1 costs of over 60% also had cash components (these were implemented in Guatemala, Jordan and the Syria region). This included an INGO project on providing relief and protection to children and their families affected by the Syrian crisis, with a total value of €10.7 million. Of this, €2.5 million was for cash grants, and the project also involved the procurement of a range of relief commodities including food and core relief items.
Tier 1. Cost of commodities, cash grants and any tangible items delivered to beneficiaries (nutrition supplies, medicines, non-food items, shelter, latrines constructed, clean water supplied, etc.). Cost of national technical experts (such as medical staff, nutrition nurses and nutritionists, psychologists, refugee registration staff, etc.) involved in service delivery.
9 The INGO project received nutrition supplies from a UN agency while another NGO project received ready to use therapeutic food (RUTF) from multiple UN agencies. Two INGO projects in Ethiopia experienced severe delays in obtaining nutrition supplies from a UN agency to a break in the latter’s pipeline but assessing the impact of this is outside the scope of this study.
12 From Grand Bargain to beneficiary: an analysis of funding flows through the humanitarian system
A UN agency project to procure vaccines had the highest Tier 1 expenditure of all the projects. A UN agency project to provide protection and assistance to refugees in Ethiopia spent 72% on Tier 1 costs. This included large volumes of expenditure for the procurement of relief items, including for example, €4.9 million on tents and €4.8 million on assorted non-food items out of a project with a total expenditure of approximately €13.5 million. The NGO project with the highest proportion of Tier 1 costs (67%) was an INGO project on providing assistance to vulnerable internally displaced and host communities in Iraq. Although it was a relatively small contract (€750,000), it included substantial procurement of shelter materials and core relief items and the construction of water, sanitation and hygiene (WASH) facilities.
The operational environment may result in a relatively low proportion of expenditure for Tier 1 Where partners have to spend relatively high proportions of project costs on delivery or support because of challenging operating environments, this reduces the proportion of Tier 1 costs. For example, two UN agency projects implemented in South Sudan have relatively low proportions of Tier 1 costs (16%
and 27% respectively). Although these projects involved large amounts spent on food purchases (€12.8 million and €18.4 million respectively), they had high air transport costs of €20-27 million, in addition to high land transport and other delivery costs because of the difficult operating environment in South Sudan.10 As a result, the UN agency’s expenditure on food and a small voucher component for one project represents a relatively low proportion of total expenditure. In the case of an INGO project to provide assistance to those affected by drought and conflict in Somalia, Tier 1 costs comprised 37% of total costs despite there being significant expenditures in absolute volume terms. In this case, the large volume of funds expended on Tier 3 support costs meant a low proportion of funds allocated to Tiers 1 and 2. As a highly insecure context, Somalia operations are managed out of Nairobi, which accounted for the high Tier 3 costs in this instance.
3.1.1 Tier 2 delivery costs
Figure 3: Proportion of total expenditure attributable to Tier 1 costs
Tier 2. All direct delivery related costs – transport, warehousing, distribution, monitoring, technical training, etc.
10 The UN agency has pointed out that one of the reasons it resorted to using expensive air drops for these two projects in South Sudan was due to the delays in donor funding, which meant that it was unable to pre-position food stocks in warehouses in remote locations during the dry season. If it had been able to do this, it would only have needed to fly in
staff to distribute the food and monitor rather than having to fly in the food as well. Thus, the agency considered that the lack of timely donor funding resulted in higher delivery costs. Whether it might have been possible to pre-finance from other sources, while waiting for donor funds to materialise is for further exploration.

13
Across the study set of 28 projects, 43% (€129.9 million) of the total expenditure was directed to Tier 2 delivery activities. The proportion of project costs attributable to Tier 2 ranged from less than 1% of a project’s expenditure to 68% (see Figure 4) but this was due to some exceptions. For example, the NGO project implemented in Lebanon had almost no Tier 2 costs because it charged ECHO less than €500 for the transport of shelter kits. The project involved mainly water trucking and desludging services that did not involve separate delivery costs. A UN agency project in Ethiopia, which involved the procurement of measles vaccines, only had a small amount of international freight costs since vaccines are small items and the government delivered them in country. In general, Tier 2 costs are clustered around a smaller range – the median (the mid-point in a range of values) is just 8% and the anomalous very low and very high values are described in the following. Cash and voucher programmes incur relatively low delivery costs A UN agency project addressing the assistance needs of Iraqi refugees in Jordan and Lebanon only spent 1% on Tier 2 because it was mainly a project providing cash grants combined with refugee registration, with neither activity requiring significant delivery costs. Four NGO projects with Tier 2 costs of 7% or less also had cash grant components. Of these four, two gave assistance to affected people in the Syria crisis, with the third responding to insecurity in Ghor province, Afghanistan and the last provided relief to those affected by the 2014 drought in Guatemala.
Service provision projects may also have low Tier 2 costs if they do not involve transporting and distributing relief items
Of the NGO projects with Tier 2 costs at the median level of 8% or below, five projects involved service delivery and so had low levels of transport and distribution costs. Two INGO projects implemented in Ethiopia comprised the provision of health and nutrition services as well as training to strengthen the government health system. An INGO project in Somalia combined health and nutrition services with WASH services at nutrition treatment sites and included a small cash grant component. Another INGO project implemented in Myanmar comprised a range of behaviour-change and health-education activities. The NGO project in South Sudan was a WASH project with hygiene promotion and training.
To arrive at the full cost of goods and services delivery, it is helpful to take into account implementing partners costs and those of ECHO partners As illustrated by Figure 5, some of the projects analysed had low levels of Tier 2 costs since they relied heavily on implementing partners to deliver activities. For example, a UN agency project in Uganda with very low Tier 2 costs of 2% had implementing partner costs that accounted for 49% of the total expenditure. A UN agency project providing relief services for Colombian refugees and asylum-seekers in Ecuador, had Tier 2 costs of just 8% since implementing partners undertook the delivery of goods and services and received 30% of total project costs.
Figure 4: Proportion of total expenditure attributable to Tier 2 costs

14 From Grand Bargain to beneficiary: an analysis of funding flows through the humanitarian system
3.2.3 Tier 3 support costs
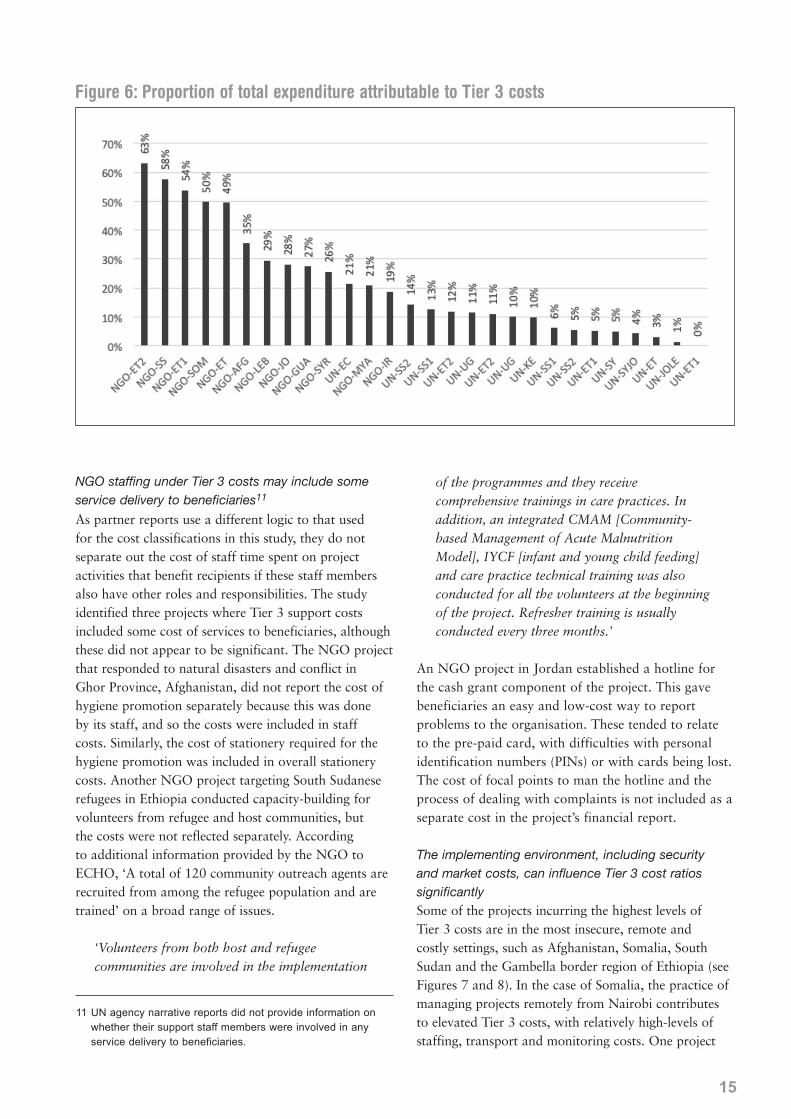
Although Tier 3 costs vary across the dataset, there is a clear distinction between UN and NGO projects Across the study set, 9% of the total costs of €302.2 million were for Tier 3 support costs. However, there is a wide variation in the proportion of support costs across the projects studied, ranging from 0% (for a UN agency vaccination procurement project) to 63% of total expenditure (see Figure 6). All the projects with support costs of less than 15% were UN projects. With the exception of one UN agency project, all the projects with more than 15% expenditure on support costs were NGO projects. As discussed in section 2.3.2 on data limitations, one reason for this is that the project expenditure reported to ECHO does not cover the full extent of costs incurred and UN agencies are better able to spread their support costs across different sources of funding, including un-earmarked funding. For example, a number of UN agency projects in this study include very limited or no office rental and associated costs. Similarly, a UN agency project
providing protection and assistance services to refugees in Ethiopia did not charge any office rental or utilities costs to ECHO. As a result, it had Tier 3 costs of 3%. A UN agency project that gave assistance to Iraqi refugees in Jordan and Lebanon had 1% of costs allocated to Tier 3. However, it did not charge any office costs for Lebanon and there were minimal staffing costs, other than five staff positions (of whom four were national staff) and some non-refugee labour wages. Based on a preliminary analysis of NGO and UN agency project data, it appeared that there were economies of scale whereby larger projects benefitted from a critical mass of investment in support services and structures. This meant that Tier 3 support costs did not increase in proportion with the scale of activities after a certain point. However, with the inclusion of UN agency projects in the dataset, both large and small agency projects appeared to have low levels of Tier 3 costs. For example, the smallest UN project was a UN agency one in South Sudan, which had a total expenditure of just €508,548. Of this, 14% was spent on Tier 3 costs because the UN agency did not charge ECHO for staffing, travel or other support costs other than the cost of repairs and maintenance for its Juba office.
Figure 5: Proportion of total expenditure attributable to Tier 2 and implementing partner costs
Note: UNHCR did not disaggregate partner costs for the project in Ecuador into local and international partners. All partner costs for this project are currently assigned to national partner costs.
Tier 3. Support costs such as office and equip-ment costs, utilities, stationery, communications, vehicle maintenance, insurance, support staff, etc.
15
NGO staffing under Tier 3 costs may include some service delivery to beneficiaries11
As partner reports use a different logic to that used for the cost classifications in this study, they do not separate out the cost of staff time spent on project activities that benefit recipients if these staff members also have other roles and responsibilities. The study identified three projects where Tier 3 support costs included some cost of services to beneficiaries, although these did not appear to be significant. The NGO project that responded to natural disasters and conflict in Ghor Province, Afghanistan, did not report the cost of hygiene promotion separately because this was done by its staff, and so the costs were included in staff costs. Similarly, the cost of stationery required for the hygiene promotion was included in overall stationery costs. Another NGO project targeting South Sudanese refugees in Ethiopia conducted capacity-building for volunteers from refugee and host communities, but the costs were not reflected separately. According to additional information provided by the NGO to ECHO, ‘A total of 120 community outreach agents are recruited from among the refugee population and are trained’ on a broad range of issues.
‘Volunteers from both host and refugee communities are involved in the implementation
of the programmes and they receive comprehensive trainings in care practices. In addition, an integrated CMAM [Community-based Management of Acute Malnutrition Model], IYCF [infant and young child feeding] and care practice technical training was also conducted for all the volunteers at the beginning of the project. Refresher training is usually conducted every three months.’
An NGO project in Jordan established a hotline for the cash grant component of the project. This gave beneficiaries an easy and low-cost way to report problems to the organisation. These tended to relate to the pre-paid card, with difficulties with personal identification numbers (PINs) or with cards being lost. The cost of focal points to man the hotline and the process of dealing with complaints is not included as a separate cost in the project’s financial report.
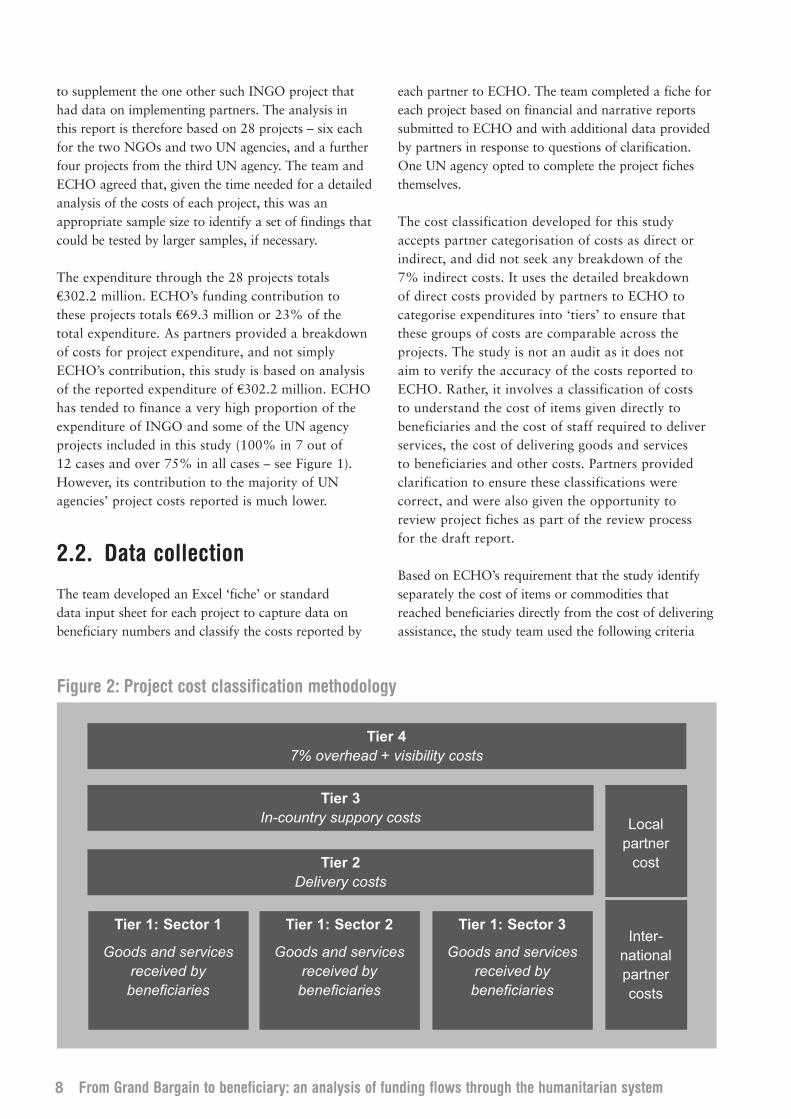
The implementing environment, including security and market costs, can influence Tier 3 cost ratios significantly Some of the projects incurring the highest levels of Tier 3 costs are in the most insecure, remote and costly settings, such as Afghanistan, Somalia, South Sudan and the Gambella border region of Ethiopia (see Figures 7 and 8). In the case of Somalia, the practice of managing projects remotely from Nairobi contributes to elevated Tier 3 costs, with relatively high-levels of staffing, transport and monitoring costs. One project
Figure 6: Proportion of total expenditure attributable to Tier 3 costs
11 UN agency narrative reports did not provide information on whether their support staff members were involved in any service delivery to beneficiaries.

16 From Grand Bargain to beneficiary: an analysis of funding flows through the humanitarian system
that did not fit with this trend was an INGO project in. This had Tier 3 costs of only 19% even though the project was implemented in the moderately insecure governorates of Kirkuk and Salah-Ad-Din.12 The INGO had low staffing costs due to recruitment challenges and staff turnover, but it was also able to spread office costs across donors and did not charge the costs of two local implementing partners to ECHO.
3.2 What does each stage in the funding chain cost in total?
Humanitarian assistance delivery involves an interlinked and often complementary set of actions by different actors. Figure 9 illustrates a hypothetical ‘transaction chain’ of actors and flows of external international resources through an ad hoc response
‘system’. A good illustration of such a transaction chain is the example of a UN agency procuring nutrition supplies with funding from multiple donors that are delivered by several international NGOs, potentially working with government counterparts or local NGOs. Although the costs of the different activities may be reported separately to different donors, the activities only add up to a meaningful service for beneficiaries when taken together. The projects analysed represent relatively short transaction chains. As the NGO partners tend to implement their projects directly, funding has flowed from the donor through the NGO to the beneficiaries. The transaction chain is longer where funding has flowed through an ECHO partner to several international NGO or local implementing partners. The expenditure on Tiers 1–4 was made by the first stage in the chain, i.e. the international NGO or UN agency receiving funding directly from ECHO and other donors. The local and international implementing partner costs represent expenditure at the next stage of the chain. These costs are for
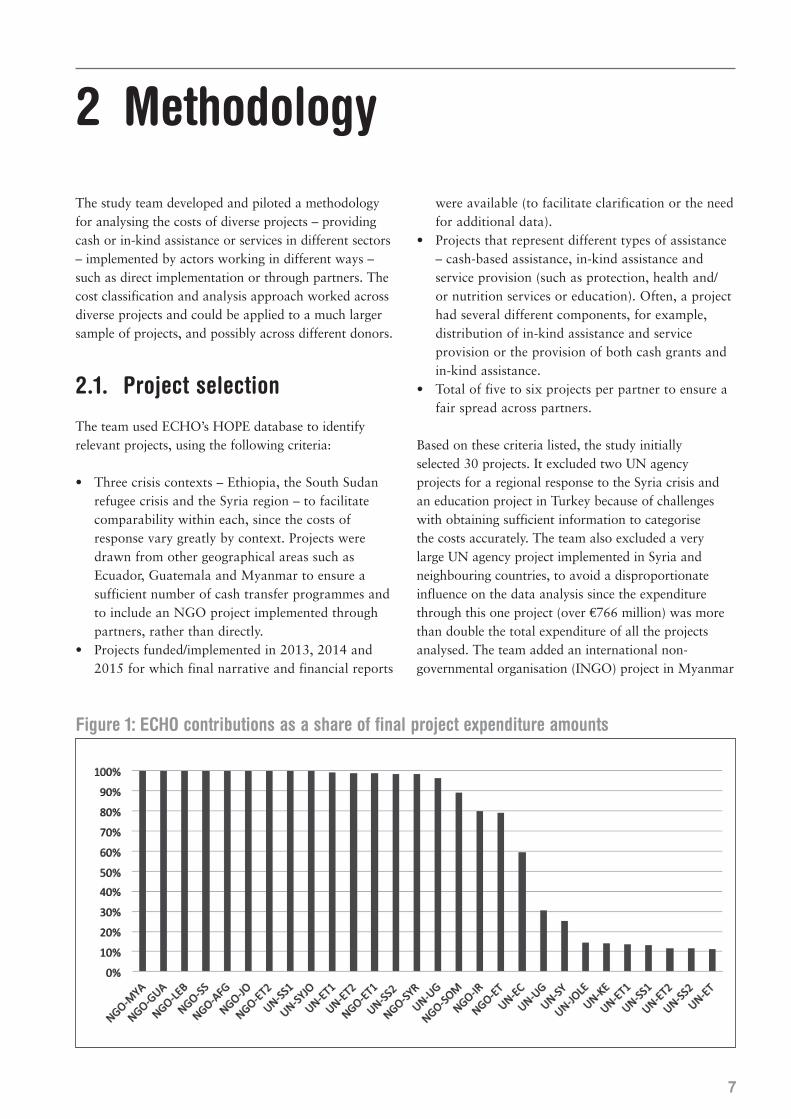
Figure 7: Relationship between conflict intensity and relative cost of operations in project implementation settings
Sources: Global Conflict Risk Index (GCRI), December 2015; UN International Civil Service Commission Post Adjustment Classification, September 2015.
Note: The UN Post Adjustment Index is a measure of the cost of living of staff at a location, relative to the base city, New York, and is used here as a proxy indicator of the cost of operating in different response contexts.
12 According to the narrative report, the INGO’s presence in these two governorates remained limited due to fighting between IS and the Peshmerga (until April, their staff could not stay overnight in Kirkuk).
GC
RI
Con
flict
Int
ensi
ty I
ndex
201
4
UN Post Adjustment Multiplier (September, 2015)
Syria
Kenya
GuatemalaEcuadorUganda
Lebanon
Myanmar
Iraq Afghanistan
Ethiopia
South Sudan
0 10 20 30 40 50 60
12
10
8
6
4
2
0

17
*Conflict risk is based on the Global Conflict Risk Index, December 2015.
Source: Global Conflict Risk Index, December 2015.
Notes: For projects spanning more than one country, an average of the GCRI score for each country has been calculated. Where multiple projects exist in a single country, as in the cases of Ethiopia and South Sudan, the upper and lower ranges of Tier 3 costs are presented in a vertical bar.
Figure 8: Tier 3 costs by country of project implementation
Figure 9: Hypothetical flow of resources through a response ‘transaction chain’
UN agencynutrition programme
Funding from private sources
Funding from other bilateral donors and
funds
Funding from
ECHO
Funding from
ECHO
Funding from other bilateral donors and
funds
In-kindnutritionproducts
In-kindnutritionproducts
Projectimplementation
costs
Coreunearmarked
funding
INGOnutrition project
Local CSO hygiene promotion project
Government nutrition programme
Tie
r 3
cost
s as
% o
f to
tal c
osts 70%
60%
50%
40%
30%
20%
10%
0%
Gua
tem
ala
Ecu
ador
Jord
an
Uga
nda
Jord
an, L
eban
on
Syr
ia, J
orda
n
Eth
iopi
a
Jord
an, L
eban
on, S
yria
Leba
non
Ken
ya
Mya
nmar
Iraq
Syr
ia
Afg
hani
stan
Sou
th S
udan
Som
alia
LowConflict intensity*
- 27% - 28%
- 28%
- 26%- 29%
- 21%- 19%
- 35%
- 50%
- 58%- 63%
- 5% 5%
- 28%- 11%
- 1%- 4%
- 0%
- 21%

18 From Grand Bargain to beneficiary: an analysis of funding flows through the humanitarian system
staffing, travel and other organisational costs, i.e. costs that would be classified as Tiers 2–4 if the study had been able to obtain a consistent breakdown. As highlighted in Figure 10 as well as Figure 5, the amount of expenditure by implementing partners varies considerably by project.
As noted, this study did not have access to financial data for each stage in a chain in projects where some stages occurred outside of the project reported to ECHO. These included projects such as the delivery and administration of the vaccines that the UN agency procured, which was done by the Ethiopian Ministry of Health; or the cost of nutrition supplies that an INGO received as an in-kind contribution that it delivered in Ethiopia. Understanding the cost at each stage of the chain and the total cost of what beneficiaries receive would require a systemic approach to examining costs along the full set of activities (discussed in Section 4.1).
3.3 What is the total volume of funding spent by implementing partners?
Of the total €302.2 million project costs analysed, 4.2% (€12.8 million) was channelled via third-party implementing partners, with €4.4 million (1.5%) received by national/local partners and €8.4 million (2.8%) received by international partners across 18 of the 28 projects. Of the 10 projects that did not show funding to implementing partners, eight were NGO projects and the other two were UN agency projects that involved the procurement of vaccines and nutrition supplies. One of the participating NGOs had a model of direct service delivery. Two branches of an INGO worked with implementing partners, particularly in areas where they had limited access. However, this did not always involve channelling funds to these partners or funding to these partners
Figure 10: Project cost distributions across cost classification categories
Tier 1 Tier 2 Tier 3 Tier 4 Local partner costs International partner costs
UN-JOLE
NGO-IR
NGO-LEB
NGO-GUA
UN-UG
UN-SY
NGO-AFG
UN-ET2
NGO-SOM
NGO-ET
UN-SYJO
UN-UG
UN-SS1
UN-SS2
0% 10% 20% 30% 40% 50% 60% 70% 80% 90% 100%
19
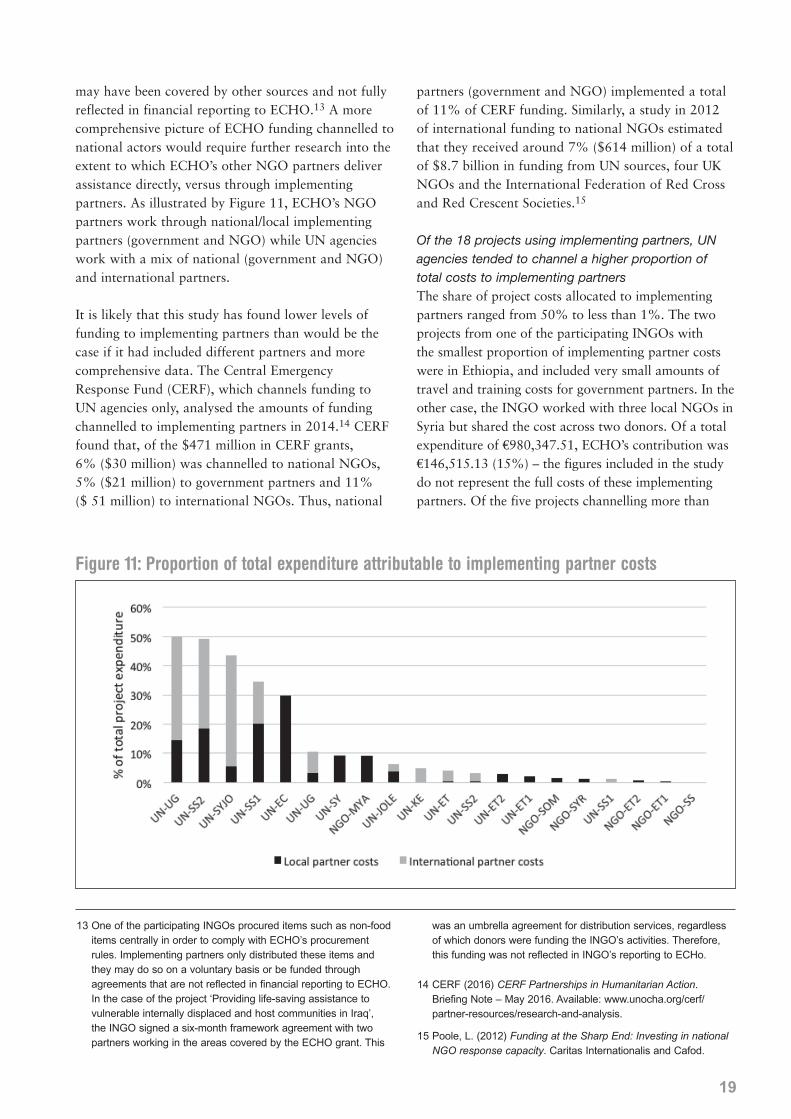
may have been covered by other sources and not fully reflected in financial reporting to ECHO.13 A more comprehensive picture of ECHO funding channelled to national actors would require further research into the extent to which ECHO’s other NGO partners deliver assistance directly, versus through implementing partners. As illustrated by Figure 11, ECHO’s NGO partners work through national/local implementing partners (government and NGO) while UN agencies work with a mix of national (government and NGO) and international partners.
It is likely that this study has found lower levels of funding to implementing partners than would be the case if it had included different partners and more comprehensive data. The Central Emergency Response Fund (CERF), which channels funding to UN agencies only, analysed the amounts of funding channelled to implementing partners in 2014.14 CERF found that, of the $471 million in CERF grants, 6% ($30 million) was channelled to national NGOs, 5% ($21 million) to government partners and 11% ($ 51 million) to international NGOs. Thus, national
partners (government and NGO) implemented a total of 11% of CERF funding. Similarly, a study in 2012 of international funding to national NGOs estimated that they received around 7% ($614 million) of a total of $8.7 billion in funding from UN sources, four UK NGOs and the International Federation of Red Cross and Red Crescent Societies.15
Of the 18 projects using implementing partners, UN agencies tended to channel a higher proportion of total costs to implementing partners The share of project costs allocated to implementing partners ranged from 50% to less than 1%. The two projects from one of the participating INGOs with the smallest proportion of implementing partner costs were in Ethiopia, and included very small amounts of travel and training costs for government partners. In the other case, the INGO worked with three local NGOs in Syria but shared the cost across two donors. Of a total expenditure of €980,347.51, ECHO’s contribution was €146,515.13 (15%) – the figures included in the study do not represent the full costs of these implementing partners. Of the five projects channelling more than
Figure 11: Proportion of total expenditure attributable to implementing partner costs
13 One of the participating INGOs procured items such as non-food items centrally in order to comply with ECHO’s procurement rules. Implementing partners only distributed these items and they may do so on a voluntary basis or be funded through agreements that are not reflected in financial reporting to ECHO. In the case of the project ‘Providing life-saving assistance to vulnerable internally displaced and host communities in Iraq’, the INGO signed a six-month framework agreement with two partners working in the areas covered by the ECHO grant. This
was an umbrella agreement for distribution services, regardless of which donors were funding the INGO’s activities. Therefore, this funding was not reflected in INGO’s reporting to ECHo.
14 CERF (2016) CERF Partnerships in Humanitarian Action. Briefing Note – May 2016. Available: www.unocha.org/cerf/partner-resources/research-and-analysis.
15 Poole, L. (2012) Funding at the Sharp End: Investing in national NGO response capacity. Caritas Internationalis and Cafod.

20 From Grand Bargain to beneficiary: an analysis of funding flows through the humanitarian system
25% of total costs through implementing partners, all of them were UN projects (see Figure 11).
Although the volumes of funds allocated between national and international partners vary, there is no obvious pattern in the data and the choice of partner is influenced by operational considerations as described in Section 3.4.
The study does not address the sub-question in the ToR about how much funding implemented by local partners reaches the beneficiary because this does not apply to the way that partners report their costs to ECHO. As discussed in Section 2.3.2, the cost of items that reach beneficiaries is captured in Tier 1 and not separated out by implementing partner. A future study could examine costs along the full length of a transaction chain – for example, capturing the cost of items procured by UN agencies as part of a ‘project’ and then delivered by international NGOs or local partners as part of another ‘project’, which could be calculated as funding that implementing partners had delivered to beneficiaries.
3.4 What are the principal roles of each actor in the chain?
This study’s analysis of roles of different actors in the chain of delivery based on the narrative reports that partners provided to ECHO has been limited by the fact that ECHO partners did not tend to complete the section regarding the added value of their implementing partners.
UN agencies rely on implementing partners (both international and national NGOs, as well as government counterparts in some cases) to a greater extent than NGO partners This is because the two NGO partners participating in the study have tended to implement directly except in insecure environments where they do not have access.16 For example, one INGO project aimed at providing assistance to vulnerable internally displaced people (IDPs) and host communities in Iraq, worked
through two local partners in Kirkuk and Salah Ad-Din governorates because it had a limited presence in these areas due to fighting between IS and the Peshmerga. The INGO selected these partners because they had ‘established relationships with local authorities that allowed them to monitor the security situation, adapt as needed and reach out to most vulnerable IDPs’. The partners also had substantial experience of working in a humanitarian context and were well embedded in local communities. Similarly, when it did not have access, the INGO implemented a project providing relief and protection to children and their families affected by the Syrian crisis, through implementing partners inside Syria. In north-eastern Syria, a local partner distributed hygiene and winterisation kits and conducted hygiene messaging (working under the INGO’s supervision in Newroz camp but also independently where the INGO could not be present). In north-western Syria, the same INGO partnered with two diaspora organisations that were experienced in partnering with international NGOs while one was a grassroots organisation. In Myanmar, the INGO worked very closely with a local NGO partner in Kachin due to the insecure operating environment and access challenges. This partner played an important role in delivering a rage of programme activities.
Reporting to ECHO indicates that international NGOs may play a capacity-building role Analysis of the narrative reports provided examples of an INGO building the capacity of its partners. While UN agencies may also have undertaken such activities, they did not report them to ECHO. The INGO was able to build the capacity of the diaspora organisations with which it worked in north-western Syria, by providing extensive procurement and logistics support to enable them to procure food kits directly. As a result, both organisations gained ‘significant experience in food kit design, as well as procurement procedures and quality assurance for food. This will be valuable in the longer-term for diaspora organisations to access institutional funding directly’.
In Iraq, to ensure programme quality, the INGO planned training where partner staff would work directly with their staff ‘to ensure robust implementation of their core responsibilities’. In Myanmar, the INGO has provided capacity development support to its local partner, which includes training, organisational development and support on both strategic and operational matters. A review of humanitarian actors in Kachin and North Shan State highlighted the need for the INGO to
16 It should be noted that the narrative report for this INGO project for the Syria region, focuses on the relationships between the various federated branches of the INGO as the entity implementing projects in Syria. For the purpose of this study, however, implementing partners refer to organisations outside of an NGO federation.

21
provide continued support, including by seconding staff to its local partner.
The NGO implementing partners of UN agencies undertake a variety of programme delivery activities UN agencies typically provide little information on the role of their implementing partners in narrative reports to ECHO. However, based on the information available, it is clear that national and international NGO partners undertake a range of different roles. For example, in one UN agency project focusing on protecting and assisting refugees in Ethiopia, a national NGO was responsible for warehouse management in Addis Ababa as well as all field locations and for transporting core relief and sanitary items to refugee camps (where the government distributed the core relief items).17 The INGO worked directly with refugees to help them set up the tents that the UN agency procured. In a project addressing the needs of Iraqi refugees in Jordan and Lebanon, the UN agency worked with an international NGO in Jordan. Together, they conducted home visits to refugee families to assess their vulnerability based on the criteria set by the UN agency and with the Cairo Amman Bank to make monthly cash transfers to refugees. In Lebanon, the UN agency had three local partners whose roles were to undertake outreach activities and distribute vouchers. For the project focusing on providing emergency assistance to the people affected by the Syrian crisis with a particular focus on children, the UN agency worked with three
international NGOs that provided large-scale water delivery, waste management, hygiene promotion and services, as well as WASH maintenance, monitoring and governance in refugee camps.
In Uganda, the same UN agency worked with six international NGO partners who undertook a broad range of activities that included the construction of motorised water systems, training hygiene promoters, strengthening the capacity of district health offices in detecting, treating and preventing acute malnutrition and establishing child friendly spaces.
A different UN agency worked with national and international NGOs to deliver food. In the case of its Syria project, for cross-border operations, it relied on international NGOs ‘who partner with local Syrian counterparts that have the capacity to intervene at scale in hard-to-reach and besieged locations’. The cost of the local Syrian NGOs were not reflected in the UN agency’s financial report but should be covered under the payments to international NGO partners.
The local private sector provides a range of services, which could be examined further The process of classifying costs for each project fiche has highlighted that ECHO’s partners pay the local private sector for office rental, utilities, communications, car rental and other local transport contracts. In addition, NGOs are likely to procure materials (for shelter or latrines or food items) and hire labour from local companies. A future study could examine further the role of the local private sector in humanitarian assistance.
17 It also worked with an international NGO to supply and transport core relief items in Uganda although this was not financed by ECHO.

23
4 Summary of findings and options for further research
This study has been a first attempt at answering the apparently simple and important question, ‘How much funding reaches humanitarian aid beneficiaries?’ To answer the other questions in the ToR, particularly about the total costs at each stage of the chain and the volume of funding spent by implementing partners, the study has analysed how funding flows through the humanitarian system. The study has examined different types of costs across a range of sectors and activities. It has identified a cost classification methodology that can be used across different partners, sectors and activities to calculate the cost of goods and services delivered to beneficiaries as well as the costs of delivery and other costs. The study found the following:
A substantial portion of the €302.2 million analysed either reached beneficiaries directly (38% Tier 1 costs), or enabled the direct delivery of goods and services (43% Tier 2 costs). The percentage of project costs spent on commodities, cash grants and other items that reach beneficiaries directly as well as technical experts to deliver services varied greatly across the dataset. Projects involving large amounts of procurement typically had higher Tier 1 expenditure. These procured goods then need to be distributed to beneficiaries or delivered through medical, nutrition and other services in order to be useful. Forty-three per cent of the total costs of the expenditure analysed was for transport, warehousing, and other costs associated with delivering goods and services. The findings of the study are influenced by the fact that almost 79% of the expenditure analysed (€237.7 million) was through projects undertaken by a single UN agency that mainly involved the procurement and delivery of food commodities.
The Tier 1 costs of some NGO service provision projects underestimate the total cost of what reached beneficiaries directly as they typically do not include the cost of commodities provided in-kind, usually
by UN agencies. It is important to complement quantitative data analysis with a qualitative understanding of the nature and modus operandi of projects for a more holistic picture of how much funding actually reaches beneficiaries, and how this is influenced by what co-funding exists.
Projects with a cash and/or voucher component tended to have higher Tier 1 expenditure and lower delivery costs. Unsurprisingly, cash and voucher-based programmes appear relatively efficient because they transfer high amounts directly to beneficiaries. They require less expensive delivery mechanisms than commodities and fewer staff than the provision of services.
Challenging operating environments tend to result in higher delivery (Tier 2) and support (Tier 3) costs. This study has classified delivery costs such as transport, warehousing or bank charges as Tier 2 delivery costs. Costs, such as renting and running offices, renting and running vehicles, communications and support staff are classified as Tier 3 support costs. Projects delivered in the most insecure, remote and costly settings, such as Afghanistan, Somalia, South Sudan and the Gambella border region of Ethiopia, had the highest delivery and support costs. This underlines the need to take account of operating environments when trying to understand the proportions of costs across the different tiers.
Tier 3 support costs comprised 9% of the €302.2 million analysed. UN projects tended to have much lower support costs but the costs reported to ECHO do not reflect the full extent of their Tier 3 costs. The UN projects analysed tended to spend a smaller proportion of total costs on support cost than the NGO projects. However, analysis of Tier 3 costs shows that these do not cover the full range of costs and UN partners often cover their Tier 3 costs from other funding sources, including un-earmarked funding.

24 From Grand Bargain to beneficiary: an analysis of funding flows through the humanitarian system
The role of implementing partners was relatively modest within the study set, with international partners receiving 2.8% of the total €302.2 million costs, and local and national actors receiving just 1.5%.
Compared to other analyses, this study found a lower level of funding to implementing partners, particularly national actors. This is probably due to the direct implementation modality favoured by the NGO partners, and because partners are likely to cover some implementing partner costs from other funding sources. Nevertheless, some projects with low levels of delivery costs had significant implementing partner costs. It is, therefore, important to take into account the cost of implementing partners as well as Tier 2 delivery costs to arrive at the full cost of the delivery of goods and services.
Partners need to be more transparent about their funding to implementing organisations. The study could not identify patterns in funding to implementing partners or analyse the extent to which implementing partners were able to cover different costs (such as staffing, office costs and indirect costs). This is because only some projects reported a detailed breakdown while most reported only lump-sum payments or limited types of costs (staffing and transport). In the context of the Grand Bargain discussions, donors need agreement from partners that they will be more transparent about their funding to, and relationships with, implementing partners. A first step in implementing the Grand Bargain commitment to ‘Empower national and local humanitarian action by increasing the share of financing available to them’ is being clear about what types of implementing partner costs international agencies do or do not cover. This is particularly import-ant if this highlights if some donors are unwilling to finance certain types of implementing partner costs.
The projects analysed for this study had short transaction chains, with 8 of the 12 NGO projects implemented directly. However, one of the NGO federations included in the study worked with local partners to gain access to affected communities in insecure areas. UN agencies tended to channel a higher proportion of total costs to implementing partners. The limited information available in narrative reports showed that this funding was for a wide range of activities (such as transport of relief items, distribution of cash grants, maintenance of water systems or hygiene promotion).
4.1 Options for further researchThe next step in developing the research presented here is to address some of the data limitations identified. This could be done in a number of ways.
A systemic and country programme approachTo achieve a holistic picture of funding across transaction chains and how funding flows through the humanitarian system, a future study could focus on two to three country contexts and analyse the country programmes of a set of partners, rather than ‘projects’ that do not include the full cost of activities.18 The study could draw on International Aid Transparency Initiative data as well as funding data from partners. It could also include a qualitative analysis of the value-added of different partners/modalities, particularly from the perspective of local and national actors, so that the study does not simply assess whether a project is low-cost but also the quality of the service provided and the quality of partnerships with implementing partners. This could be done through an evaluation or using participatory research methods.
This work has built a close working relationship with the participating organisations, which could be the foundation for such a study – with more NGO partners added to get a more representative sample. Collaborating with other donors would also complement ECHO’s relationships with partners to obtain a more holistic dataset.
Analyse the value of what reaches beneficiaries from a beneficiary perspectiveIf donors aim to understand the value of what assistance reaches beneficiaries, a future study could take two to three aid recipient communities (whether a camp for displaced persons or a village), and use participatory techniques to analyse what they have received, from whom, and how they assess the quality of the assistance. HPG is already planning research in this vein for its 2017/18 Integrated Programme, which focuses on building a better picture of ‘non-traditional’ sources of assistance from outside the formal humanitarian system, and how this complements household coping strategies and resources.
18 It is likely to be easier and more relevant to get data for protracted crises rather than a sudden onset emergency. Donors and partners can decide which contexts would be best suited to answering the study questions.

25
Title of the assignment: How much funding reaches the beneficiary?
ECHO desk in charge: Matthew Keyes, A4SST expert: Calum McLean
1. Background
Humanitarian assistance takes many forms and individual projects include various components. However, regardless of the type of project, a key objective will be the transfer of resources to the final beneficiary, either directly or indirectly. A transfer may take the form of an in-kind donation or a cash-based transfer. However it may also take the form of a service, which is made available to beneficiaries, such as a medical clinic, access to educational facilities or the making available of sanitation facilities. Projects may also include training or education/awareness raising components. More complex projects may include a mixture of these components.
In common with the majority of donors, ECHO relies on numerous partners, either UN or other international organisations or international NGOs, to deliver humanitarian assistance. In some cases the UN or international organisations will implement assistance directly, but more often than not they will work through implementing partners, some of which will be international NGOs, others will be local NGOs. For their part NGOs will also frequently resort to local partners to deliver assistance.
Each link in the chain comes with its own costs – these costs may well be necessary and the added value of the different actors justified. Nevertheless, the amount of donor funding that reaches the end beneficiary will be significantly lower than the overall budget of the project. While we may justify these costs to our budgetary authorities as being ‘direct costs’, the end result for the beneficiary is that these amounts do not reach those we are trying to assist.
Additionally, implementing partners often rely on UN or other international organisations for a significant
part of their funding. This raises the question of double counting. Implementing partners report on those they assist, but the UN no doubt reports on the very same groups. Such partners will also often spend significant amounts on fundraising. This may also be called into question as such spending also reduces the amounts available for beneficiaries and may not be justified if much of the funding comes in any event from a UN organisation.
ECHO is introducing changes to the Single Form that will already give improved data, but it would be useful to carry out a short study to look at how much donor money gets to the beneficiary.
In order to keep the study manageable and relevant for humanitarian assistance, it is proposed to limit the study to three UN organisations, and to two NGOs. The number of contracts to be reviewed will be defined and justified in the methodology to be developed by the consultant, but should remain relatively small (fewer than 30) so as to favour an in-depth analysis of the selected operations.
This study is relevant to the localisation of aid discussions – perhaps working directly with a local partner is more efficient – and also to the delivery modality. Does for example the choice of modality have implications for shortening the chain and cutting out one or more of the ‘middlemen’? Can we also draw some conclusions on the feasibility of separating delivery of assistance (with fewer links in the chain) from the other aspects of assessment and monitoring?
2. Objective of the assignment
The overall objective of the assignment is to establish how much donor money gets to the beneficiary. The assignment should answer the following questions:
• Establish how much donor money (net) reaches the beneficiary? The consultant will need to devise a methodology, which allows for the selection of a small but representative sample. The methodology should also define what is to be included in the
Annex 1. Terms of Reference
26 From Grand Bargain to beneficiary: an analysis of funding flows through the humanitarian system
amount that finally reaches the beneficiary. For example, in the case of a cash-based transfer, the amount received is straightforward; in the case of an in-kind transfer, the market value of the product could be a suitable measure. However, the consultant will also need to come up with a way to put a value, per beneficiary, on a service, training or other activity that directly or indirectly benefits the beneficiary. It is proposed that a third of the projects selected should be ones with the delivery of cash-based assistance as the main means of delivery of assistance; a third of projects should be ones delivering assistance primarily as in-kind and the remaining projects should cover assistance delivering a service, training or other activity.
• What are the total costs of each stage in the chain? The objective of the study is not to attribute overheads, staffing costs, assessment, targeting and monitoring costs etc. by result or activity – rather it is to extract the net amount that remains for the beneficiary once all cost are taken into account and to identify at what stage in the chain these costs arise. They will arise at UN level, at implementing partner level (international NGO) and at local partner level and it would be important to identify the proportion of costs arising at each level.
• Identify the principal role (s) of each actor in the chain. Who, for example, is responsible for assessment, targeting and monitoring? Who is responsible for procurement and delivery (of cash, in kind or services)?
• What is the total volume of funding that is implemen-ted by a local partner and how much of this reaches the beneficiary? Where local partners are part of the chain, what percentage of costs do they absorb?
3. Scope and key issues to be covered
The contractor is expected to be conversant with the current aid architecture, the proposals under consideration in view of the World Humanitarian Summit and following the report of the High Level Panel on Humanitarian Financing ‘Too important to fail, addressing the humanitarian financing gap’ and the Grand Bargain.
4. Tasks, outputs and milestones
TasksThe contractor will:• undertake a mapping of available information on
the costs of delivering humanitarian assistance and compare the amounts that reach beneficiaries, depending on the length of the delivery chain;
• examine whether the same beneficiaries are counted in both UN and implementing partner reports;
• comment on the role of local partners, both in terms of costs absorbed and in terms of capacity;
• provide an opinion on the implications of the choice of modality for the actors required to deliver assistance to the final beneficiary. The role of private sector operators should be considered;
• provide an opinion on the feasibility of separating delivery of assistance from the other aspects of assessment and monitoring. In particular, to assess whether there is duplication in the roles performed by the UN, their international NGO implementing partners and the local partners.
The contractor shall conduct interviews with key stakeholders (representatives of donors, UN agencies and NGOs, both international and local).
Output:An interim report on initial findings to be made available two weeks in advance of the World Humanitarian Summit.
A final report, including all aspects to be made available by the end of September.
5. Expertise required
5.1. Education, experience, references of the consultants• Degree in relevant subject (humanitarian aid,
international relations, political science, or similar)• Thorough knowledge of and experience in cash-
based responses • Thorough knowledge of the international
humanitarian architecture.
5.2. Working languages English.
27
6. Duration, location and overall resources
6.1 Tentative Timeline• By mid-May: interim report on the mapping of
information available through desk review and interviews of key international stakeholders
• By end of September: final report
6.2. LocationInitial desk review and discussions with UN and international NGOs in Brussels or through their Headquarters. Follow-up contacts (phone/Skype) with local NGOs.
6.3. ResourcesThe contractor shall define the resources to be affected to the assignment.

The Humanitarian Policy Group is one of the world’s leading teams of independent researchers and information professionals working on humanitarian issues. It is dedicated to improving humanitarian policy and practice through a combination of high-quality analysis, dialogue and debate.
Readers are encouraged to quote or reproduce materials from this publication but, as copyright holders, ODI requests due acknowledgement and a copy of the publication. This and other HPG reports are available from www.odi.org.uk/hpg.
© Overseas Development Institute, 2017
Humanitarian Policy GroupOverseas Development Institute203 Blackfriars RoadLondon SE1 8NJUnited Kingdom
Tel. +44 (0) 20 7922 0300Fax. +44 (0) 20 7922 0399E-mail: [email protected]: http://www.odi.org//hpg
Cover photo: Ramsey Cascades.© Jenny Pansing via Flickr
HPGHumanitarianPolicy Group