Embed Size (px)
Citation preview

Journal of
ARTICLE IN PRESS
www.elsevier.com/locate/yjsbi
Journal of Structural Biology xxx (2007) xxx–xxx
StructuralBiology
From high-resolution AFM topographs to atomic modelsof supramolecular assemblies
Simon Scheuring a,*, Thomas Boudier b, James N. Sturgis c
a Institut Curie, UMR168-CNRS, 26 Rue d’Ulm, 75248 Paris, Franceb INSERM U759, Institut Curie, Bat 112, Centre Universitaire Orsay, 91405 Orsay, France
c UPR-9027 LISM, IBSM, CNRS, 31 Chemin Joseph Aiguier, 13402 Marseille Cedex 20, France
Received 25 August 2006; received in revised form 5 January 2007; accepted 13 January 2007
Abstract
Atomic force microscopy (AFM) has developed into a powerful tool in membrane biology. AFM features an outstanding signal-to-noise ratio that allows substructures on individual macromolecules to be visualized. Most recently, AFM topographs have shown thesupramolecular assembly of the bacterial photosynthetic complexes in native membranes. Here, we have determined the translationaland rotational degrees of freedom of the complexes in AFM images of multi-protein assemblies, in order to build realistic atomic modelsof supramolecular assemblies by docking high-resolution structures into the topographs. Membrane protein assemblies of megadaltonsize comprising several hundreds of polypeptide chains and pigments were built with Angstrom precision.� 2007 Elsevier Inc. All rights reserved.
Keywords: Bacterial photosynthesis; LH2; Light harvesting; Photosynthetic apparatus; Reaction center
1. Introduction
The atomic force microscope [AFM (Binnig et al.,1986)] has developed into a powerful tool in membraneresearch (Engel, 2003). Topographs at submolecular res-olution have been acquired on 2D-crystallized (Schabertet al., 1995) or densely packed (Seelert et al., 2000) mem-brane proteins, and most recently on native membranescontaining the supramolecular architecture of multiplemembrane protein complexes (Scheuring and Sturgis,2005), under close-to-native conditions, in buffer solutionand under ambient pressure and temperature. AFMtopographs have a lateral and a vertical resolution of�10 and �1 A, respectively (Muller et al., 1999). In bestcases, individual loops comprising �4 amino acids couldbe detected (Buzhynskyy et al., 2007; Muller et al., 2000;Scheuring et al., 1999). This showed a high spatial reso-
1047-8477/$ - see front matter � 2007 Elsevier Inc. All rights reserved.
doi:10.1016/j.jsb.2007.01.021
* Corresponding author. Fax: +33 1 40510636.E-mail address: [email protected] (S. Scheuring).
Please cite this article in press as: Scheuring, S. et al., From high-re(2007), doi:10.1016/j.jsb.2007.01.021
lution of raw data AFM topographs suitable for dockingatomic structures into images of multi-protein assemblies,in a way analogous to the rationales used to dock atomicstructures into 3D densities from single particle electronmicroscopy analysis of multi-protein complexes. Simi-larly, the dimeric rhodopsin assembly was modeled basedon AFM topographs of disc membranes (Fotiadis et al.,2003; Liang et al., 2003). Conceptually, in order to docka high-resolution structure accurately into an envelope oflower resolution, you need to define the six degrees offreedom, three translational and three rotational, of themolecule in the 3D space. This can be done by cross-cor-relation searches within the data set in order to optimizethe fit. For membrane proteins, the case is simpler asonly three degrees of freedom need to be determined,since the membrane plane restricts one translationaland two rotational degrees of freedom.
High-resolution structures of the individual complexesof the bacterial photosynthetic apparatus have greatlyadvanced our understanding of the functional mechanisms
solution AFM topographs to atomic models ..., J. Struct. Biol.

2 S. Scheuring et al. / Journal of Structural Biology xxx (2007) xxx–xxx
ARTICLE IN PRESS
[for review see (Hu et al., 2002)]: a nonameric light harvest-ing complex 2 (LH2) from Rhodopseudomonas (Rps.) aci-
dophila (McDermott et al., 1995), and an octameric LH2from Phaeospirillum (Phsp.) molischianum (Koepke et al.,1996), the structures of reaction centers (RCs) from Blast-
ochloris (Blc.) viridis (Deisenhofer et al., 1984, 1985) andRhodobacter (Rb.) sphaeroides (Allen et al., 1987), thecytochrome bc1 complex from Rb. capsulatus (Berryet al., 2004) [similar to the mitochondrial bc1 complex(Xia et al., 1997), and plant b6f complexes (Kurisu et al.,2003; Stroebel et al., 2003)], and the F1 (Abrahams et al.,1994) and FO parts of homologous ATP synthetases (Meieret al., 2005) were solved. These structures form the uniquebasis for molecular docking of the complete photosyntheticmachinery into AFM topographs of native membranes.Hence, high-resolution structures and images of supramo-lecular assemblies together promise to provide a full molec-ular picture for understanding of the bacterialphotosynthetic machinery.
Atomic force microscopy (AFM) images have giveninsights into the architecture of the photosynthetic appa-ratus in several different photosynthetic bacteria, i.e. ofRps. viridis (Scheuring et al., 2003b), Rsp. photometricum
(Scheuring et al., 2004a; Scheuring and Sturgis, 2005;Scheuring et al., 2004b), Rb. sphaeroides (Bahatyrovaet al., 2004), Rb. blasticus (Scheuring et al., 2004a), Phsp.
molischianum (Goncalves et al., 2005a), and Rps. palustris
(Scheuring et al., 2006). Recently, we have observed thestructural modifications during chromatic adaptation ofthe photosynthetic apparatus of Rsp. photometricum tohigh-light and low-light growth conditions using high-res-olution AFM. Interestingly, core complexes gather inmembrane domains with �3.5 LH2 rings per core with-out being in a fixed regular architecture. AdditionalLH2 synthesized under low-light conditions are assem-bled in para-crystalline antenna domains (Scheuringand Sturgis, 2005).
Here, we have performed a detailed analysis of theimaging precision of such high-resolution AFM topo-graphs. We have found that the localization of proteincomplexes, determined by 2D-gaussian fitting of cross-correlation peaks, is Angstrom-precise. Furthermore,the rotational alignment of the complexes providesunambiguous results. Based on the spatial coordinatesand the rotational orientation of the complexes, we havebeen able to build accurate structural models of nativesupramolecular assemblies. We have used high-resolutioncrystallographic structures for rational docking. We havebuilt a model consisting of seven LH2 nonamers and onecore complex comprising 16 LH1 subunits and the RCfrom high-light-adapted membranes, and an antennadomain of fifteen LH2 from low-light-adapted mem-branes. The total masses of these assemblies are>1 MDa and contain several hundreds of pigment mole-cules. This machinery alone is capable of performing theinitial steps of bacterial photosynthesis, light harvestingand charge separation.
Please cite this article in press as: Scheuring, S. et al., From high-re(2007), doi:10.1016/j.jsb.2007.01.021
2. Results and discussion
2.1. High-resolution AFM topographs of the supramolecular
assembly of complexes in native membranes
Recently high-resolution topographs of native photo-synthetic membranes from several purple bacteria specieswere acquired (Bahatyrova et al., 2004; Goncalves et al.,2005a; Scheuring et al., 2003b, 2004a,b, 2005, 2006; Sche-uring and Sturgis, 2005). A particularly detailed view,described the rearrangement of photosynthetic complexesin native membranes of Rsp. photometricum in responseto different light-intensities during cell growth (Scheuringand Sturgis, 2005). These images showed the supramolecu-lar assembly of LH2 and core complexes in high-light-adapted (Fig. 1A and B) and LH2-only antenna domainsin low-light-adapted membranes (Fig. 1C and D), and weresufficiently resolved to show the surface protrudingdomains of individual LH subunits.
2.2. Position and rotation determination of LH2 complexes
LH2 complexes have internal symmetry, as they areoligomers of identical subunits. In Rsp. photometricum
most LH2 complexes have 9-fold symmetry (Scheuringet al., 2004a). To determine the spatial localization androtational alignment of LH2 complexes in the native mem-brane, we used either a 9-fold symmetrized (inset inFig. 2C, top) or a non-symmetrized (inset in Fig. 2C, bot-tom) average as cross-correlation reference. Unambiguouscross-correlation peaks at LH2 positions were found withboth references (Fig. 2A). The cross-correlation peaks werefitted by 2D-gaussians (Fig. 2B). All fits converged cor-rectly to give Gaussians with an average full width at halfheight (FWHH) of 9.2 ± 1.0 A. The shape of the cross-cor-relation peak depends strongly on the AFM tip shape usedfor imaging, since a structural feature imaged by a blunt tipis contoured smoothly and enlarged while the same featureimaged by a sharp tip is thinner and has sharper edges.Correspondingly, the cross-correlation peak will in the firstcase be large and in the second case thin and sharp. Thusthe width of the Gaussian fit is probably dominated bythe tip self-convolution. More appropriately for determin-ing the complex positions, the fitting statistics of the cross-correlation peaks with a Gaussian function indicate theprecision with which the maximum can be positioned, thevalue for this standard error is of 0.12 ± 0.08 A. This com-parison of the fit and the actual pixel values of the cross-correlation peaks indicate a spatial localization of com-plexes with a precision of about 1/20 of the size of a pixelin the original image. Thus all the complexes can be spa-tially located with sub-Angstrom precision (Fig. 2B). Fordetermination of the spatial localization, we also tested afeatureless ring (360-fold symmetrized average) as refer-ence, because a featureless ring provides non-biased resultsof the location of circular complexes and does not implyprior knowledge of the subunit structure. This approach
solution AFM topographs to atomic models ..., J. Struct. Biol.
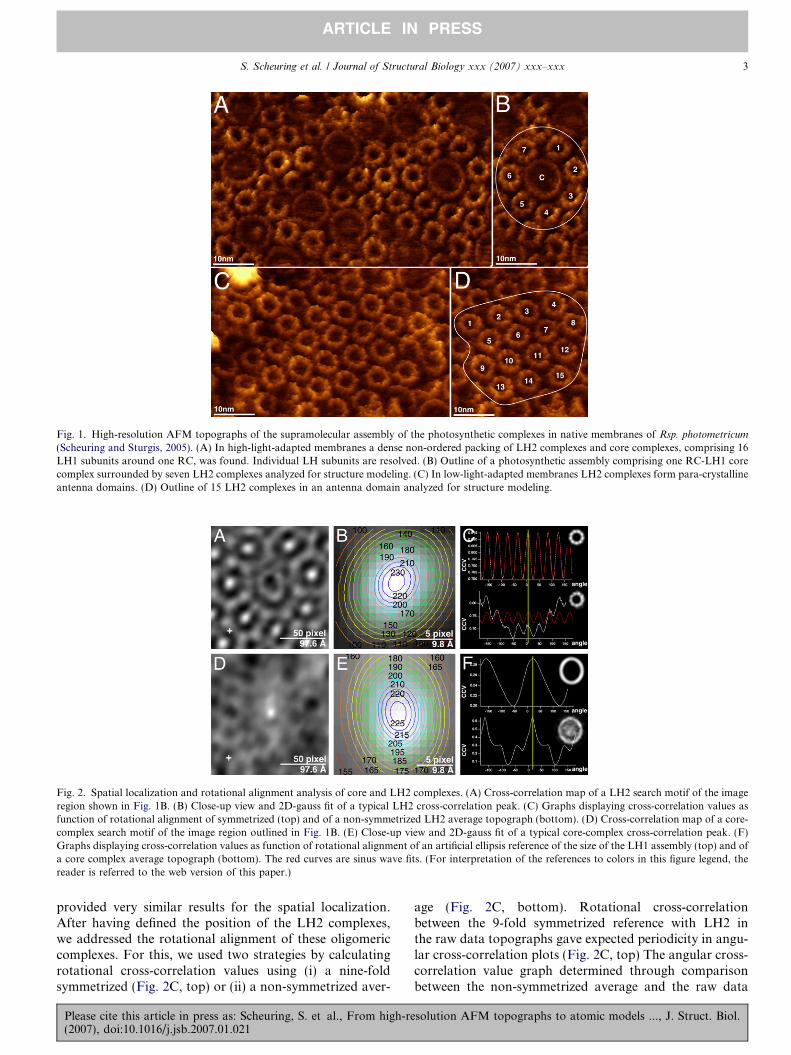
Fig. 1. High-resolution AFM topographs of the supramolecular assembly of the photosynthetic complexes in native membranes of Rsp. photometricum
(Scheuring and Sturgis, 2005). (A) In high-light-adapted membranes a dense non-ordered packing of LH2 complexes and core complexes, comprising 16LH1 subunits around one RC, was found. Individual LH subunits are resolved. (B) Outline of a photosynthetic assembly comprising one RC-LH1 corecomplex surrounded by seven LH2 complexes analyzed for structure modeling. (C) In low-light-adapted membranes LH2 complexes form para-crystallineantenna domains. (D) Outline of 15 LH2 complexes in an antenna domain analyzed for structure modeling.
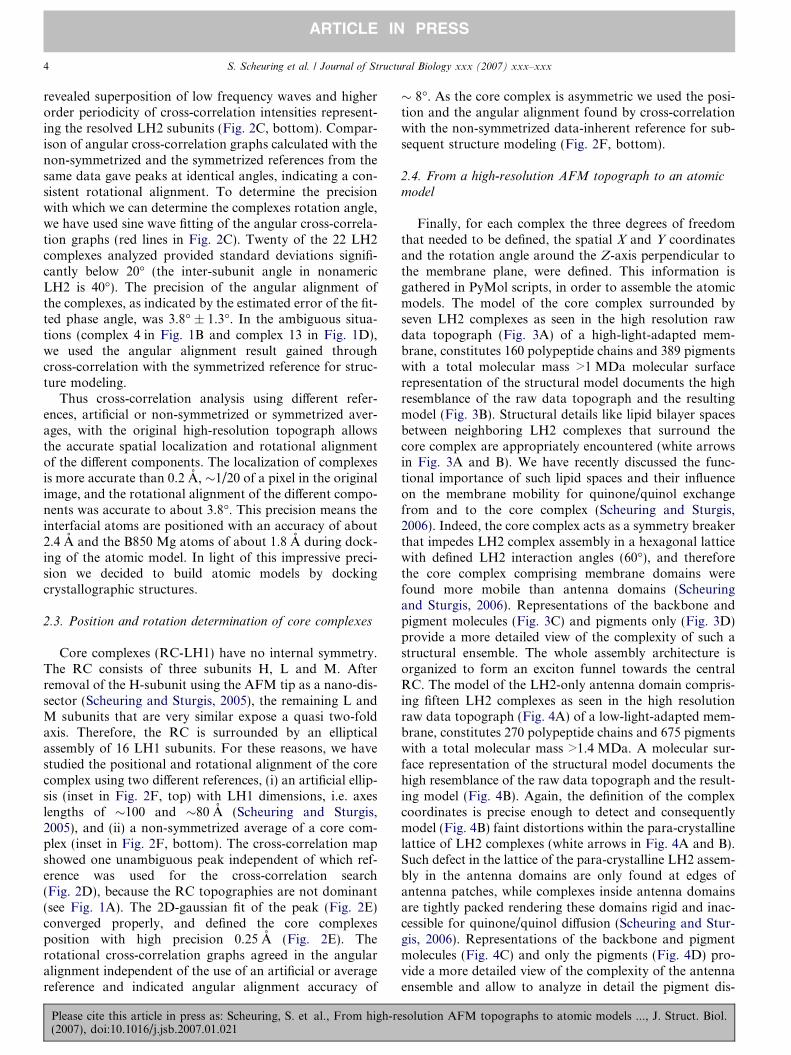
Fig. 2. Spatial localization and rotational alignment analysis of core and LH2 complexes. (A) Cross-correlation map of a LH2 search motif of the imageregion shown in Fig. 1B. (B) Close-up view and 2D-gauss fit of a typical LH2 cross-correlation peak. (C) Graphs displaying cross-correlation values asfunction of rotational alignment of symmetrized (top) and of a non-symmetrized LH2 average topograph (bottom). (D) Cross-correlation map of a core-complex search motif of the image region outlined in Fig. 1B. (E) Close-up view and 2D-gauss fit of a typical core-complex cross-correlation peak. (F)Graphs displaying cross-correlation values as function of rotational alignment of an artificial ellipsis reference of the size of the LH1 assembly (top) and ofa core complex average topograph (bottom). The red curves are sinus wave fits. (For interpretation of the references to colors in this figure legend, thereader is referred to the web version of this paper.)
S. Scheuring et al. / Journal of Structural Biology xxx (2007) xxx–xxx 3
ARTICLE IN PRESS
provided very similar results for the spatial localization.After having defined the position of the LH2 complexes,we addressed the rotational alignment of these oligomericcomplexes. For this, we used two strategies by calculatingrotational cross-correlation values using (i) a nine-foldsymmetrized (Fig. 2C, top) or (ii) a non-symmetrized aver-
Please cite this article in press as: Scheuring, S. et al., From high-re(2007), doi:10.1016/j.jsb.2007.01.021
age (Fig. 2C, bottom). Rotational cross-correlationbetween the 9-fold symmetrized reference with LH2 inthe raw data topographs gave expected periodicity in angu-lar cross-correlation plots (Fig. 2C, top) The angular cross-correlation value graph determined through comparisonbetween the non-symmetrized average and the raw data
solution AFM topographs to atomic models ..., J. Struct. Biol.
4 S. Scheuring et al. / Journal of Structural Biology xxx (2007) xxx–xxx
ARTICLE IN PRESS
revealed superposition of low frequency waves and higherorder periodicity of cross-correlation intensities represent-ing the resolved LH2 subunits (Fig. 2C, bottom). Compar-ison of angular cross-correlation graphs calculated with thenon-symmetrized and the symmetrized references from thesame data gave peaks at identical angles, indicating a con-sistent rotational alignment. To determine the precisionwith which we can determine the complexes rotation angle,we have used sine wave fitting of the angular cross-correla-tion graphs (red lines in Fig. 2C). Twenty of the 22 LH2complexes analyzed provided standard deviations signifi-cantly below 20� (the inter-subunit angle in nonamericLH2 is 40�). The precision of the angular alignment ofthe complexes, as indicated by the estimated error of the fit-ted phase angle, was 3.8� ± 1.3�. In the ambiguous situa-tions (complex 4 in Fig. 1B and complex 13 in Fig. 1D),we used the angular alignment result gained throughcross-correlation with the symmetrized reference for struc-ture modeling.
Thus cross-correlation analysis using different refer-ences, artificial or non-symmetrized or symmetrized aver-ages, with the original high-resolution topograph allowsthe accurate spatial localization and rotational alignmentof the different components. The localization of complexesis more accurate than 0.2 A, �1/20 of a pixel in the originalimage, and the rotational alignment of the different compo-nents was accurate to about 3.8�. This precision means theinterfacial atoms are positioned with an accuracy of about2.4 A and the B850 Mg atoms of about 1.8 A during dock-ing of the atomic model. In light of this impressive preci-sion we decided to build atomic models by dockingcrystallographic structures.
2.3. Position and rotation determination of core complexes
Core complexes (RC-LH1) have no internal symmetry.The RC consists of three subunits H, L and M. Afterremoval of the H-subunit using the AFM tip as a nano-dis-sector (Scheuring and Sturgis, 2005), the remaining L andM subunits that are very similar expose a quasi two-foldaxis. Therefore, the RC is surrounded by an ellipticalassembly of 16 LH1 subunits. For these reasons, we havestudied the positional and rotational alignment of the corecomplex using two different references, (i) an artificial ellip-sis (inset in Fig. 2F, top) with LH1 dimensions, i.e. axeslengths of �100 and �80 A (Scheuring and Sturgis,2005), and (ii) a non-symmetrized average of a core com-plex (inset in Fig. 2F, bottom). The cross-correlation mapshowed one unambiguous peak independent of which ref-erence was used for the cross-correlation search(Fig. 2D), because the RC topographies are not dominant(see Fig. 1A). The 2D-gaussian fit of the peak (Fig. 2E)converged properly, and defined the core complexesposition with high precision 0.25 A (Fig. 2E). Therotational cross-correlation graphs agreed in the angularalignment independent of the use of an artificial or averagereference and indicated angular alignment accuracy of
Please cite this article in press as: Scheuring, S. et al., From high-re(2007), doi:10.1016/j.jsb.2007.01.021
� 8�. As the core complex is asymmetric we used the posi-tion and the angular alignment found by cross-correlationwith the non-symmetrized data-inherent reference for sub-sequent structure modeling (Fig. 2F, bottom).
2.4. From a high-resolution AFM topograph to an atomic
model
Finally, for each complex the three degrees of freedomthat needed to be defined, the spatial X and Y coordinatesand the rotation angle around the Z-axis perpendicular tothe membrane plane, were defined. This information isgathered in PyMol scripts, in order to assemble the atomicmodels. The model of the core complex surrounded byseven LH2 complexes as seen in the high resolution rawdata topograph (Fig. 3A) of a high-light-adapted mem-brane, constitutes 160 polypeptide chains and 389 pigmentswith a total molecular mass >1 MDa molecular surfacerepresentation of the structural model documents the highresemblance of the raw data topograph and the resultingmodel (Fig. 3B). Structural details like lipid bilayer spacesbetween neighboring LH2 complexes that surround thecore complex are appropriately encountered (white arrowsin Fig. 3A and B). We have recently discussed the func-tional importance of such lipid spaces and their influenceon the membrane mobility for quinone/quinol exchangefrom and to the core complex (Scheuring and Sturgis,2006). Indeed, the core complex acts as a symmetry breakerthat impedes LH2 complex assembly in a hexagonal latticewith defined LH2 interaction angles (60�), and thereforethe core complex comprising membrane domains werefound more mobile than antenna domains (Scheuringand Sturgis, 2006). Representations of the backbone andpigment molecules (Fig. 3C) and pigments only (Fig. 3D)provide a more detailed view of the complexity of such astructural ensemble. The whole assembly architecture isorganized to form an exciton funnel towards the centralRC. The model of the LH2-only antenna domain compris-ing fifteen LH2 complexes as seen in the high resolutionraw data topograph (Fig. 4A) of a low-light-adapted mem-brane, constitutes 270 polypeptide chains and 675 pigmentswith a total molecular mass >1.4 MDa. A molecular sur-face representation of the structural model documents thehigh resemblance of the raw data topograph and the result-ing model (Fig. 4B). Again, the definition of the complexcoordinates is precise enough to detect and consequentlymodel (Fig. 4B) faint distortions within the para-crystallinelattice of LH2 complexes (white arrows in Fig. 4A and B).Such defect in the lattice of the para-crystalline LH2 assem-bly in the antenna domains are only found at edges ofantenna patches, while complexes inside antenna domainsare tightly packed rendering these domains rigid and inac-cessible for quinone/quinol diffusion (Scheuring and Stur-gis, 2006). Representations of the backbone and pigmentmolecules (Fig. 4C) and only the pigments (Fig. 4D) pro-vide a more detailed view of the complexity of the antennaensemble and allow to analyze in detail the pigment dis-
solution AFM topographs to atomic models ..., J. Struct. Biol.

Fig. 3. Comparison of the AFM topograph and the structural model of a supramolecular protein assembly of a core complex surrounded by seven LH2.(A) Raw data AFM topograph. (B) Surface representation of final structural model. (C) Protein backbones and pigments. (D) Photosynthetic pigments.The total mass of the assembly is >1 MDa comprising 160 polypeptide chains and 389 pigment molecules.
S. Scheuring et al. / Journal of Structural Biology xxx (2007) xxx–xxx 5
ARTICLE IN PRESS
tances between complexes important for exciton trappingand energy transfer. Since average crystallographic struc-tures are used for docking, the structural models presentalso ‘average’ structure assemblies and do not accountfor structural fluctuations of individual peptide chains.
2.5. Inter-pigment distances in structural models
We have computed all pigment distances in the struc-tural models (Figs. 3 and 4) and average the pigment envi-ronment of the spectrally different (B800, B850 and B875)bacteriochlorophylls (Fig. 5). This analysis is interestingfor understanding exciton energy transfer within the mem-brane. The B800–B800 distances (yellow lines in Fig. 5) inthe antenna domain remarkably reveal an average of 0.73B800–B800 inter-ring neighbors at distances significantlyshorter than the B800–B800 intra-ring neighbors. Thismay indicate considerable B800–B800 energy exchange innative membranes, even if in isolated complexes B800 func-tions for initial photon capture and direct exciton transferto a B850 within the same LH2. The B800–B850 distances(light orange lines in Fig. 5) are about 10 A shorter within aLH2 complex than between rings. The B850–B850 (darkorange lines in Fig. 5) are shortest (�9.1 A) inside theLH2 ring helping to store an exciton, until it hops fromB850 of one ring to B850 of a neighboring ring at close dis-tance 16 A (0.01 B850), 21 A (0.1 B850) and 26.6 A (1.0B850). These B850–B850 inter-ring distances are known
Please cite this article in press as: Scheuring, S. et al., From high-re(2007), doi:10.1016/j.jsb.2007.01.021
to be most important for exciton transfer that takes placewith �5 ps (Hu et al., 1998). Finally, for energy capturein the RC the excitons are funneled from LH2 to LH1 overB850–B875 (red line in Fig. 5). B850–B875 coupling startsat distances 16 A (0.03) and is efficient at 21.7 A (1.0 B850–B875). We expect that the structural similarity betweenLH2 and LH1 subunits make both minimal distancesB850–B850 inter-ring and B850–B875 at 16 A. However,since the curvature of LH1 is less than that of LH2, moreB875 are exposed to the same surface area of the complex,and therefore the average inter-pigment distances betweenB850 and B875 increase more rapidly than between B850and B850 (compare red and thin dark orange lines inFig. 5) In conclusion, the inter-complex distances betweenpigments are very short and importantly probably closeenough to result in exciton coupling between complexes,at least in the case of B850–B850 and B850–B875.
2.6. Outlook – limitations and refinement
In this work, we have performed and analyzed cross-correlation-based definition of positional and rotationalcomplex alignment in raw data high-resolution AFMtopographs. To date, these topographs are at �10 A lat-eral and �1 A vertical resolution (Muller et al., 1999;Scheuring et al., 2001, 2003a,b). Based on such data,atomic structures of membrane proteins can be dockedto topographs to provide models of supramolecular archi-
solution AFM topographs to atomic models ..., J. Struct. Biol.

Fig. 4. Comparison of the AFM topograph and the structural model of a supramolecular protein assembly of a paracrystalline LH2 antenna domain. (A)Raw data AFM topograph. (B) Surface representation of final structural model. (C) Protein backbones and pigments. (D) Photosynthetic pigments. Thetotal mass of the assembly is >1.4 MDa comprising 270 polypeptide chains and 675 pigment molecules.
Fig. 5. Pigment interaction distances in the structural models shown in Fig. 3 (assembly) and Fig. 4 (antenna). The average number of pigments withindistinct distances from each pigment (bin size 0.1 A) was calculated, and plotted: B800–B800, yellow; B800–B850, bright orange; B850–B850, orange;B850–B875, red. The bold lines comprise the intra-ring distances, while the thin lines depict solely the inter-ring distances important for exciton hopingfrom complex to complex in energy transfer. (For interpretation of the references to color in this figure legend, the reader is referred to the Web version ofthis article.)
6 S. Scheuring et al. / Journal of Structural Biology xxx (2007) xxx–xxx
ARTICLE IN PRESS
Please cite this article in press as: Scheuring, S. et al., From high-resolution AFM topographs to atomic models ..., J. Struct. Biol.(2007), doi:10.1016/j.jsb.2007.01.021
S. Scheuring et al. / Journal of Structural Biology xxx (2007) xxx–xxx 7
ARTICLE IN PRESS
tectures of complex multi-protein assemblies. Here, wehave used high-resolution topographs of native photosyn-thetic membranes of Rsp. photometricum. Initially, wehave assumed that the membrane plane inhibits onedegree of translational and two degrees of rotational free-dom. This is not entirely true for all membrane proteins,but a justified restriction for the bacterial photosyntheticcomplexes. In general, the AFM is very precise (�0.1 A)to measure heights in the Z-dimension, i.e. normal tothe membrane plane. Therefore translational alignmentof complexes in the normal to the membrane plane is fea-sible. Equally, rotations of a protein over an axis that liesinside the membrane plane is represented in the topo-graph as a tilt of the molecule and can be defined withhigh precision (Scheuring et al., 2003a). In general, forenergy minimization reasons, one can assume that allhomo-oligomeric membrane proteins insert into the mem-brane with the symmetry axis normal to the membraneplane. We furthermore estimate that the rotational free-dom inside the membrane plane dominates largely overeventual tilt, and therefore our error estimate of �2.4 Afor peripheral atoms of a �50 A large transmembraneprotein accounts for such possible fluctuations. Hence,in future structural modeling in membranes where differ-ent complexes have different membrane insertion heightand/or tilt, the procedure presented here can be adaptedfor such special cases. The complexes of the bacterial pho-tosynthetic apparatus however feature pigments moleculesthat are aligned to each other in the membrane plane withsub-Angstrom precision, i.e. the B850 in LH2, the B875 inLH1 and the special pair Bchl in the RC are kept in planefor ideal exciton energy transfer. For this reason, we havein this work used a precise alignment of these pigments tolevel the complexes in Z-dimension, and the hypothesisthat these complexes may be tilted with respect to themembrane plane (Bahatyrova et al., 2004; Scheuringet al., 2003a; Walz et al., 1998) has been ruled out by asystematic reconstitution and AFM study (Goncalveset al., 2005b), as well as by a series of analysis of nativemembranes from different species (Goncalves et al.,2005a; Scheuring et al., 2001, 2003b, 2004a,b, 2005,2006; Scheuring and Sturgis, 2005). Future structuralmodels may also imply lipids. The lipid bilayer surfaceis defined in AFM topographs when complexes are suffi-ciently separated (see for example white arrow inFig. 3A). The bilayer lipids between the complex struc-tures could be modeled using molecular dynamics simula-tions. Furthermore, the AFM allows time-lapse imagingof membranes, and therefore observing lateral dynamicsof membrane proteins (Buzhynskyy et al., 2007; Mulleret al., 2003; Scheuring and Sturgis, 2006). In the case ofthe photosynthetic machinery described here, we havefound that complexes do not diffuse to change theirmolecular environment, but rather rattle about their posi-tion with amplitude of a few Angstrom, probably allow-ing passage of quinone/quinol through the membrane(Scheuring and Sturgis, 2006). Hence, it will be possible
Please cite this article in press as: Scheuring, S. et al., From high-re(2007), doi:10.1016/j.jsb.2007.01.021
to model rearrangements of the supramolecular assemblyof multiple complexes in the membrane as a function oftime.
3. Materials and methods
3.1. Atomic force microscopy (AFM)
The AFM was operated in contact mode at ambienttemperature and pressure. Imaging was performed with acommercial Nanoscope-E AFM (Veeco, Santa Barbara,CA, USA) equipped with a vertical engagement 160-lmscanner (J-scanner) and oxide-sharpened Si3N4 cantilevers(length 100 lm; k = 0.09 N/m; Olympus Ltd., Tokyo,Japan). For imaging minimal loading forces of �100 pNwere applied, at scan frequencies of 4–7 Hz using optimizedfeedback parameters. A detailed description of the dataacquisition is described in (Scheuring and Sturgis, 2005,2006). The piezo precision was calibrated and determinedby analyzing bacteriorhodopsin (BR) membrane protein2D-crystals (lattice dimensions: a, b = 62.5 A, c = 120�)at scan ranges between 100 and 300 nm. After 1 h ofAFM scanning, no piezo drift could be detected as indi-cated by distinct diffraction spots in calculated power spec-tra from images of BR 2D-crystals.
3.2. Position and rotation determination of complexes
All image treatment and analysis of AFM topographswere performed using home-made plugins for the ImageJimage processing package (Rasband, 1997–2005). Briefly,a subregion of the AFM topograph, e.g., a LH2 complex,is selected and used as first reference. This reference is com-pared with the entire image in a pixel-by-pixel manner,resulting in a cross-correlation map that has value 1 wherethe image subregion is compared with itself (Saxton andBaumeister, 1982). Additionally, the reference is rotatedaround its center on each position, resulting in a maximumcross-correlation value as a function of the reference’s rota-tion angle.
A detailed analysis of the cross-correlation images wasperformed in IGOR PRO (Wavemetrics, Lake Oswego,OR, USA), this program uses a Levenberg–Marquard-based algorithm and estimates precision of fitted parame-ters from the covariance matrix. Briefly, the center ofweight of the cross-correlation peaks were fitted using a2D-gauss fit:
Aðx;yÞ ¼ z0 þ z1 � exp ðð�1=2Þ � ðððx� xcÞ=xwidthÞ2
þ ððy � ycÞ=ywidthÞ2ÞÞ
where z0 is the base line and z1 the amplitude of the 2D-gauss fit on the cross-correlation peak, xc, yc are the esti-mated center position in the x and y directions, and xwidth,ywidth are the full width at half height (FWHH) of the fitalong the x and the y-axis respectively. Fits in which themajor and minor axes of the 2D gaussian were free to ro-
solution AFM topographs to atomic models ..., J. Struct. Biol.

8 S. Scheuring et al. / Journal of Structural Biology xxx (2007) xxx–xxx
ARTICLE IN PRESS
tate always aligned with the fast and slow scan directions,thus this parameter was not fitted. Typically a field of 16-pixel square (�30 · 30A) in the cross-correlation maparound a peak was used for fitting.
The rotational cross-correlation graphs were fitted usinga sinusoidal function:
AðhÞ ¼ y0 þ y1 � sin ðN h þ /Þ
where y0 and y1 are the average values of the correlationfunction and the amplitude, of the sin wave functionrespectively, N is the frequency (cycles per ring), h is the an-gle and / the phase shift of the fit. Reported precisions arethe standard deviations of the fitted coefficients as deter-mined from the covariance matrix.
3.3. Structural modeling
The nonameric Rps. acidophila structure [1KZU(McDermott et al., 1995)] was used as LH2 complex.The core complex is a structural model based on theRb. sphaeroides RC structure [1OGV (Katona et al.,2003)] and an LH1 assembly constructed from 16 Phsp.
molischianum LH2 subunits [1LGH (Koepke et al.,1996)] elliptically arranged with axes length differencesof 15% as found in high-resolution AFM topographsof native membranes (Scheuring and Sturgis, 2005).LH2 and the core complex were first centered andaligned and then translated and rotated to their relativepositions. All Structure models of the supramolecularassemblies were assembled and structure figures gener-ated in PyMol (DeLano, 2002).
Acknowledgment
This study was supported by the INSERM and IN-SERM Avenir, CNRS and the Grant (ANR-06-NANO-023-01).
References
Abrahams, J.P., Leslie, A.G.W., Lutter, R., Walker, J.E., 1994. Structureat 2.8 angstrom resolution of F1-ATPase from bovine heart mito-chondria. Nature 370, 621–628.
Allen, J.P., Feher, G., Yeates, T.O., Komiya, H., Rees, D.C., 1987.Structure of the reaction center from Rhodobacter sphaeroides
R-26: the protein subunits. Proc. Natl. Acad. Sci. USA 84,6162–6166.
Bahatyrova, S., Frese, R.N., Siebert, C.A., Olsen, J.D., Van Der Werf,K.O., van Grondelle, R., Niederman, R.A., Bullough, P.A., Hunter,C.N., 2004. The native architecture of a photosynthetic membrane.Nature 430, 1058–1062.
Berry, E.A., Huang, L.-S., Saechao, L.K., Pon, N.G., Valkova-Valcha-nova, M., Daldal, F., 2004. X-ray structure of Rhodobacter capsulatus
cytochrome bc1: comparison with its mitochondrial and chloroplastcounterparts. Photosynth. Res. 81, 251–275.
Binnig, G., Quate, C.F., Gerber, C., 1986. Atomic force microscope. Phys.Rev. Lett. 56, 930–933.
Buzhynskyy, N., Hite, R.K., Walz, T., Scheuring, S., 2007. The supra-molecular architecture of junctional microdomains in native lensmembranes. EMBO Rep. 8, 51–55.
Please cite this article in press as: Scheuring, S. et al., From high-re(2007), doi:10.1016/j.jsb.2007.01.021
Deisenhofer, J., Epp, O., Miki, K., Huber, R., Michel, H., 1984. X-raystructure analysis of a membrane protein complex. Electron densitymap at 3 A resolution and a model of the chromophores of thephotosynthetic reaction center from Rhodopseudomonas viridis. J. Mol.Biol. 180, 385–398.
Deisenhofer, J., Epp, O., Miki, K., Huber, R., Michel, H., 1985.Structure of the protein subunits in the photosynthetic reactioncentre of Rhodopseudomonas viridis at 3 A resolution. Nature 318,618–624.
DeLano, W.L., 2002. The PyMOL Molecular Graphics System, <http://www.pymol.org>.
Engel, A., 2003. Robert Feulgen Lecture. Microscopic assessment ofmembrane protein structure and function. Histochem. Cell Biol. 120,93–102.
Fotiadis, D., Liang, Y., Filipek, S., Saperstein, D.A., Engel, A.,Palczewski, K., 2003. Atomic-force microscopy: rhodopsin dimers innative disc membranes. Nature 421, 127–128.
Goncalves, R.P., Bernadac, A., Sturgis, J.N., Scheuring, S., 2005a.Architecture of the native photosynthetic apparatus of Phaeospirillum
molischianum. J. Struct. Biol. 152, 221–228.Goncalves, R.P., Busselez, J., Levy, D., Seguin, J., Scheuring, S., 2005b.
Membrane insertion of Rhodopseudomonas acidophila light harvestingcomplex 2 (LH2) investigated by high resolution AFM. J. Struct. Biol.149, 79–86.
Hu, X., Damjanovic, A., Ritz, T., Schulten, K., 1998. Architecture andmechanism of the light-harvesting apparatus of purple bacteria. Proc.Natl. Acad. Sci. USA 95, 5935–5941.
Hu, X., Ritz, T., Damjanovic, A., Autenrieth, F., Schulten, K., 2002.Photosynthetic apparatus of purple bacteria. Quart. Rev. Biophys. 35,1–62.
Katona, G., Andreasson, U., Landau, E.M., Andreasson, L.E., Neutze,R., 2003. Lipidic cubic phase crystal structure of the photosyntheticreaction centre from Rhodobacter sphaeroides at 2.35 A resolution. J.Mol. Biol. 331, 681–692.
Koepke, J., Hu, X., Muenke, C., Schulten, K., Michel, H., 1996. Thecrystal structure of the light-harvesting complex II (B800-850) fromRhodospirillum molischianum. Structure 4, 581–597.
Kurisu, G., Zhang, H., Smith, J.L., Cramer, W.A., 2003. Structure of thecytochrome b6f complex of oxygenic photosynthesis: tuning the cavity.Science 302, 1009–1014.
Liang, Y., Fotiadis, D., Filipek, S., Saperstein, D., Palczewski, K.,Engel, A., 2003. Organization of the G protein-coupled receptorsrhodopsin and opsin in native membranes. J. Biol. Chem. 278,1655–1662.
McDermott, G., Prince, S.M., Freer, A.A., Hawthornthwaite-Lawless,A.M., Papiz, M.Z., Cogdell, R.J., Isaacs, N.W., 1995. Crystal structureof an integral membrane light-harvesting complex from photosyntheticbacteria. Nature 374, 517–521.
Meier, T., Polzer, P., Diederichs, K., Welte, W., Dimroth, P., 2005.Structure of the rotor ring of F-Type Na+-ATPase from Ilyobacter
tartaricus. Science 308, 659–662.Muller, D.J., Fotiadis, D., Scheuring, S., Muller, S.A., Engel, A.,
1999. Electrostatically balanced subnanometer imaging of biolog-ical specimens by atomic force microscopy. Biophys. J. 76, 1101–1111.
Muller, D.J., Heymann, J.B., Oesterhelt, F., Moller, C., Gaub, H., Buldt,G., Engel, A., 2000. Atomic force microscopy of native purplemembrane. Biochim. Biophys. Acta 1460, 27–38.
Muller, D.J., Engel, A., Matthey, U., Meier, T., Dimroth, P., Suda, K.,2003. Observing membrane protein diffusion at subnanometer resolu-tion. J. Mol. Biol. 327, 925–930.
Rasband, W.S., 1997–2005. ImageJ. U.S. National Institutes of Health,Bethesda, Maryland, USA, <http://rsb.info.nih.gov/ij/>.
Saxton, W.O., Baumeister, W., 1982. The correlation averaging of aregularly arranged bacterial cell envelope protein. J. Microsc. 127,127–138.
Schabert, F.A., Henn, C., Engel, A., 1995. Native Escherichia coli OmpFporin surfaces probed by atomic force microscopy. Science 268, 92–94.
solution AFM topographs to atomic models ..., J. Struct. Biol.

S. Scheuring et al. / Journal of Structural Biology xxx (2007) xxx–xxx 9
ARTICLE IN PRESS
Scheuring, S., Sturgis, J.N., 2005. Chromatic adaptation of photosyntheticmembranes. Science 309, 484–487.
Scheuring, S., Sturgis, J.N., 2006. Dynamics and diffusion in photosyn-thetic membranes from Rhodospirillum photometricum. Biophys J. 91,3707–3717.
Scheuring, S., Ringler, P., Borgina, M., Stahlberg, H., Muller, D.J., Agre,P., Engel, A., 1999. High resolution topographs of the Escherichia coli
waterchannel aquaporin Z. EMBO J. 18, 4981–4987.Scheuring, S., Reiss-Husson, F., Engel, A., Rigaud, J.-L., Ranck, J.-L.,
2001. High resolution topographs of the Rubrivivax gelatinosus light-harvesting complex 2. EMBO J. 20, 3029–3035.
Scheuring, S., Seguin, J., Marco, S., Levy, D., Breyton, C., Robert, B.,Rigaud, J.-L., 2003a. AFM characterization of tilt and intrinsicflexibility of Rhodobacter sphaeroides light harvesting complex 2(LH2). J. Mol. Biol. 325, 569–580.
Scheuring, S., Seguin, J., Marco, S., Levy, D., Robert, B., Rigaud, J.L.,2003b. Nanodissection and high-resolution imaging of the Rhodo-
pseudomonas viridis photosynthetic core-complex in native membranesby AFM. Proc. Natl. Acad. Sci. USA 100, 1690–1693.
Scheuring, S., Rigaud, J.-L., Sturgis, J.N., 2004a. Variable LH2 stoichi-ometry and core clustering in native membranes of Rhodospirillum
photometricum. EMBO J. 23, 4127–4133.
Please cite this article in press as: Scheuring, S. et al., From high-re(2007), doi:10.1016/j.jsb.2007.01.021
Scheuring, S., Sturgis, J.N., Prima, V., Bernadac, A., Levy, D., Rigaud, J.-L., 2004b. Watching the photosynthetic apparatus in native mem-branes. Proc. Natl. Acad. Sci. USA 101, 11293–11297.
Scheuring, S., Busselez, J., Levy, D., 2005. Structure of the dimeric PufX-containing core complex of Rhodobacter blasticus by in situ AFM. J.Biol. Chem. 180, 1426–1431.
Scheuring, S., Goncalves, R.P., Prima, V., Sturgis, J.N., 2006. Thephotosynthetic apparatus of Rhodopseudomonas palustris: structuresand organization. J. Mol. Biol. 358, 83–96.
Seelert, H., Poetsch, A., Dencher, N.A., Engel, A., Stahlberg, H., Muller,D.J., 2000. Proton powered turbine of a plant motor. Nature 405,418–419.
Stroebel, D., Choquet, Y., Popot, J.L., Picot, D., 2003. An atypical haemin the cytochrome b(6)f complex. Nature 426, 413–418.
Walz, T., Jamieson, S.J., Bowers, C.M., Bullough, P.A., Hunter, C.N.,1998. Projection structures of three photosynthetic complexes fromRhodobacter sphaeroides: LH2 at 6 A, LH1 and RC-LH1 at 25 A. J.Mol. Biol. 282, 833–845.
Xia, D., Yu, C.A., Kim, H., Xia, J.Z., Kachurin, A.M., Zhang, L.,Yu, L., Deisenhofer, J., 1997. Crystal structure of the cyto-chrome bc1 complex from bovine heart mitochondria. Science277, 60–66.
solution AFM topographs to atomic models ..., J. Struct. Biol.


![Atomic force microscopy based manipulation of graphene ...atomic force microscopy (AFM) based lithography [12,13]. So far, AFM lithography has been used only for cutting graphene utilizing](https://img.pdfslide.net/doc/110x75/5e611e37f3ee607f1c217b31/atomic-force-microscopy-based-manipulation-of-graphene-atomic-force-microscopy.jpg)