Embed Size (px)
Citation preview
UNIVERSITA’ DEGLI STUDI DI MILANO-BICOCCA
Facoltà di Scienze Matematiche, Fisiche e Naturali
Scuola di Dottorato di Scienze
Dottorato di Ricerca in Biotecnologie Industriali
XXVI Ciclo
From intracellular antioxidant availability to modulation
of mRNA metabolism: two different approaches to
develop industrially attractive Saccharomyces cerevisiae
strains with improved acetic acid tolerance
Dott.ssa Francesca Martani
Tutor: Prof.ssa Paola Branduardi
Anno Accademico 2012/2013

Dottorato di Ricerca in Biotecnologie Industriali
XXVI Ciclo
Dottorando: Francesca Martani
Matricola: 745003
Tutor: Prof.ssa Paola Branduardi
Coordinatore: Prof. Marco Vanoni
Università degli Studi di Milano-Bicocca
Piazza dell’Ateneo Nuovo, 1, 20126, Milano
Dipartimento di Biotecnologie e Bioscienze
Piazza della Scienza 2, 20126, Milano

Index
Abstract p. 1
Riassunto p. 7
Introduction p. 13
The biorefinery and cell factory concepts p. 15
How to improve a cell factory? p. 16
The exploitation of Saccharomyces cerevisiae p. 23
for second generation ethanol production
Mechanisms of acetic acid-induced cell death in p. 26
Saccharomyces cerevisiae: an overview
Chapter 1. p. 31
Different response to acetic acid stress in Saccharomyces
cerevisiae wild type and L-ascorbic acid producing strains
Chapter 2. p. 67
Effects of the intracellular production of Vitamin C on
Saccharomyces cerevisiae wild chronological life span
Chapter 3. p. 91
mRNA metabolism engineering to improve Saccharomyces
cerevisiae stress tolerance
Conclusions p. 133
References p. 137


1
Abstract

2
3
The challenge of biorefineries is to develop processes aimed at the complete
conversion of different type of biomass feedstock (wastes are preferred) to biofuels
and chemicals mainly through microbial metabolism. Unfortunately, during
industrial fermentations selected microorganisms, the so-called cell factories, meet
multiple stresses, associated with either the operative conditions of the process or
the presence of inhibitory compounds. This causes cell metabolism and growth
impairment, leading to the reduction of yield and productivity of the process. In
this context, the development of improved cell factories is an important issue for
the attainment of the commercial requirement for yield, productivity and titer.
Several rational tools, principally based on the over-expression or deletion of single
gene(s), have been applied to improve microorganisms’ robustness and so to
minimize the consequences of the stressful conditions imposed by industrial
fermentations. However, stress tolerant phenotypes are polygenic traits that require
the simultaneous modification of multiple genes. In the last years, whole genome
wide engineering approaches have been proposed to obtain complex phenotypes,
including stress tolerance. The principle of these techniques is the creation of
variability within a population and the subsequent selection of the desired
phenotype through a suitable screening method.
The yeast Saccharomyces cerevisiae is widely employed as a cell factory for the
production of several industrial products, and in particular for first and second
generation ethanol, due to its high ethanol yield and productivity and general
robustness. However, one of the major obstacles for the development of large-scale
ethanol production in second generation processes is the toxic effect of compounds
released during the pre-treatment of lignocellulosic biomasses, which are used as
feedstock, on cell growth and metabolism.
In the present work, two different approaches to improved S. cerevisiae tolerance
against acetic acid, one of the most toxic compounds deriving from biomass pre-
treatment, are described.
4
The response to acetic acid exposure in a S. cerevisiae strain engineered to
endogenously produce L-ascorbic acid (L-AA) and the parental strain was
evaluated and compared. The obtained results showed that the intracellular
production of L-AA increases acetic acid tolerance by partially protecting cells
from the acetic acid-induced programmed cell death (AA-PCD) through the
reduction of ROS accumulation. Moreover, the activation of some of the most
important mechanisms that participate in cell protection from acetic acid-induced
stress was found to be minor in the L-AA producing compared to parental cells,
suggesting that the produced antioxidant can support a more efficient stress
response by both acting as a ROS scavenger and by determining an indirect energy
saving caused by the minor activation of the endogenous defenses. In addition, the
effect of the intracellular L-AA production on S. cerevisiae chronological lifespan
(CLS) was investigated. The L-AA producing strain exhibits an extended CLS and
a lower apoptosis incidence compared with the parental strain. Further
investigations revealed that the extended CLS of the L-AA producing strain may
result from the synergic effect of a higher resistance to acetic acid, which
accumulates in the culture medium as a by-product of fermentative metabolism,
together with enhanced acetate consumption.
An improved resistance to acetic acid was also reached through the modulation of
the mRNA metabolism. This approach was applied with the aim to unlock a
complex phenotype through the modification of global gene expression at the post-
transcriptional control level. To this purpose, the gene encoding for the poly(A)
binding protein Pab1, that participates in the control of mRNA metabolism by
interacting with several proteins, was subjected to error-prone PCR to create a
mutant library that was screened in the presence of acetic acid. The screening
allowed the selection of a mutant Pab1 version that increases yeast resistance to
acetic acid. Furthermore, it has been demonstrated that the expression of PAB1 in a
centromeric plasmid, in addition to the chromosomal copy, increases yeast growth
5
performance under different stressful conditions, including acetic acid, and
correlates with the formation of larger stress granules. Although further
investigations will be needed to better understand the physiologic mechanisms
responsible for the phenotype improvement, the ethanol production/productivity of
the strains in which either Pab1 abundance or function have been modified will be
tested in bioreactor.
Overall, the obtained results suggest that the engineering of both the intracellular
antioxidant availability and the mRNA metabolism can represent efficient
strategies to improve the robustness of a cell factory.

6

7
Riassunto

8
9
Il concetto di bioraffineria prevede che quasi tutti i tipi di biomassa
(preferibilmente costituiti da scarti di lavorazione e produzione) possano essere
utilizzati come materia prima e convertiti in differenti tipi di biofuels e
biochemicals attraverso il metabolismo microbico. Sfortunatamente, durante le
fermentazioni industriali i microorganismi selezionati, definiti cell factory,
incontrano diverse condizioni stressanti associate sia alle condizioni operative del
processo, sia alla presenza di composti inibitori, che possono compromettere il
metabolismo e la crescita cellulare e determinare la conseguente riduzione della
resa e della produttività del processo stesso. In questo contesto, risulta cruciale lo
sviluppo di cell factory con caratteristiche migliorate per il raggiungimento delle
esigenze commerciali riguardanti la resa e la produttività. A tal proposito, diversi
approcci principalmente basati sulla over-espressione o delezione di singoli geni
sono stati applicati per incrementare la robustezza dei microrganismi, e quindi
minimizzare gli effetti dannosi dovuti alle condizioni stressanti imposte dalle
fermentazioni industriali. Tuttavia, la risposta allo stress è un tratto poligenico e
l’ottenimento di fenotipi più tolleranti richiede quindi la simultanea modifica di più
geni o elementi molecolari. Negli ultimi anni sono stati proposti alcuni approcci di
ingegneria su scala genomica per ottenere fenotipi complessi, quali la resistenza a
diversi tipi di stress. Tali metodi sono essenzialmente basati sulla creazione di
varianti all’interno di una popolazione e la successiva selezione del fenotipo di
interesse attraverso un idoneo metodo di screening.
Il lievito Saccharomyces cerevisiae è ampiamente utilizzato come cell factory per
la produzione di diversi prodotti di interesse industriale, e in particolare per la
produzione di etanolo di prima e seconda generazione grazie alla elevata resa,
produttività e robustezza al prodotto finale. Tuttavia, l’effetto tossico esercitato sul
metabolismo e sulla crescita cellulare da parte di diversi composti, tra cui quelli
liberati durante il pretrattamento delle biomasse lignocellulosiche, rappresenta uno
10
dei maggiori ostacoli per lo sviluppo della produzione di etanolo in larga scala in
processi di seconda generazione.
In questo lavoro sono descritti due diversi approcci per ottenere ceppi di S.
cerevisiae più tolleranti nei confronti dell’acido acetico, il quale rappresenta uno
dei composti maggiormente tossici derivanti dal pretrattamento delle biomasse
lignocellulosiche.
La risposta cellulare nei confronti dell’acido acetico è stata determinata e
comparata tra un ceppo di lievito ingegnerizzato per produrre acido L-ascorbico e il
ceppo parentale. I risultati ottenuti hanno mostrato che la produzione intracellulare
di acido L-ascorbico determina un’aumentata tolleranza all’acido acetico mediante
la parziale protezione nei confronti del programma di morte cellulare indotto da
acido acetico e la riduzione dell’accumulo di ROS. E’ stato inoltre osservato che
l’attivazione di alcuni dei più importanti meccanismi coinvolti nella protezione
cellulare nei confronti dello stress indotto da acido acetico è minore nel ceppo
produttore di acido L-ascorbico rispetto al ceppo parentale. Nel complesso, i
risultati ottenuti suggeriscono quindi che la produzione intracellulare di acido L-
ascorbico possa permettere una più efficiente risposta allo stress ossidativo indotto
da acido acetico sia in qualità di ROS scavenger sia mediante l’indiretto risparmio
energetico causato dalla minore attivazione delle difese endogene. Dal momento
che è noto in letteratura come alti livelli di ROS siano correlati con
l’invecchiamento cellulare, è stata misurata la chronological life span (CLS) sia del
ceppo parentale che del produttore di acido L-ascorbico, il quale ha mostrato una
CLS maggiore in concomitanza con una minor percentuale di cellule apoptotiche.
Ulteriori analisi hanno inoltre messo in luce che il ceppo produttore di acido L-
ascorbico è più resistente all’acido acetico, il quale accumula nel terreno di coltura
come sotto prodotto del metabolismo fermentativo, anche durante gli esperimenti
di invecchiamento e che inoltre tende a consumarlo più rapidamente del ceppo
11
parentale. Quindi, l’estesa CLS mostrata potrebbe essere il risultato dell’effetto
cumulativo, o sinergico, di una maggiore resistenza e di un maggior consumo.
In parallelo, sono stati ottenuti ceppi di S. cerevisiae con una migliorata tolleranza
nei confronti dell’acido acetico mediante un approccio differente, ma comunque
dall’effetto pleiotropico, che prevede la modulazione del metabolismo degli
mRNA. Questo approccio è stato applicato con l’obiettivo di ottenere un fenotipo
complesso attraverso l’alterazione dell’espressione genica a livello del controllo
post-trascrizionale. A questo proposito, il gene codificante per la principale
proteina che lega il poli(A), Pab1, la quale partecipa nel controllo del metabolismo
degli mRNA interagendo con diverse proteine, è stato mutagenizzato mediante
error-prone PCR. La risultante library mutata è stata successivamente sottoposta a
screening in presenza di acido acetico permettendo l’identificazione di una
versione mutata di Pab1 la cui espressione è in grado di determinare una maggiore
tolleranza all’acido acetico. Inoltre, è stato dimostrato che l’espressione di PAB1 in
un plasmide centromerico, in aggiunta alla copia cromosomica, comporta una
migliore crescita in presenza di differenti condizioni stressanti, incluso lo stress
indotto da acido acetico. Questo fenotipo migliorato è stato mostrato essere
correlato con la formazione di più grandi e persistenti stress granule. Nonostante
sarà necessario comprendere più a fondo i meccanismi fisiologici responsabili del
fenotipo osservato, la produzione/produttività di etanolo da parte dei ceppi ottenuti
mediante l’alterazione sia della quantità che della funzione di Pab1 sarà testata in
bioreattore.
Complessivamente, i risultati ottenuti suggeriscono che l’ingegnerizzazione sia
della disponibilità intracellulare di un antiossidante che del metabolismo degli
mRNA rappresentano delle efficaci strategie per migliorare la robustezza di una
cell factory.

12

13
Introduction

14
15
The biorefinery and cell factory concepts
Nowadays, because of the depletion of fossil reserves and the increasing demand of
energy by a continually growing world population, the production of biofuels and
bio-based products deserves more and more attention. The term biofuels and bio-
based products refers to fuels, such as biodiesel, ethanol, bioalcohols and biogas,
alternative to fossil fuels, and chemical compounds, respectively, produced from
biomasses renewable within the time of their consumption through microbial
metabolism. In this context, the concept of biorefinery arises, defined by the IEA
Bioenergy Task 42 ‘‘Biorefineries” as “the sustainable processing of biomass into
a spectrum of marketable products and energy” (http://www.biorefinery.nl/
ieabioenergy-task42/). In a biorefinery, plant based feedstock such as sugarcane,
corn, starch and wood biomasses are converted into sugars that are subsequently
used by microorganisms to produce biofuels, power and chemicals through their
fermentative metabolism (Cherubini, 2010; Hong and Nielsen, 2012). This concept
is analogous to today’s petroleum refinery, which produces multiple fuels and
products starting from petroleum.
When exploited in bio-industrial processes, microorganisms are defined as “cell
factories”. The development of a cell factory is an important aspect for the
establishment of a novel bioprocess for the production of fuels and chemicals.
Although it is relatively quick and simple to obtain a strain able to produce the
product of interest, it is generally more difficult and time-consuming the
development of a strain that meets the commercial requirements for yield,
productivity and titer (Hong and Nielsen, 2012). Cell factories characterized by
high production rates are desirable and required to make the biorefinery-based
processes competitive with the fossil fuel-based ones. Final yield is obviously
dependent on the amount of product that the microorganism is able to produce, but
16
also strain performance during fermentation is fundamental for its attainment. One
of the most relevant factors that impact the microbial metabolism, and
consequently its ability to efficiently produce the product of interest, are the
stressing conditions occurring during industrial bio-processes. Non optimal
temperature, pH values and oxygenation levels, together with the final product
toxicity, are the main determinant factors of cellular stress occurring during
fermentation. Moreover, the production/productivity of the fermentative process
can be impaired by the presence of inhibitory compounds that might be present in
the fermentation medium depending on the substrate intended to be used. Large
investments are therefore directed to create efficient cell factories characterized by
high rate of production and, at the same time, improved stress resistance.
How to improve a cell factory?
Industrially relevant traits, including increase in product yield and in tolerance to
products and inhibitors, as well as adaptability to process environments that are
different from the natural habitats of microorganisms, have been obtained through
the integration of “classic” and “modern” strain engineering approaches (Patnaik,
2008).
The “classic” strain engineering methodology is based on mutagenesis induced by
X-rays, UV, or chemicals, followed by the screening of the desired phenotype. This
method has been successively used to obtain different phenotypes of interest such
as the improvement of secondary metabolites production. However, it is
characterized by some drawbacks since it is time-consuming, it leads to significant
cell damage and it is almost impossible to be applied to obtain complex phenotypes
that require multiple coordinated changes at the genetic level. With the
17
development of genetic engineering in the 1970s, some of these limitations have
been overcome by the development of several new technologies that enable
targeted mutagenesis or manipulation of cellular metabolism to amplify or create
the desired phenotype. The application of these technologies relies on the level of
knowledge about the metabolism and the genotype-phenotype correlation of the
host organism that have been achieved by using a number of experimental and
mathematical tools (Patnaik, 2008). Moreover, other techniques have been
developed with the scope to engineer complex polygenic phenotypes at whole
genome scale. Some of the commonly used methods to improve a cell factory with
relative examples will be described below.
Metabolic engineering
Metabolic engineering is the technological discipline that allows the introduction of
specific modification to metabolic pathways to improve cellular properties through
the manipulation of enzymatic, transport, and regulatory functions of the cell by
using recombinant DNA technology (Bailey, 1991; Koffas et al., 1999). Generally,
pathway kinetics are improved by removing flux bottlenecks, balancing precursors,
and recycling cofactors to increase product formation (Bulter et al., 2003). Strains
can also be metabolically engineered to produce not-native products through the
heterologous expression of biosynthetic pathways deriving from a different
organism. Metabolic engineering has been successfully employed for the
production of natural and unnatural products in several organisms. To highlight a
few, amino acids such as L-phenylalanine, L-tryptophan and L-tyrosine have been
over-produced in Escherichia coli and Corynebacterium glutamicum (Ikeda, 2006),
and E. coli has been engineered to produce ethanol through the introduction of two
genes encoding for essential enzymes of the ethanol fermentative pathway from
Zymomonas mobilis (Ingram et al., 1987). However, this approach requires an
extensive biochemical and genetic knowledge about the metabolism or metabolic
18
pathways of interest, that, together with the complexity of cellular physiological
responses and the difficulty of cloning in industrial strains, represents in some
cases an obstacle for its implementation (Cakar et al., 2012). Thus, the engineering
of strains by metabolic engineering approach is usually confined to well-
characterized hosts, such as E. coli, S. cerevisiae and Bacillus subtilis (Gong et al.,
2009).
Directed evolution
Directed evolution incorporates Darwinian principles of mutation and selection
into experimental strategies for improving biocatalyst or cellular properties
(Chatterjee and Yuan, 2006). Directed evolution experiments carried on in the
laboratory comprise two steps: the creation of genetic diversity through the
production of a library of genetic variants and the evaluation of the library by
genetic selection and high-throughput screening to identify variants with the
required properties (Chatterjee and Yuan, 2006; Jäckel et al., 2008). This technique
does not require structural knowledge of the protein or, generally, of the molecules
of interest; however, where structural information are available, rational design and
directed evolution are often combined to create “smart libraries” in which genetic
variations are introduced at functional sites, such as the active site region of an
enzyme (Leemhuis et al., 2009). There are numerous studies reporting the direct
evolution of single enzyme catalysts. However, as underlined in (Chatterjee and
Yuan, 2006), since cellular metabolism is dependent on multiple factors, few works
demonstrated to achieve improvements in metabolic pathways using this approach.
As an example, Eriksen and co-workers recently reported the optimization of
cellobiose consumption and ethanol productivity in S. cerevisiae by the
simultaneous direct evolution engineering of the β-glucosidase gh1-1 and the
cellodextrin transporter cdt-1 from Neurospora crassa (Eriksen et al., 2013).
Moreover, a S. cerevisiae strain with improved xylose consumption and ethanol
19
production was obtained by directed evolution of the heterologous expressed
Piromyces sp. xylose isomerase (Lee et al., 2012). Despite some exceptions,
directed evolution experiments or screenings of classical mutagenesis libraries
resulted in the selection of strain with marginal improvements of phenotype that
are mainly monogenic. However, the industrially high desirable phenotypes such as
tolerance to ethanol, inhibitors or low pH and high temperature, are polygenic, and
consequently require multiple simultaneous modifications at both molecular and
cellular levels.
Evolutionary engineering
The main drawbacks linked to the use of “rational” metabolic engineering and
direct evolution has been overcome using the evolutionary engineering approach.
This methodology involves repeated batch cultivations in the presence of a
selective pressure, or alternatively, a prolonged chemostat cultivation under
selective conditions (Cakar et al., 2012). As a consequence of the applied selection
pressure, spontaneous or induced mutagenesis of the initial monoclonal population
results in the formation of fitter variants that can survive and grow better than the
original cells under the selection conditions, and, consequently will dominate the
culture (Cakar et al., 2012). Both wild type and engineered strains obtained by
rational design can be subjected to evolutionary engineering for further
improvement (Petri and Schmidt-Dannert, 2004). Enhancements of E. coli lactic
acid production (Fong et al., 2005) and stress resistance (Weikert et al., 1997), as
well as in substrate utilization and product formation by S. cerevisiae (Cakar et al.,
2012), are example of success results obtain by evolutionary engineering. Despite
not impossible, improving industrial strains using this approach is more difficult,
since they are usually polyploid and consequently less prone to accumulate
relevant recessive mutations by laboratory evolution (Cakar et al., 2012).
20
Whole genome shuffling
Genome shuffling offers the advantage of simultaneous changes at different
positions throughout the entire genome without the necessity for genome sequence
data or network information (Petri and Schmidt-Dannert, 2004). This technology
for strain improvement is based on protoplast fusion, in which recombination
results from multiple parents deriving from a strain subjected to one or several
rounds of mutagenesis using chemical or physical mutagens (Gong et al., 2009).
Enrichment in the distribution of complex progeny is achieved by the recursive
fusion of a mixed protoplast population in which protoplasts from the parental
strains are mixed, fused and regenerated several times (Zhang et al., 2002). The
desired phenotype is finally obtained from the populations resulting from recursive
protoplast fusion through the screening process, that represents a crucial step to
ensure the success of the whole procedure of genome shuffling (Gong et al., 2009).
Compared with classical strain-improvement strategies and rational methods for
strain engineering, genome shuffling offers more advantages:
1) the phenotypic improvement is more efficient than classical strain-
improvement methods and can be achieved in a rather short period;
2) it is not limited to microorganisms whose genetic background is known;
3) it is more convenient than other molecular breeding techniques since it
does not require any expensive facilities;
4) strains engineered by genome shuffling are not considered genetically
modified an consequently are accepted by the public opinion (Gong et al.,
2009).
The application of genome shuffling allowed the improvement of product yield,
stress tolerance and uptake of substrates in several bacterial and fungal species
(Gong et al., 2009). However, this method, being based on protoplast fusion, has
the disadvantages of fusant instability, low fusion efficiency, and time-consuming
21
fusant regeneration process occurring under non-selective conditions, in which
some useful mutations might be lost (Hou, 2010).
global Transcription Machinery Engineering
Global transcription machinery engineering (gTME) is an approach for
reprogramming gene transcription to elicit complex phenotypes important for
technological applications that cannot be achieved through common metabolic
engineering techniques (Alper et al., 2006). In gTME, dominant mutant alleles of a
transcription-related protein are screened for their ability to reprogram cellular
metabolism and regulation, resulting in a unique and desired phenotype (Lanza and
Alper, 2011). This goal is reached through the generation of a mutant library using
traditional mutagenesis techniques such as error-prone PCR which is subsequently
screened to select strains with the phenotype of interest. The sigma factor (σ70
) in
E. coli and the RNA polymerase II transcription factor D (TFIID) component
Spt15 in S. cerevisiae were engineered by gTME to improve product tolerance,
metabolite production, and xylose utilization (Alper et al., 2006; Alper and
Stephanopoulos, 2007; Liu et al., 2010). One limitation of gTME is that changes at
transcriptional level may not surely correspond to remarkable modifications in the
proteome composition since gene expression is controlled also at the post-
transcriptional and post-translational level.
Although advances in strain engineering have been focus on metabolic
engineering, the exploitation of this technique is restricted to well-defined systems
where the genetic basis for a given phenotype has been established. In the absence
of detailed knowledge about the biosynthetic pathways and/or metabolism of the
host strain, the use of this tool is therefore limited (Patnaik, 2008). Moreover,
despite metabolic engineering is almost the most powerful technique to enable the
production of un-natural compounds through the insertion of genes from foreign
22
organisms, the engineering of polygenic traits such as stress tolerant phenotypes,
which are generally dependent on multiple genes, cannot be fully reached using
rational tools. On the contrary, these complex phenotypes can be successfully
obtained using whole genome wide engineering approaches, including evolutionary
engineering, genome shuffling and gTME. In addition, it has recently reported that
chromosomal splitting technology can contribute to the expansion of strain
improvement platforms (Park et al., 2012). However, complex phenotypes can be
engineered by combining rational methods and global techniques. gTME can be
per se considered as a combinatorial method since it allows the reprogramming of
the whole cellular metabolism through the modulation of a single factor whose
choice is imposed by rational reasons. A strain with specific properties obtained by
rational design can be subjected to evolutionary engineering or genome shuffling
for further improvements, and, likewise, strains generated through whole genome
engineering approaches can be further optimized by rational metabolic methods.
As an example, in S. cerevisiae a 30-fold improvement in succinate titer was
obtained through the rational engineering of a mutant strain obtained by the
evolutionary engineering of a multiple gene-deletion strain rationally designed
thanks to the reconstruction of the genome-scale metabolic network of S. cerevisiae
(Otero et al., 2013).
23
The exploitation of S. cerevisiae for second
generation ethanol production
Depending on the plant-based raw materials used, biofuels are discerned in first,
second or third generation biofuels. First generation fuels are mainly based on
edible crops such as wheat, corn, sugarcane and sugar beet, and large scale
production of first generation ethanol, biodiesel and biogas is worldwide diffused
(Naik et al., 2010; Hong and Nielsen, 2012). However, the increasing demand for
bio-based products has pushed toward second generation biofuels that are produced
from biomass-based raw materials, which do not compete with food production and
represent one of the most abundant and underutilized biological resources on the
planet. At present, the production of such fuels is not cost-effective because there
are a number of technical barriers that need to be overcome before their potential
can be realized (Naik et al., 2010). Finally, third generation biofuels would be
ideally independent from supplied substrate: it will be derived from microalgae, or
generally from unicellular photosynthetic microorganisms, and mainly rely on their
lipid content/accumulation (Dragone et al., 2010). At present, the main problem to
fully exploit the potential of algae is that their productivity and photosynthetic
efficiency need to be maximized under natural and artificial illumination (Abiusi,
et al., 2013).
Non-food or second-generation ethanol has great potential as a source of bioenergy
due to the abundance of plant biomass on earth. Another significant factor which
adds value as well as importance to lignocellulosic ethanol is the reduction in
greenhouse gas emission. Success in utilizing this plant biomass will therefore have
a positive impact on the environment with benefits for the society as a whole
(Laluce et al., 2012). Lignocellulosic biomass is mainly composed of cellulose,
hemicellulose and lignin. The conversion of lignocelluloses into ethanol requires
24
three main steps: pre-treatment, hydrolysis and fermentation. Pre-treatment is
required to alter the structure of lignocelluloses to make cellulose and
hemicelluloses more accessible to acid or enzymes that converts the carbohydrate
polymers into fermentable sugars. The goal is to break the lignin seal and disrupt
the crystalline structure of cellulose (Mosier et al., 2005). Successively, during the
hydrolysis process, cellulose and hemicelluloses are broken down into their
corresponding monomers, so that microorganisms can utilize them (Kumar et al.,
2009). Three major hydrolysis processes are typically used to produce a variety of
sugars suitable for ethanol production: dilute acid, concentrated acid, and
enzymatic hydrolysis (Kumar et al., 2009).
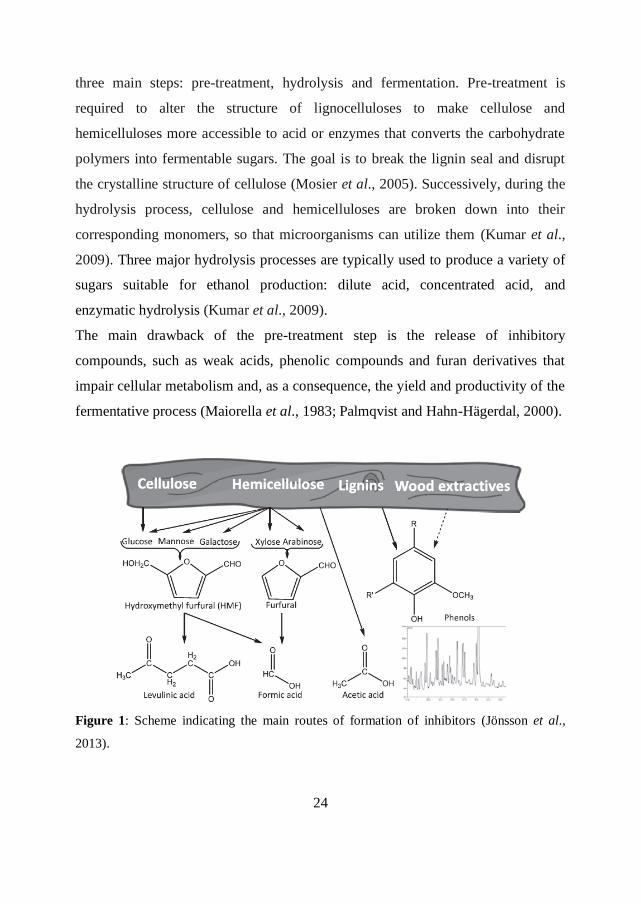
The main drawback of the pre-treatment step is the release of inhibitory
compounds, such as weak acids, phenolic compounds and furan derivatives that
impair cellular metabolism and, as a consequence, the yield and productivity of the
fermentative process (Maiorella et al., 1983; Palmqvist and Hahn-Hägerdal, 2000).
Figure 1: Scheme indicating the main routes of formation of inhibitors (Jönsson et al.,
2013).
25
In fact, the pre-treatment usually degrades the hemicellulose leading to the
formation of not only pentose and hexose sugars that can be fermented, but also
sugar acids, aliphatic acids (primarily acetic acid, formic acid and levulinic acid),
and furan aldehydes (5-hydroxymethylfurfural (HMF) and furfural) (Figure 1)
(Jönsson et al., 2013). On the other hand, phenolic compounds are generated from
partial breakdown of lignin and can be formed during acid-catalyzed hydrolysis or
pre-treatment of lignocelluloses (Jönsson et al., 2013; Palmqvist and Hahn-
Hägerdal, 2000). Phenolic compounds can also derived from sugars, although the
significance of this route remains to be investigated (Jönsson et al., 2013).
Baker’s yeast S. cerevisiae is the preferred microorganism for large scale ethanol
production due to its high ethanol yield and productivity and general robustness
(Wallace-Salinas and Gorwa-Grauslund, 2013). It is widely employed for the
commercial production of bioethanol from sugars, such as the sucrose from sugar
cane and the glucose or maltose from starch (Laluce et al., 2012). However, there
are crucial limitations related to the fermentation of lignocellulosic materials by S.
cerevisiae. Firstly, natural strains are not able to utilize xylose that represents the
second most abundant sugar in lignocellulosic hydrolysates. The incomplete and
inefficient fermentation of carbohydrates present in lignocellulose represents a
relevant obstacle for the sustainable and economical production of second
generation bioethanol. Therefore, several metabolic engineering approaches to
introduce xylose metabolic pathways into S. cerevisiae have been practiced (Chu
and Lee, 2007; Kim et al., 2013). Secondly, as stated before, the ethanol yield and
productivity is severally affected by organic compounds released during the pre-
treatment of lignocellulosic biomasses that impair S. cerevisiae growth and
metabolism. Despite the intrinsic robustness exhibited by this yeast, a great number
of approaches have been applied to increase the innate tolerance of yeast cells to
inhibitors (Laluce et al., 2012).
26
The focus of this thesis is the improvement of S. cerevisiae tolerance to acetic acid,
which represents one of the most abundant and toxic compounds released from
lignocelluloses pre-treatment. The mechanisms of acetic acid-induced toxicity and
cell death in S. cerevisiae will be briefly introduced in the next section.
Mechanisms of acetic acid-induced cell death in
S. cerevisiae: an overview
The mechanism of acetic acid toxicity is for some aspects similar to that induced in
general by weak carboxylic acids. In S. cerevisiae, acetic acid is not metabolized
by glucose-repressed cells and, at external pH below the acetic acid pKa value
(4.75), the undissociated form of the acid predominates and may permeate plasma
membrane by simple diffusion. It has been described that acetic acid can also
enters the yeast cells by a process of facilitated diffusion mediated by the
aquaglyceroporin Fps1 (Mollapour and Piper, 2007). Inside the cell, where the pH
is near-neutral, the acid dissociates leading to the accumulation of protons (H+) and
acetate counterions (CH3COO-). Due to their electric charges, these ions are not
able to cross the hydrophobic lipid plasma membrane bilayer and accumulate in the
cell cytoplasm (Mira et al., 2010b). Protons accumulation leads to intracellular
acidification and to the consequent decrease of DNA and RNA synthesis, inhibition
of metabolic activities and disruption of the proton gradient maintained across the
plasma membrane (Mira et al., 2010b). To maintain the intracellular pH within
physiological levels, yeast cells activate the plasma membrane H+-ATPase Pma1,
that couples ATP hydrolysis to proton extrusion (Serrano et al., 1986). However, it
has been reported that its activity is not enough to counteract cytosolic and
vacuolar acidification (Carmelo et al., 1997). On the other hand, the accumulation
27
of weak acid counterions may cause an increase in turgor pressure, oxidative stress,
protein aggregation, lipid peroxidation, inhibition of membrane trafficking and
perturbation of plasma and vacuolar membranes spatial organization (Mira et al.,
2010b). Several specific transporters have been implicated in yeast tolerance to
different weak acids: in particular, those transporters related to the multidrug
resistance (MDR). Pdr12, a plasma membrane transporter of the ATP-binding
cassette (ABC) superfamily, Aqr1 and Azr1, plasma membrane transporters of the
major facilitator superfamily, as well as Tpo2 and its paralog Tpo3, were found to
provide protection against acetic acid (Fernandes et al., 2005; Piper et al., 1998;
Tenreiro et al., 2002; Tenreiro et al., 2000).
In addition to the genes codifying for proteins involved in acetate extrusion, in S.
cerevisiae about 650 genes were identified as required for acetic acid tolerance in a
genome-wide scale study based on the screening of the EUROSCARF haploid
mutant collection for susceptibility phenotypes to this weak acid (concentrations in
the range 70-110 mM, pH 4.5) (Mira et al., 2010a). The clustering of these acetic
acid-resistance genes based on their biological function indicated an enrichment of
genes involved in transcription, internal pH homeostasis, carbohydrate metabolism,
cell wall assembly, biogenesis of mitochondria, ribosome and vacuole, and in the
sensing, signalling and uptake of various nutrients in particular iron, potassium,
glucose and amino acids (Mira et al., 2010a).
Depending on its concentration, acetic acid added to exponentially growing S.
cerevisiae cells at pH 3.0 was shown to induce death exhibiting either typical
apoptosis-like features, or ultrastructural alterations typical of necrosis (Ludovico
et al., 2001). The apoptotic phenotype observed in yeast cells exposed to this acid
has been defined as acetic acid-induced programmed cell death (AA-PCD)
(Ludovico et al., 2001). Oxidative stress has been demonstrated to be a determinant
of AA-PCD, as well as of yeast PCD triggered by H2O2, in which reactive oxygen
species (ROS) production and accumulation play an important role (Guaragnella et
28
al., 2011; Madeo et al., 1999). Whether ROS directly trigger PCD, or are generated
as a result of the PCD cascade, and both the nature and the source of ROS is a
matter of debate (Guaragnella et al., 2011). In response to oxidative stress, yeast
cells activate several mechanisms involved in cellular protection against ROS,
including the enzymes superoxide dismutase, catalase and peroxidase, and the
synthesis of the tripeptide glutathione that acts as an antioxidant or a cofactor of
enzymes such as glutathione reductase, peroxidase and transferase (Herrero et al.,
2008). In yeast cells exposed to acetic acid, superoxide dismutase activity has been
shown to be induced (Giannattasio et al., 2005). However, despite superoxide
dismutase represent one of the first defenses, its ROS detoxifier activity is not
sufficient to prevent AA-PCD. In fact, yeast cells exposed to moderately toxic
concentrations of acetic acid committed to death even in the presence of high levels
of superoxide dismutase (Giannattasio et al., 2005). On the contrary, catalase
activity was found to be undetectable in cells en route to AA-PCD (Giannattasio et
al., 2005). Whether catalase undergo enzyme inactivation and/or degradation
remains to be established (Guaragnella et al., 2011). However, accordingly to the
protective role of catalase in response to several stress conditions in S. cerevisiae,
AA-PCD was prevented by the over-expression of the cytosolic catalase T or by
the induction of catalase activity in cells exposed to extracellular acidification at
pH 3.0 before acetic acid treatment (Giannattasio et al., 2005; Guaragnella et al.,
2008). These findings suggest that i) H2O2 detoxification, catalyzed by catalase,
may reduce AA-PCD occurrence and ii) H2O2 may have a role as a second
messenger needed to start the PCD cascade triggered by acetic acid (Guaragnella et
al., 2011).
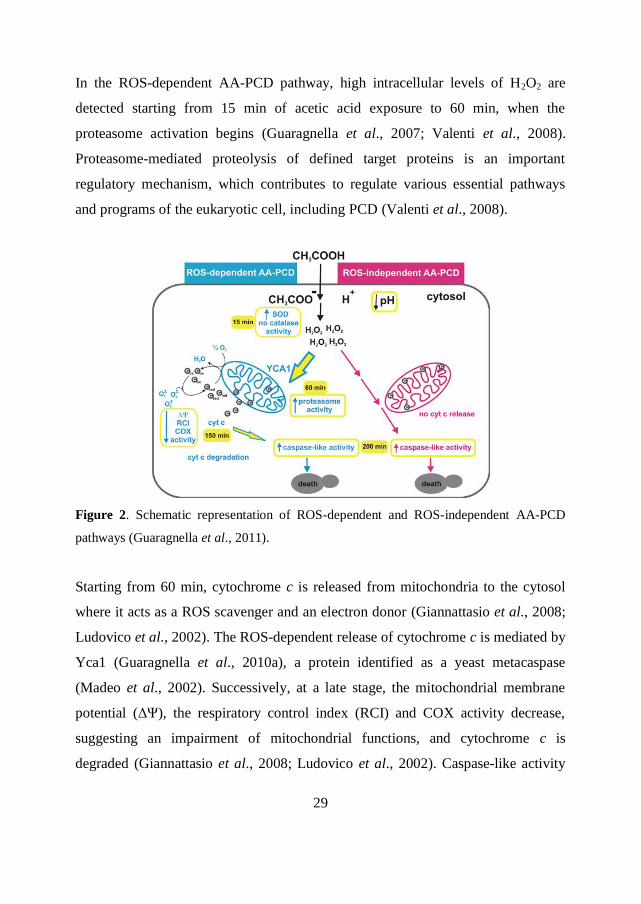
It has been proposed that acetic acid can induce two alternative death pathways in
yeast cells: the ROS-dependent and the ROS-independent AA-PCD (Figure 2)
(Guaragnella et al., 2011; Guaragnella et al., 2010b).
29
In the ROS-dependent AA-PCD pathway, high intracellular levels of H2O2 are
detected starting from 15 min of acetic acid exposure to 60 min, when the
proteasome activation begins (Guaragnella et al., 2007; Valenti et al., 2008).
Proteasome-mediated proteolysis of defined target proteins is an important
regulatory mechanism, which contributes to regulate various essential pathways
and programs of the eukaryotic cell, including PCD (Valenti et al., 2008).
Figure 2. Schematic representation of ROS-dependent and ROS-independent AA-PCD
pathways (Guaragnella et al., 2011).
Starting from 60 min, cytochrome c is released from mitochondria to the cytosol
where it acts as a ROS scavenger and an electron donor (Giannattasio et al., 2008;
Ludovico et al., 2002). The ROS-dependent release of cytochrome c is mediated by
Yca1 (Guaragnella et al., 2010a), a protein identified as a yeast metacaspase
(Madeo et al., 2002). Successively, at a late stage, the mitochondrial membrane
potential (ΔΨ), the respiratory control index (RCI) and COX activity decrease,
suggesting an impairment of mitochondrial functions, and cytochrome c is
degraded (Giannattasio et al., 2008; Ludovico et al., 2002). Caspase-like activity
30
progressively increases up to 200 min and is partially ROS-dependent since cells
treatment with the antioxidant N-Acetyl-L-cysteine (NAC), a H2O2 scavenger,
resulted in 50% decrease of caspase-like activity compared to untreated cells
(Guaragnella et al., 2010b).
The ROS-independent AA-PCD pathway was discovered through studies on AA-
PCD occurrence in mutant S. cerevisiae cells lacking Yca1, cytochrome c, or both
(Guaragnella et al., 2010a; Guaragnella et al., 2010b). It was indeed demonstrated
that AA-PCD can occur even independently of Yca1 activity through a mechanism
in which cytochrome c is not released, but still a late caspase-like activity
increasing over time was observed which was not affected by NAC treatment
(Guaragnella et al., 2010b). In mutant yeast cells dying through the ROS-
independent AA-PCD pathway H2O2 accumulates as in wild type cells, but it seems
to not have a direct role in the induction of AA-PCD (Guaragnella et al., 2010b).
The death rate showed by these mutants is lower than that of wild type cells in
which AA-PCD proceeds via a ROS- and Yca1-dependent pathway (Guaragnella et
al., 2010b). The role that mitochondria play in the ROS-independent pathway in
which no cytochrome c release takes place remains to be established.
In this thesis two different approaches to increase S. cerevisiae tolerance to acetic
acid have been evaluated. In one case, the increased resistance to the acid of a S.
cerevisiae strain metabolically engineered to produce L-ascorbic acid (L-AA)
(Branduardi et al., 2007; Fossati et al., 2011) has been characterized. In the other, it
has been demonstrated that the modulation of a key factor involved in mRNA
metabolism represents a valid method for fishing S. cerevisiae variants with
enhanced robustness. The last approach has been designed to engineer global gene
expression at post-transcriptional level with the aim to unlock a complex
phenotype, such as acetic acid tolerance, that requires simultaneous changes at
molecular and physiological level.
31
Chapter 1
Different response to acetic
acid stress in Saccharomyces
cerevisiae wild type and L-
ascorbic acid producing
strains
Most of the results has been published in:
Martani F, Fossati T, Posteri R, Signori L, Porro D and Branduardi P.
2013. Different response to acetic acid stress in Saccharomyces
cerevisiae wild type and L-ascorbic acid producing strains. Yeast 30:
365-78.

32
33
Introduction
Yeasts are nowadays regarded as effective cell factories for the production of
metabolites and bio-based products of relevant economic impact as bulk and fine
chemicals, protein drugs and biofuels (for recent reviews see, among others, Porro
et al., 2011 and Hong and Nielsen, 2012).
During industrial fermentations, yeasts are subjected to different stresses,
associated either with the operating parameters of the process and/or with the
presence of compounds that, according to their concentrations and effects, turn out
to be toxic. Yeast cells counteract these adverse conditions by triggering a stress
response, with the aim to adapt to the new environment. However, under severe
stress(es) the defence mechanisms may become insufficient to guarantee an
efficient metabolism. This very often strongly limits the production, the
productivity and the yield of the process itself (Mattanovich et al., 2004).
Furthermore, cell death may occur.
Yeasts are also considered as important resource in fundamental research where
Saccharomyces cerevisiae appears as one of the most used and versatile eukaryotic
cell models, given its simplicity, feasibility of manipulation and genetic
tractability. Indeed, S. cerevisiae has been the first sequenced eukaryotic organism
(Goffeau, 1996). Current knowledge on cellular stress response and programmed
cell death (PCD) in higher eukaryotes and yeasts confirms that, despite some
differences in signalling pathways, several steps are phylogenetically conserved.
Therefore, S. cerevisiae can be considered an ideal model system to study the
molecular pathways underlying these processes (Munoz et al., 2012).
As a consequence of various stress conditions, different reactive oxygen species
(ROS) may accumulate within the cells and are regarded as key mediators of stress
response in S. cerevisiae (Madeo et al., 1999; Farrugia and Balzan, 2012). S.
34
cerevisiae counteracts ROS accumulation through several antioxidant defence
mechanisms, aiming to detoxify ROS and maintaining the intracellular redox
environment in a reduced state. Yeast antioxidant defences include non enzymatic
compounds, like glutathione (GSH) and erythroascorbate (EAA) as well as a
number of protective enzymes including superoxide dismutase, catalase, several
peroxidases and thioredoxin (Huh et al., 1998; Herrero et al., 2008). Among the
enzymatic systems, superoxide dismutases (SODs), which catalyze the
disproportionation of superoxide anion to hydrogen peroxide, and catalases, which
reduce hydrogen peroxide to water, play a relevant role (Fridovich, 1975; Switala
and Loewen, 2002).
Acetic acid represents one of the most limiting by-products released from the
hydrolysis of lignocelluloses, contributing to reduce ethanol yield and productivity
when these waste materials are intended to be used as substrates for biofuels
production (Maiorella et al., 1983; Palmqvist and Hahn-Hägerdal, 2000). The
undissociated form of acetic acid is freely membrane permeable and therefore
enters the cell by simple diffusion. Once in the cytosol, where the pH is near-
neutral, it dissociates leading to the release of protons (H+) and acetate (CH3COO
-)
(Guldfeldt and Arneborg, 1998). Protons accumulation determines the intracellular
acidification, which inhibits many metabolic activities, while acetate may cause
turgor pressure and free radicals production, inducing severe oxidative stress
(Pampulha and Loureiro-Dias, 1990; Piper et al., 2001; Semchyshyn et al., 2011;
Ullah et al., 2012). Acetic acid was also shown to induce programmed cell death
(defined as AA-PCD) in S. cerevisiae cells characterized by chromatin
condensation, TUNEL-positive phenotype and ROS accumulation, resulting in turn
in lipid peroxidation, protein oxidation and carbonylation, and genetic damage
(Ludovico et al., 2001; Guaragnella et al., 2007; Morano et al., 2012; Rego et al.,
2012).
35
L-ascorbic acid (L-AA) is an important ROS scavenger in animals and plants and
there are evidences that it is effective to exert a protective function in yeast under
oxidative stress: survival of S. cerevisiae cells, challenged either with the oxidative
agents paraquat or H2O2, was found to be enhanced upon treatment with exogenous
L-AA from 5 up to 50 μM (Saffi et al., 2006; Amari et al., 2008). This effect was
maximal when L-AA was added before the stressing agent, suggesting that prompt
intracellular L-AA availability may have a key role in optimizing its antioxidant
action.
On the other hand it has been reported that L-AA can also act as an oxidant,
depending upon the environment where the molecule is present (Halliwell, 1999;
Paolini et al., 1999), and, in one case (to the best of our knowledge), it may even
increase S. cerevisiae cell mortality, due to extracellular auto-oxidation and
production of H2O2 (Poljšak et al., 2005). The pro-oxidant effect can vary,
depending on the ability of L-AA to interact with different cell culture media and
to produce H2O2 at different rates, leading to different conflicting results obtained
using ascorbate in cultured cell assays (Clément et al., 2001).
We have previously developed S. cerevisiae strains metabolically engineered to
endogenously produce L-AA, thanks to the insertion of the necessary steps of the
plant biosynthetic pathway (Branduardi et al., 2007; Fossati et al., 2011). As a
consequence, the L-AA producing strains became more tolerant to various stressful
agents, including H2O2 and weak organic acids such as acetic, formic and lactic
acid. Interestingly, the intracellular production of even a small quantity of L-AA
(approximately 1.2 μM) was more effective in protecting cells from stress than the
exogenous addition of higher amounts (up to 60 mg/l, i.e. 340 mM) of this
antioxidant, as reported in our previous studies (Branduardi et al., 2007).
The aim of the present study was to better characterize the robustness exhibited by
recombinant strains under acetic acid stress, with particular attention to cell

36
viability and ROS accumulation. The correlation between L-AA production and the
main endogenous cellular defences was also investigated.
37
Materials and Methods
Yeast strains, media, growth conditions
The S. cerevisiae genetic background used in this study was GRF18U (MATα;
ura3; his3-11,15; leu2-3,112; cir+) (Brambilla et al., 1999). The strains used were
GRF18Uc (MATα; ura3; his3-11,15; leu2-3,112; [pYX012; pYX022; pYX042;
pZ5]) and GRF18U L-AA producing (MATα; ura3; his3-11,15; leu2-3,112;
[p012bTAtME AtMIP; p022AtLGDH; p042ScALO; pZ5AtVTC2]) (Branduardi et
al., 2007; Fossati et al., 2011) and the respective strains in which SOD1 was
disrupted. To delete the SOD1 gene, the sod1::hphMX4 cassette was amplified
from the plasmid pAG26 (Goldstein and McCusker, 1999) using the
oligonucleotides 5’-ATG GTT CAG CAG TCG CAG TGT TAA AGG GTG ATG
CCG GTG TCT CTC GCC AGA TCT GTT TAG TAG CTT G-3’ and 5’-TTA
GTT GGT TAG ACC AAT GAC ACC AGG CTG GTC TTG GAC CGG CGA
GCT CGT TTT CGA CAC TGG-3’. The sod1::hphMX4 cassette was used to
replace SOD1 gene in both GRF18U and GRF18U L-AA producing strains. Yeast
transformations were performed according to the LiAc/PEG/ss-DNA protocol
(Gietz and Woods, 2002). Transformed clones were selected on YPD agar plates
supplemented with the antibiotic hygromycin B at the final concentration of 2
mg/ml (Roche). Gene disruption was confirmed by PCR analyses.
Yeast cultures were grown in minimal synthetic medium (0.67% [w/v] YNB
medium [catalogue no. 919-15 Difco Laboratories, Detroit, Mich.] with 2% [w/v]
D-glucose as carbon source). Aminoacids histidine, valine, leucine, lysine,
isoleucine and uracil (Sigma) and the antibiotic nourseotricine sulphate (cloNAT,
WERNER BioAgents, Germany) were added to a final concentration of 50 mg/l.
Δsod1 cells were grown in minimal synthetic medium supplemented with 100 mg/l
of lysine and methionine. Growth curves were obtained by inoculating yeast cells
38
at an initial optical density of 0.1 (660 nm) and then the optical density was
measured at specific time intervals over at least 78 hours from the inoculum. Each
experiment was repeated at least three times. All strains were grown in shake flasks
at 30 °C and 160 rpm and the ratio of flask volume/medium was 5:1.
Acetic acid treatment
Exponential phase (OD660= 0.5-0.8) cells grown in minimal medium were
harvested and resuspended (107 cells/ml) in minimal medium (pH 3.0, set with
HCl) containing different concentrations of acetic acid (from 40 to 120 mM). Cells
were also resuspended in minimal medium pH 3.0 without acetic acid. Cell
viability was determined by measuring colony-forming units (cfu) after 2 days of
growth on plate at 30°C. 100% of cell survival corresponds to cfu at time zero.
Cycloheximide (Sigma-Aldrich) dissolved in water was added at a final
concentration of 50 μg/ml to yeast cells cultures grown to OD660 0.5-0.7, and the
cultures were then incubated for 30 minutes before acetic acid treatment. The
absence of cytotoxicity by cycloheximide at this concentration was assessed after
200 min of incubation, by cfu (data not shown).
Acid adaptation was performed by incubating the cells in minimal medium pH 3.0
for 30 minutes before acetic acid treatment as described in (Giannattasio et al.,
2005).
For spot assay, exponentially growing cells were subjected to 1:10 serial
dilutions in sterile water. Five µl aliquots were spotted onto minimal
medium plates at pH 3.0 in the absence or presence of increasing
concentrations of acetic acid (15, 20 and 30 mM) and incubated at 30° C for
2 days. For anaerobic growth, agar plates were placed in anaerobic jars and
the air was displaced with nitrogen gas.
39
Fluorescence microscopy analyses
Intracellular ROS production was detected with 2,7-dichlorodihydrofluorescein
diacetate (H2-DCF-DA, Sigma) and dihydroethidium (DHE). H2-DCF-DA,
dissolved in dimethylformamide (DMF) was added (as reported by Guaragnella et
al., 2007) to yeast cell cultures at the final concentration of 10 µg/ml both 30
minutes before and during treatment with or without acetic acid. DHE, dissolved in
dimethyl sulfoxide (DMSO), was added (as reported by Guaragnella et al., 2007)
during acetic acid treatment at the concentration of 5 µg/ml 10 minutes before
collecting the cells. In both cases 108 cells were collected and resuspended in
phosphate-buffered saline (PBS: NaH2PO4 53 mM, Na2HPO4 613 mM, NaCl 75
mM). Cells were then observed in a Nikon ECLIPSE 90i fluorescence microscope
(Nikon) equipped with a 100X objective. Emission fluorescence due to oxidation
of H2-DCF-DA or DHE was detected by B-2A (EX 450-490 DM 505 BA520) or
G-2A (DX 510-560 DM 575 BA 590) filter (Nikon), respectively. Digital images
were acquired with a CoolSnap CCD camera (Photometrics) using MetaMorph 6.3
software (Molecular Devices).
Flow cytometric analyses
Phosphatidylserine exposure was evaluated using the ApoAlert Annexin V-FITC
Apoptosis Kit (Clontech Laboratories). Cells were harvested and washed with 35
mM phosphate buffer pH 6.8 containing 0.5 mM MgCl2 and 1.2 M sorbitol. Cell
walls were digested with 0.2 mg/ml zymolyase T100 (MP Biomedicals) in the
above mentioned buffer for 20 minutes at 37°C. Protoplasts were then washed
twice with binding buffer supplemented with sorbitol (10 mM Hepes/NaOH pH
7.4, 140 mM NaCl, 2.5 mM CaCl2, 1.2 M sorbitol). 4 µl of annexin V-FITC (20
µg/ml) or 5 µl PI (50 µg/ml) were added to 40 µl of cell suspension (107 cells) and
incubated for 20 minutes at room temperature. Cells were then washed once and
40
resupendend in 1 ml of binding/sorbitol buffer containing 0.1% BSA (Sigma).
Fluorescence intensity was measured in FL1 and FL3 channel for annexin V-FITC
and PI signal, respectively.
Mitochondrial superoxide anion was detected using MitoSox (Molecular Probes).
Briefly, cells were washed once in phosphate buffered saline (PBS, pH 6.8) and
incubated in PBS with 5 µM MitoSox for 20 minutes at 30°C. Cells were then
washed twice in PBS and fluorescence intensity in FL3 channel was assessed.
All measurements of fluorescence intensity were performed on a Cytomics FC 500
flow cytometer (Beckman Coulter) equipped with an argon laser (excitation
wavelength 488 nm, laser power 20 mW). The fluorescence emission was
measured trough a 525 band pass filter (FL1 parameter) and trough a 620 nm short
pass filter (FL3 parameter). A total of 30000 cells were measured for each sample.
Data analysis was performed afterwards with WinMDI 2.8 software.
Catalase and superoxide dismutase activity assay
Exponential phase (OD660= 0.5-0.8) cells grown in minimal medium were
harvested and resuspended (107 cells/ml) in minimal medium (pH 3.0, set with
HCl) containing 100 mM acetic acid. At different times 3x10⁸ cells were harvested
by centrifugation at 4000 rpm for 10 minutes, washed once with 1 ml of ice cold
water and resuspended in 350 µl of sodium phosphate buffer 50 mM pH 7.0 for
catalase assay, or Tris-HCl pH 7.5 for superoxide dismutase assay, containing 0.5
mM PMSF and protease inhibitors (complete Protease Inhibitor Cocktail-Roche).
Cells were then disrupted with glass beads (425-600 µm, Sigma) in a homogenizer
(BIO101/Savant FastPrep FP120) by two cycles of 20s at 6.0 speed. Lysates were
collected and centrifuged 15 minutes at 4°C and the obtained supernatants were
used as cell-free extracts.
Catalase activity was measured discontinuously by sampling H2O2 at appropriate
time intervals. Briefly, 30 µl of H2O2 2.2 mM were added to 300 µl of cell-free
41
extract and rapidly mixed to give an initial H2O2 concentration of 200 µM. Every
two minutes between 0 and 10 minutes 50 µl aliquots of the incubation mixture
were removed and rapidly mixed with 950 µl of FOX reagent [ammonium ferrous
sulphate (Sigma-Aldrich) 250 µM, xylenol orange (Sigma-Aldrich) 100 µM,
sorbitol 100 mM, H2SO4 25 mM]. The mixtures were centrifuged 3 min at 12000
rpm after 30 min of incubation at room temperature. Supernatants were then read at
560 nm. The H2O2 concentration in the sample was calculated using a standard
calibration curve made with different standard samples of known concentration of
H2O2. Activities were calculated based on a reference curve, obtained with serial
dilutions of a catalase standard (catalase from bovine liver, Sigma-Aldrich, cat. N.
C30).
Superoxide dismutase activity was assayed using the Sigma SOD assay kit (19160)
following the manufacturer's instructions.
Enzymatic activities were expressed as U/mg proteins. The total protein
concentration was determined as described by Bradford (Bradford, 1976) by using
the Bio-Rad protein assay (Bio-Rad) with bovine serum albumin as the standard.
Determination of intracellular reduced (GSH) and oxidized (GSSG)
glutathione
Cell-free extracts were obtained as described for catalase and superoxide dismutase
activity assays using a potassium phosphate buffer 100 mM pH 7.5. Successively,
half volume of 5% (w/v) trichloroacetic acid was added to cell-free extract to
precipitate the proteins. Samples were kept in ice for 20 minutes and centrifuged
for 10 minutes at 14000 rpm at 4°C. The obtained supernatants were used for total
glutathione (tGSH = GSH + GSSG) estimation. Samples for GSSG quantification
were prepared by incubating 100 µl of the preparation above described with 2 µl of
42
2-vinylpyridine (Sigma) for 60 minutes at room temperature. GSH was then
determined by subtracting GSSG value from tGSH.
tGSH and GSSG were determined according to Rahman et al., 2006. The final
concentrations in the reaction mix were the following: 1 mM EDTA, 0.15 mM
DTNB, 0.45 mM NADPH, 2 U/ml GSH reductase. Standard curves were
constructed using GSH or GSSG (Sigma-Aldrich), respectively, ranging from
0.3125 to 10 μM. The assay was performed in 96-well plates in a microplate reader
(SpectraMax 250, Molecular Devices) reading absorbance at 412 nm after the
addition of GSH reductase to start the reaction. The absorbance was read every 20
s for 3 min in each reaction.
43
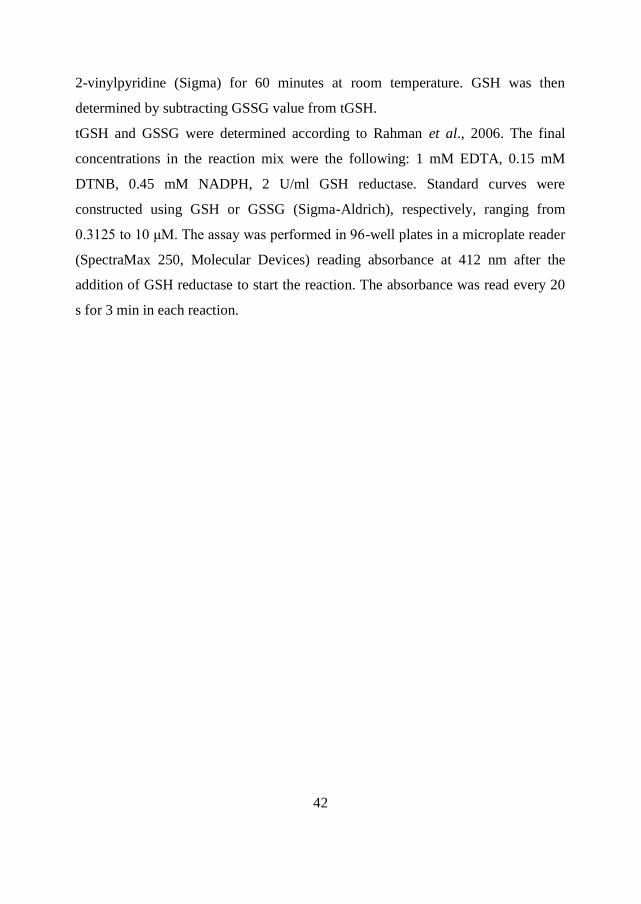
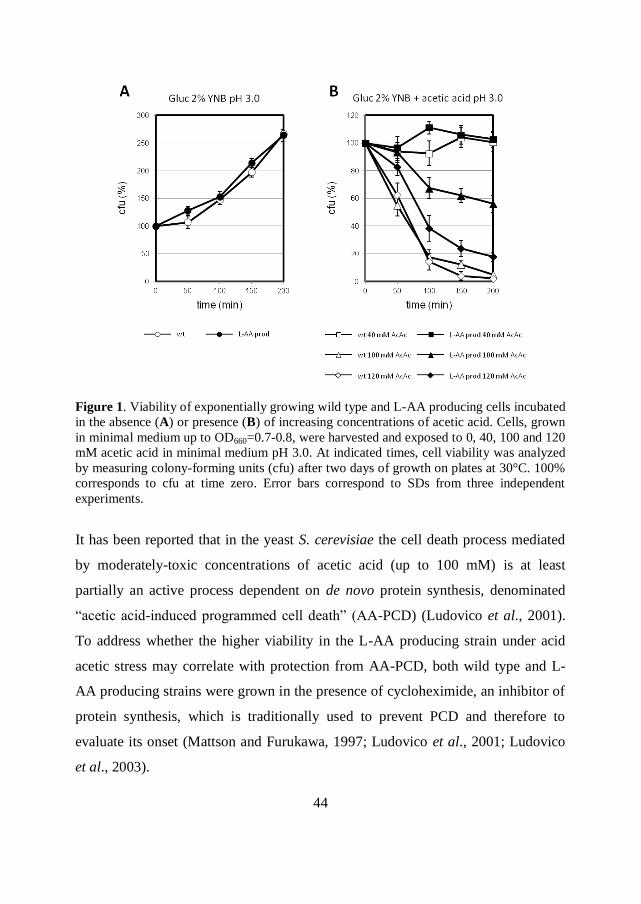
Results and discussion
Wild type and L-AA producing cells exhibit a marked different viability
under acetic acid stress
Exponentially growing S. cerevisiae wild type and recombinant L-AA producing
strains were incubated in the presence of increasing concentrations (40-120 mM) of
acetic acid in minimal medium at pH 3.0. Cell viability was estimated through the
determination of cfu at T=0, 50, 100, 150 and 200 minutes after acetic acid
addition (Figure 1A). In the absence of acetic acid (control condition), cell viability
rose to 260% during 200 minutes of growth for both strains (Figure 1A, circles;
100% corresponds to the cfu value at time T=0). At low concentration (40 mM),
acetic acid exerted a cytostatic effect on both wild type and L-AA producing cells,
inhibiting cell growth (Figure 1B, squares). Cell death was instead progressively
induced when cells were exposed to increasing concentrations of acetic acid (100
and 120 mM, Figure 1B, triangles and diamonds). Remarkably, under these severe
conditions, the L-AA producing strain exhibited a higher viability compared to the
wild type. In particular, when cells were challenged with 100 mM acetic acid for
200 minutes, cell viability turned out to be 56% in L-AA producing strain (Figure
1B, closed triangles) against 5% in wild type (Figure 1B, open triangles). The same
trend was highlighted when cells were treated with 120 mM acetic acid, even if this
condition more severely affected cell viability of both stains (Figure 1B,
diamonds). Acetic acid concentrations higher than 120 mM severely caused cell
death in both stains even 30 minutes after the stressful treatment (data not shown).
The kinetic of the death process induced by 100 mM acetic acid was considered
suitable for further characterization of the stress response in the strains.
44
Figure 1. Viability of exponentially growing wild type and L-AA producing cells incubated
in the absence (A) or presence (B) of increasing concentrations of acetic acid. Cells, grown
in minimal medium up to OD660=0.7-0.8, were harvested and exposed to 0, 40, 100 and 120
mM acetic acid in minimal medium pH 3.0. At indicated times, cell viability was analyzed
by measuring colony-forming units (cfu) after two days of growth on plates at 30°C. 100%
corresponds to cfu at time zero. Error bars correspond to SDs from three independent
experiments.
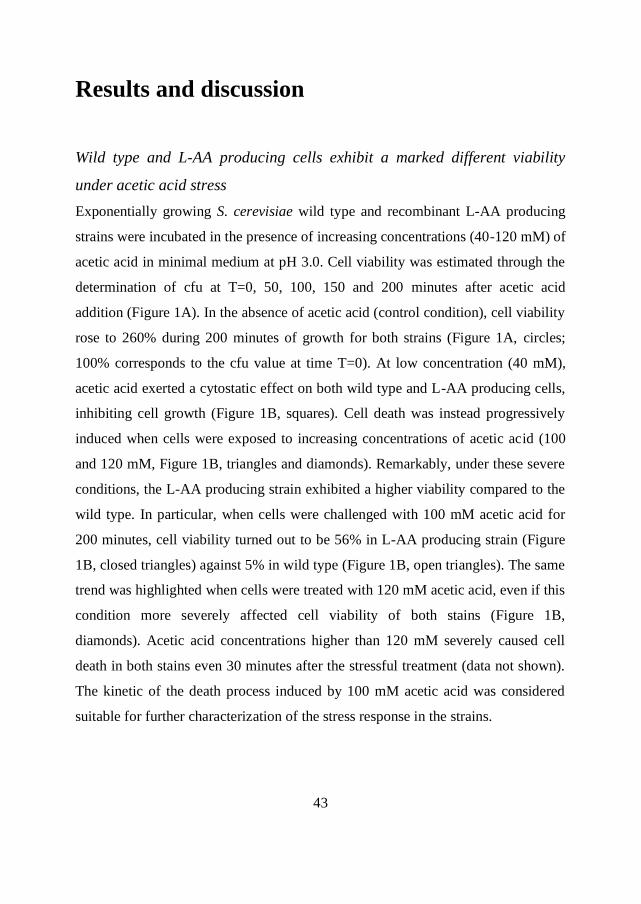
It has been reported that in the yeast S. cerevisiae the cell death process mediated
by moderately-toxic concentrations of acetic acid (up to 100 mM) is at least
partially an active process dependent on de novo protein synthesis, denominated
“acetic acid-induced programmed cell death” (AA-PCD) (Ludovico et al., 2001).
To address whether the higher viability in the L-AA producing strain under acid
acetic stress may correlate with protection from AA-PCD, both wild type and L-
AA producing strains were grown in the presence of cycloheximide, an inhibitor of
protein synthesis, which is traditionally used to prevent PCD and therefore to
evaluate its onset (Mattson and Furukawa, 1997; Ludovico et al., 2001; Ludovico
et al., 2003).
45
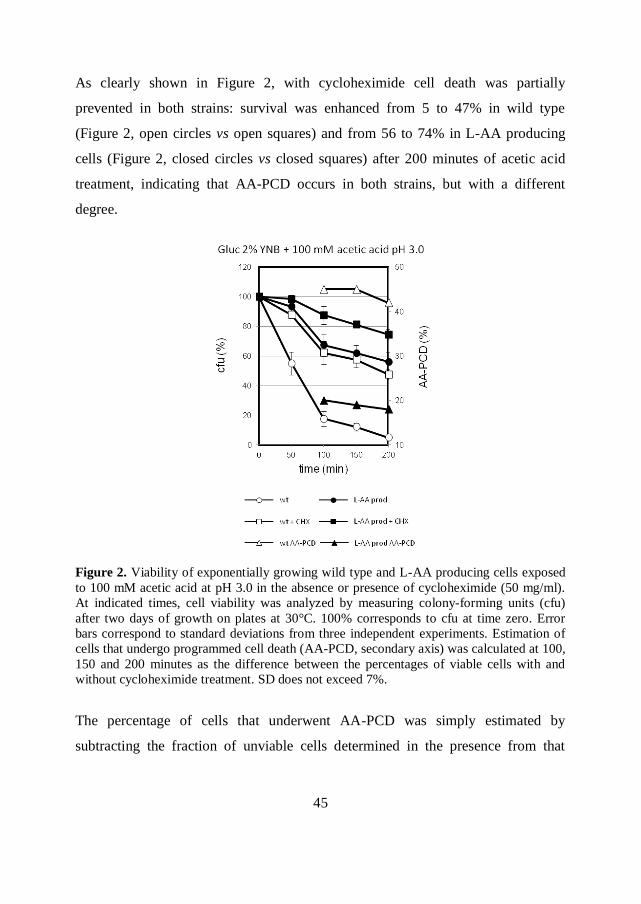
As clearly shown in Figure 2, with cycloheximide cell death was partially
prevented in both strains: survival was enhanced from 5 to 47% in wild type
(Figure 2, open circles vs open squares) and from 56 to 74% in L-AA producing
cells (Figure 2, closed circles vs closed squares) after 200 minutes of acetic acid
treatment, indicating that AA-PCD occurs in both strains, but with a different
degree.
Figure 2. Viability of exponentially growing wild type and L-AA producing cells exposed
to 100 mM acetic acid at pH 3.0 in the absence or presence of cycloheximide (50 mg/ml).
At indicated times, cell viability was analyzed by measuring colony-forming units (cfu)
after two days of growth on plates at 30°C. 100% corresponds to cfu at time zero. Error
bars correspond to standard deviations from three independent experiments. Estimation of
cells that undergo programmed cell death (AA-PCD, secondary axis) was calculated at 100,
150 and 200 minutes as the difference between the percentages of viable cells with and
without cycloheximide treatment. SD does not exceed 7%.
The percentage of cells that underwent AA-PCD was simply estimated by
subtracting the fraction of unviable cells determined in the presence from that
46
measured in the absence of cycloheximide (Figure 2, triangles). Starting from 100
minutes after acetic acid exposure, the fraction of cells undergoing AA-PCD in the
L-AA producing strain was about 20% (closed symbols), while it was about the
double (43-45%) in the wild type strain (open symbols), suggesting that the
intracellular production of L-AA in the recombinant strain effectively takes part in
preventing AA-PCD.
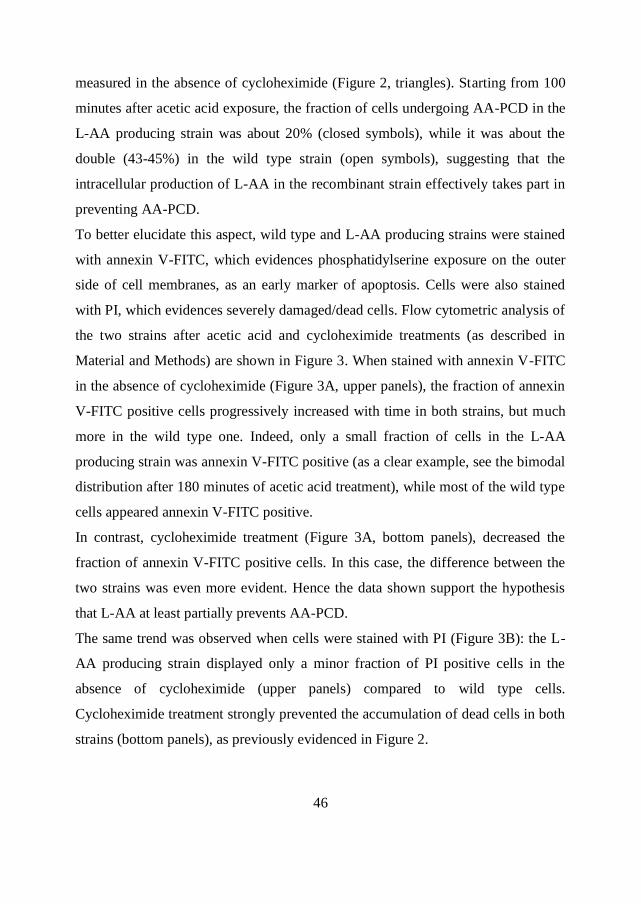
To better elucidate this aspect, wild type and L-AA producing strains were stained
with annexin V-FITC, which evidences phosphatidylserine exposure on the outer
side of cell membranes, as an early marker of apoptosis. Cells were also stained
with PI, which evidences severely damaged/dead cells. Flow cytometric analysis of
the two strains after acetic acid and cycloheximide treatments (as described in
Material and Methods) are shown in Figure 3. When stained with annexin V-FITC
in the absence of cycloheximide (Figure 3A, upper panels), the fraction of annexin
V-FITC positive cells progressively increased with time in both strains, but much
more in the wild type one. Indeed, only a small fraction of cells in the L-AA
producing strain was annexin V-FITC positive (as a clear example, see the bimodal
distribution after 180 minutes of acetic acid treatment), while most of the wild type
cells appeared annexin V-FITC positive.
In contrast, cycloheximide treatment (Figure 3A, bottom panels), decreased the
fraction of annexin V-FITC positive cells. In this case, the difference between the
two strains was even more evident. Hence the data shown support the hypothesis
that L-AA at least partially prevents AA-PCD.
The same trend was observed when cells were stained with PI (Figure 3B): the L-
AA producing strain displayed only a minor fraction of PI positive cells in the
absence of cycloheximide (upper panels) compared to wild type cells.
Cycloheximide treatment strongly prevented the accumulation of dead cells in both
strains (bottom panels), as previously evidenced in Figure 2.
47
Figure 3. Flow cytometric analysis of wild type and L-AA producing cells stained with
annexin V-FITC (A) and propidium iodide (B). Exponentially growing cells were incubated
in the absence (-CHX) or presence (+CHX) of cycloheximide (50 µg/ml) for 30 minutes
and then exposed to 100 mM acetic acid at pH 3.0. Cells were stained at 0, 90 and 180
minutes after acetic acid exposure. The fluorescence distributions of wild type (on the left)
and L-AA producing (on the right) cells in the FL1 (annexin V-FITC) and FL3 (propidium
iodide) channels are represented.
48
Wild type and L-AA producing strains exhibit different ROS content
ROS production is also a key cellular event of AA-PCD in S. cerevisiae
(Guaragnella et al., 2007; Guaragnella et al., 2011; Farrugia and Balzan, 2012). To
better understand the effect of the endogenous production of L-AA on ROS content
under acetic acid stress, cells were stained with the fluorescent probes 2,7
dichlorofluorescin diacetate (H2-DCF-DA) and dihydroethidium (DHE) during
exposure to 100 mM acetic acid at pH 3.0 (Figure 4).
H2-DCF-DA permeates into the cell, where it is hydrolyzed by cellular esterases to
DCFH, which is then oxidised primarily by H2O2, but also by other reactive species
such as HO•, ROO
• and by reactive nitrogen species (RNS), such as
•NO and
ONOO-, to the green fluorescent DCF (Gomes et al., 2005). DHE has been used to
detect superoxide anion (O2-•) due to its reported relative specificity for this ROS,
which has been described as associated to cells committed to death (Gomes et al.,
2005; Guaragnella et al., 2007).
No fluorescence signal associated with both H2-DCF-DA and DHE was detected
when cells were incubated in minimal medium at pH 3.0 (data not shown).
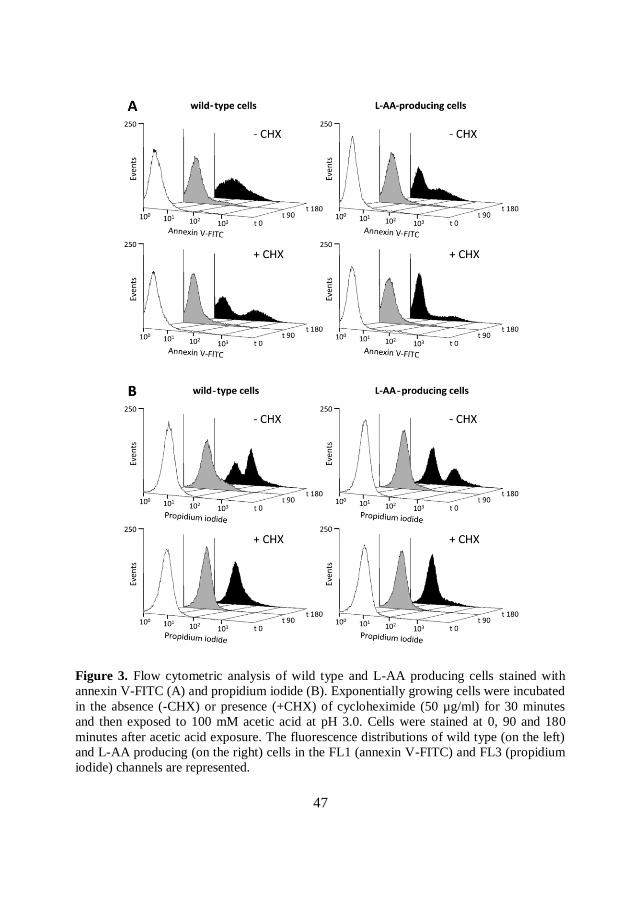
Consistently with the literature data (Guaragnella et al., 2007), fluorescence signal
of H2-DCF-DA was detected during the first 45 minutes of acetic acid treatment
and not at later times (Figure 4A). DHE signal was instead detected after 60
minutes of acetic acid treatment and not before (Figure 4B). The L-AA producing
strain exhibited a lower percentage of both H2-DCF-DA and DHE positive cells
respect to the wild type at all the tested times (Figures 4A and 4B). The lower
intracellular ROS accumulation correlates with the higher viability of the L-AA
producing strain compared with the wild type strain.
49
Figure 4. A) H2-DCF-DA and B) DHE positive cells (%) during acetic acid treatment in
wild type and L-AA producing cells. To determine the percentage of cells positive to the
dyes, at least 400 cells were evaluated for each sample and for each time and analysed in
three independent experiments. Error bars correspond to SDs from three independent
experiments.
To further support this conclusion, the MitoSox probe was used to monitor
mitochondrial superoxide anion. The data obtained showed that the percentage of
cells not accumulating O2-• in the mitochondrial matrix after 100 minutes of acetic
acid exposure was higher in the L-AA producing compared to the wild type strain
(45% vs 36%), confirming the better detoxification occurring in the engineered
strain.
50
Low pH pre-treatment affect cell survival under acetic acid stress of both
wild type and L-AA producing strains
Many organisms become more tolerant to severe doses of a stress agent as a
consequence of an initial exposure to a mild dose of the same or of another type of
stress. This phenomenon, termed “acquired stress resistance”, has been observed in
microbes such as bacteria and yeasts as well as in multicellular organisms
including plants, mammals, and even humans (Davies et al., 1995; Durrant and
Dong, 2004; Hecker et al., 2007; Kensler et al., 2007; Matsumoto et al., 2007).
This adaptive response relays upon the de novo protein synthesis occurring during
the initial mild pre-treatment, but not during the severe stress treatment (Berry and
Gasch, 2008; Lewis et al., 2010). It has been previously demonstrated that acid
stress adaptation of S. cerevisiae (pre-incubation of cells in minimal medium at pH
3.0 for 30 minutes prior to the exposure to acetic acid) protects cells from
subsequent AA-PCD, and this correlates with a high catalase activity (Giannattasio
et al., 2005). Consistently, over-expression of CTT1, encoding for the cytosolic
form of catalase, leads to reduced oxidative stress and increased cell resistance to
various stress conditions (Guaragnella et al., 2008; Abbott et al., 2009; Collinson et
al., 2011).
To investigate the effect of the simultaneous intracellular L-AA production and
low pH pre-treatment on yeast viability under acetic acid stress, cell survival of
wild type and L-AA producing strains was assayed after pre-incubation in minimal
medium at pH 3.0 for 30 minutes prior to acetic acid exposure (Figure 5).
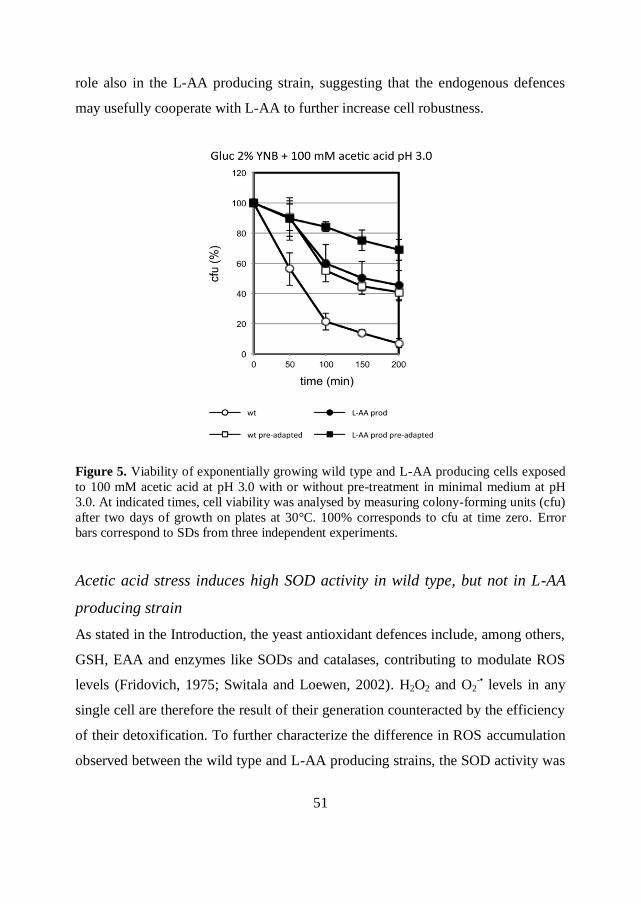
Acid stress adaptation significantly enhanced cell viability, and in particular from 5
to 41% in wild type (Figure 5, open circles vs open squares) and from 45 to 69% in
L-AA producing cells (Figure 5, closed circles vs closed squares) after 200 minutes
of acetic acid exposure. Hence, acquisition of acetic acid tolerance through pre-
adaptation at low pH occurs more evidently in wild type cells, but plays a relevant
51
role also in the L-AA producing strain, suggesting that the endogenous defences
may usefully cooperate with L-AA to further increase cell robustness.
Figure 5. Viability of exponentially growing wild type and L-AA producing cells exposed
to 100 mM acetic acid at pH 3.0 with or without pre-treatment in minimal medium at pH
3.0. At indicated times, cell viability was analysed by measuring colony-forming units (cfu)
after two days of growth on plates at 30°C. 100% corresponds to cfu at time zero. Error
bars correspond to SDs from three independent experiments.
Acetic acid stress induces high SOD activity in wild type, but not in L-AA
producing strain
As stated in the Introduction, the yeast antioxidant defences include, among others,
GSH, EAA and enzymes like SODs and catalases, contributing to modulate ROS
levels (Fridovich, 1975; Switala and Loewen, 2002). H2O2 and O2-• levels in any
single cell are therefore the result of their generation counteracted by the efficiency
of their detoxification. To further characterize the difference in ROS accumulation
observed between the wild type and L-AA producing strains, the SOD activity was
52
determined. We focused our attention on the first 60 minutes of stress, where a
good fraction (at least 50%) of cells is still viable in both strains (Figure 1B,
triangles).
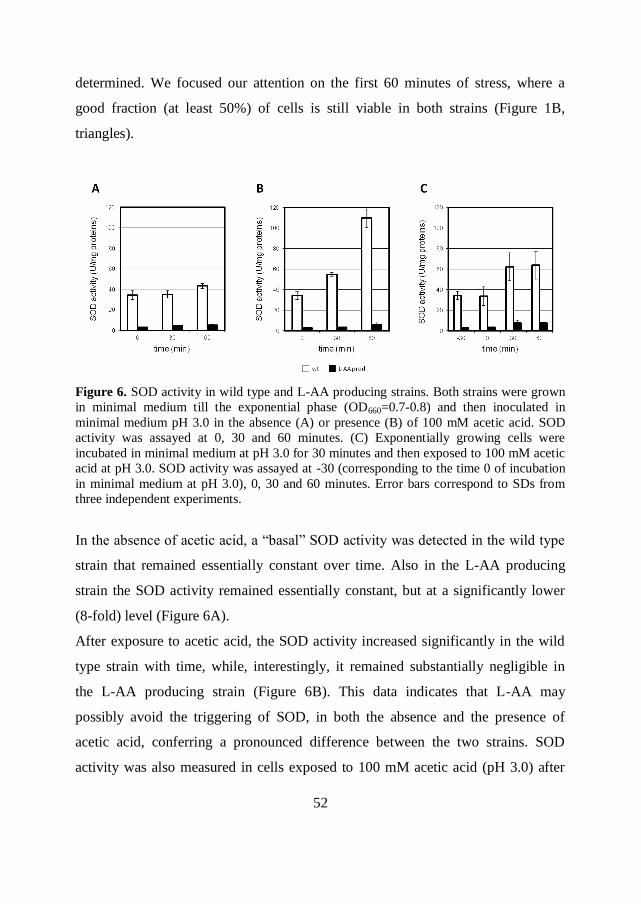
Figure 6. SOD activity in wild type and L-AA producing strains. Both strains were grown
in minimal medium till the exponential phase (OD660=0.7-0.8) and then inoculated in
minimal medium pH 3.0 in the absence (A) or presence (B) of 100 mM acetic acid. SOD
activity was assayed at 0, 30 and 60 minutes. (C) Exponentially growing cells were
incubated in minimal medium at pH 3.0 for 30 minutes and then exposed to 100 mM acetic
acid at pH 3.0. SOD activity was assayed at -30 (corresponding to the time 0 of incubation
in minimal medium at pH 3.0), 0, 30 and 60 minutes. Error bars correspond to SDs from
three independent experiments.
In the absence of acetic acid, a “basal” SOD activity was detected in the wild type
strain that remained essentially constant over time. Also in the L-AA producing
strain the SOD activity remained essentially constant, but at a significantly lower
(8-fold) level (Figure 6A).
After exposure to acetic acid, the SOD activity increased significantly in the wild
type strain with time, while, interestingly, it remained substantially negligible in
the L-AA producing strain (Figure 6B). This data indicates that L-AA may
possibly avoid the triggering of SOD, in both the absence and the presence of
acetic acid, conferring a pronounced difference between the two strains. SOD
activity was also measured in cells exposed to 100 mM acetic acid (pH 3.0) after
53
pre-adaptation at pH 3.0 for 30 minutes. SOD activity was substantially not
influenced by the low pH treatment (Figure 6C), as it remained constant in both
strains for 30 minutes of pre-treatment. After 30 minutes of acetic acid exposure, it
was subsequently induced in both strains, even though in the L-AA producing
strain it remained very low, resembling the trend obtained in the absence of acetic
acid treatment (Figure 6C). Moreover, under acetic acid stress, in the wild type
strain the low pH pre-treatment causes a minor SOD activation respect to that
observed in cells directly exposed to the acid (compare time 60 min between
Figures 6B and C).
It is important to underline once more that SOD generally represents the first line
of defence in the wild type strain in the early phases of oxidative stress exposure.
Indeed, it has been shown that sod1 and sod2 yeast mutants, defective in the
cytosolic and mitochondrial SOD respectively, turned out to be hypersensitive to
oxidative stress induced by various pro-oxidant agents (Outten et al., 2005;
Auesukaree et al., 2009; Kwolek-Mirek et al., 2011). However, literature already
suggested that a triggering of the sole SOD activity is, in any case, not enough to
overcome a severe stress (Harris et al., 2005; Guaragnella et al., 2008), but it
should at least be coupled with the overexpression of CCS1, which encodes for a
chaperone responsible of Sod1 apoprotein activation (Brown et al., 2004; Harris et
al., 2005). Indeed, a high SOD activity in the wild type strain after 60 minutes
(Figure 6B) is not enough to prevent cell death, a process that is much avoided in
the L-AA producing strain (Figure 1B).
To better elucidate the role of SOD, we deleted the SOD1 gene in the wild type and
L-AA producing strains. Deleted strains were grown in liquid medium either in the
absence or in the presence of acetic acid 40 mM (Figure 7). Methionine and lysine
(100 mg/l) were added to the medium, as SOD1 deletion has been reported to cause
auxotrophy for both amino acids when cells are grown aerobically (Liu et al.,
1992).
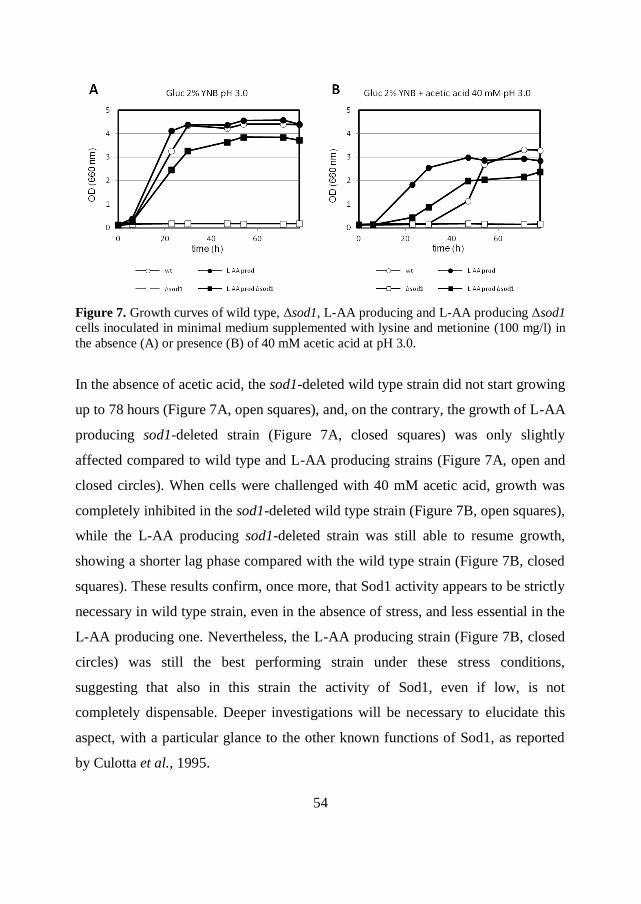
54
Figure 7. Growth curves of wild type, Δsod1, L-AA producing and L-AA producing Δsod1
cells inoculated in minimal medium supplemented with lysine and metionine (100 mg/l) in
the absence (A) or presence (B) of 40 mM acetic acid at pH 3.0.
In the absence of acetic acid, the sod1-deleted wild type strain did not start growing
up to 78 hours (Figure 7A, open squares), and, on the contrary, the growth of L-AA
producing sod1-deleted strain (Figure 7A, closed squares) was only slightly
affected compared to wild type and L-AA producing strains (Figure 7A, open and
closed circles). When cells were challenged with 40 mM acetic acid, growth was
completely inhibited in the sod1-deleted wild type strain (Figure 7B, open squares),
while the L-AA producing sod1-deleted strain was still able to resume growth,
showing a shorter lag phase compared with the wild type strain (Figure 7B, closed
squares). These results confirm, once more, that Sod1 activity appears to be strictly
necessary in wild type strain, even in the absence of stress, and less essential in the
L-AA producing one. Nevertheless, the L-AA producing strain (Figure 7B, closed
circles) was still the best performing strain under these stress conditions,
suggesting that also in this strain the activity of Sod1, even if low, is not
completely dispensable. Deeper investigations will be necessary to elucidate this
aspect, with a particular glance to the other known functions of Sod1, as reported
by Culotta et al., 1995.
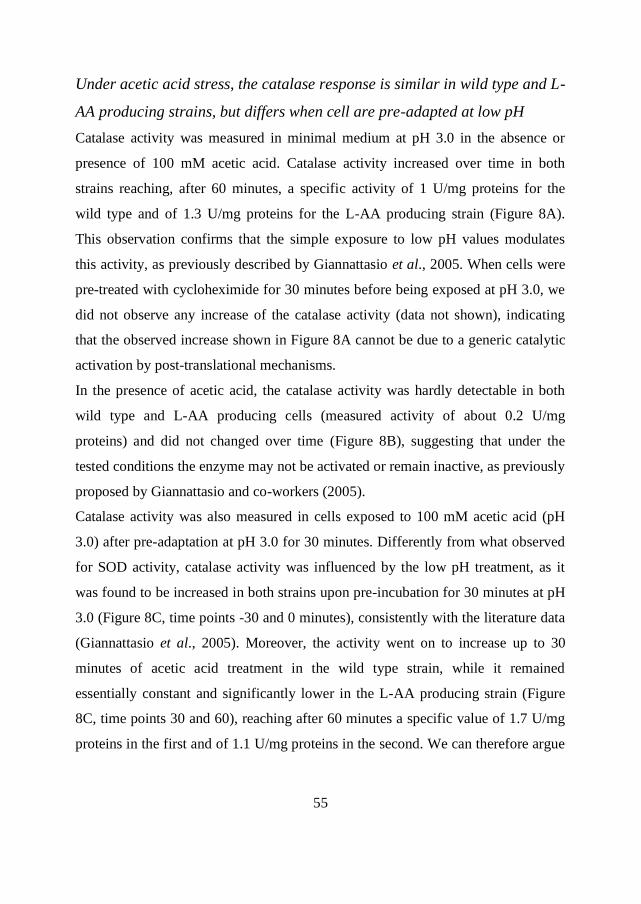
55
Under acetic acid stress, the catalase response is similar in wild type and L-
AA producing strains, but differs when cell are pre-adapted at low pH
Catalase activity was measured in minimal medium at pH 3.0 in the absence or
presence of 100 mM acetic acid. Catalase activity increased over time in both
strains reaching, after 60 minutes, a specific activity of 1 U/mg proteins for the
wild type and of 1.3 U/mg proteins for the L-AA producing strain (Figure 8A).
This observation confirms that the simple exposure to low pH values modulates
this activity, as previously described by Giannattasio et al., 2005. When cells were
pre-treated with cycloheximide for 30 minutes before being exposed at pH 3.0, we
did not observe any increase of the catalase activity (data not shown), indicating
that the observed increase shown in Figure 8A cannot be due to a generic catalytic
activation by post-translational mechanisms.
In the presence of acetic acid, the catalase activity was hardly detectable in both
wild type and L-AA producing cells (measured activity of about 0.2 U/mg
proteins) and did not changed over time (Figure 8B), suggesting that under the
tested conditions the enzyme may not be activated or remain inactive, as previously
proposed by Giannattasio and co-workers (2005).
Catalase activity was also measured in cells exposed to 100 mM acetic acid (pH
3.0) after pre-adaptation at pH 3.0 for 30 minutes. Differently from what observed
for SOD activity, catalase activity was influenced by the low pH treatment, as it
was found to be increased in both strains upon pre-incubation for 30 minutes at pH
3.0 (Figure 8C, time points -30 and 0 minutes), consistently with the literature data
(Giannattasio et al., 2005). Moreover, the activity went on to increase up to 30
minutes of acetic acid treatment in the wild type strain, while it remained
essentially constant and significantly lower in the L-AA producing strain (Figure
8C, time points 30 and 60), reaching after 60 minutes a specific value of 1.7 U/mg
proteins in the first and of 1.1 U/mg proteins in the second. We can therefore argue
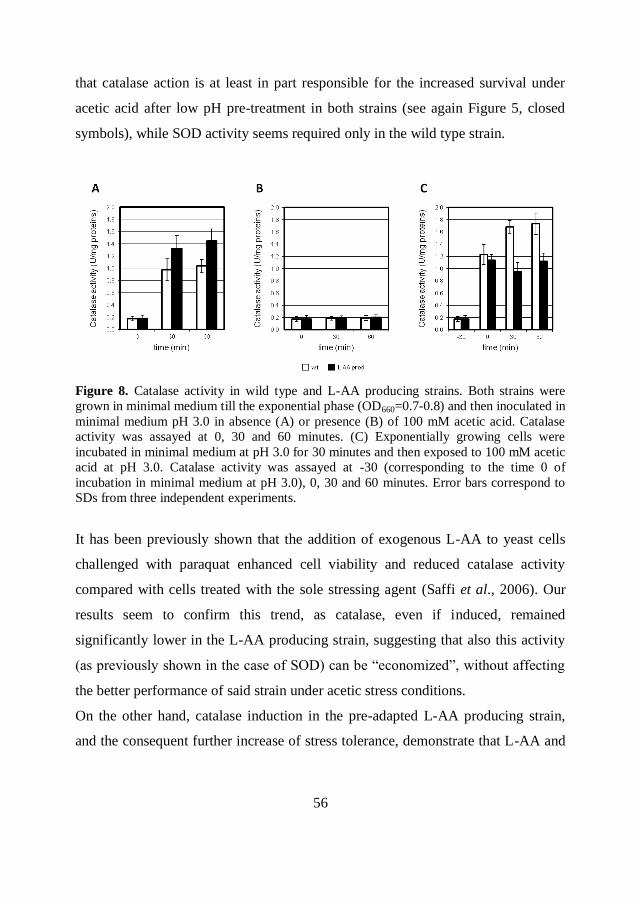
56
that catalase action is at least in part responsible for the increased survival under
acetic acid after low pH pre-treatment in both strains (see again Figure 5, closed
symbols), while SOD activity seems required only in the wild type strain.
Figure 8. Catalase activity in wild type and L-AA producing strains. Both strains were
grown in minimal medium till the exponential phase (OD660=0.7-0.8) and then inoculated in
minimal medium pH 3.0 in absence (A) or presence (B) of 100 mM acetic acid. Catalase
activity was assayed at 0, 30 and 60 minutes. (C) Exponentially growing cells were
incubated in minimal medium at pH 3.0 for 30 minutes and then exposed to 100 mM acetic
acid at pH 3.0. Catalase activity was assayed at -30 (corresponding to the time 0 of
incubation in minimal medium at pH 3.0), 0, 30 and 60 minutes. Error bars correspond to
SDs from three independent experiments.
It has been previously shown that the addition of exogenous L-AA to yeast cells
challenged with paraquat enhanced cell viability and reduced catalase activity
compared with cells treated with the sole stressing agent (Saffi et al., 2006). Our
results seem to confirm this trend, as catalase, even if induced, remained
significantly lower in the L-AA producing strain, suggesting that also this activity
(as previously shown in the case of SOD) can be “economized”, without affecting
the better performance of said strain under acetic stress conditions.
On the other hand, catalase induction in the pre-adapted L-AA producing strain,
and the consequent further increase of stress tolerance, demonstrate that L-AA and
57
catalase effects are only partially overlapping and that the stress response is a
complex trait.
Moreover, as a second consideration, it turns out that SOD and catalase enzymes
do not necessary act in sequence, as it may be expected. We could measure catalase
activity even in the absence of SOD activity, as in the case of pre-adapted L-AA
producing strain. In this sense our results corroborate the hypothesis of catalase
involvement in the acquisition of tolerance and in the adaptation response to the
stress, as previously suggested (Izawa et al., 1996). Further investigations are still
necessary to fully explore the effective role of catalase in the stress response and its
relations with the GSH system as suggested by previous studies (Grant et al.,
1998).
Reduced and oxidized glutathione accumulate more in the wild type
compared with the L-AA producing strain during acetic acid stress
Glutathione is a tripeptide with antioxidant properties composed of cysteine,
glutamate and glycine. Studied on gsh1-deleted yeast strains, defective in one of
the two enzymes responsible for glutathione synthesis, revealed that this molecule
is indispensable for an efficient oxidative stress response (Izawa et al., 1995;
Stephen and Jamieson, 1996). Consistently, yeast strains over-expressing GSH1
have been shown to be more tolerant to H2O2-induced oxidative stress compared
with wild type strains (Collinson et al., 2011). Glutathione can exist in either its
reduced (GSH) or oxidized (GSSG) form, the last occurring when two GSH
molecules are interlinked with a disulfide bond. In fact, the utilization of GSH
results in the oxidation to its disulfide form, from which GSH can be regenerated
by the action of the NADPH-dependent glutathione reductase (Grant, 2001).
The intracellular content of GSH and GSSG has been measured in both strains
every 30 minutes during 120 minutes of exposure to 100 mM acetic acid at pH 3.0
(Figure 9).
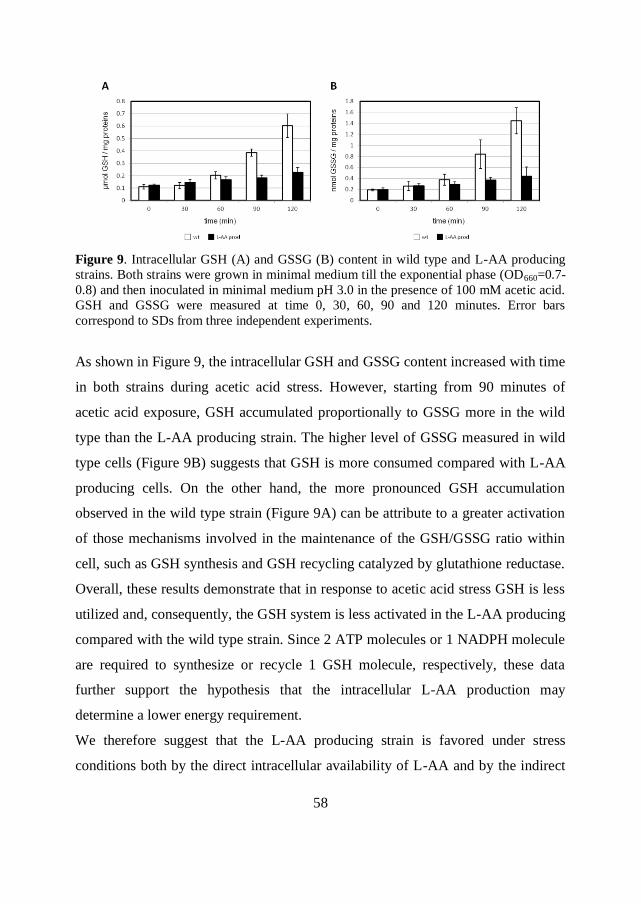
58
Figure 9. Intracellular GSH (A) and GSSG (B) content in wild type and L-AA producing
strains. Both strains were grown in minimal medium till the exponential phase (OD660=0.7-
0.8) and then inoculated in minimal medium pH 3.0 in the presence of 100 mM acetic acid.
GSH and GSSG were measured at time 0, 30, 60, 90 and 120 minutes. Error bars
correspond to SDs from three independent experiments.
As shown in Figure 9, the intracellular GSH and GSSG content increased with time
in both strains during acetic acid stress. However, starting from 90 minutes of
acetic acid exposure, GSH accumulated proportionally to GSSG more in the wild
type than the L-AA producing strain. The higher level of GSSG measured in wild
type cells (Figure 9B) suggests that GSH is more consumed compared with L-AA
producing cells. On the other hand, the more pronounced GSH accumulation
observed in the wild type strain (Figure 9A) can be attribute to a greater activation
of those mechanisms involved in the maintenance of the GSH/GSSG ratio within
cell, such as GSH synthesis and GSH recycling catalyzed by glutathione reductase.
Overall, these results demonstrate that in response to acetic acid stress GSH is less
utilized and, consequently, the GSH system is less activated in the L-AA producing
compared with the wild type strain. Since 2 ATP molecules or 1 NADPH molecule
are required to synthesize or recycle 1 GSH molecule, respectively, these data
further support the hypothesis that the intracellular L-AA production may
determine a lower energy requirement.
We therefore suggest that the L-AA producing strain is favored under stress
conditions both by the direct intracellular availability of L-AA and by the indirect
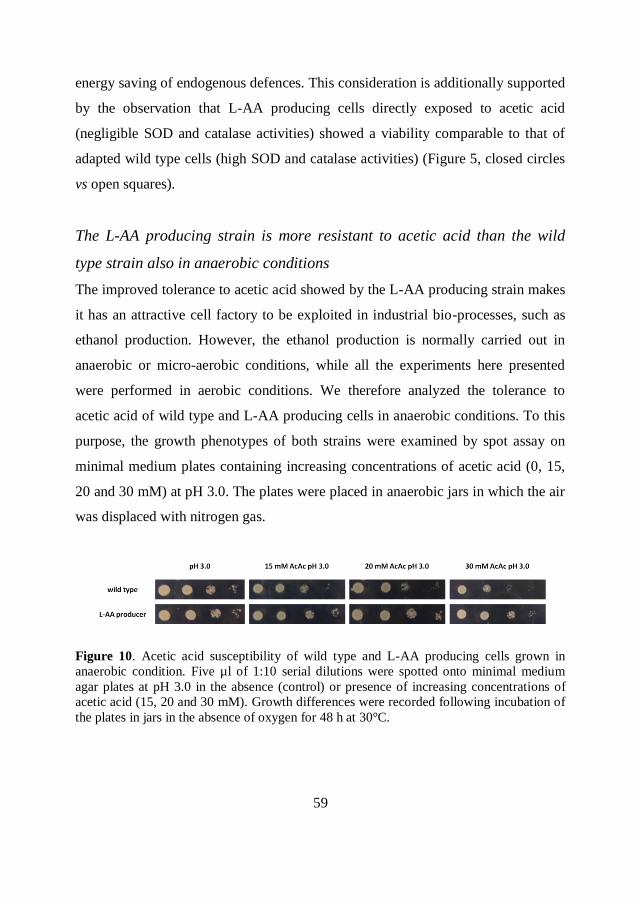
59
energy saving of endogenous defences. This consideration is additionally supported
by the observation that L-AA producing cells directly exposed to acetic acid
(negligible SOD and catalase activities) showed a viability comparable to that of
adapted wild type cells (high SOD and catalase activities) (Figure 5, closed circles
vs open squares).
The L-AA producing strain is more resistant to acetic acid than the wild
type strain also in anaerobic conditions
The improved tolerance to acetic acid showed by the L-AA producing strain makes
it has an attractive cell factory to be exploited in industrial bio-processes, such as
ethanol production. However, the ethanol production is normally carried out in
anaerobic or micro-aerobic conditions, while all the experiments here presented
were performed in aerobic conditions. We therefore analyzed the tolerance to
acetic acid of wild type and L-AA producing cells in anaerobic conditions. To this
purpose, the growth phenotypes of both strains were examined by spot assay on
minimal medium plates containing increasing concentrations of acetic acid (0, 15,
20 and 30 mM) at pH 3.0. The plates were placed in anaerobic jars in which the air
was displaced with nitrogen gas.
Figure 10. Acetic acid susceptibility of wild type and L-AA producing cells grown in
anaerobic condition. Five µl of 1:10 serial dilutions were spotted onto minimal medium
agar plates at pH 3.0 in the absence (control) or presence of increasing concentrations of
acetic acid (15, 20 and 30 mM). Growth differences were recorded following incubation of
the plates in jars in the absence of oxygen for 48 h at 30°C.

60
As shown in Figure 10, under anaerobic conditions the L-AA producing strain
exhibited a lower growth inhibition compared with the wild type strain at all the
tested acetic acid concentrations.
61
Conclusions
In conclusion, here we show that the higher viability of the L-AA producing strain
exposed to acetic acid in comparison with the wild type strain correlates with a
minor to null activation of SOD, with a lower GSH requirement and, following the
pre-treatment at pH 3.0, with a minor induction of catalase. Moreover, in the
engineered strain there is a significantly lower fraction of cells undergoing an
active mechanism of death, correlating with a lower accumulation of ROS,
suggesting a protective effect of L-AA against the ROS-dependent AA-PCD
pathway. To better elucidate this aspect, it would be interesting to study the effect
of the intracellular L-AA production on acetic acid response in mutant strains in
which AA-PCD occurs in a ROS-independent way (Guaragnella et al., 2010b).
Last but not least, a relevant difference in SOD activation between the two strains
is also detected in the absence of stress conditions, and a consequence on growth is
visible also at non-lethal concentration of acetic acid (40 mM, Figure 7).
Furthermore, the demonstration that the L-AA producing strain is more tolerant to
acetic acid than wild type strain also under anaerobic conditions suggests that it is
worth to assay the ethanol production of the engineered strain in bioreactors.
Finally, we could speculate that the effects derived from the endogenous vitamin C
production allows the cells to save energy, and these features may be desirable for
a cell factory which requires energy to be devoted to growth and
biomass/metabolites accumulation/production.
For these said reasons, the engineered yeast is an interesting model for further
studying how, and to which extent, intracellular antioxidants can prevent cellular
damages and their consequences, and at the same time for further suggesting how
to improve a cell factory.
62
References
Abbott DA, Suir E, Duong GH, de Hulster E, Pronk JT, van Maris AJ. 2009.
Catalase overexpression reduces lactic acid-induced oxidative stress in
Saccharomyces cerevisiae. Appl Environ Microbiol 75: 2320-5.
Amari F, Fettouche A, Samra MA, Kefalas P, Kampranis SC, Makris AM. 2008.
Antioxidant small molecules confer variable protection against oxidative
damage in yeast mutants. J Agric Food Chem 56: 11740-51.
Auesukaree C, Damnernsawad A, Kruatrachue M, Pokethitiyook P, Boonchird C,
Kaneko Y, Harashima S. 2009. Genome-wide identification of genes involved
in tolerance to various environmental stresses in Saccharomyces cerevisiae. J
Appl Genet 50: 301-10.
Berry DB, Gasch AP. 2008. Stress-activated genomic expression changes serve a
preparative role for impending stress in yeast. Mol Biol Cell 19: 4580-7.
Bradford MM. 1976. A rapid and sensitive method for the quantitation of
microgram quantities of protein utilizing the principle of protein-dye binding.
Anal Biochem 72: 248-54.
Brambilla L, Bolzani D, Compagno C, Carrera V, van Dijken JP, Pronk JT, Ranzi
BM, Alberghina L, Porro D. 1999. NADH reoxidation does not control
glycolytic flux during exposure of respiring Saccharomyces cerevisiae
cultures to glucose excess. FEMS Microbiol Lett 171: 133-40.
Branduardi P, Fossati T, Sauer M, Pagani R, Mattanovich D, Porro D. 2007.
Biosynthesis of vitamin C by yeast leads to increased stress resistance. PLoS
One 2: e1092.
Brown NM, Torres AS, Doan PE, O'Halloran TV. 2004. Oxygen and the copper
chaperone CCS regulate posttranslational activation of Cu,Zn superoxide
dismutase. Proc Natl Acad Sci USA 101: 5518-23.
Clément MV, Ramalingam J, Long LH, Halliwell B. 2001. The in vitro
cytotoxicity of ascorbate depends on the culture medium used to perform the
assay and involves hydrogen peroxide. Antioxid Redox Signal 3: 157-63.
Collinson EJ, Wimmer-Kleikamp S, Gerega SK, Yang YH, Parish CR., Dawes IW,
Stocker R. 2011. The yeast homolog of heme oxygenase-1 affords cellular
antioxidant protection via the transcriptional regulation of known antioxidant
genes. J Biol Chem 286: 2205-14.
Culotta VC, Joh HD, Lin SJ, Slekar KH, and Strain J. 1995. A physiological role
for Saccharomyces cerevisiae copper/zinc superoxide dismutase in copper
buffering. J Biol Chem 270: 29991-7.
Davies JM, Lowry CV, Davies KJ. 1995. Transient adaptation to oxidative stress in
yeast. Arch Biochem Biophys 317: 1-6.
63
Durrant WE, Dong X. 2004. Systemic acquired resistance. Annu Rev Phytopathol
42: 185-209.
Farrugia G, Balzan R. 2012. Oxidative stress and programmed cell death in yeast.
Front Oncol 2: 64.
Fossati T, Solinas N, Porro D, Branduardi P. 2011. L-ascorbic acid producing
yeasts learn from plants how to recycle it. Metab Eng 13: 177-85.
Fridovich I. 1975. Superoxide dismutases. Annu Rev Biochem 44: 147-59.
Giannattasio S, Guaragnella N, Corte-Real M, Passarella S, Marra E. 2005. Acid
stress adaptation protects Saccharomyces cerevisiae from acetic acid-induced
programmed cell death. Gene 354: 93-8.
Gietz RD, Woods RA. 2002. Transformation of yeast by lithium acetate/single-
stranded carrier DNA/polyethylene glycol method. Methods Enzymol 350: 87-
96.
Goffeau A. 1996. 1996: a vintage year for yeast and Yeast. Yeast 12: 1603-5.
Goldstein AL, McCusker, JH. 1999. Three new dominant drug resistance cassettes
for gene disruption in Saccharomyces cerevisiae. Yeast 15: 1541-53.
Gomes A, Fernandes E, Lima JL. 2005. Fluorescence probes used for detection of
reactive oxygen species. J Biochem Biophys Methods 65: 45-80.
Grant CM. 2001. Role of the glutathione/glutaredoxin and thioredoxin systems in
yeast growth and response to stress conditions. Mol Microbiol 39: 533-41.
Grant CM, Perrone G, Dawes IW. 1998. Glutathione and catalase provide
overlapping defenses for protection against hydrogen peroxide in the yeast
Saccharomyces cerevisiae. Biochem Biophys Res Commun 253: 893-8.
Guaragnella N, Antonacci L, Giannattasio S, Marra E, Passarella S. 2008. Catalase
T and Cu,Zn-superoxide dismutase in the acetic acid-induced programmed
cell death in Saccharomyces cerevisiae. FEBS Lett 582: 210-4.
Guaragnella N, Antonacci L, Passarella S, Marra E, Giannattasio S. 2007.
Hydrogen peroxide and superoxide anion production during acetic acid-
induced yeast programmed cell death. Folia Microbiol (Praha) 52: 237-40.
Guaragnella N, Antonacci L, Passarella S, Marra E, Giannattasio S. 2011.
Achievements and perspectives in yeast acetic acid-induced programmed cell
death pathways. Biochem Soc Trans 39: 1538-43.
Guldfeldt LU, Arneborg N. 1998. Measurement of the effects of acetic acid and
extracellular pH on intracellular pH of nonfermenting, individual
Saccharomyces cerevisiae cells by fluorescence microscopy. Appl Environ
Microbiol 64: 530-4.
Halliwell B. 1999. Vitamin C: poison, prophylactic or panacea? Trends Biochem
Sci 24: 255-9.
Harris N, Bachler M, Costa V, Mollapour M, Moradas-Ferreira P, Piper PW. 2005.
Overexpressed Sod1p acts either to reduce or to increase the lifespans and
64
stress resistance of yeast, depending on whether it is Cu(2+)
-deficient or an
active Cu,Zn-superoxide dismutase. Aging Cell 4: 41-52.
Hecker M, Pané-Farré J, Völker U. 2007. SigB-dependent general stress response
in Bacillus subtilis and related gram-positive bacteria. Annu Rev Microbiol 61:
215-36.
Herrero E, Ros J, Bellí G, Cabiscol E. 2008. Redox control and oxidative stress in
yeast cells. Biochim Biophys Acta 1780: 1217-35.
Hong KK, Nielsen J. 2012. Metabolic engineering of Saccharomyces cerevisiae: a
key cell factory platform for future biorefineries. Cell Mol Life Sci 69: 2671-
90.
Huh WK, Lee BH, Kim ST, Kim YR, Rhie GE, Baek YW, Hwang CS, Lee JS,
Kang SO. 1998. D-Erythroascorbic acid is an important antioxidant molecule
in Saccharomyces cerevisiae. Mol Microbiol 30: 895-903.
Izawa S, Inoue Y, Kimura A. 1995. Oxidative stress response in yeast: effect of
glutathione on adaptation to hydrogen peroxide stress in Saccharomyces
cerevisiae. FEBS Lett 368: 73-6.
Izawa S, Inoue Y, Kimura A. 1996. Importance of catalase in the adaptive response
to hydrogen peroxide: analysis of acatalasaemic Saccharomyces cerevisiae.
Biochem J 320 ( Pt 1): 61-7.
Kensler TW, Wakabayashi N, Biswal S. 2007. Cell survival responses to
environmental stresses via the Keap1-Nrf2-ARE pathway. Annu Rev
Pharmacol Toxicol 47: 89-116.
Kwolek-Mirek M, Bartosz G, Spickett CM. 2011. Sensitivity of antioxidant-
deficient yeast to hypochlorite and chlorite. Yeast 28: 595-609.
Lewis JA, Elkon IM, McGee MA, Higbee AJ, Gasch AP. 2010. Exploiting natural
variation in Saccharomyces cerevisiae to identify genes for increased ethanol
resistance. Genetics 186: 1197-205.
Liu XF, Elashvili I, Gralla EB, Valentine JS, Lapinskas P, and Culotta VC. 1992.
Yeast lacking superoxide dismutase. Isolation of genetic suppressors. J Biol
Chem 267: 18298-302.
Ludovico P, Sansonetty F, Silva MT, Côrte-Real M. 2003. Acetic acid induces a
programmed cell death process in the food spoilage yeast Zygosaccharomyces
bailii. FEMS Yeast Res 3: 91-6.
Ludovico P, Sousa MJ, Silva MT, Leão C, Côrte-Real M. 2001. Saccharomyces
cerevisiae commits to a programmed cell death process in response to acetic
acid. Microbiology 147: 2409-15.
Madeo F, Fröhlich E, Ligr M, Grey M, Sigrist SJ, Wolf DH, Fröhlich KU. 1999.
Oxygen stress: a regulator of apoptosis in yeast. J Cell Biol 145: 757-67.
Maiorella B, Blanch HW, Wilke CR. 1983. By-product inhibition effects on
ethanolic fermentation by Saccharomyces cerevisiae. Biotechnol Bioeng 25:
103-21.
65
Matsumoto H, Hamada N, Takahashi A, Kobayashi Y, Ohnishi T. 2007.
Vanguards of paradigm shift in radiation biology: radiation-induced adaptive
and bystander responses. J Radiat Res 48: 97-106.
Mattanovich D, Gasser B, Hohenblum H, Sauer M. 2004. Stress in recombinant
protein producing yeasts. J Biotechnol 113: 121-35.
Mattson MP, Furukawa K. 1997. Anti-apoptotic actions of cycloheximide:
blockade of programmed cell death or induction of programmed cell life?
Apoptosis 2: 257-64.
Morano KA, Grant CM, Moye-Rowley WS. 2012. The response to heat shock and
oxidative stress in Saccharomyces cerevisiae. Genetics 190: 1157-95.
Munoz AJ, Wanichthanarak K, Meza E, Petranovic D. 2012. Systems biology of
yeast cell death. FEMS Yeast Res 12: 249-65.
Outten CE, Falk RL, Culotta VC. 2005. Cellular factors required for protection
from hyperoxia toxicity in Saccharomyces cerevisiae. Biochem J 388: 93-101.
Palmqvist E, Hahn-Hägerdal B. 2000. Fermentation of lignocellulosic
hydrolysates. II: inhibitors and mechanisms of inhibition. Bioresource
Technology 74: 25-33.
Pampulha ME, Loureiro-Dias MC. 1990. Activity of glycolytic enzymes of
Saccharomyces cerevisiae in the presence of acetic acid. Appl Microbiol
Biotechnol 34: 375-380.
Paolini M, Pozzetti L, Pedulli GF, Marchesi E, Cantelli-Forti G. 1999. The nature
of prooxidant activity of vitamin C. Life Sci 64: PL 273-8.
Piper P, Calderon CO, Hatzixanthis K, Mollapour M. 2001. Weak acid adaptation:
the stress response that confers yeasts with resistance to organic acid food
preservatives. Microbiology 147: 2635-42.
Poljsak B, Gazdag Z, Jenko-Brinovec S, Fujs S, Pesti M, Bélagyi J, Plesnicar S,
Raspor P. 2005. Pro-oxidative vs antioxidative properties of ascorbic acid in
chromium(VI)-induced damage: an in vivo and in vitro approach. J Appl
Toxicol 25: 535-48.
Porro D, Gasser B, Fossati T, Maurer M, Branduardi P, Sauer M, Mattanovich D.
2011. Production of recombinant proteins and metabolites in yeasts: when are
these systems better than bacterial production systems? Appl Microbiol
Biotechnol 89: 939-48.
Rahman I, Kode A, Biswas SK. 2006. Assay for quantitative determination of
glutathione and glutathione disulfide levels using enzymatic recycling method.
Nat Protoc 1: 3159-65.
Rego A, Costa M, Chaves SR, Matmati N, Pereira H, Sousa MJ, Moradas-Ferreira
P, Hannun YA, Costa V, Côrte-Real M. 2012. Modulation of mitochondrial
outer membrane permeabilization and apoptosis by ceramide metabolism.
PLoS One 7: e48571.
66
Saffi J, Sonego L, Varela QD, Salvador M. 2006. Antioxidant activity of L-
ascorbic acid in wild-type and superoxide dismutase deficient strains of
Saccharomyces cerevisiae. Redox Rep 11: 179-84.
Semchyshyn HM, Abrat OB, Miedzobrodzki J, Inoue Y, Lushchak VI. 2011.
Acetate but not propionate induces oxidative stress in bakers' yeast
Saccharomyces cerevisiae. Redox Rep 16: 15-23.
Stephen DW, Jamieson DJ. 1996. Glutathione is an important antioxidant molecule
in the yeast Saccharomyces cerevisiae. FEMS Microbiol Lett 141: 207-12.
Switala J, Loewen PC. 2002. Diversity of properties among catalases. Arch
Biochem Biophys 401: 145-54.
Ullah A, Orij R, Brul S, Smits GJ. 2012. Quantitative Analysis of the Modes of
Growth Inhibition by Weak Organic Acids in Saccharomyces cerevisiae. Appl
Environ Microbiol 78: 8377-87.
67
Chapter 2
Effects of the intracellular
production of vitamin C on
Saccharomyces cerevisiae
chronological life span
Manuscript in preparation for FEMS Yeast Research

68
69
Introduction
Ascorbic acid, or Vitamin C, is a water-soluble vitamin with antioxidant properties.
It is produced by several organisms such as plants and most animals except some
primates, including humans, and other species such as guinea pigs and bats, being
therefore an essential nutraceutical/nutrient. By acting as an anti-oxidant and as a
cofactor for a number of enzymes, several physiological functions of Vitamin C for
regular cell metabolism and functions have been described (as reviewed in Traber
and Stevens, 2011). Because of its highly effective antioxidant properties and
because reactive oxygen species (ROS) have been recognized as responsible of
cellular aging (Golden et al., 2002; Linnane et al., 2007), the effect of Vitamin C
supplementation on lifespan in higher eukaryotes has been extensively
investigated, but it remains quite controversial (Pallauf et al., 2013). Some studies
on model organisms reported a beneficial effect of Vitamin C on longevity (see, as
example, Bahadorani et al., 2008; Massie et al., 1984), while others were unable to
recognize a role of Vitamin C to prolong lifespan (see, as example, Selman et al.,
2006; Tappel et al., 1973) or even a reduction in longevity was observed (see, as
example, Massie et al., 1976; Sohal et al., 1985). Moreover, an inverse correlation
between the amount of Vitamin C supplemented and the effect on lifespan was
noted (Pallauf et al., 2013), possibly due to pro-oxidant properties of Vitamin C
(Podmore et al., 1998). It has been indeed demonstrated in vitro that Vitamin C
maintains iron and other transition metals in a reduced state leading to the
generation of hydroxyl radicals (HO•) or lipid alkoxyl radicals (LO
•) through the
Fenton reaction (Buettner and Jurkiewicz, 1996; Halliwell, 1996).
The yeast Saccharomyces cerevisiae has been widely exploited as a model system
to provide significant insights in the molecular mechanisms involved in the
regulation of aging, allowing the identification of pathways characterized by
70
similarities with those regulating the lifespan in higher eukaryotes (Fabrizio and
Longo, 2003; Fabrizio and Longo, 2007). It is generally accepted that, in yeast, as
well as in higher eukaryotes, oxidative stress, induced by the production of ROS by
mitochondrial metabolism, plays an important role in aging processes (Longo et
al., 2012). Consistently, several genetic factors involved in stress response have
been identified to modulate lifespan, pointing out a link between stress resistance
and longevity (Fabrizio et al., 2003; Longo et al., 2012). In particular, an important
role in long-term survival has been attributed to cytoplasmic (Sod1) and
mitochondrial (Sod2) superoxide dismutases, whose activity is essential for oxygen
radicals’ detoxification. In fact, yeast mutants lacking either SOD1 or SOD2, or
both, showed a short-life phenotype compared to wild type strains (Longo et al.,
1996). Coherently, the single over-expression of SOD1 or SOD2 increased S.
cerevisiae lifespan, and a more pronounced effect on cell survival was observed
when SOD1 and SOD2 were together over-expressed (Fabrizio et al., 2003). As
humans, S. cerevisiae does not produce Vitamin C, but it has been demonstrated
that the reduced lifespan due to the lack of Sod1 can be ameliorate by the
exogenous addition of ascorbate (Krzepiłko et al., 2004). However, the effect of
Vitamin C on longevity in wild type yeast strains has never been studied.
One of the classic approaches used to measure lifespan in S. cerevisiae is based on
the chronological longevity of a population of non-dividing yeast cells, named
chronological life span (CLS) (Fabrizio et al., 2003; Longo et al., 2012). CLS is
generally determined by growing cells till stationary phase and monitoring cell
survival over time. Viability is measured as cell ability to growth upon return to
rich-nutrient conditions. It has been suggested that the effect of ascorbic acid
cannot be accurately detected in vivo in cells treated with exogenous ascorbic acid,
since it leads to H2O2 production as a consequence of its auto-oxidation in cell
culture medium (Clément et al., 2001). The employment of a yeast strain able to
produce L-ascorbic acid by itself should therefore be preferred, especially in
71
studies requiring a long-time cultivation, such as those regarding CLS
measurements. Therefore, here we studied CLS in a S. cerevisiae wild type strain
compared to the same strain metabolically engineered to produce L-ascorbic acid
(L-AA) (Branduardi et al., 2007; Fossati et al., 2011). This strain has been
previously shown to be characterized by an increased stress resistance toward
different kinds of stress (Branduardi et al., 2007; Fossati et al., 2011), and in
particular to acetic acid (Martani et al., 2013), which represents a chronological
aging-inducer factor in yeast (Burtner et al., 2009).
Our data demonstrate that under standard conditions, i.e. growth in minimal
medium containing 2% glucose as initial carbon and energy source, the L-AA
producing strain exhibited an extended CLS compared with the wild type strain,
most likely linked to higher acetic acid tolerance and acetate metabolism.
72
Materials and methods
Yeast strain, media and growth conditions
The S. cerevisiae genetic background used in this study was GRF18U (MATα;
ura3; his3-11,15; leu2-3,112; cir+) (Brambilla et al., 1999). The strains used were
GRF18Uc [pZ5] (MATα; ura3; his3-11,15; leu2-3,112; [pYX012; pYX022;
pYX042; pZ5]) (Branduardi et al., 2007) and GRF18U L-AA producing (MATα;
ura3; his3-11,15; leu2-3,112; [p012bTAtME AtMIP; p022AtLGDH; p042ScALO;
pZ5AtVTC2] (Fossati et al., 2011).
Yeast cultures were grown in minimal synthetic medium (0.67% [w/v] YNB
medium [catalogue no. 919-15 Difco Laboratories, Detroit, Mich.] with 2% [w/v]
D-glucose as carbon source). Histidine, uracil, leucine, lysine, isoleucine and
valine (Sigma) and the antibiotic nourseotricine sulphate (cloNAT, WERNER
BioAgents, Germany) were added to a final concentration of 50 mg/L. Each
experiment was repeated at least three times. All strains were grown in shake flasks
at 30 °C and 160 rpm and the ratio of flask volume/medium was 5:1.
CLS determination
Cells were inoculated at OD660= 0.25 in minimal medium containing 2% glucose
supplemented with histidine, leucine, isoleucine, lysine, valine, and uracil and the
antibiotic nourseotricine sulphate. Starting from 72 h from the inoculum (Day 3,
first age point), when cells were in stationary phase, cells were plated every 2-3
days onto rich YPD medium (2% glucose, 1% yeast extract, 2% tryptone) agar
plates containing 50 mg/L of the antibiotic nourseotricine sulphate. Viability was
determined by measuring colony-forming units (cfu) after 2 days of growth on
plate at 30°C. 100% of cell survival corresponds to cfu at Day 3. CLS experiments
in buffered medium were performed by growing cells in minimal medium
73
containing 2% glucose added with a citrate phosphate buffer (64.2 mM Na2HPO4
and 17.9 mM citric acid, pH 6.0) prior to the inoculum.
Acetic acid treatment
Acetic acid treatment was performed essentially as described in (Burtner et al.,
2009). 500 µL of 5 days old cells, grown in minimal medium containing 2%
glucose, were transferred into round bottom tubes and 55.5 µL of 1, 2 or 3 M
concentrated acetic acid were added to the culture to obtain the final concentration
of 100, 200 or 300 mM, respectively. Cells were incubated for 200 min at 30°C at
160 rpm and successively a 1000 fold culture dilution was plated onto rich YPD
medium agar plates. Cell viability was determined by measuring cfu after 2 days of
growth on plate at 30°C. 100% of cell survival corresponds to cfu measured in
culture incubated with 55.5 µL of water (0 mM acetic acid treatment).
Annexin V-FITC staining
Phosphatidylserine exposure was evaluated using the ApoAlert Annexin V-FITC
Apoptosis Kit (Clontech Laboratories). Cells were harvested and washed with 35
mM phosphate buffer pH 6.8 containing 0.5 mM MgCl2 and 1.2 M sorbitol. Cell
walls were digested with 0.2 mg/mL zymolyase T100 (MP Biomedicals) in the
above mentioned buffer for 20 minutes at 37°C. Protoplasts were then washed
twice with binding buffer supplemented with sorbitol (10 mM Hepes/NaOH pH
7.4, 140 mM NaCl, 2.5 mM CaCl2, 1.2 M sorbitol). 4 µL of annexin V-FITC (20
µg/ml) was added to 40 µl of cell suspension (1x10⁷ cells) and incubated for 20
minutes at room temperature. Cells were then washed once and resuspendend in 1
mL of binding/sorbitol buffer containing 0.1% BSA (Sigma) and analyzed by flow
cytometry. The measurement of fluorescence intensity was performed on a
Cytomics FC 500 flow cytometer (Beckman Coulter) equipped with an argon laser
74
(excitation wavelength 488 nm, laser power 20 mW). The fluorescence emission
was measured trough a 525 band pass filter (FL1 parameter). A total of 30000 cells
were measured for each sample. Data analysis was performed afterwards with
Cyflogic software.
Metabolites determination
At indicated time-points, 1 ml was sampled from cell culture and centrifuged at
14000 rpm for 15 min; the supernatant was collected and stored at -20 °C until
analysis. The amount of extracellular glucose, ethanol and acetic acid were
determined by HPLC based method using H2SO4 5 mM as mobile phase and
Aminex HPX-87P column, 300 × 7.8 mm with a polystyrene divinylbenzene-based
matrix (BioRad). The analyses were performed at 35°C.
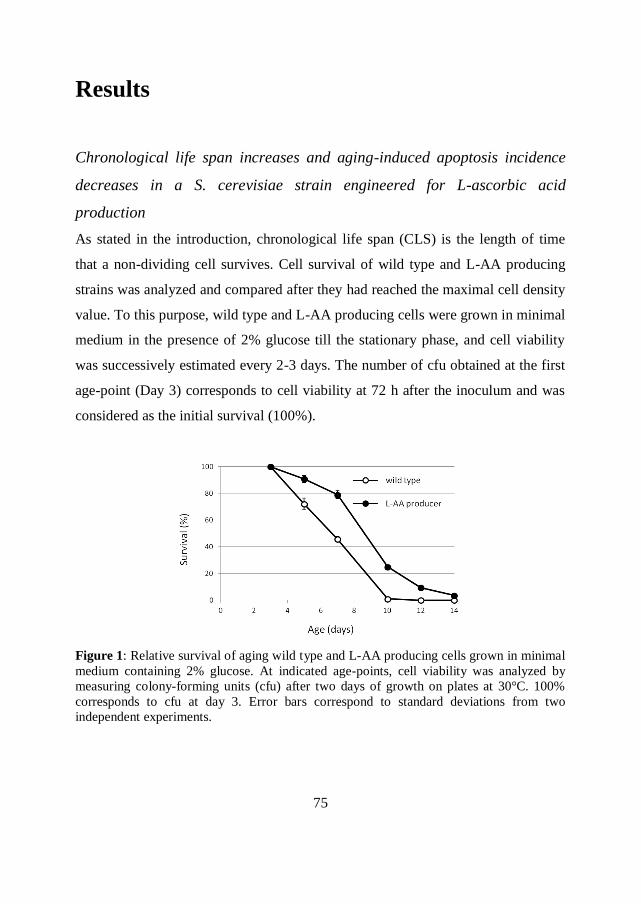
75
Results
Chronological life span increases and aging-induced apoptosis incidence
decreases in a S. cerevisiae strain engineered for L-ascorbic acid
production
As stated in the introduction, chronological life span (CLS) is the length of time
that a non-dividing cell survives. Cell survival of wild type and L-AA producing
strains was analyzed and compared after they had reached the maximal cell density
value. To this purpose, wild type and L-AA producing cells were grown in minimal
medium in the presence of 2% glucose till the stationary phase, and cell viability
was successively estimated every 2-3 days. The number of cfu obtained at the first
age-point (Day 3) corresponds to cell viability at 72 h after the inoculum and was
considered as the initial survival (100%).
Figure 1: Relative survival of aging wild type and L-AA producing cells grown in minimal
medium containing 2% glucose. At indicated age-points, cell viability was analyzed by
measuring colony-forming units (cfu) after two days of growth on plates at 30°C. 100%
corresponds to cfu at day 3. Error bars correspond to standard deviations from two
independent experiments.
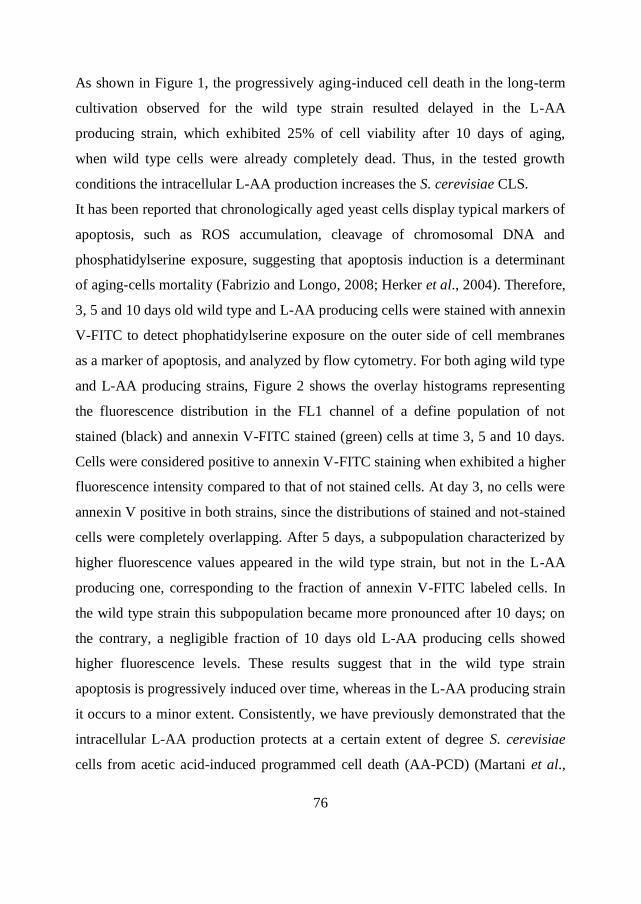
76
As shown in Figure 1, the progressively aging-induced cell death in the long-term
cultivation observed for the wild type strain resulted delayed in the L-AA
producing strain, which exhibited 25% of cell viability after 10 days of aging,
when wild type cells were already completely dead. Thus, in the tested growth
conditions the intracellular L-AA production increases the S. cerevisiae CLS.
It has been reported that chronologically aged yeast cells display typical markers of
apoptosis, such as ROS accumulation, cleavage of chromosomal DNA and
phosphatidylserine exposure, suggesting that apoptosis induction is a determinant
of aging-cells mortality (Fabrizio and Longo, 2008; Herker et al., 2004). Therefore,
3, 5 and 10 days old wild type and L-AA producing cells were stained with annexin
V-FITC to detect phophatidylserine exposure on the outer side of cell membranes
as a marker of apoptosis, and analyzed by flow cytometry. For both aging wild type
and L-AA producing strains, Figure 2 shows the overlay histograms representing
the fluorescence distribution in the FL1 channel of a define population of not
stained (black) and annexin V-FITC stained (green) cells at time 3, 5 and 10 days.
Cells were considered positive to annexin V-FITC staining when exhibited a higher
fluorescence intensity compared to that of not stained cells. At day 3, no cells were
annexin V positive in both strains, since the distributions of stained and not-stained
cells were completely overlapping. After 5 days, a subpopulation characterized by
higher fluorescence values appeared in the wild type strain, but not in the L-AA
producing one, corresponding to the fraction of annexin V-FITC labeled cells. In
the wild type strain this subpopulation became more pronounced after 10 days; on
the contrary, a negligible fraction of 10 days old L-AA producing cells showed
higher fluorescence levels. These results suggest that in the wild type strain
apoptosis is progressively induced over time, whereas in the L-AA producing strain
it occurs to a minor extent. Consistently, we have previously demonstrated that the
intracellular L-AA production protects at a certain extent of degree S. cerevisiae
cells from acetic acid-induced programmed cell death (AA-PCD) (Martani et al.,
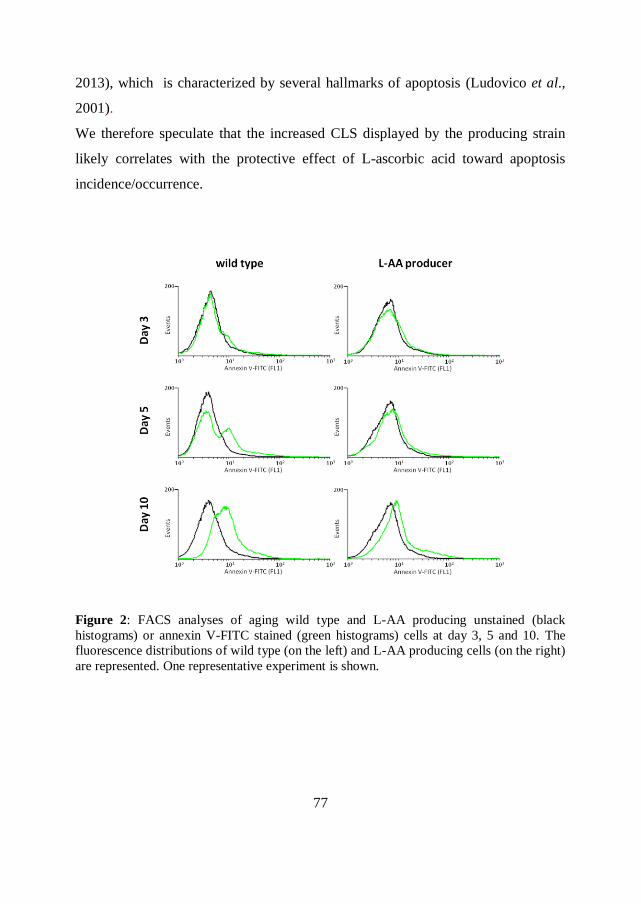
77
2013), which is characterized by several hallmarks of apoptosis (Ludovico et al.,
2001).
We therefore speculate that the increased CLS displayed by the producing strain
likely correlates with the protective effect of L-ascorbic acid toward apoptosis
incidence/occurrence.
Figure 2: FACS analyses of aging wild type and L-AA producing unstained (black
histograms) or annexin V-FITC stained (green histograms) cells at day 3, 5 and 10. The
fluorescence distributions of wild type (on the left) and L-AA producing cells (on the right)
are represented. One representative experiment is shown.
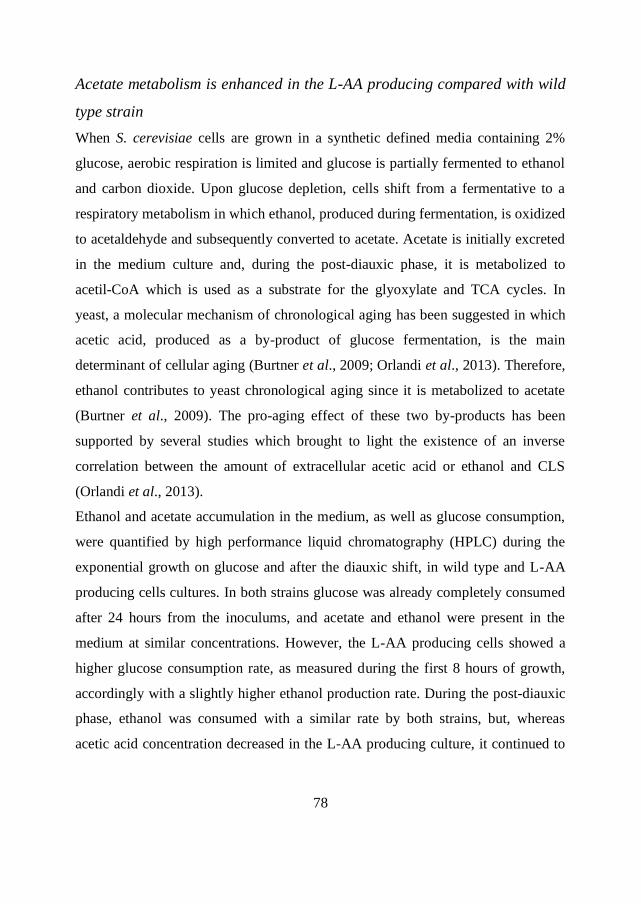
78
Acetate metabolism is enhanced in the L-AA producing compared with wild
type strain
When S. cerevisiae cells are grown in a synthetic defined media containing 2%
glucose, aerobic respiration is limited and glucose is partially fermented to ethanol
and carbon dioxide. Upon glucose depletion, cells shift from a fermentative to a
respiratory metabolism in which ethanol, produced during fermentation, is oxidized
to acetaldehyde and subsequently converted to acetate. Acetate is initially excreted
in the medium culture and, during the post-diauxic phase, it is metabolized to
acetil-CoA which is used as a substrate for the glyoxylate and TCA cycles. In
yeast, a molecular mechanism of chronological aging has been suggested in which
acetic acid, produced as a by-product of glucose fermentation, is the main
determinant of cellular aging (Burtner et al., 2009; Orlandi et al., 2013). Therefore,
ethanol contributes to yeast chronological aging since it is metabolized to acetate
(Burtner et al., 2009). The pro-aging effect of these two by-products has been
supported by several studies which brought to light the existence of an inverse
correlation between the amount of extracellular acetic acid or ethanol and CLS
(Orlandi et al., 2013).
Ethanol and acetate accumulation in the medium, as well as glucose consumption,
were quantified by high performance liquid chromatography (HPLC) during the
exponential growth on glucose and after the diauxic shift, in wild type and L-AA
producing cells cultures. In both strains glucose was already completely consumed
after 24 hours from the inoculums, and acetate and ethanol were present in the
medium at similar concentrations. However, the L-AA producing cells showed a
higher glucose consumption rate, as measured during the first 8 hours of growth,
accordingly with a slightly higher ethanol production rate. During the post-diauxic
phase, ethanol was consumed with a similar rate by both strains, but, whereas
acetic acid concentration decreased in the L-AA producing culture, it continued to
79
increase in the wild type one, reaching, after 72 hours, an accumulation 6-fold
higher than in the engineered strain culture. These results demonstrate that acetate
metabolism is different between wild type and the L-AA producing cells and that
the enhanced acetate consumption showed by the L-AA producing strain leads to a
reduced cell exposure to this toxic compound.
Figure 3: Determination of glucose, ethanol and acetic acid concentration (g/L) in the
culture medium of wild type (open symbols) and L-AA producing (closed symbols) strains
during the first 72 h after the inoculum. Cells were inoculated at the initial optical density
of 0.25 (660 nm) in minimal medium containing 2% glucose and grown at 30 °C and 160
rpm. Extracellular glucose, ethanol and acetic acid concentrations were determined at the
indicated time-points by HPLC analysis. Errors bars correspond to standard deviations from
two independent experiments.
Aged L-AA producing cells show an improved acetic acid tolerance
compared to wild type cells
The intracellular production of L-ascorbic acid has been previously demonstrated
to increase acetic acid tolerance of exponentially growing S. cerevisiae cells
(Martani et al., 2013). The extended CLS observed in the yeast strain engineered to
produce this antioxidant may therefore also correlate with its intrinsic resistance to
acetic acid. To test this possibility, 5-days old wild type and L-AA producing cells
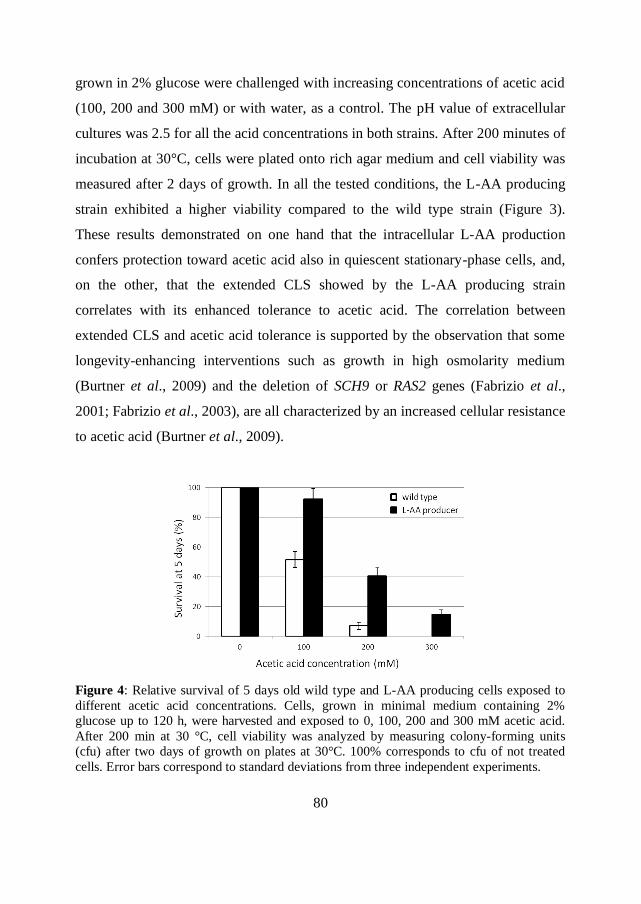
80
grown in 2% glucose were challenged with increasing concentrations of acetic acid
(100, 200 and 300 mM) or with water, as a control. The pH value of extracellular
cultures was 2.5 for all the acid concentrations in both strains. After 200 minutes of
incubation at 30°C, cells were plated onto rich agar medium and cell viability was
measured after 2 days of growth. In all the tested conditions, the L-AA producing
strain exhibited a higher viability compared to the wild type strain (Figure 3).
These results demonstrated on one hand that the intracellular L-AA production
confers protection toward acetic acid also in quiescent stationary-phase cells, and,
on the other, that the extended CLS showed by the L-AA producing strain
correlates with its enhanced tolerance to acetic acid. The correlation between
extended CLS and acetic acid tolerance is supported by the observation that some
longevity-enhancing interventions such as growth in high osmolarity medium
(Burtner et al., 2009) and the deletion of SCH9 or RAS2 genes (Fabrizio et al.,
2001; Fabrizio et al., 2003), are all characterized by an increased cellular resistance
to acetic acid (Burtner et al., 2009).
Figure 4: Relative survival of 5 days old wild type and L-AA producing cells exposed to
different acetic acid concentrations. Cells, grown in minimal medium containing 2%
glucose up to 120 h, were harvested and exposed to 0, 100, 200 and 300 mM acetic acid.
After 200 min at 30 °C, cell viability was analyzed by measuring colony-forming units
(cfu) after two days of growth on plates at 30°C. 100% corresponds to cfu of not treated
cells. Error bars correspond to standard deviations from three independent experiments.
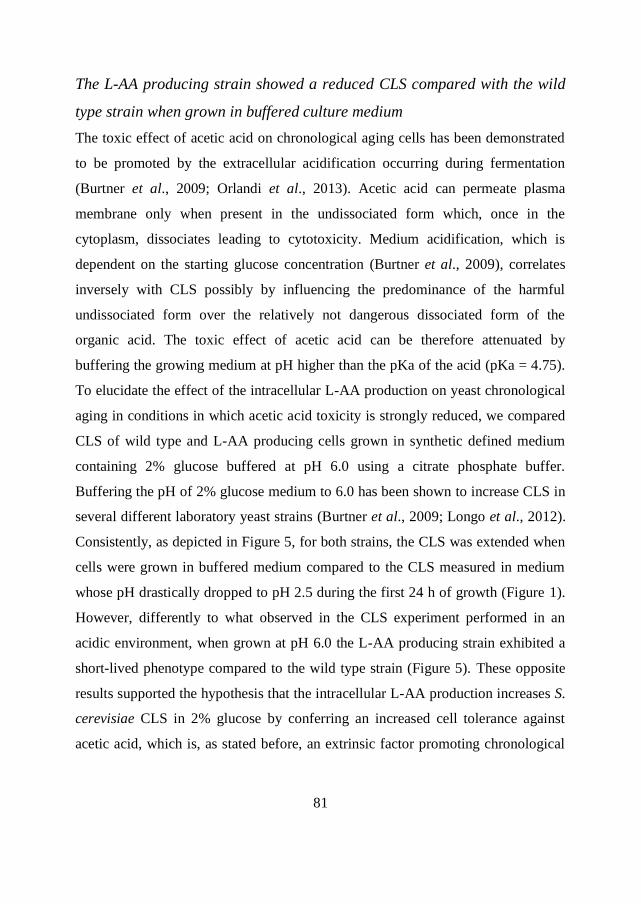
81
The L-AA producing strain showed a reduced CLS compared with the wild
type strain when grown in buffered culture medium
The toxic effect of acetic acid on chronological aging cells has been demonstrated
to be promoted by the extracellular acidification occurring during fermentation
(Burtner et al., 2009; Orlandi et al., 2013). Acetic acid can permeate plasma
membrane only when present in the undissociated form which, once in the
cytoplasm, dissociates leading to cytotoxicity. Medium acidification, which is
dependent on the starting glucose concentration (Burtner et al., 2009), correlates
inversely with CLS possibly by influencing the predominance of the harmful
undissociated form over the relatively not dangerous dissociated form of the
organic acid. The toxic effect of acetic acid can be therefore attenuated by
buffering the growing medium at pH higher than the pKa of the acid (pKa = 4.75).
To elucidate the effect of the intracellular L-AA production on yeast chronological
aging in conditions in which acetic acid toxicity is strongly reduced, we compared
CLS of wild type and L-AA producing cells grown in synthetic defined medium
containing 2% glucose buffered at pH 6.0 using a citrate phosphate buffer.
Buffering the pH of 2% glucose medium to 6.0 has been shown to increase CLS in
several different laboratory yeast strains (Burtner et al., 2009; Longo et al., 2012).
Consistently, as depicted in Figure 5, for both strains, the CLS was extended when
cells were grown in buffered medium compared to the CLS measured in medium
whose pH drastically dropped to pH 2.5 during the first 24 h of growth (Figure 1).
However, differently to what observed in the CLS experiment performed in an
acidic environment, when grown at pH 6.0 the L-AA producing strain exhibited a
short-lived phenotype compared to the wild type strain (Figure 5). These opposite
results supported the hypothesis that the intracellular L-AA production increases S.
cerevisiae CLS in 2% glucose by conferring an increased cell tolerance against
acetic acid, which is, as stated before, an extrinsic factor promoting chronological
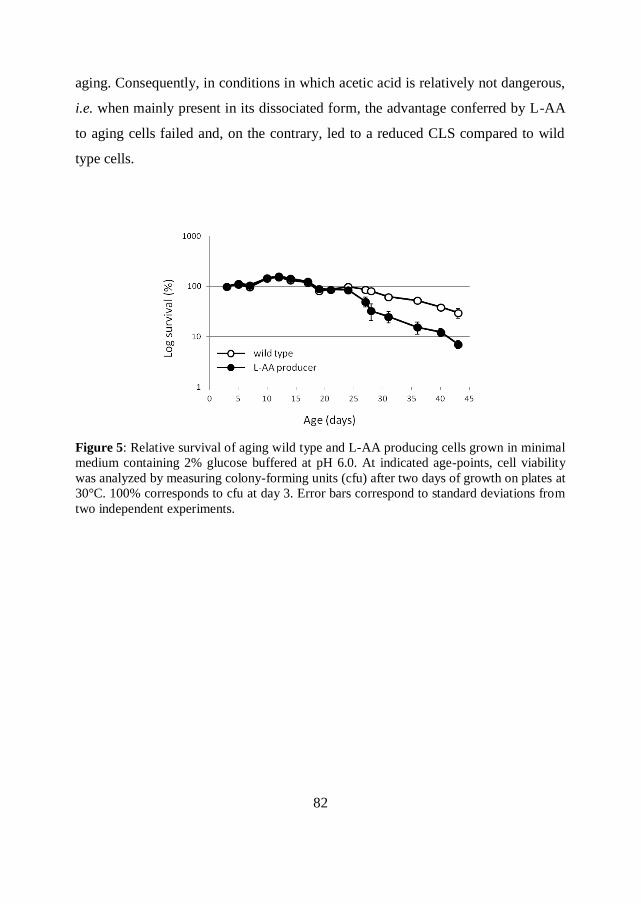
82
aging. Consequently, in conditions in which acetic acid is relatively not dangerous,
i.e. when mainly present in its dissociated form, the advantage conferred by L-AA
to aging cells failed and, on the contrary, led to a reduced CLS compared to wild
type cells.
Figure 5: Relative survival of aging wild type and L-AA producing cells grown in minimal
medium containing 2% glucose buffered at pH 6.0. At indicated age-points, cell viability
was analyzed by measuring colony-forming units (cfu) after two days of growth on plates at
30°C. 100% corresponds to cfu at day 3. Error bars correspond to standard deviations from
two independent experiments.
83
Discussion
The here presented results demonstrate that the growth conditions used to
determine S. cerevisiae CLS strongly influence the effect of Vitamin C on yeast
longevity. In fact, the intracellular L-AA production increased or decreased S.
cerevisiae CLS, respect to wild type strain, when cells were grown in an acidic or
near-basic environment, respectively. An explanation of these conflicting results
can be deduced by taking into account the molecular mechanism of yeast
chronological aging, in which acetic acid has been suggested to be the main aging
promoting factor and ROS play an important role (Burtner et al., 2009; Pan, 2011).
The acidification of the culture medium, as the result of the accumulation of
organic acids during fermentative metabolism, correlates inversely with CLS by
likely enhancing cellular acetic acid uptake, and consequently its toxicity (Burtner
et al., 2009). It is therefore reasonable to suppose that under normal growth
conditions, in which extracellular acidification occurs, the intracellular L-AA
production extended CLS by increasing yeast cells resistance to acetic acid. In fact,
aging cells engineered to produce this antioxidant exhibited a higher tolerance to
this stressing factor when challenged with high acetic acid concentrations (Figure
4). Moreover, phosphatidylserine exposure (as a marker of apoptosis-induced cell
death), occurring in chronologically aged yeast cells, has been shown to be
prevented in the L-AA producing strain by annexin V-FITC staining (Figure 2).
Since it has been speculated that acetic acid may contribute to induce this kind of
death process in aging cells (Burtner et al., 2009), this evidence further supports
the existence of a correlation between increased CLS and acetic acid resistance
exhibited by the L-AA producing strain. Additionally, we cannot exclude that the
enhanced acetate utilization of the L-AA producing strain can determine an
extended lifespan by reducing the extracellular amount of acetic acid and
84
consequently cell exposure to this toxic compound. The short and long-lived
phenotypes that have been associated to yeast mutants characterized by an
impaired or improved acetate metabolism, respectively, strongly support this
hypothesis (Casatta et al., 2013; Orlandi et al., 2012).
On the contrary, when the culture medium was buffered at pH 6.0, and
consequently acetic acid uptake was reduced, a detrimental effect of L-AA
production on CLS was observed (Figure 5). Recently, it has been demonstrated
that H2O2 promotes longevity in S. cerevisiae under caloric restriction or as
consequence of catalase inactivation by activating stress response mechanisms,
such a superoxide dismutases activity, which protect cells against oxidative stress
occurring in aging cells (Mesquita et al., 2010). These findings agree with the
hormetic effects of ROS, described as beneficial or detrimental depending on the
amount they are produced (Ristow and Schmeisser, 2011). In fact, it has been
assumed that ROS, produced by mitochondria during respiratory metabolism,
represent in yeast, as well as in other eukaryotic organisms, signaling molecules
involved in the regulation of several physiological processes, including the
triggering of antioxidant defences enzymes, essential for longevity (Linnane et al.,
2007; Mesquita et al., 2010; Schulz et al., 2007). Vitamin C, by scavenging free
radicals, could therefore interfere with this mechanism and consequently affect
longevity. Accordingly, several prospective clinical intervention studies did not
find a positive correlation between antioxidants supplementation and health-
beneficial effects (Ristow and Schmeisser, 2011). We have previously shown that
the intracellular L-AA production induces a lower ROS accumulation in response
to H2O2 or acetic acid induced stress, suggesting a protective role of L-AA against
ROS-induced oxidative stress (Branduardi et al., 2007; Martani et al., 2013).
Moreover, the reduced ROS production was accompanied with a negligible
superoxide dismutase activation, corroborating the hypothesis that L-AA
negatively affects the activation of cellular antioxidant defences (Martani et al.,
85
2013). We therefore argument that in conditions in which yeast CLS is not affected
by acetic acid and low extracellular pH, the endogenous L-AA production may
reduce the activation of the antioxidant defences and, as a consequent, cell survival
in stationary phase.
86
Conclusions
We have demonstrated that, under standard conditions, the intracellular production
of Vitamin C can extend CLS in S. cerevisiae. Burtner and co-workers proposed
that acetic acid is the main cause of chronological aging in yeast and suggest that
CLS can be extended by either increasing cellular resistance to acetic acid or by
reducing the amount of acetic acid produced via a shift toward respiratory
metabolism (Burtner et al., 2009). In this study, we showed that the extended CLS
of the L-AA producing strain is likely the result of the synergic effect of i) higher
resistance to acetic acid and ii) enhanced acetate consumption that leads to acetic
acid removal from the culture medium. Therefore, although the role of acetic acid
in CLS is controversial (Longo et al., 2012), our results further supports the
hypothesis that acetic acid, which accumulates in the culture medium as a by-
product of fermentative metabolism, is at least in part responsible for chronological
aging in yeast. Moreover, the different results obtained when cells were aging in an
acidic or pH 6.0 buffered medium, demonstrate the importance of the experimental
conditions used to assess the effect of Vitamin C, or even other antioxidants, on
yeast chronological lifespan.
The increased CLS showed by the L-AA producing strain under growth conditions
in which the pH values drop to low levels suggest a possible its utilization as a cell
factory, in particular for industrial fermentations carry out mostly by non-dividing
cells and/or at very low pH to keep bacterial contaminations restrained. This
conclusion is further supported by the demonstration that the production profile of
metabolites of industrial relevance is influenced by genetic manipulation that
modulate yeast life span during its biotechnological use (Orozco et al., 2013).
87
References
Bahadorani S, Bahadorani P, Phillips JP, Hilliker AJ. 2008. The effects of vitamin
supplementation on Drosophila life span under normoxia and under oxidative
stress. J Gerontol A Biol Sci Med Sci 63: 35-42.
Brambilla L, Bolzani D, Compagno C, Carrera V, van Dijken JP, Pronk JT, Ranzi
BM, Alberghina L, Porro D. 1999. NADH reoxidation does not control
glycolytic flux during exposure of respiring Saccharomyces cerevisiae
cultures to glucose excess. FEMS Microbiol Lett 171: 133-40.
Branduardi P, Fossati T, Sauer M, Pagani R, Mattanovich D, Porro D. 2007.
Biosynthesis of vitamin C by yeast leads to increased stress resistance. PLoS
One 2: e1092.
Buettner GR, Jurkiewicz BA. 1996. Catalytic metals, ascorbate and free radicals:
combinations to avoid. Radiat Res 145: 532-41.
Burtner CR, Murakami CJ, Kennedy BK, Kaeberlein M. 2009. A molecular
mechanism of chronological aging in yeast. Cell Cycle 8: 1256-70.
Casatta N, Porro A, Orlandi I, Brambilla L, Vai M. 2013. Lack of Sir2 increases
acetate consumption and decreases extracellular pro-aging factors. Biochim
Biophys Acta 1833: 593-601.
Clément MV, Ramalingam J, Long LH, Halliwell B. 2001. The in vitro
cytotoxicity of ascorbate depends on the culture medium used to perform the
assay and involves hydrogen peroxide. Antioxid Redox Signal 3: 157-63.
Fabrizio P, Liou LL, Moy VN, Diaspro A, Valentine JS, Gralla EB, Longo VD.
2003. SOD2 functions downstream of Sch9 to extend longevity in yeast.
Genetics 163: 35-46.
Fabrizio P, Longo VD. 2003. The chronological life span of Saccharomyces
cerevisiae. Aging Cell 2: 73-81.
Fabrizio P, Longo VD. 2007. The chronological life span of Saccharomyces
cerevisiae. Methods Mol Biol 371: 89-95.
Fabrizio, P. and Longo, V. D. (2008). Chronological aging-induced apoptosis in
yeast. Biochim Biophys Acta 1783, 1280-5.
Fabrizio P, Pozza F, Pletcher SD, Gendron CM, Longo VD. 2001. Regulation of
longevity and stress resistance by Sch9 in yeast. Science 292: 288-90.
Fossati T, Solinas N, Porro D, Branduardi P. 2011. L-ascorbic acid producing
yeasts learn from plants how to recycle it. Metab Eng 13: 177-85.
Golden TR, Hinerfeld DA, Melov S. 2002. Oxidative stress and aging: beyond
correlation. Aging Cell 1: 117-23.
Halliwell B. 1996. Vitamin C: antioxidant or pro-oxidant in vivo? Free Radic Res
25: 439-54.
88
Herker E, Jungwirth H, Lehmann KA, Maldener C, Fröhlich KU, Wissing S,
Büttner S, Fehr M, Sigrist S, Madeo F. 2004. Chronological aging leads to
apoptosis in yeast. J Cell Biol 164: 501-7.
Krzepiłko A, Swieciło A, Wawryn J, Zadrag R, Kozioł S, Bartosz G, Biliński T.
2004. Ascorbate restores lifespan of superoxide-dismutase deficient yeast.
Free Radic Res 38: 1019-24.
Linnane AW, Kios M, Vitetta L. 2007. Healthy aging: regulation of the
metabolome by cellular redox modulation and prooxidant signaling systems:
the essential roles of superoxide anion and hydrogen peroxide. Biogerontology
8: 445-67.
Longo VD, Gralla EB, Valentine JS. 1996. Superoxide dismutase activity is
essential for stationary phase survival in Saccharomyces cerevisiae.
Mitochondrial production of toxic oxygen species in vivo. J Biol Chem 271:
12275-80.
Longo VD, Shadel GS, Kaeberlein M, Kennedy B. 2012. Replicative and
chronological aging in Saccharomyces cerevisiae. Cell Metab 16: 18-31.
Ludovico P, Sousa MJ, Silva MT, Leão C, Côrte-Real M. 2001. Saccharomyces
cerevisiae commits to a programmed cell death process in response to acetic
acid. Microbiology 147: 2409-15.
Martani F, Fossati T, Posteri R, Signori L, Porro D, Branduardi P. 2013. Different
response to acetic acid stress in Saccharomyces cerevisiae wild-type and L-
ascorbic acid-producing strains. Yeast 30, 365-78.
Massie HR, Aiello VR, Doherty TJ. 1984. Dietary vitamin C improves the survival
of mice. Gerontology 30: 371-5.
Massie HR, Baird MB, Piekielniak MJ. 1976. Ascorbic acid and longevity in
Drosophila. Exp Gerontol 11, 37-41.
Mesquita A, Weinberger M, Silva A, Sampaio-Marques B, Almeida B, Leão C,
Costa V, Rodrigues F, Burhans WC, Ludovico P. 2010. Caloric restriction or
catalase inactivation extends yeast chronological lifespan by inducing H2O2
and superoxide dismutase activity. Proc Natl Acad Sci U S A 107: 15123-8.
Orlandi I, Casatta N, Vai M. 2012. Lack of Ach1 CoA-Transferase Triggers
Apoptosis and Decreases Chronological Lifespan in Yeast. Front Oncol 2: 67.
Orlandi I, Ronzulli R, Casatta N, Vai M. 2013. Ethanol and acetate acting as
carbon/energy sources negatively affect yeast chronological aging. Oxid Med
Cell Longev 2013: 802870.
Orozco H, Matallana E, Aranda A. 2013. Genetic manipulation of longevity-related
genes as a tool to regulate yeast life span and metabolite production during
winemaking. Microb Cell Fact 12: 1.
Pallauf K, Bendall JK, Scheiermann C, Watschinger K, Hoffmann J, Roeder T,
Rimbach G. 2013. Vitamin C and lifespan in model organisms. Food Chem
Toxicol 58: 255-63.
89
Pan Y. 2011. Mitochondria, reactive oxygen species, and chronological aging: a
message from yeast. Exp Gerontol 46: 847-52.
Podmore ID, Griffiths HR, Herbert KE, Mistry N, Mistry P, Lunec J. 1998.
Vitamin C exhibits pro-oxidant properties. Nature 392: 559.
Ristow M, Schmeisser S. 2011. Extending life span by increasing oxidative stress.
Free Radic Biol Med 51: 327-36.
Schulz TJ, Zarse K, Voigt A, Urban N, Birringer M, Ristow M. 2007. Glucose
restriction extends Caenorhabditis elegans life span by inducing
mitochondrial respiration and increasing oxidative stress. Cell Metab 6: 280-
93.
Selman C, McLaren JS, Meyer C, Duncan JS, Redman P, Collins AR, Duthie GG,
Speakman JR. 2006. Life-long vitamin C supplementation in combination
with cold exposure does not affect oxidative damage or lifespan in mice, but
decreases expression of antioxidant protection genes. Mech Ageing Dev 127:
897-904.
Sohal RS, Allen RG, Farmer KJ, Newton RK, Toy PL. 1985. Effects of exogenous
antioxidants on the levels of endogenous antioxidants, lipid-soluble
fluorescent material and life span in the housefly, Musca domestica. Mech
Ageing Dev 31: 329-36.
Tappel A, Fletcher B, Deamer D. 1973. Effect of antioxidants and nutrients on
lipid peroxidation fluorescent products and aging parameters in the mouse. J
Gerontol 28: 415-24.
Traber MG, Stevens JF. 2011. Vitamins C and E: beneficial effects from a
mechanistic perspective. Free Radic Biol Med 51: 1000-13.

90
91
Chapter 3
mRNA metabolism
engineering to improve
Saccharomyces cerevisiae
stress tolerance
Manuscript in preparation for Metabolic Engineering

92
93
Introduction
The yeast Saccharomyces cerevisiae is widely employed for the production of
several industrial products, such as fine and bulk chemicals, pharmaceutics, and
biofuels (Hong and Nielsen, 2012). In particular, this microorganism is extensively
used for the production of ethanol due to its high ethanol yield and productivity and
robustness (Wallace-Salinas and Gorwa-Grauslund, 2013). Nowadays, bioethanol
is mainly produced by S. cerevisiae from sugars deriving from sugar cane and
starch, but the increasing demand for bio-based products has pushed toward the
utilization of lignocellulosic biomasses for second generation ethanol production.
One of the major obstacles for the development of large-scale ethanol production
from lignocellulosic feedstock is the toxic effect of compounds such as weak acids,
furan derivatives and phenolic compounds, released during biomasses pre-
treatment (Palmqvist and Hahn-Hägerdal, 2000). These inhibitors impair strain
performance and, consequently, reduce the ethanol yield and productivity of the
fermentative process (Almeida et al., 2007). Moreover, during industrial
fermentations, yeasts meet multiple stresses associated with the operative
parameters of the process that, together with the final product toxicity, can
contribute to the reduction of cell metabolism and growth. The evolution of robust
cell factories is therefore desirable to attain a higher production/productivity.
Several approaches have been applied to improve S. cerevisiae robustness and so to
minimize the effect of both the stressful conditions imposed by industrial
fermentations and the toxic products generated in second generation processes.
Strains with increased stress tolerance have been obtained mainly by genetic
engineering through the deletion or over-expression of single genes (for some
recent examples see Hong et al., 2010; Lewis et al., 2010; Zhang et al., 2011;
Avrahami-Moyal et al., 2012). However, the evolution of a robust phenotype is
94
hardly obtained through the alteration of a molecular element with finite action
since the cellular stress response is a complex trait resulting from coordinated
changes at molecular and cellular level. Ideally, a simultaneous multiple gene
modification might evoke a cellular reprogramming aimed at unlocking a complex
phenotype, which is likely unreachable by sequential multigene modifications
(Alper et al., 2006; Alper and Stephanopoulos, 2007). In the last years, the
engineering of complex phenotypes have been reached by using novel genome
wide engineering approaches such as whole genome shuffling (WGS), evolutionary
engineering and global transcription machinery engineering (gTME), that enable
the simultaneous modulation and manipulation of multiple phenotype conferring
loci’s (Patnaik, 2008). Whereas WGS and evolutionary engineering mainly follow
the nature's ‘engineering’ principle of variation and selection (Gong et al., 2009),
gTME allows to elicit cellular phenotypes relevant for industrial applications from
the remodeling of whole gene expression obtained through the alteration of a
protein involved in the control of global gene transcription (Alper et al., 2006;
Alper and Stephanopoulos, 2007; Lanza and Alper, 2011). In addition to gene
transcription regulation, post-transcriptional events, including the processing,
export, localization, turnover and translation of mRNAs, play an important role in
the control of gene expression, and, consequently, influence the proteome
composition (Keene and Lager, 2005; Mata et al., 2005). In response to stressful
conditions, the regulation of mRNA stability is, for instance, an important factor
involved in the determination of gene expression, which allows, together with
transcriptional regulation, cells to rapidly change their level of transcripts (Fan et
al., 2002; Talarek et al., 2013). Alterations in mRNA metabolism, as well as in
gene transcription, can therefore potentially reorganize gene expression leading to
the desired phenotype.
mRNA metabolism is controlled by RNA-binding proteins (RBPs) which establish
the fate of transcripts by binding to specific RNA-sequence elements (Mata et al.,
95
2005; Glisovic et al., 2008). In S. cerevisiae, Pab1 is the major poly(A) binding
protein which regulates mRNA metabolism trough its binding to the mRNAs
poly(A) tails and interaction with several proteins whose activity is relevant in
different aspects of the post-transcriptional control (Sachs et al., 1986; Caponigro
and Parker, 1996; Richardson et al., 2012)
In this work, S. cerevisiae strains with improved stress tolerance were obtained by
altering mRNA metabolism through the modulation of Pab1 abundance and/or
function. To this purpose, i) parental strain were transformed with a centromeric
plasmid harboring an additional copy of Pab1 promoter and coding sequence gene
and ii) a library of the same plasmid but containing randomly mutagenized copies
of Pab1 promoter and coding sequence was screened to select dominant mutations
leading to increased S. cerevisiae robustness toward acetic acid, one of the most
toxic compound resulting from the hydrolysis of lignocelluloses.
96
Matherials and methods
Yeast strains, media, growth conditions
The S. cerevisiae genetic backgrounds used in this study were BY4741 (MATa;
his3Δ0; leu2Δ0; met15Δ0; ura3Δ0) (Brachmann et al., 1998), CEN.PK113-5D
(MATa; MAL2-8c; SUC2; ura3-52) and CEN.PK113-11C (MATa; MAL2-8c;
SUC2; ura3-52; his3Δ1) (Entian and Kötter, 1998). Yeast transformations were
performed according to the LiAc/PEG/ss-DNA protocol (Gietz and Woods, 2002).
The S. cerevisiae strains constructed in this study are listed in Table 1, with their
respective genotypes.
To delete the EDC3 gene, the edc3::hphMX4 cassette was amplified from the
plasmid pAG26 (Goldstein and McCusker, 1999), using the oligonucleotides 5’-
ATG TCA CAA TTT GTT GGT TTC GGA GTA CAA GTG GAG CTA AAA
GAT CGC CAG ATC TGT TTA GCT TG-3’ and 5’-TTA CAA ATC TAA TAG
CAG GGA CCC GTC AGT GAC GAA AAG ATC ACA GAG CTC GTT TTC
GAC ACT GG-3’. The edc3::hphMX4 cassette was used to replace EDC3 gene in
CEN.PK113-11C strain. Transformed clones were selected on YPD agar plates
supplemented with the antibiotic hygromycin B (Roche) to the final concentration
of 2 mg/ml. Gene disruption was confirmed by PCR analysis.
The chromosomally integrated GFP-tagged version of Pab1 was created using the
cassette PAB1-GFP::His3MX6 amplified from the plasmid pFA6a-GFP(S65T)-
His3MX6 (Longtine et al., 1998), using the oligonucleotides 5’-AGT CTT TCA
AAA AGG AGC AAG AAC AAC AAA CTG AGC AAG CTC GGA TCC CCG
GGT TAA TTA A-3’ and 5’-GTT TGT TGA GTA GGG AAG TAG GTG ATT
ACA TAG AGC ATT AGA ATT CGA GCT CGT TTA AAC TGG-3’. The PCR-
amplified fragment was used directly for yeast transformation.
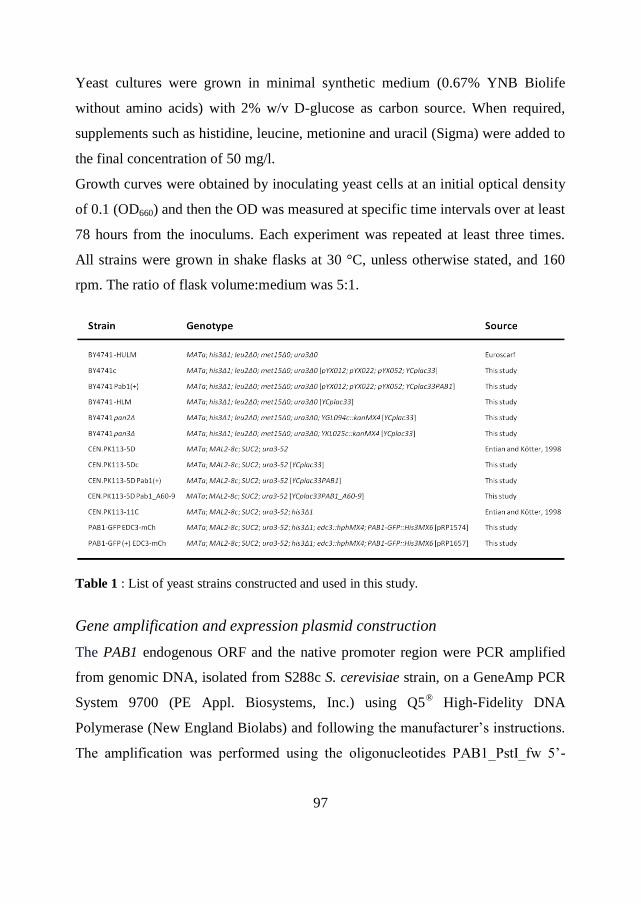
97
Yeast cultures were grown in minimal synthetic medium (0.67% YNB Biolife
without amino acids) with 2% w/v D-glucose as carbon source. When required,
supplements such as histidine, leucine, metionine and uracil (Sigma) were added to
the final concentration of 50 mg/l.
Growth curves were obtained by inoculating yeast cells at an initial optical density
of 0.1 (OD660) and then the OD was measured at specific time intervals over at least
78 hours from the inoculums. Each experiment was repeated at least three times.
All strains were grown in shake flasks at 30 °C, unless otherwise stated, and 160
rpm. The ratio of flask volume:medium was 5:1.
Table 1 : List of yeast strains constructed and used in this study.
Gene amplification and expression plasmid construction
The PAB1 endogenous ORF and the native promoter region were PCR amplified
from genomic DNA, isolated from S288c S. cerevisiae strain, on a GeneAmp PCR
System 9700 (PE Appl. Biosystems, Inc.) using Q5® High-Fidelity DNA
Polymerase (New England Biolabs) and following the manufacturer’s instructions.
The amplification was performed using the oligonucleotides PAB1_PstI_fw 5’-
98
GAT TTA CTG CAG GTA TAT ATA TTT GCG TGT AAG TGT GTG T-3’ and
PAB1_SalI_rev 5’-ATT ATA GTC GAC TAG AGC ATT AAG CTT GCT CAG
TTT GT-3’. The PCR product was PstI and SalI cut and sub-cloned in the low
copy number expression vector pYF8 digested with the same restriction enzymes
to excide the TPI promoter. To create the plasmid pYF8, the DNA sequence
corresponding to the TPI promoter-multi cloning site-poly(A) terminator was
amplified from the integrative plasmid pYX042(-ATG), previously obtained from
the pYX042 integrative expression vector (R&D Systems) (EcoRI and BamHI cut,
blunt-ended and re-legated), using the oligonucleotides TPIp_PstI_fw 5’-GAT
TTA CTG CAG CCT GAC GTC TAA GAA ACC ATT A-3’ and
MCS_EcoRI_rev 5’-CTT AGA GAA TTC TCT TCG CTA TTA CGC CAG CT-
3’. The PCR-product was cut with PstI and EcoRI and sub-cloned in the plasmid
YCplac33 (centromeric, URA3 auxotrophic marker) (Gietz and Sugino, 1988). All
the restriction enzymes used were from New England Biolabs (Hitchin, Herts,
UK). Standard procedures were employed for all cloning purposes (Sambrook et
al., 1989).
The plasmids pRP1574 (Edc3-mCh, centromeric, URA3 auxotrophic marker) and
pRP1657 (Pab1-GFP, Edc3-mCh; centromeric, URA3 auxotrophic marker) were
kindly provided by Prof. Parker (Buchan et al., 2008).
Mutant library construction
The library was created using the GeneMorph II EZClone Domain Mutagenesis Kit
(Agilent Technologies) following the manufacturer’s instructions. Briefly,
mutations in the PAB1 promoter and coding sequence were introduced trough
error-prone PCR using the Mutazyme II DNA polymerase provided by the kit. The
oligonucleotides used for this amplification were 5’-AAG CTT GCA TGC CTG
CAG GTA TAT A-3’ and 5’-GGG TCG ACT AGA GCA TTA AGC TT-3’. 50,
250 or 750 ng of the plasmid YCplac33PAB1 were used as DNA template in order
99
to produce a low (0-4.5 mutations/kb), medium (4.5-9 mutations/kb) or high (9-16
mutations/kb) mutational frequency, respectively, according to manufacturer’s
instructions. Following purification, the resulting mutated PCR products were used
as “megaprimers” for the EZClone reaction, during which they were denaturated
and annealed to the original donor plasmid and extended with a specialized enzyme
mix containing a high fidelity DNA polymerase. The plasmid library was
transformed into E. coli XL10-Gold ultracompetent cells that were plated onto LB-
ampicillin agar plates (antibiotic concentration of 100 mg/l). The library size was
approximately 6x10³. Plasmid DNA was isolated from E. coli using the alkaline
lysis method (Brinboim and Doly, 1979) and transformed into CEN.PK yeast
background. Yeast cells were scraped off the plates, inoculated in minimal medium
and incubated for about 6 hours at 30 °C at 160 rpm. This liquid culture was used
to create frozen glycerol stocks (80% yeast culture, 20% glycerol) that were
conserved at -80 °C.
Phenotype selection
The yeast glycerol stocks were inoculated in minimal medium and incubated for
about 4-6 hours at 30 °C at 160 rpm. Successively, cell cultures were diluted to the
final OD (660 nm) of 0.001 and 250 μl were plated onto minimal medium agar
plates containing increasing concentrations of acetic acid at pH 3 (20, 50, 60, 70
and 80 mM), in quadruple. Cells were also plated on minimal medium agar plates
in the absence of stress in order to verify that an equal amount of cells transformed
with the control plasmid and the mutant library were plated. For anaerobic growth,
agar plates were placed in anaerobic jars and the air was displaced with nitrogen
gas. Plates were incubated at 30 °C for 3 days and the colony forming units (CFU)
were counted.
100
Fluorescence microscopy analysis
Stress granules and P bodies were analyzed in cells grown in minimal medium till
the exponential phase (OD660 = 0.4-0.6) and exposed at 46 °C for 2 hours. Cell
cultures were then shifted at 30 °C for 20 minutes to rescue them from heat stress.
During the whole experiment, about 108 cells were collected, resuspended in PBS
(NaH2PO4 53 mM, Na2HPO4 613 mM, NaCl 75 mM) and then observed in a Nikon
ECLIPSE 90i fluorescence microscope (Nikon) equipped with a 100X objective.
Emission fluorescence due to Pab1-GFP or Edc3-mCh was detected by B-2A (EX
450-490 DM 505 BA520) or G-2A (DX 510-560 DM 575 BA 590) filter (Nikon),
respectively. Digital images were acquired with a CoolSnap CCD camera
(Photometrics) using MetaMorph 6.3 software (Molecular Devices). The images
were merged using Adobe Photoshop CC.
Protein extraction and western blot analysis
The expression level of Pab1-GFP in control and Pab1(+) strains was detected by
western blot analysis. Exponential growing cells were collected by centrifugation
at 4000 rpm for 10 min, washed once in ice-cold water and resuspended in 25 mM
Tris-HCl pH 8.0 containing 0.5 mM EDTA and protease inhibitors (complete
Protease Inhibitor Cocktail, Roche). Cells were disrupted with glass beads (425-
600 µm, Sigma) in an homogenizer (FastPrep® FP120, MP Biomedicals) by three
cycles of 20 s at speed 6.0. Lysates were collected and centrifuged for 15 min at 4
°C and the obtained supernatants were used as cell-free extracts. Protein
concentration was determined using the Bio-Rad protein assay (Bio-Rad) with
bovine serum albumine as the standard. Equal amounts of total protein (15 µg)
were resolved in a SDS-polyacrylamide gel electrophoresis and successively
transferred on a nitrocellulose membrane. The nitrocellulose was blocked with 5%
milk in TBS+Tween overnight at 4 °C. Pab1-GFP was then detected using an
101
monoclonal anti-GFP antibody (Living Colors A.v JL-8, Diatech labline) diluted
1:1000 in TBS+Tween+5% milk for 2 hours at RT followed, after membrane
washing, by incubation with Rabbit anti-Mouse IgG (FC) secondary antibody, AP
(alkaline phosphatase) conjugate diluted 1:15000 in TBS+Tween+5% milk for 1
hour at RT. The nitrocellulose membrane was incubated with CDP-Star
Chemiluminescent Substrate (Sigma) for 5 min at RT under gentle agitation and
then exposed to Pierce CL-Xposure film to reveal Pab1-GFP signal.
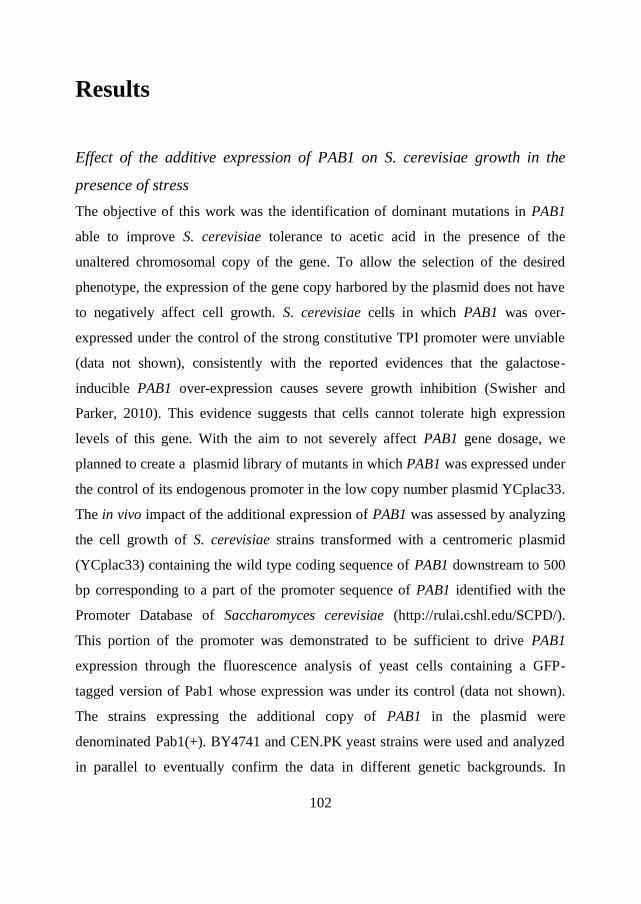
102
Results
Effect of the additive expression of PAB1 on S. cerevisiae growth in the
presence of stress
The objective of this work was the identification of dominant mutations in PAB1
able to improve S. cerevisiae tolerance to acetic acid in the presence of the
unaltered chromosomal copy of the gene. To allow the selection of the desired
phenotype, the expression of the gene copy harbored by the plasmid does not have
to negatively affect cell growth. S. cerevisiae cells in which PAB1 was over-
expressed under the control of the strong constitutive TPI promoter were unviable
(data not shown), consistently with the reported evidences that the galactose-
inducible PAB1 over-expression causes severe growth inhibition (Swisher and
Parker, 2010). This evidence suggests that cells cannot tolerate high expression
levels of this gene. With the aim to not severely affect PAB1 gene dosage, we
planned to create a plasmid library of mutants in which PAB1 was expressed under
the control of its endogenous promoter in the low copy number plasmid YCplac33.
The in vivo impact of the additional expression of PAB1 was assessed by analyzing
the cell growth of S. cerevisiae strains transformed with a centromeric plasmid
(YCplac33) containing the wild type coding sequence of PAB1 downstream to 500
bp corresponding to a part of the promoter sequence of PAB1 identified with the
Promoter Database of Saccharomyces cerevisiae (http://rulai.cshl.edu/SCPD/).
This portion of the promoter was demonstrated to be sufficient to drive PAB1
expression through the fluorescence analysis of yeast cells containing a GFP-
tagged version of Pab1 whose expression was under its control (data not shown).
The strains expressing the additional copy of PAB1 in the plasmid were
denominated Pab1(+). BY4741 and CEN.PK yeast strains were used and analyzed
in parallel to eventually confirm the data in different genetic backgrounds. In
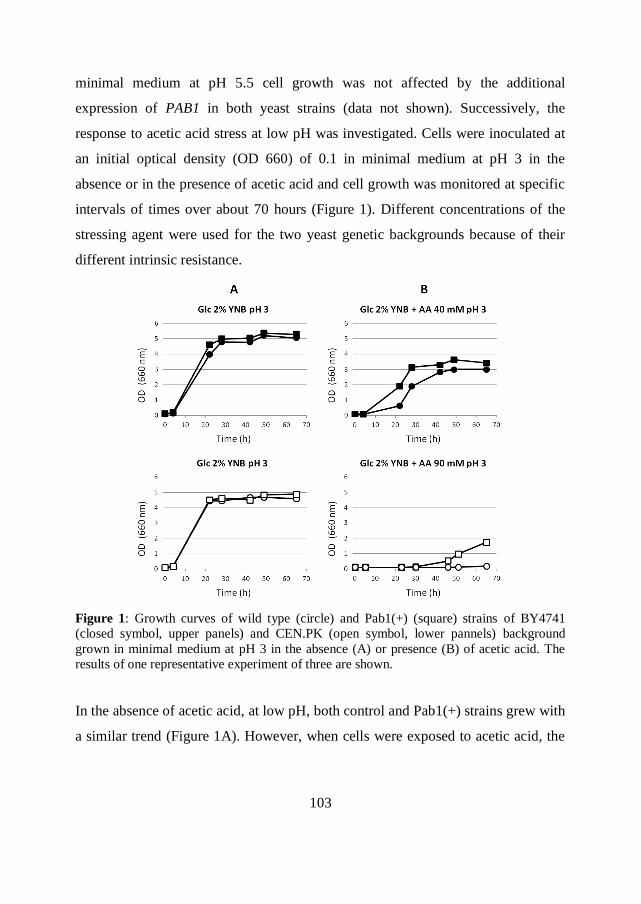
103
minimal medium at pH 5.5 cell growth was not affected by the additional
expression of PAB1 in both yeast strains (data not shown). Successively, the
response to acetic acid stress at low pH was investigated. Cells were inoculated at
an initial optical density (OD 660) of 0.1 in minimal medium at pH 3 in the
absence or in the presence of acetic acid and cell growth was monitored at specific
intervals of times over about 70 hours (Figure 1). Different concentrations of the
stressing agent were used for the two yeast genetic backgrounds because of their
different intrinsic resistance.
Figure 1: Growth curves of wild type (circle) and Pab1(+) (square) strains of BY4741
(closed symbol, upper panels) and CEN.PK (open symbol, lower pannels) background
grown in minimal medium at pH 3 in the absence (A) or presence (B) of acetic acid. The
results of one representative experiment of three are shown.
In the absence of acetic acid, at low pH, both control and Pab1(+) strains grew with
a similar trend (Figure 1A). However, when cells were exposed to acetic acid, the
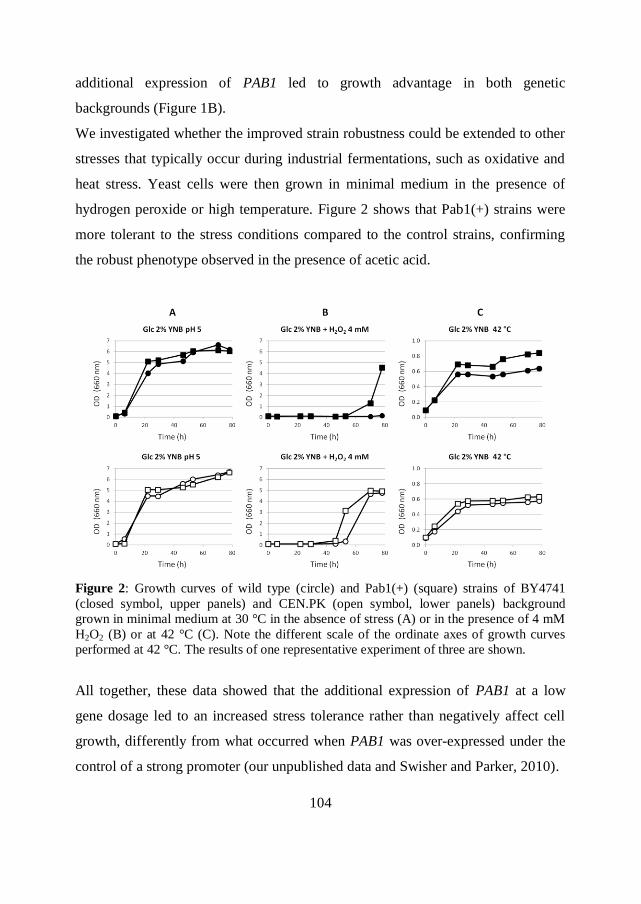
104
additional expression of PAB1 led to growth advantage in both genetic
backgrounds (Figure 1B).
We investigated whether the improved strain robustness could be extended to other
stresses that typically occur during industrial fermentations, such as oxidative and
heat stress. Yeast cells were then grown in minimal medium in the presence of
hydrogen peroxide or high temperature. Figure 2 shows that Pab1(+) strains were
more tolerant to the stress conditions compared to the control strains, confirming
the robust phenotype observed in the presence of acetic acid.
Figure 2: Growth curves of wild type (circle) and Pab1(+) (square) strains of BY4741
(closed symbol, upper panels) and CEN.PK (open symbol, lower panels) background
grown in minimal medium at 30 °C in the absence of stress (A) or in the presence of 4 mM
H2O2 (B) or at 42 °C (C). Note the different scale of the ordinate axes of growth curves
performed at 42 °C. The results of one representative experiment of three are shown.
All together, these data showed that the additional expression of PAB1 at a low
gene dosage led to an increased stress tolerance rather than negatively affect cell
growth, differently from what occurred when PAB1 was over-expressed under the
control of a strong promoter (our unpublished data and Swisher and Parker, 2010).
105
The additional expression of PAB1 alters stress granules and P bodies
formation during heat stress
In eukaryotic cells, when translation initiation is impaired during a stress response,
non-translating mRNAs accumulate in mRNA-protein complexes denominated
stress granules and processing bodies (P bodies) (Hoyle et al., 2007; Buchan and
Parker, 2009). These aggregates differ in composition, and consequently in their
function: P bodies generally contain the mRNA decay machinery and therefore
mRNAs addressed to be degraded, whereas stress granules are mainly composed of
translational initiation factors bound to untranslated mRNAs and are therefore
believed to represent sites of translation reinitiation (Anderson and Kedersha,
2009; Buchan and Parker, 2009). Moreover, P bodies have been demonstrated to
promote stress granules assembly in S. cerevisiae, suggesting the existence of a
mRNA cycle in which mRNPs are exchanged between these cytoplasmic granules
(Buchan et al., 2008).
The protein Pab1 is a specific component of stress granules, and it is therefore
commonly used a stress granule marker (Buchan et al., 2008; Buchan et al., 2011).
Studies on a pab1Δ spb2Δ S. cerevisiae strain, where defects in 60S subunit
biogenesis lead to suppression of the lethal phenotype induced by pab1-deletion
(Sachs and Davis, 1990), demonstrated that Pab1 promotes stress granules
formation, although it is not absolutely required (Swisher and Parker, 2010). On
the other hand, differently from what observed for the over-expression of other
stress granules related factors such as Dhh1 and Pbp1, the growth inhibition caused
by the over-expression of PAB1 via a galactose-inducible promoter was reported
not to be associated with stress granules formation in the absence of stress,
suggesting that the lethality caused by an excess of Pab1 is not due to premature
stress granules or protein aggregation (Swisher and Parker, 2010).
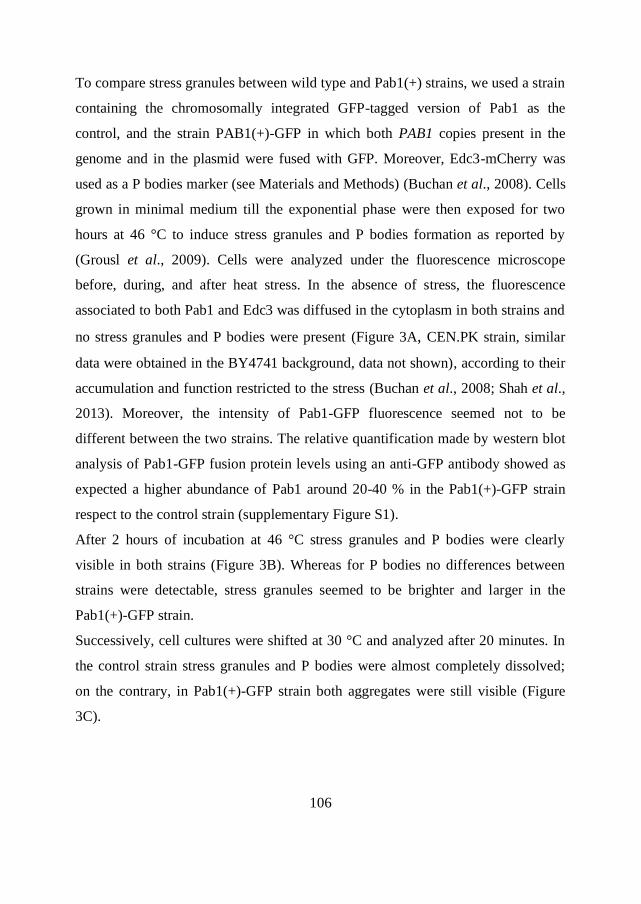
106
To compare stress granules between wild type and Pab1(+) strains, we used a strain
containing the chromosomally integrated GFP-tagged version of Pab1 as the
control, and the strain PAB1(+)-GFP in which both PAB1 copies present in the
genome and in the plasmid were fused with GFP. Moreover, Edc3-mCherry was
used as a P bodies marker (see Materials and Methods) (Buchan et al., 2008). Cells
grown in minimal medium till the exponential phase were then exposed for two
hours at 46 °C to induce stress granules and P bodies formation as reported by
(Grousl et al., 2009). Cells were analyzed under the fluorescence microscope
before, during, and after heat stress. In the absence of stress, the fluorescence
associated to both Pab1 and Edc3 was diffused in the cytoplasm in both strains and
no stress granules and P bodies were present (Figure 3A, CEN.PK strain, similar
data were obtained in the BY4741 background, data not shown), according to their
accumulation and function restricted to the stress (Buchan et al., 2008; Shah et al.,
2013). Moreover, the intensity of Pab1-GFP fluorescence seemed not to be
different between the two strains. The relative quantification made by western blot
analysis of Pab1-GFP fusion protein levels using an anti-GFP antibody showed as
expected a higher abundance of Pab1 around 20-40 % in the Pab1(+)-GFP strain
respect to the control strain (supplementary Figure S1).
After 2 hours of incubation at 46 °C stress granules and P bodies were clearly
visible in both strains (Figure 3B). Whereas for P bodies no differences between
strains were detectable, stress granules seemed to be brighter and larger in the
Pab1(+)-GFP strain.
Successively, cell cultures were shifted at 30 °C and analyzed after 20 minutes. In
the control strain stress granules and P bodies were almost completely dissolved;
on the contrary, in Pab1(+)-GFP strain both aggregates were still visible (Figure
3C).
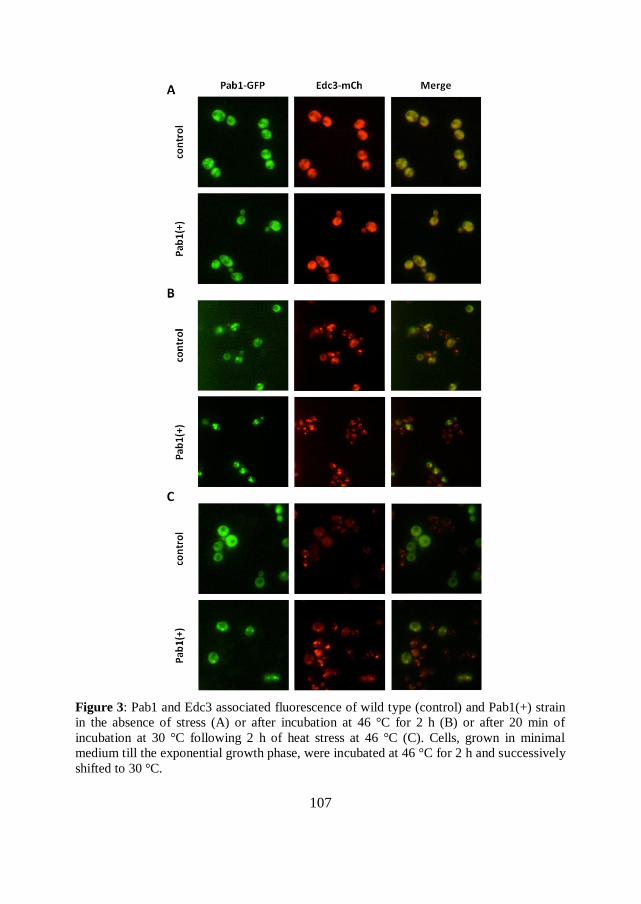
107
Figure 3: Pab1 and Edc3 associated fluorescence of wild type (control) and Pab1(+) strain
in the absence of stress (A) or after incubation at 46 °C for 2 h (B) or after 20 min of
incubation at 30 °C following 2 h of heat stress at 46 °C (C). Cells, grown in minimal
medium till the exponential growth phase, were incubated at 46 °C for 2 h and successively
shifted to 30 °C.
108
Therefore, the additional expression of PAB1 induced the formation of larger and
more persistent stress granules which might correlate with the increased robustness
against stress showed by the Pab1(+) strains (see again, Figures 1 and 2).
The persistence of P bodies observed 20 minutes after removal from the stress in
the Pab1(+) strain could be linked to the enduring presence of stress granules. It
has been observed, indeed, that P bodies disassemble slower than stress granules
when cells were enabled to reenter growth from stationary phase (Brengues and
Parker, 2007). Moreover, since stress granules and P bodies are dynamically linked
sites of mRNP remodeling (Kedersha et al., 2005), it is not surprising that the
modulation of PAB1 expression might also affect P bodies assembly and
disassembly kinetics.
Overall, such evidences supported the importance of Pab1 function in the stress
response and therefore reinforced the idea to obtain S. cerevisiae strains with
improved stress tolerance through the modulation of its function.
Selection of PAB1 variants conferring an improved acetic acid phenotype to
yeast transformants
The proof that the additional PAB1 expression in the plasmid does not impair cell
growth allowed the feasibility to screen dominant mutant alleles of this gene
possibly leading to an improved phenotype toward acetic acid. Both the PAB1
promoter and coding sequence were subjected to random mutagenesis by error-
prone PCR in order to create a mutant plasmid library (see Materials and Methods).
Three mutant plasmid libraries were obtained with an average frequency of 4
(low), 7.43 (medium) and 9.3 (high) mutations/kb, respectively. It was decided to
use that with the medium mutation rate for the screening protocol. The yeast
screening and selection was performed in the S. cerevisiae CEN.PK background
strain containing the unmutated chromosomal copy of PAB1. Cells were
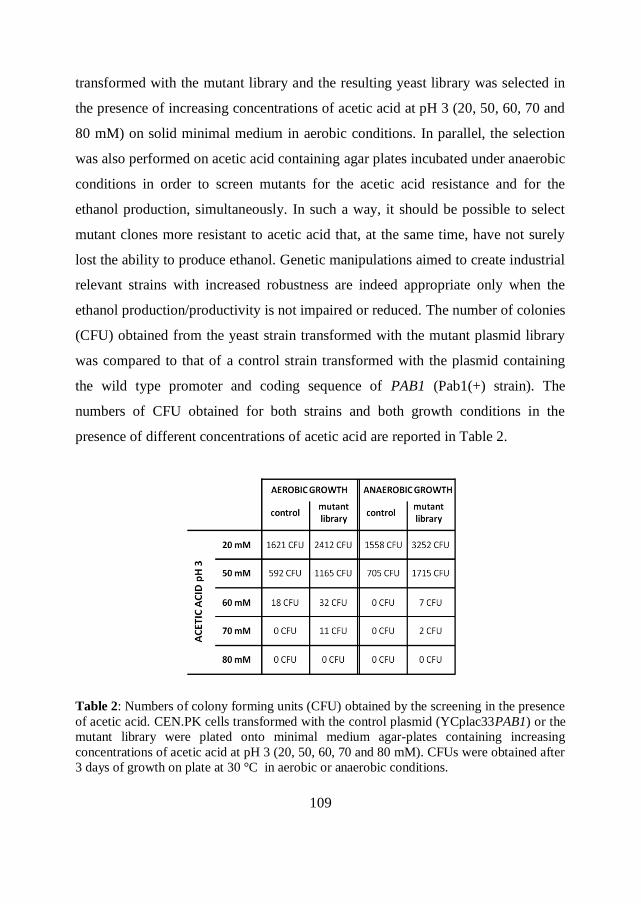
109
transformed with the mutant library and the resulting yeast library was selected in
the presence of increasing concentrations of acetic acid at pH 3 (20, 50, 60, 70 and
80 mM) on solid minimal medium in aerobic conditions. In parallel, the selection
was also performed on acetic acid containing agar plates incubated under anaerobic
conditions in order to screen mutants for the acetic acid resistance and for the
ethanol production, simultaneously. In such a way, it should be possible to select
mutant clones more resistant to acetic acid that, at the same time, have not surely
lost the ability to produce ethanol. Genetic manipulations aimed to create industrial
relevant strains with increased robustness are indeed appropriate only when the
ethanol production/productivity is not impaired or reduced. The number of colonies
(CFU) obtained from the yeast strain transformed with the mutant plasmid library
was compared to that of a control strain transformed with the plasmid containing
the wild type promoter and coding sequence of PAB1 (Pab1(+) strain). The
numbers of CFU obtained for both strains and both growth conditions in the
presence of different concentrations of acetic acid are reported in Table 2.
Table 2: Numbers of colony forming units (CFU) obtained by the screening in the presence
of acetic acid. CEN.PK cells transformed with the control plasmid (YCplac33PAB1) or the
mutant library were plated onto minimal medium agar-plates containing increasing
concentrations of acetic acid at pH 3 (20, 50, 60, 70 and 80 mM). CFUs were obtained after
3 days of growth on plate at 30 °C in aerobic or anaerobic conditions.
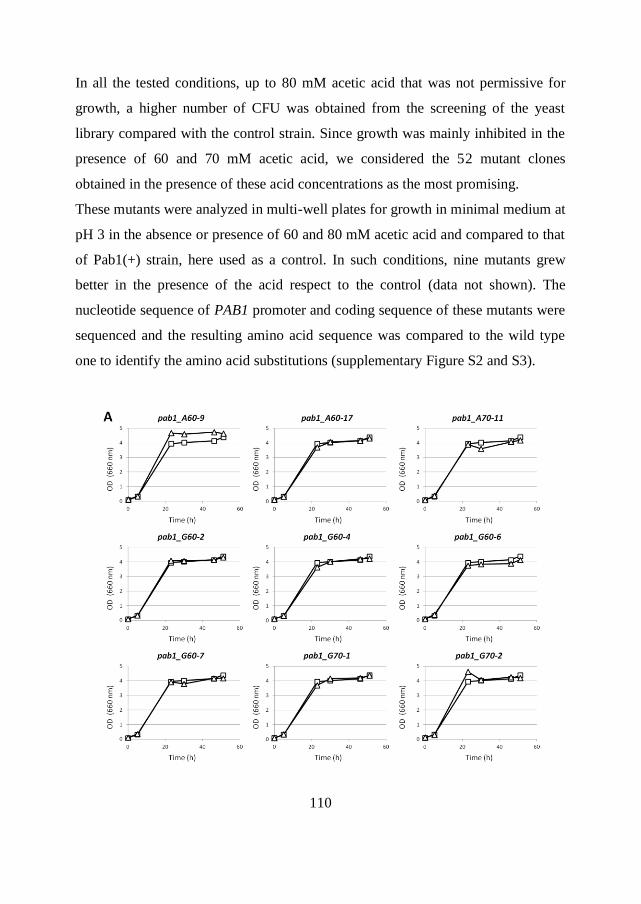
110
In all the tested conditions, up to 80 mM acetic acid that was not permissive for
growth, a higher number of CFU was obtained from the screening of the yeast
library compared with the control strain. Since growth was mainly inhibited in the
presence of 60 and 70 mM acetic acid, we considered the 52 mutant clones
obtained in the presence of these acid concentrations as the most promising.
These mutants were analyzed in multi-well plates for growth in minimal medium at
pH 3 in the absence or presence of 60 and 80 mM acetic acid and compared to that
of Pab1(+) strain, here used as a control. In such conditions, nine mutants grew
better in the presence of the acid respect to the control (data not shown). The
nucleotide sequence of PAB1 promoter and coding sequence of these mutants were
sequenced and the resulting amino acid sequence was compared to the wild type
one to identify the amino acid substitutions (supplementary Figure S2 and S3).
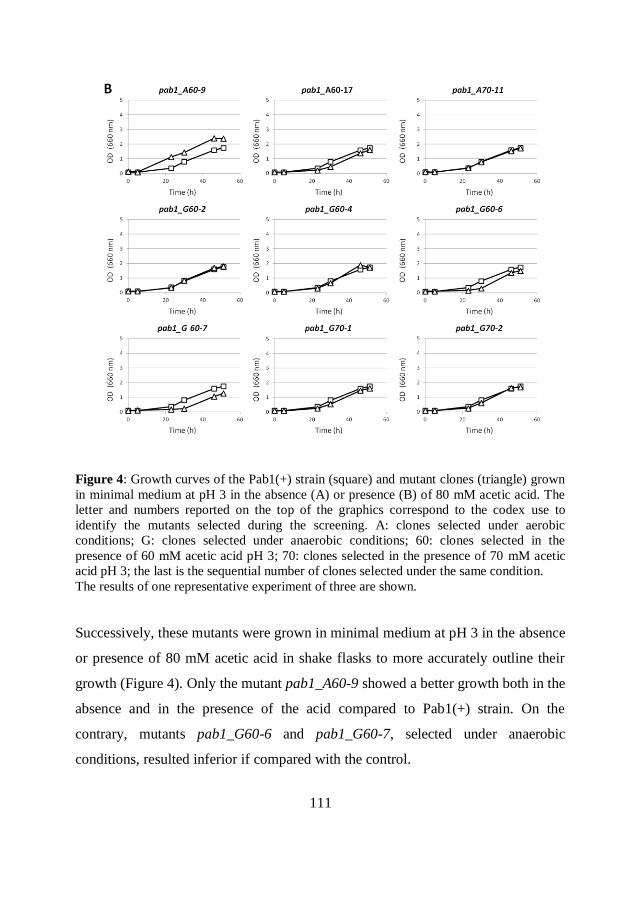
111
Figure 4: Growth curves of the Pab1(+) strain (square) and mutant clones (triangle) grown
in minimal medium at pH 3 in the absence (A) or presence (B) of 80 mM acetic acid. The
letter and numbers reported on the top of the graphics correspond to the codex use to
identify the mutants selected during the screening. A: clones selected under aerobic
conditions; G: clones selected under anaerobic conditions; 60: clones selected in the
presence of 60 mM acetic acid pH 3; 70: clones selected in the presence of 70 mM acetic
acid pH 3; the last is the sequential number of clones selected under the same condition.
The results of one representative experiment of three are shown.
Successively, these mutants were grown in minimal medium at pH 3 in the absence
or presence of 80 mM acetic acid in shake flasks to more accurately outline their
growth (Figure 4). Only the mutant pab1_A60-9 showed a better growth both in the
absence and in the presence of the acid compared to Pab1(+) strain. On the
contrary, mutants pab1_G60-6 and pab1_G60-7, selected under anaerobic
conditions, resulted inferior if compared with the control.
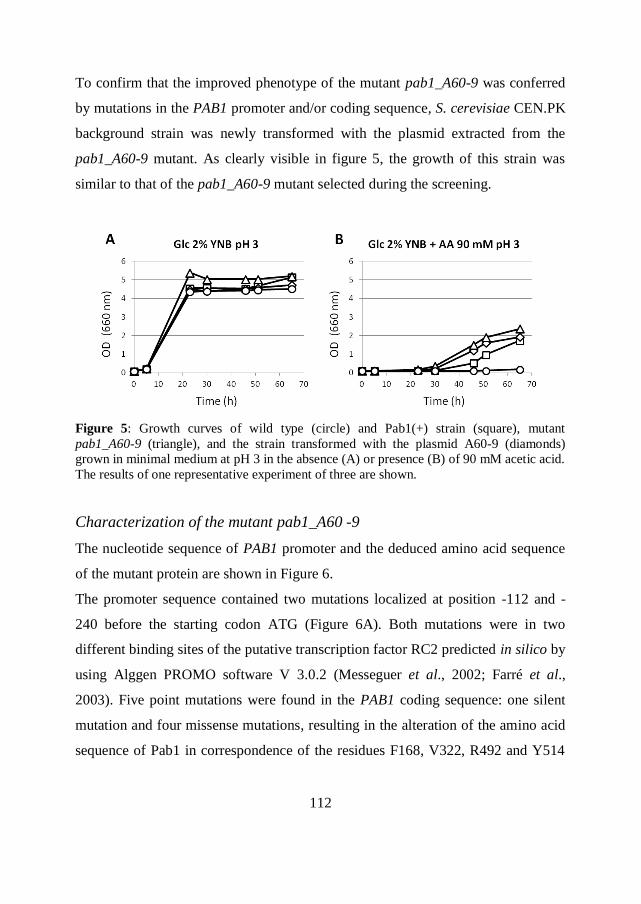
112
To confirm that the improved phenotype of the mutant pab1_A60-9 was conferred
by mutations in the PAB1 promoter and/or coding sequence, S. cerevisiae CEN.PK
background strain was newly transformed with the plasmid extracted from the
pab1_A60-9 mutant. As clearly visible in figure 5, the growth of this strain was
similar to that of the pab1_A60-9 mutant selected during the screening.
Figure 5: Growth curves of wild type (circle) and Pab1(+) strain (square), mutant
pab1_A60-9 (triangle), and the strain transformed with the plasmid A60-9 (diamonds)
grown in minimal medium at pH 3 in the absence (A) or presence (B) of 90 mM acetic acid.
The results of one representative experiment of three are shown.
Characterization of the mutant pab1_A60 -9
The nucleotide sequence of PAB1 promoter and the deduced amino acid sequence
of the mutant protein are shown in Figure 6.
The promoter sequence contained two mutations localized at position -112 and -
240 before the starting codon ATG (Figure 6A). Both mutations were in two
different binding sites of the putative transcription factor RC2 predicted in silico by
using Alggen PROMO software V 3.0.2 (Messeguer et al., 2002; Farré et al.,
2003). Five point mutations were found in the PAB1 coding sequence: one silent
mutation and four missense mutations, resulting in the alteration of the amino acid
sequence of Pab1 in correspondence of the residues F168, V322, R492 and Y514
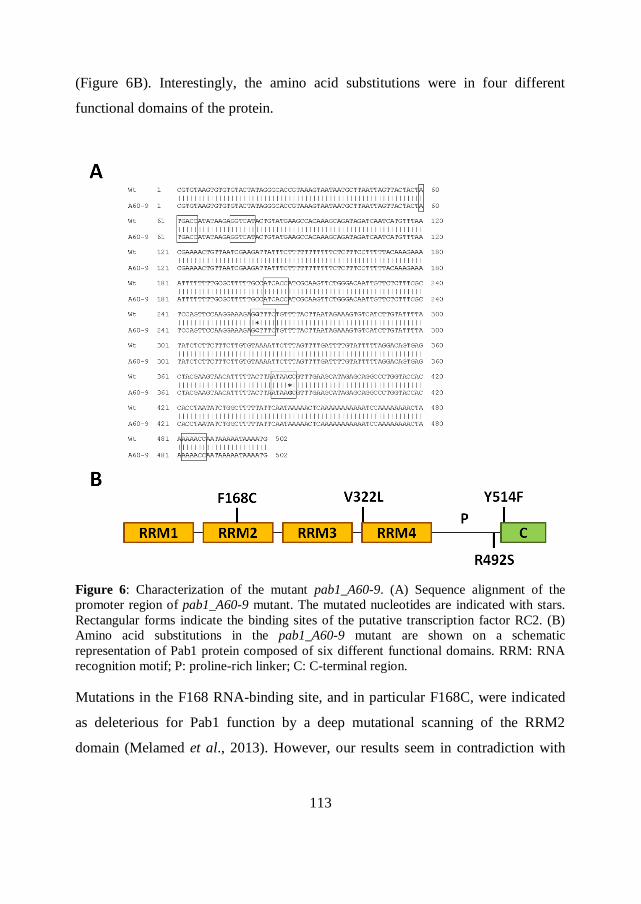
113
(Figure 6B). Interestingly, the amino acid substitutions were in four different
functional domains of the protein.
Figure 6: Characterization of the mutant pab1_A60-9. (A) Sequence alignment of the
promoter region of pab1_A60-9 mutant. The mutated nucleotides are indicated with stars.
Rectangular forms indicate the binding sites of the putative transcription factor RC2. (B)
Amino acid substitutions in the pab1_A60-9 mutant are shown on a schematic
representation of Pab1 protein composed of six different functional domains. RRM: RNA
recognition motif; P: proline-rich linker; C: C-terminal region.
Mutations in the F168 RNA-binding site, and in particular F168C, were indicated
as deleterious for Pab1 function by a deep mutational scanning of the RRM2
domain (Melamed et al., 2013). However, our results seem in contradiction with
114
that. This discordance can be ascribed to the different approaches and genetic
backgrounds used to characterize or select this mutation. The deep mutational
scanning of RRM2 was performed in strains lacking the chromosomal wild type
PAB1 gene, whereas in our strategy mutations leading to the desired phenotype
were selected in the presence of the endogenous unmutated version of Pab1, which
could compensate the deleterious effect of F168C present in the additional mutated
copy.
Moreover, the association of F168C with growth impairment was determined using
a truncation form of Pab1 composed of the RRM1-RRM2-RRM3 and the N-
terminal 25 amino acids of RRM4, instead of the full-length protein (Melamed et
al., 2013). The effect of this mutation on full-length Pab1 functionality may be
therefore different. This hypothesis is supported by the evidence that F170V, which
drastically reduce the protein binding to poly(A), was identified in the same study
as a deleterious mutation for Pab1 function injuring cell growth when present in the
truncated form of the protein, but not in the full-length one (Deardorff and Sachs,
1997; Melamed et al., 2013).
V322L is localized at the beginning of the RRM4 domain, which seems to be
implied in mRNA transport from the nucleus to the cytoplasm, and R492S is in
correspondence of the P domain, which is critical for Pab1 self-association and
poly(A) tail deadenylation mediated by Ccr4-NOT deadenylase complex (Brune et
al., 2005; Yao et al., 2007). In literature there are not data about the role of V322
and R492 in Pab1 function.
Interestingly, the mutation in the C-terminal region was in correspondence to an
amino acid (Y514) which participates in the interaction of Pab1 with Pan3, an
essential subunit of the Pan2p-Pan3p poly(A)-ribonuclease complex (PAN) which
controls poly(A) tail length (Brown et al., 1996; Mangus et al., 2004). Mangus and
co-workers reported that the substitution of the tyrosine 514 to cysteine determines
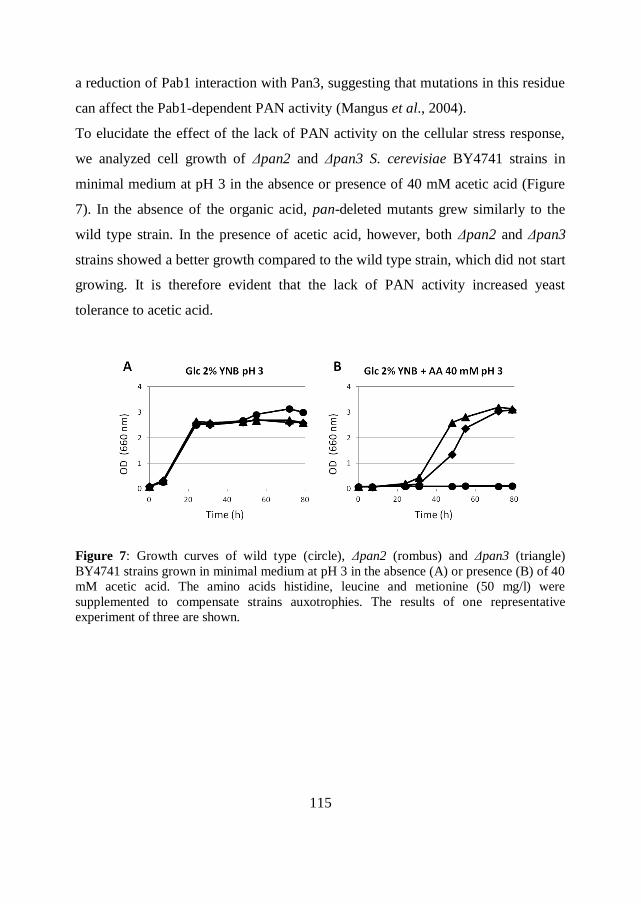
115
a reduction of Pab1 interaction with Pan3, suggesting that mutations in this residue
can affect the Pab1-dependent PAN activity (Mangus et al., 2004).
To elucidate the effect of the lack of PAN activity on the cellular stress response,
we analyzed cell growth of Δpan2 and Δpan3 S. cerevisiae BY4741 strains in
minimal medium at pH 3 in the absence or presence of 40 mM acetic acid (Figure
7). In the absence of the organic acid, pan-deleted mutants grew similarly to the
wild type strain. In the presence of acetic acid, however, both Δpan2 and Δpan3
strains showed a better growth compared to the wild type strain, which did not start
growing. It is therefore evident that the lack of PAN activity increased yeast
tolerance to acetic acid.
Figure 7: Growth curves of wild type (circle), Δpan2 (rombus) and Δpan3 (triangle)
BY4741 strains grown in minimal medium at pH 3 in the absence (A) or presence (B) of 40
mM acetic acid. The amino acids histidine, leucine and metionine (50 mg/l) were
supplemented to compensate strains auxotrophies. The results of one representative
experiment of three are shown.
116
Discussion
We proved that the engineering of mRNA metabolism through the modulation of
Pab1 abundance and/or function represents an innovative tool to improved S.
cerevisiae robustness. On one hand, the expression of PAB1 in a low copy number
plasmid, in addition to the chromosomal copy, increased yeast growth performance
under stressful conditions that often occur during industrial large scale
fermentations, such as heat, oxidative and acetic acid stress (Figures 1 and 2). On
the other, S. cerevisiae resistance to acetic acid was further improved through the
selection and identification of a mutant Pab1 protein (Figure 5). Both approaches
demonstrate the feasibility to enhanced yeast performance under stressful
conditions through either the alteration of the abundance or function of a factor that
orchestrates several aspects of mRNA metabolism. Two different hypotheses were
elaborated to explain the reason of the observed phenotypes of each approach.
The increased stress tolerance showed by Pab1(+) strains might correlate
with the presence of larger stress granules
Pab1 is a multifunctional poly(A)-binding protein which determines, together with
its interacting proteins, the fate of the transcripts, having a fundamental role in the
protection of mRNAs from deadenylation-dependent degradation (Coller and
Parker, 2004). It has been suggested that Pab1 may play its protective function by
promoting the transit of poly(A) mRNA from P bodies to stress granules (Swisher
and Parker, 2010). We observed that Pab1(+) strains, containing a PAB1 copy on a
centromeric plasmid in addition to the genomic one, were more tolerant to stress
(Figures 1 and 2) and, at the same time, accumulated under heat stress larger stress
granules as judged by Pab1 localization (Figure 3) compared with wild type strains.
One possibility is that, during a stress response, the presence of more Pab1 proteins
117
than normal allows transcripts to be more efficiently stored and so protected from
degradation in stress granules, that as a consequence appear bigger. The presence
of more stable mRNAs in Pab1(+) strains need to be demonstrated, for example by
real time-PCR, to confirm this hypothesis. However, the direct comparison of
mRNA stability between the control and Pab1(+) strains is not so trivial to be
performed since the housekeeping gene necessary to normalize the mRNA levels
could be also stabilized in Pab1(+) strains. Moreover, since stress granules have
been proposed to be sites of translation reinitiation containing translationally
silenced mRNAs prone to be rapidly translated when the stress is overcome
(Anderson and Kedersha, 2009; Buchan et al., 2008), larger stress granules
observed in Pab1(+) cells may be the consequence of the accumulation of a greater
mRNAs pool addressed to be translated, thus allowing cells to more rapidly
recover from the stress-induced damage in respect to wild type cells. The
importance of stress granules for stress recovery has been proved by the evidence
that S. cerevisiae null mutants pbp1Δ, pub1Δ and TIF4632Δ, impaired in the
constitution of stress granules, didn’t resume growth after removal from ethanol
stress (Buchan et al., 2008; Kato et al., 2011).
Mutation Y514F might be responsible for the improved phenotype showed
by the A60_9 mutant
The screening of the mutant library in the presence of acetic acid revealed a mutant
Pab1 protein which confers to yeast cells an improved phenotype, further
improving the positive effect conferred by the additional Pab1 wild type copy.
Although the phenotype associated with each mutation identified in the mutant
protein has not been established yet, literature data suggest that mutations in
tyrosine 514 can impair Pab1-Pan3 interaction and, consequently, PAN activity
(Mangus et al., 2004). In S. cerevisiae, point mutations in other residues next to
118
Y514 within the C-terminal region, which completely eliminate Pab1-Pan3
interaction, as well as a C-terminal truncation of Pab1 and the deletion of PAN3
gene, resulted in the accumulation of mRNAs with longer poly(A) tails both in
vitro and in vivo that, as a consequence, are supposed to be stabilized (Brown and
Sachs, 1998; Mangus et al., 2004). Since tyrosine 514 has been demonstrated to
participate in Pab1-Pan3 association (Mangus et al., 2004), we speculate that
Y514F may abrogate or reduce PAN activity and, consequently, affect the poly(A)
tail control. The improved phenotype associated with pab1_a609 mutant may be
therefore related to the accumulation of mRNAs with longer poly(A) tails than
normal resulting from an altered Pab1-Pan3 interaction and, as a consequence,
PAN activity.
Moreover, the positive effect of the lacking of PAN activity on stress tolerance has
been proved by the evidence that Pan2 or Pan3-deficient strains are more tolerant
to acetic acid compared to wild type strain (Figure 7). The presumed PAN activity
reduction, as well as the presence of mRNAs with longer poly(A) tail, will be
verified in the pab1_A60-9 mutant. Moreover, future studies on S. cerevisiae
strains containing Pan3-noninteracting pab1 alleles will help to shed light on the
effect of pab1 mutations abrogating PAN activity on stress tolerance.
Beyond the possible effect of Y514F on the improvement of yeast acetic acid
tolerance, we cannot exclude that the other three mutations (F168C, V322L and
R492S) identified in the pab1_A60-9 mutant have a role in the phenotype
improvement. In addition, two point mutations were found in the promoter region
of the same mutant in correspondence of two binding sites of the putative factor
RC2. It may therefore possible that the transcriptional regulation of the mutant
pab1 allele harbored by the pab1_A60-9 mutant has changed. Recombinant
constructs containing the single mutations and their combination are currently
under evaluation. Finally, we cannot exclude that also in this case the effect will be
119
dependent on the efficiency and the persistence of stress granules. This aspect is
currently under investigation by fluorescence microscope observations.
Conclusions
We have demonstrated that both the alteration of Pab1 abundance and function
increase S. cerevisiae stress tolerance. The data obtained in shake flasks are
promising for testing the strains in bioreactors under conditions as much as
possible similar to those occurring during industrial fermentations. The ethanol
production will be tested in operative condition resembling those of lignocellulosic
hydrolysate fermentation, to verify the robustness of the obtained cellular design.
In this perspective, the here reported results suggest that the engineering of mRNA
metabolism may represent an innovative approach to obtain strains with an
improved phenotype against stressing factors.
120
References
Almeida JR, Modig T, Petersson A, Hahn-Hagerdal B, Liden G, Gorwa-Grauslund
MF. 2007. Increased tolerance and conversion of inhibitors in lignocellulosic
hydrolysates by Saccharomyces cerevisiae. Journal of Chemical Technology
and Biotechnology 82: 340-349.
Alper H, Moxley J, Nevoigt E, Fink GR, Stephanopoulos G. 2006. Engineering
yeast transcription machinery for improved ethanol tolerance and production.
Science 314: 1565-8.
Alper H, Stephanopoulos G. 2007. Global transcription machinery engineering: a
new approach for improving cellular phenotype. Metab Eng 9: 258-67.
Anderson P, Kedersha N. 2009. RNA granules: post-transcriptional and epigenetic
modulators of gene expression. Nat Rev Mol Cell Biol 10: 430-6.
Avrahami-Moyal L, Braun S, Engelberg D. 2012. Overexpression of PDE2 or
SSD1-V in Saccharomyces cerevisiae W303-1A strain renders it ethanol-
tolerant. FEMS Yeast Res 12: 447-55.
Brachmann CB, Davies A, Cost GJ, Caputo E, Li J, Hieter P, Boeke JD. 1998.
Designer deletion strains derived from Saccharomyces cerevisiae S288C: a
useful set of strains and plasmids for PCR-mediated gene disruption and other
applications. Yeast 14: 115-32.
Brengues M, Parker R. 2007. Accumulation of polyadenylated mRNA, Pab1p,
eIF4E, and eIF4G with P-bodies in Saccharomyces cerevisiae. Mol Biol Cell
18: 2592-602.
Brown CE, Sachs AB. 1998. Poly(A) tail length control in Saccharomyces
cerevisiae occurs by message-specific deadenylation. Mol Cell Biol 18: 6548-
59.
Brown CE, Tarun SZ, Boeck R, Sachs AB. 1996. PAN3 encodes a subunit of the
Pab1p-dependent poly(A) nuclease in Saccharomyces cerevisiae. Mol Cell
Biol 16: 5744-53.
Brune C, Munchel SE, Fischer N, Podtelejnikov AV, Weis K. 2005. Yeast
poly(A)-binding protein Pab1 shuttles between the nucleus and the cytoplasm
and functions in mRNA export. RNA 11: 517-31.
Buchan JR, Muhlrad D, Parker R. 2008. P bodies promote stress granule assembly
in Saccharomyces cerevisiae. J Cell Biol 183: 441-55.
Buchan JR, Parker R. 2009. Eukaryotic stress granules: the ins and outs of
translation. Mol Cell 36: 932-41.
Buchan JR, Yoon JH, Parker R. 2011. Stress-specific composition, assembly and
kinetics of stress granules in Saccharomyces cerevisiae. J Cell Sci 124: 228-
39.
121
Caponigro G, Parker R. 1996. Mechanisms and control of mRNA turnover in
Saccharomyces cerevisiae. Microbiol Rev 60: 233-49.
Coller J, Parker R. 2004. Eukaryotic mRNA decapping. Annu Rev Biochem 73:
861-90.
Deardorff JA, Sachs AB. 1997. Differential effects of aromatic and charged residue
substitutions in the RNA binding domains of the yeast poly(A)-binding
protein. J Mol Biol 269: 67-81.
Entian K, Kötter P. 1998. Yeast mutant and plasmid collections In Brown, J. and
Tuite, M. (Eds), Yeast gene analysis, San Diego California Academic Press,
pp. 431-449.
Fan J, Yang X, Wang W, Wood WH, Becker KG, Gorospe M. 2002. Global
analysis of stress-regulated mRNA turnover by using cDNA arrays. Proc Natl
Acad Sci U S A 99: 10611-6.
Farré D, Roset R, Huerta M, Adsuara JE, Roselló L, Albà MM, Messeguer X.
2003. Identification of patterns in biological sequences at the ALGGEN
server: PROMO and MALGEN. Nucleic Acids Res 31: 3651-3.
Gietz RD, Sugino A. 1988. New yeast-Escherichia coli shuttle vectors constructed
with in vitro mutagenized yeast genes lacking six-base pair restriction sites.
Gene 74: 527-34.
Gietz RD, Woods RA. 2002. Transformation of yeast by lithium acetate/single-
stranded carrier DNA/polyethylene glycol method. Methods Enzymol 350: 87-
96.
Glisovic T, Bachorik JL, Yong J, Dreyfuss G. 2008. RNA-binding proteins and
post-transcriptional gene regulation. FEBS Lett 582: 1977-86.
Goldstein AL, McCusker JH. 1999. Three new dominant drug resistance cassettes
for gene disruption in Saccharomyces cerevisiae. Yeast 15: 1541-53.
Gong J, Zheng H, Wu Z, Chen T, Zhao X. 2009. Genome shuffling: Progress and
applications for phenotype improvement. Biotechnol Adv 27: 996-1005.
Grousl T, Ivanov P, Frýdlová I, Vasicová P, Janda F, Vojtová J, Malínská K,
Malcová I, Nováková L, Janosková D, Valásek L, Hasek J. 2009. Robust heat
shock induces eIF2alpha-phosphorylation-independent assembly of stress
granules containing eIF3 and 40S ribosomal subunits in budding yeast,
Saccharomyces cerevisiae. J Cell Sci 122: 2078-88.
Hong KK, Nielsen J. 2012. Metabolic engineering of Saccharomyces cerevisiae: a
key cell factory platform for future biorefineries. Cell Mol Life Sci 69: 2671-
90.
Hong ME, Lee KS, Yu BJ, Sung YJ, Park SM, Koo HM, Kweon DH, Park JC, Jin
YS. 2010. Identification of gene targets eliciting improved alcohol tolerance in
Saccharomyces cerevisiae through inverse metabolic engineering. J
Biotechnol 149: 52-9.
122
Hoyle NP, Castelli LM, Campbell SG, Holmes LE, Ashe MP. 2007. Stress-
dependent relocalization of translationally primed mRNPs to cytoplasmic
granules that are kinetically and spatially distinct from P-bodies. J Cell Biol
179: 65-74.
Kato K, Yamamoto Y, Izawa S. 2011. Severe ethanol stress induces assembly of
stress granules in Saccharomyces cerevisiae. Yeast 28: 339-47.
Kedersha N, Stoecklin G, Ayodele M, Yacono P, Lykke-Andersen J, Fritzler MJ,
Scheuner D, Kaufman RJ, Golan DE, Anderson P. 2005. Stress granules and
processing bodies are dynamically linked sites of mRNP remodeling. J Cell
Biol 169, 871-84.
Keene JD, Lager PJ. 2005. Post-transcriptional operons and regulons co-ordinating
gene expression. Chromosome Res 13: 327-37.
Lanza AM, Alper HS. 2011. Global strain engineering by mutant transcription
factors. Methods Mol Biol 765: 253-74.
Lewis JA, Elkon IM, McGee MA, Higbee AJ, Gasch AP. 2010. Exploiting natural
variation in Saccharomyces cerevisiae to identify genes for increased ethanol
resistance. Genetics 186: 1197-205.
Longtine MS, McKenzie A, Demarini DJ, Shah NG, Wach A, Brachat A,
Philippsen P, Pringle JR. 1998. Additional modules for versatile and
economical PCR-based gene deletion and modification in Saccharomyces
cerevisiae. Yeast 14: 953-61.
Mangus DA, Evans MC, Agrin NS, Smith M, Gongidi P, Jacobson A. 2004.
Positive and negative regulation of poly(A) nuclease. Mol Cell Biol 24: 5521-
33.
Mata J, Marguerat S, Bähler J. 2005. Post-transcriptional control of gene
expression: a genome-wide perspective. Trends Biochem Sci 30: 506-14.
Melamed D, Young DL, Gamble CE, Miller CR, Fields S. 2013. Deep mutational
scanning of an RRM domain of the Saccharomyces cerevisiae poly(A)-
binding protein. RNA 19: 1537-51.
Messeguer X, Escudero R, Farré D, Núñez O, Martínez J, Albà MM. 2002.
PROMO: detection of known transcription regulatory elements using species-
tailored searches. Bioinformatics 18: 333-4.
Palmqvist E, Hahn-Hägerdal B. 2000. Fermentation of lignocellulosic
hydrolysates. II: inhibitors and mechanisms of inhibition. Bioresource
Technology 74: 25-33.
Patnaik R. 2008. Engineering complex phenotypes in industrial strains. Biotechnol
Prog 24: 38-47.
Richardson R, Denis CL, Zhang C, Nielsen ME, Chiang YC, Kierkegaard M,
Wang X, Lee DJ, Andersen JS, Yao G. 2012. Mass spectrometric
identification of proteins that interact through specific domains of the poly(A)
binding protein. Mol Genet Genomics 287: 711-30.
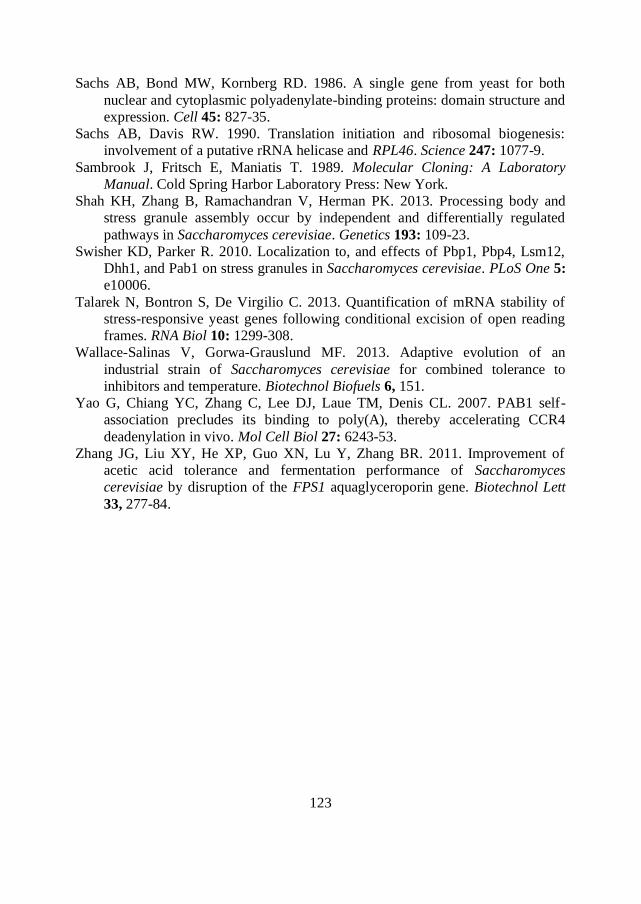
123
Sachs AB, Bond MW, Kornberg RD. 1986. A single gene from yeast for both
nuclear and cytoplasmic polyadenylate-binding proteins: domain structure and
expression. Cell 45: 827-35.
Sachs AB, Davis RW. 1990. Translation initiation and ribosomal biogenesis:
involvement of a putative rRNA helicase and RPL46. Science 247: 1077-9.
Sambrook J, Fritsch E, Maniatis T. 1989. Molecular Cloning: A Laboratory
Manual. Cold Spring Harbor Laboratory Press: New York.
Shah KH, Zhang B, Ramachandran V, Herman PK. 2013. Processing body and
stress granule assembly occur by independent and differentially regulated
pathways in Saccharomyces cerevisiae. Genetics 193: 109-23.
Swisher KD, Parker R. 2010. Localization to, and effects of Pbp1, Pbp4, Lsm12,
Dhh1, and Pab1 on stress granules in Saccharomyces cerevisiae. PLoS One 5:
e10006.
Talarek N, Bontron S, De Virgilio C. 2013. Quantification of mRNA stability of
stress-responsive yeast genes following conditional excision of open reading
frames. RNA Biol 10: 1299-308.
Wallace-Salinas V, Gorwa-Grauslund MF. 2013. Adaptive evolution of an
industrial strain of Saccharomyces cerevisiae for combined tolerance to
inhibitors and temperature. Biotechnol Biofuels 6, 151.
Yao G, Chiang YC, Zhang C, Lee DJ, Laue TM, Denis CL. 2007. PAB1 self-
association precludes its binding to poly(A), thereby accelerating CCR4
deadenylation in vivo. Mol Cell Biol 27: 6243-53.
Zhang JG, Liu XY, He XP, Guo XN, Lu Y, Zhang BR. 2011. Improvement of
acetic acid tolerance and fermentation performance of Saccharomyces
cerevisiae by disruption of the FPS1 aquaglyceroporin gene. Biotechnol Lett
33, 277-84.
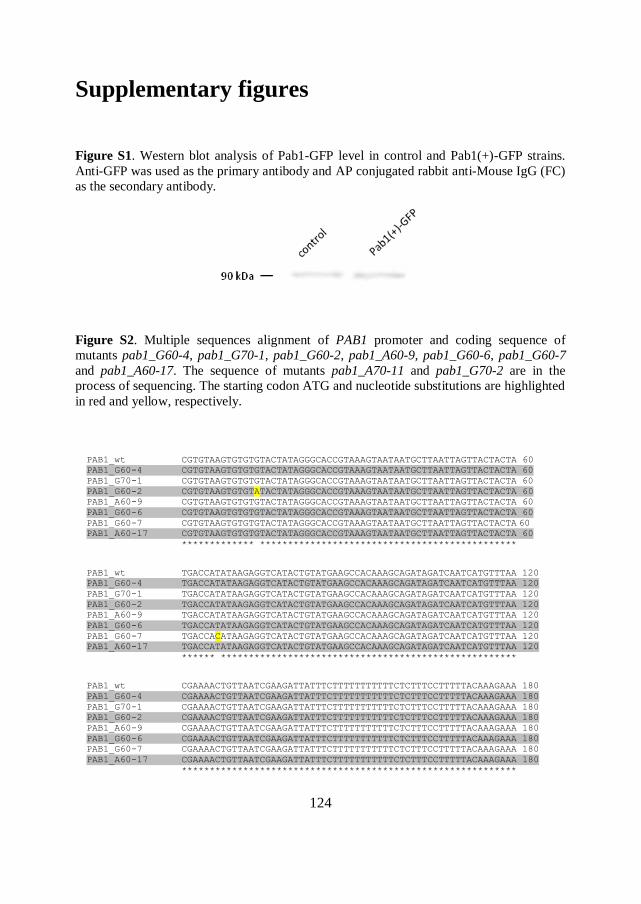
124
Supplementary figures
Figure S1. Western blot analysis of Pab1-GFP level in control and Pab1(+)-GFP strains.
Anti-GFP was used as the primary antibody and AP conjugated rabbit anti-Mouse IgG (FC)
as the secondary antibody.
Figure S2. Multiple sequences alignment of PAB1 promoter and coding sequence of
mutants pab1_G60-4, pab1_G70-1, pab1_G60-2, pab1_A60-9, pab1_G60-6, pab1_G60-7
and pab1_A60-17. The sequence of mutants pab1_A70-11 and pab1_G70-2 are in the
process of sequencing. The starting codon ATG and nucleotide substitutions are highlighted
in red and yellow, respectively.
PAB1_wt CGTGTAAGTGTGTGTACTATAGGGCACCGTAAAGTAATAATGCTTAATTAGTTACTACTA 60
PAB1_G60-4 CGTGTAAGTGTGTGTACTATAGGGCACCGTAAAGTAATAATGCTTAATTAGTTACTACTA 60
PAB1_G70-1 CGTGTAAGTGTGTGTACTATAGGGCACCGTAAAGTAATAATGCTTAATTAGTTACTACTA 60
PAB1_G60-2 CGTGTAAGTGTGTATACTATAGGGCACCGTAAAGTAATAATGCTTAATTAGTTACTACTA 60
PAB1_A60-9 CGTGTAAGTGTGTGTACTATAGGGCACCGTAAAGTAATAATGCTTAATTAGTTACTACTA 60
PAB1_G60-6 CGTGTAAGTGTGTGTACTATAGGGCACCGTAAAGTAATAATGCTTAATTAGTTACTACTA 60
PAB1_G60-7 CGTGTAAGTGTGTGTACTATAGGGCACCGTAAAGTAATAATGCTTAATTAGTTACTACTA 60 PAB1_A60-17 CGTGTAAGTGTGTGTACTATAGGGCACCGTAAAGTAATAATGCTTAATTAGTTACTACTA 60
************* **********************************************
PAB1_wt TGACCATATAAGAGGTCATACTGTATGAAGCCACAAAGCAGATAGATCAATCATGTTTAA 120
PAB1_G60-4 TGACCATATAAGAGGTCATACTGTATGAAGCCACAAAGCAGATAGATCAATCATGTTTAA 120
PAB1_G70-1 TGACCATATAAGAGGTCATACTGTATGAAGCCACAAAGCAGATAGATCAATCATGTTTAA 120
PAB1_G60-2 TGACCATATAAGAGGTCATACTGTATGAAGCCACAAAGCAGATAGATCAATCATGTTTAA 120
PAB1_A60-9 TGACCATATAAGAGGTCATACTGTATGAAGCCACAAAGCAGATAGATCAATCATGTTTAA 120
PAB1_G60-6 TGACCATATAAGAGGTCATACTGTATGAAGCCACAAAGCAGATAGATCAATCATGTTTAA 120
PAB1_G60-7 TGACCACATAAGAGGTCATACTGTATGAAGCCACAAAGCAGATAGATCAATCATGTTTAA 120
PAB1_A60-17 TGACCATATAAGAGGTCATACTGTATGAAGCCACAAAGCAGATAGATCAATCATGTTTAA 120
****** *****************************************************
PAB1_wt CGAAAACTGTTAATCGAAGATTATTTCTTTTTTTTTTTCTCTTTCCTTTTTACAAAGAAA 180
PAB1_G60-4 CGAAAACTGTTAATCGAAGATTATTTCTTTTTTTTTTTCTCTTTCCTTTTTACAAAGAAA 180
PAB1_G70-1 CGAAAACTGTTAATCGAAGATTATTTCTTTTTTTTTTTCTCTTTCCTTTTTACAAAGAAA 180
PAB1_G60-2 CGAAAACTGTTAATCGAAGATTATTTCTTTTTTTTTTTCTCTTTCCTTTTTACAAAGAAA 180
PAB1_A60-9 CGAAAACTGTTAATCGAAGATTATTTCTTTTTTTTTTTCTCTTTCCTTTTTACAAAGAAA 180
PAB1_G60-6 CGAAAACTGTTAATCGAAGATTATTTCTTTTTTTTTTTCTCTTTCCTTTTTACAAAGAAA 180
PAB1_G60-7 CGAAAACTGTTAATCGAAGATTATTTCTTTTTTTTTTTCTCTTTCCTTTTTACAAAGAAA 180
PAB1_A60-17 CGAAAACTGTTAATCGAAGATTATTTCTTTTTTTTTTTCTCTTTCCTTTTTACAAAGAAA 180
************************************************************
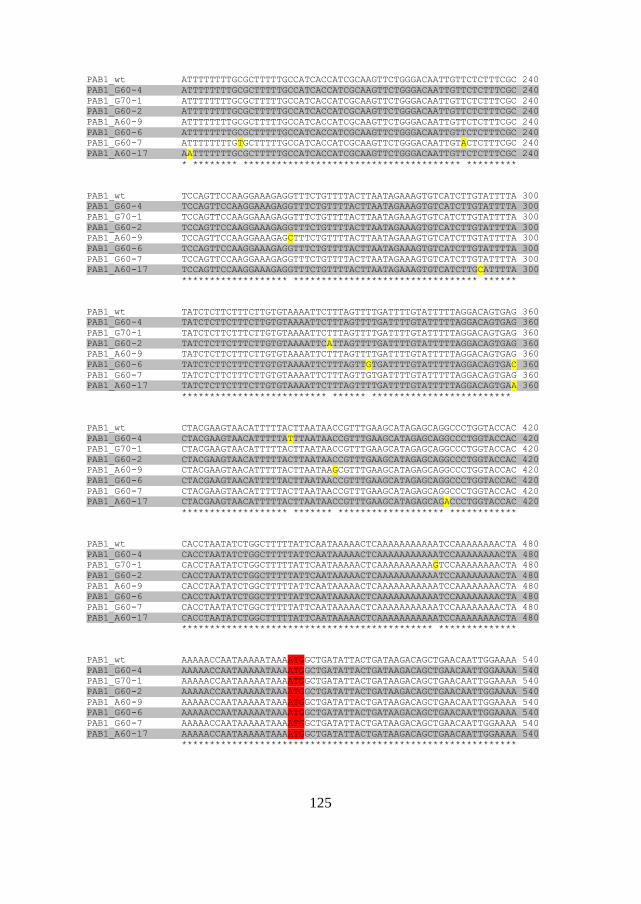
125
PAB1_wt ATTTTTTTTGCGCTTTTTGCCATCACCATCGCAAGTTCTGGGACAATTGTTCTCTTTCGC 240
PAB1_G60-4 ATTTTTTTTGCGCTTTTTGCCATCACCATCGCAAGTTCTGGGACAATTGTTCTCTTTCGC 240
PAB1_G70-1 ATTTTTTTTGCGCTTTTTGCCATCACCATCGCAAGTTCTGGGACAATTGTTCTCTTTCGC 240
PAB1_G60-2 ATTTTTTTTGCGCTTTTTGCCATCACCATCGCAAGTTCTGGGACAATTGTTCTCTTTCGC 240
PAB1_A60-9 ATTTTTTTTGCGCTTTTTGCCATCACCATCGCAAGTTCTGGGACAATTGTTCTCTTTCGC 240
PAB1_G60-6 ATTTTTTTTGCGCTTTTTGCCATCACCATCGCAAGTTCTGGGACAATTGTTCTCTTTCGC 240
PAB1_G60-7 ATTTTTTTTGTGCTTTTTGCCATCACCATCGCAAGTTCTGGGACAATTGTACTCTTTCGC 240
PAB1_A60-17 AATTTTTTTGCGCTTTTTGCCATCACCATCGCAAGTTCTGGGACAATTGTTCTCTTTCGC 240
* ******** *************************************** *********
PAB1_wt TCCAGTTCCAAGGAAAGAGGTTTCTGTTTTACTTAATAGAAAGTGTCATCTTGTATTTTA 300
PAB1_G60-4 TCCAGTTCCAAGGAAAGAGGTTTCTGTTTTACTTAATAGAAAGTGTCATCTTGTATTTTA 300
PAB1_G70-1 TCCAGTTCCAAGGAAAGAGGTTTCTGTTTTACTTAATAGAAAGTGTCATCTTGTATTTTA 300
PAB1_G60-2 TCCAGTTCCAAGGAAAGAGGTTTCTGTTTTACTTAATAGAAAGTGTCATCTTGTATTTTA 300
PAB1_A60-9 TCCAGTTCCAAGGAAAGAGCTTTCTGTTTTACTTAATAGAAAGTGTCATCTTGTATTTTA 300
PAB1_G60-6 TCCAGTTCCAAGGAAAGAGGTTTCTGTTTTACTTAATAGAAAGTGTCATCTTGTATTTTA 300
PAB1_G60-7 TCCAGTTCCAAGGAAAGAGGTTTCTGTTTTACTTAATAGAAAGTGTCATCTTGTATTTTA 300
PAB1_A60-17 TCCAGTTCCAAGGAAAGAGGTTTCTGTTTTACTTAATAGAAAGTGTCATCTTGCATTTTA 300
******************* ********************************* ******
PAB1_wt TATCTCTTCTTTCTTGTGTAAAATTCTTTAGTTTTGATTTTGTATTTTTAGGACAGTGAG 360
PAB1_G60-4 TATCTCTTCTTTCTTGTGTAAAATTCTTTAGTTTTGATTTTGTATTTTTAGGACAGTGAG 360
PAB1_G70-1 TATCTCTTCTTTCTTGTGTAAAATTCTTTAGTTTTGATTTTGTATTTTTAGGACAGTGAG 360
PAB1_G60-2 TATCTCTTCTTTCTTGTGTAAAATTCATTAGTTTTGATTTTGTATTTTTAGGACAGTGAG 360
PAB1_A60-9 TATCTCTTCTTTCTTGTGTAAAATTCTTTAGTTTTGATTTTGTATTTTTAGGACAGTGAG 360
PAB1_G60-6 TATCTCTTCTTTCTTGTGTAAAATTCTTTAGTTGTGATTTTGTATTTTTAGGACAGTGAC 360
PAB1_G60-7 TATCTCTTCTTTCTTGTGTAAAATTCTTTAGTTGTGATTTTGTATTTTTAGGACAGTGAG 360
PAB1_A60-17 TATCTCTTCTTTCTTGTGTAAAATTCTTTAGTTTTGATTTTGTATTTTTAGGACAGTGAA 360
************************** ****** *************************
PAB1_wt CTACGAAGTAACATTTTTACTTAATAACCGTTTGAAGCATAGAGCAGGCCCTGGTACCAC 420
PAB1_G60-4 CTACGAAGTAACATTTTTATTTAATAACCGTTTGAAGCATAGAGCAGGCCCTGGTACCAC 420
PAB1_G70-1 CTACGAAGTAACATTTTTACTTAATAACCGTTTGAAGCATAGAGCAGGCCCTGGTACCAC 420
PAB1_G60-2 CTACGAAGTAACATTTTTACTTAATAACCGTTTGAAGCATAGAGCAGGCCCTGGTACCAC 420
PAB1_A60-9 CTACGAAGTAACATTTTTACTTAATAAGCGTTTGAAGCATAGAGCAGGCCCTGGTACCAC 420
PAB1_G60-6 CTACGAAGTAACATTTTTACTTAATAACCGTTTGAAGCATAGAGCAGGCCCTGGTACCAC 420
PAB1_G60-7 CTACGAAGTAACATTTTTACTTAATAACCGTTTGAAGCATAGAGCAGGCCCTGGTACCAC 420
PAB1_A60-17 CTACGAAGTAACATTTTTACTTAATAACCGTTTGAAGCATAGAGCAGACCCTGGTACCAC 420
******************* ******* ******************* ************
PAB1_wt CACCTAATATCTGGCTTTTTATTCAATAAAAACTCAAAAAAAAAAATCCAAAAAAAACTA 480
PAB1_G60-4 CACCTAATATCTGGCTTTTTATTCAATAAAAACTCAAAAAAAAAAATCCAAAAAAAACTA 480
PAB1_G70-1 CACCTAATATCTGGCTTTTTATTCAATAAAAACTCAAAAAAAAAAGTCCAAAAAAAACTA 480
PAB1_G60-2 CACCTAATATCTGGCTTTTTATTCAATAAAAACTCAAAAAAAAAAATCCAAAAAAAACTA 480
PAB1_A60-9 CACCTAATATCTGGCTTTTTATTCAATAAAAACTCAAAAAAAAAAATCCAAAAAAAACTA 480
PAB1_G60-6 CACCTAATATCTGGCTTTTTATTCAATAAAAACTCAAAAAAAAAAATCCAAAAAAAACTA 480
PAB1_G60-7 CACCTAATATCTGGCTTTTTATTCAATAAAAACTCAAAAAAAAAAATCCAAAAAAAACTA 480
PAB1_A60-17 CACCTAATATCTGGCTTTTTATTCAATAAAAACTCAAAAAAAAAAATCCAAAAAAAACTA 480
********************************************* **************
PAB1_wt AAAAACCAATAAAAATAAAATGGCTGATATTACTGATAAGACAGCTGAACAATTGGAAAA 540
PAB1_G60-4 AAAAACCAATAAAAATAAAATGGCTGATATTACTGATAAGACAGCTGAACAATTGGAAAA 540
PAB1_G70-1 AAAAACCAATAAAAATAAAATGGCTGATATTACTGATAAGACAGCTGAACAATTGGAAAA 540
PAB1_G60-2 AAAAACCAATAAAAATAAAATGGCTGATATTACTGATAAGACAGCTGAACAATTGGAAAA 540
PAB1_A60-9 AAAAACCAATAAAAATAAAATGGCTGATATTACTGATAAGACAGCTGAACAATTGGAAAA 540
PAB1_G60-6 AAAAACCAATAAAAATAAAATGGCTGATATTACTGATAAGACAGCTGAACAATTGGAAAA 540
PAB1_G60-7 AAAAACCAATAAAAATAAAATGGCTGATATTACTGATAAGACAGCTGAACAATTGGAAAA 540
PAB1_A60-17 AAAAACCAATAAAAATAAAATGGCTGATATTACTGATAAGACAGCTGAACAATTGGAAAA 540
************************************************************
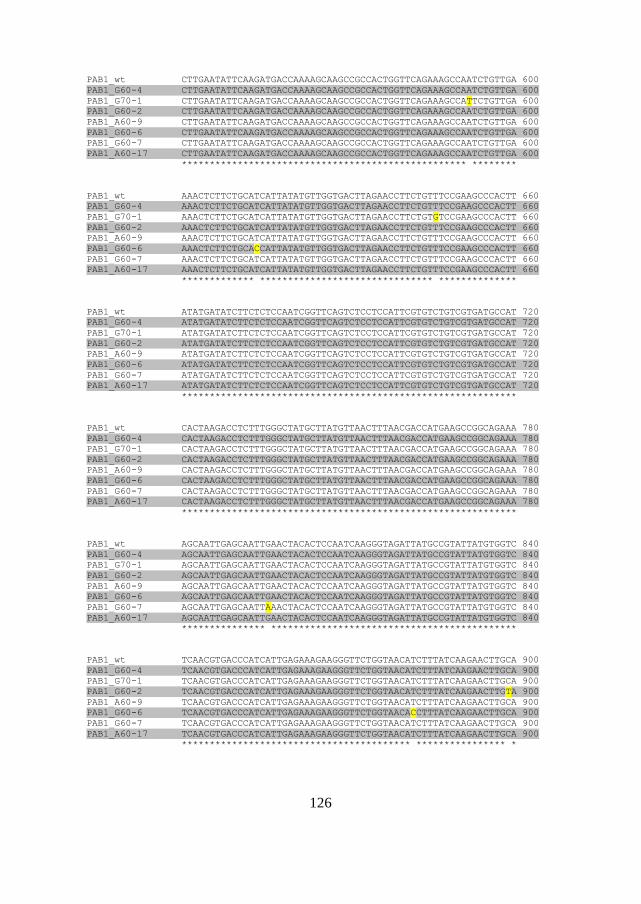
126
PAB1_wt CTTGAATATTCAAGATGACCAAAAGCAAGCCGCCACTGGTTCAGAAAGCCAATCTGTTGA 600
PAB1_G60-4 CTTGAATATTCAAGATGACCAAAAGCAAGCCGCCACTGGTTCAGAAAGCCAATCTGTTGA 600
PAB1_G70-1 CTTGAATATTCAAGATGACCAAAAGCAAGCCGCCACTGGTTCAGAAAGCCATTCTGTTGA 600
PAB1_G60-2 CTTGAATATTCAAGATGACCAAAAGCAAGCCGCCACTGGTTCAGAAAGCCAATCTGTTGA 600
PAB1_A60-9 CTTGAATATTCAAGATGACCAAAAGCAAGCCGCCACTGGTTCAGAAAGCCAATCTGTTGA 600
PAB1_G60-6 CTTGAATATTCAAGATGACCAAAAGCAAGCCGCCACTGGTTCAGAAAGCCAATCTGTTGA 600
PAB1_G60-7 CTTGAATATTCAAGATGACCAAAAGCAAGCCGCCACTGGTTCAGAAAGCCAATCTGTTGA 600
PAB1_A60-17 CTTGAATATTCAAGATGACCAAAAGCAAGCCGCCACTGGTTCAGAAAGCCAATCTGTTGA 600
*************************************************** ********
PAB1_wt AAACTCTTCTGCATCATTATATGTTGGTGACTTAGAACCTTCTGTTTCCGAAGCCCACTT 660
PAB1_G60-4 AAACTCTTCTGCATCATTATATGTTGGTGACTTAGAACCTTCTGTTTCCGAAGCCCACTT 660
PAB1_G70-1 AAACTCTTCTGCATCATTATATGTTGGTGACTTAGAACCTTCTGTGTCCGAAGCCCACTT 660
PAB1_G60-2 AAACTCTTCTGCATCATTATATGTTGGTGACTTAGAACCTTCTGTTTCCGAAGCCCACTT 660
PAB1_A60-9 AAACTCTTCTGCATCATTATATGTTGGTGACTTAGAACCTTCTGTTTCCGAAGCCCACTT 660
PAB1_G60-6 AAACTCTTCTGCACCATTATATGTTGGTGACTTAGAACCTTCTGTTTCCGAAGCCCACTT 660
PAB1_G60-7 AAACTCTTCTGCATCATTATATGTTGGTGACTTAGAACCTTCTGTTTCCGAAGCCCACTT 660
PAB1_A60-17 AAACTCTTCTGCATCATTATATGTTGGTGACTTAGAACCTTCTGTTTCCGAAGCCCACTT 660
************* ******************************* **************
PAB1_wt ATATGATATCTTCTCTCCAATCGGTTCAGTCTCCTCCATTCGTGTCTGTCGTGATGCCAT 720
PAB1_G60-4 ATATGATATCTTCTCTCCAATCGGTTCAGTCTCCTCCATTCGTGTCTGTCGTGATGCCAT 720
PAB1_G70-1 ATATGATATCTTCTCTCCAATCGGTTCAGTCTCCTCCATTCGTGTCTGTCGTGATGCCAT 720
PAB1_G60-2 ATATGATATCTTCTCTCCAATCGGTTCAGTCTCCTCCATTCGTGTCTGTCGTGATGCCAT 720
PAB1_A60-9 ATATGATATCTTCTCTCCAATCGGTTCAGTCTCCTCCATTCGTGTCTGTCGTGATGCCAT 720
PAB1_G60-6 ATATGATATCTTCTCTCCAATCGGTTCAGTCTCCTCCATTCGTGTCTGTCGTGATGCCAT 720
PAB1_G60-7 ATATGATATCTTCTCTCCAATCGGTTCAGTCTCCTCCATTCGTGTCTGTCGTGATGCCAT 720
PAB1_A60-17 ATATGATATCTTCTCTCCAATCGGTTCAGTCTCCTCCATTCGTGTCTGTCGTGATGCCAT 720
************************************************************
PAB1_wt CACTAAGACCTCTTTGGGCTATGCTTATGTTAACTTTAACGACCATGAAGCCGGCAGAAA 780
PAB1_G60-4 CACTAAGACCTCTTTGGGCTATGCTTATGTTAACTTTAACGACCATGAAGCCGGCAGAAA 780
PAB1_G70-1 CACTAAGACCTCTTTGGGCTATGCTTATGTTAACTTTAACGACCATGAAGCCGGCAGAAA 780
PAB1_G60-2 CACTAAGACCTCTTTGGGCTATGCTTATGTTAACTTTAACGACCATGAAGCCGGCAGAAA 780
PAB1_A60-9 CACTAAGACCTCTTTGGGCTATGCTTATGTTAACTTTAACGACCATGAAGCCGGCAGAAA 780
PAB1_G60-6 CACTAAGACCTCTTTGGGCTATGCTTATGTTAACTTTAACGACCATGAAGCCGGCAGAAA 780
PAB1_G60-7 CACTAAGACCTCTTTGGGCTATGCTTATGTTAACTTTAACGACCATGAAGCCGGCAGAAA 780
PAB1_A60-17 CACTAAGACCTCTTTGGGCTATGCTTATGTTAACTTTAACGACCATGAAGCCGGCAGAAA 780
************************************************************
PAB1_wt AGCAATTGAGCAATTGAACTACACTCCAATCAAGGGTAGATTATGCCGTATTATGTGGTC 840
PAB1_G60-4 AGCAATTGAGCAATTGAACTACACTCCAATCAAGGGTAGATTATGCCGTATTATGTGGTC 840
PAB1_G70-1 AGCAATTGAGCAATTGAACTACACTCCAATCAAGGGTAGATTATGCCGTATTATGTGGTC 840
PAB1_G60-2 AGCAATTGAGCAATTGAACTACACTCCAATCAAGGGTAGATTATGCCGTATTATGTGGTC 840
PAB1_A60-9 AGCAATTGAGCAATTGAACTACACTCCAATCAAGGGTAGATTATGCCGTATTATGTGGTC 840
PAB1_G60-6 AGCAATTGAGCAATTGAACTACACTCCAATCAAGGGTAGATTATGCCGTATTATGTGGTC 840
PAB1_G60-7 AGCAATTGAGCAATTAAACTACACTCCAATCAAGGGTAGATTATGCCGTATTATGTGGTC 840
PAB1_A60-17 AGCAATTGAGCAATTGAACTACACTCCAATCAAGGGTAGATTATGCCGTATTATGTGGTC 840
*************** ********************************************
PAB1_wt TCAACGTGACCCATCATTGAGAAAGAAGGGTTCTGGTAACATCTTTATCAAGAACTTGCA 900
PAB1_G60-4 TCAACGTGACCCATCATTGAGAAAGAAGGGTTCTGGTAACATCTTTATCAAGAACTTGCA 900
PAB1_G70-1 TCAACGTGACCCATCATTGAGAAAGAAGGGTTCTGGTAACATCTTTATCAAGAACTTGCA 900
PAB1_G60-2 TCAACGTGACCCATCATTGAGAAAGAAGGGTTCTGGTAACATCTTTATCAAGAACTTGTA 900
PAB1_A60-9 TCAACGTGACCCATCATTGAGAAAGAAGGGTTCTGGTAACATCTTTATCAAGAACTTGCA 900
PAB1_G60-6 TCAACGTGACCCATCATTGAGAAAGAAGGGTTCTGGTAACACCTTTATCAAGAACTTGCA 900
PAB1_G60-7 TCAACGTGACCCATCATTGAGAAAGAAGGGTTCTGGTAACATCTTTATCAAGAACTTGCA 900
PAB1_A60-17 TCAACGTGACCCATCATTGAGAAAGAAGGGTTCTGGTAACATCTTTATCAAGAACTTGCA 900
***************************************** **************** *
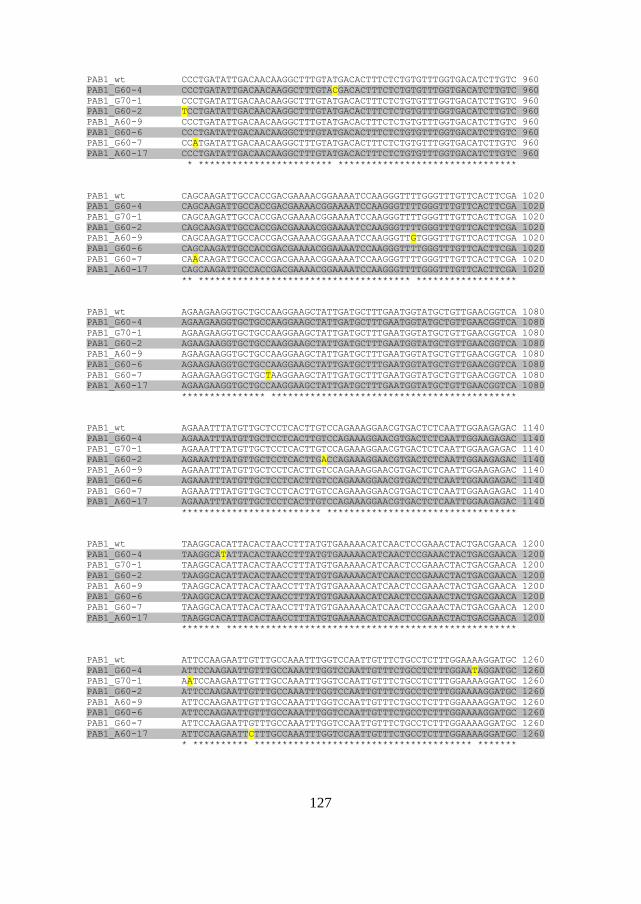
127
PAB1_wt CCCTGATATTGACAACAAGGCTTTGTATGACACTTTCTCTGTGTTTGGTGACATCTTGTC 960
PAB1_G60-4 CCCTGATATTGACAACAAGGCTTTGTACGACACTTTCTCTGTGTTTGGTGACATCTTGTC 960
PAB1_G70-1 CCCTGATATTGACAACAAGGCTTTGTATGACACTTTCTCTGTGTTTGGTGACATCTTGTC 960
PAB1_G60-2 TCCTGATATTGACAACAAGGCTTTGTATGACACTTTCTCTGTGTTTGGTGACATCTTGTC 960
PAB1_A60-9 CCCTGATATTGACAACAAGGCTTTGTATGACACTTTCTCTGTGTTTGGTGACATCTTGTC 960
PAB1_G60-6 CCCTGATATTGACAACAAGGCTTTGTATGACACTTTCTCTGTGTTTGGTGACATCTTGTC 960
PAB1_G60-7 CCATGATATTGACAACAAGGCTTTGTATGACACTTTCTCTGTGTTTGGTGACATCTTGTC 960
PAB1_A60-17 CCCTGATATTGACAACAAGGCTTTGTATGACACTTTCTCTGTGTTTGGTGACATCTTGTC 960
* ************************ ********************************
PAB1_wt CAGCAAGATTGCCACCGACGAAAACGGAAAATCCAAGGGTTTTGGGTTTGTTCACTTCGA 1020
PAB1_G60-4 CAGCAAGATTGCCACCGACGAAAACGGAAAATCCAAGGGTTTTGGGTTTGTTCACTTCGA 1020
PAB1_G70-1 CAGCAAGATTGCCACCGACGAAAACGGAAAATCCAAGGGTTTTGGGTTTGTTCACTTCGA 1020
PAB1_G60-2 CAGCAAGATTGCCACCGACGAAAACGGAAAATCCAAGGGTTTTGGGTTTGTTCACTTCGA 1020
PAB1_A60-9 CAGCAAGATTGCCACCGACGAAAACGGAAAATCCAAGGGTTGTGGGTTTGTTCACTTCGA 1020
PAB1_G60-6 CAGCAAGATTGCCACCGACGAAAACGGAAAATCCAAGGGTTTTGGGTTTGTTCACTTCGA 1020
PAB1_G60-7 CAACAAGATTGCCACCGACGAAAACGGAAAATCCAAGGGTTTTGGGTTTGTTCACTTCGA 1020
PAB1_A60-17 CAGCAAGATTGCCACCGACGAAAACGGAAAATCCAAGGGTTTTGGGTTTGTTCACTTCGA 1020
** ************************************** ******************
PAB1_wt AGAAGAAGGTGCTGCCAAGGAAGCTATTGATGCTTTGAATGGTATGCTGTTGAACGGTCA 1080
PAB1_G60-4 AGAAGAAGGTGCTGCCAAGGAAGCTATTGATGCTTTGAATGGTATGCTGTTGAACGGTCA 1080
PAB1_G70-1 AGAAGAAGGTGCTGCCAAGGAAGCTATTGATGCTTTGAATGGTATGCTGTTGAACGGTCA 1080
PAB1_G60-2 AGAAGAAGGTGCTGCCAAGGAAGCTATTGATGCTTTGAATGGTATGCTGTTGAACGGTCA 1080
PAB1_A60-9 AGAAGAAGGTGCTGCCAAGGAAGCTATTGATGCTTTGAATGGTATGCTGTTGAACGGTCA 1080
PAB1_G60-6 AGAAGAAGGTGCTGCCAAGGAAGCTATTGATGCTTTGAATGGTATGCTGTTGAACGGTCA 1080
PAB1_G60-7 AGAAGAAGGTGCTGCTAAGGAAGCTATTGATGCTTTGAATGGTATGCTGTTGAACGGTCA 1080
PAB1_A60-17 AGAAGAAGGTGCTGCCAAGGAAGCTATTGATGCTTTGAATGGTATGCTGTTGAACGGTCA 1080
*************** ********************************************
PAB1_wt AGAAATTTATGTTGCTCCTCACTTGTCCAGAAAGGAACGTGACTCTCAATTGGAAGAGAC 1140
PAB1_G60-4 AGAAATTTATGTTGCTCCTCACTTGTCCAGAAAGGAACGTGACTCTCAATTGGAAGAGAC 1140
PAB1_G70-1 AGAAATTTATGTTGCTCCTCACTTGTCCAGAAAGGAACGTGACTCTCAATTGGAAGAGAC 1140
PAB1_G60-2 AGAAATTTATGTTGCTCCTCACTTGACCAGAAAGGAACGTGACTCTCAATTGGAAGAGAC 1140
PAB1_A60-9 AGAAATTTATGTTGCTCCTCACTTGTCCAGAAAGGAACGTGACTCTCAATTGGAAGAGAC 1140
PAB1_G60-6 AGAAATTTATGTTGCTCCTCACTTGTCCAGAAAGGAACGTGACTCTCAATTGGAAGAGAC 1140
PAB1_G60-7 AGAAATTTATGTTGCTCCTCACTTGTCCAGAAAGGAACGTGACTCTCAATTGGAAGAGAC 1140
PAB1_A60-17 AGAAATTTATGTTGCTCCTCACTTGTCCAGAAAGGAACGTGACTCTCAATTGGAAGAGAC 1140
************************* **********************************
PAB1_wt TAAGGCACATTACACTAACCTTTATGTGAAAAACATCAACTCCGAAACTACTGACGAACA 1200
PAB1_G60-4 TAAGGCATATTACACTAACCTTTATGTGAAAAACATCAACTCCGAAACTACTGACGAACA 1200
PAB1_G70-1 TAAGGCACATTACACTAACCTTTATGTGAAAAACATCAACTCCGAAACTACTGACGAACA 1200
PAB1_G60-2 TAAGGCACATTACACTAACCTTTATGTGAAAAACATCAACTCCGAAACTACTGACGAACA 1200
PAB1_A60-9 TAAGGCACATTACACTAACCTTTATGTGAAAAACATCAACTCCGAAACTACTGACGAACA 1200
PAB1_G60-6 TAAGGCACATTACACTAACCTTTATGTGAAAAACATCAACTCCGAAACTACTGACGAACA 1200
PAB1_G60-7 TAAGGCACATTACACTAACCTTTATGTGAAAAACATCAACTCCGAAACTACTGACGAACA 1200
PAB1_A60-17 TAAGGCACATTACACTAACCTTTATGTGAAAAACATCAACTCCGAAACTACTGACGAACA 1200
******* ****************************************************
PAB1_wt ATTCCAAGAATTGTTTGCCAAATTTGGTCCAATTGTTTCTGCCTCTTTGGAAAAGGATGC 1260
PAB1_G60-4 ATTCCAAGAATTGTTTGCCAAATTTGGTCCAATTGTTTCTGCCTCTTTGGAATAGGATGC 1260
PAB1_G70-1 AATCCAAGAATTGTTTGCCAAATTTGGTCCAATTGTTTCTGCCTCTTTGGAAAAGGATGC 1260
PAB1_G60-2 ATTCCAAGAATTGTTTGCCAAATTTGGTCCAATTGTTTCTGCCTCTTTGGAAAAGGATGC 1260
PAB1_A60-9 ATTCCAAGAATTGTTTGCCAAATTTGGTCCAATTGTTTCTGCCTCTTTGGAAAAGGATGC 1260
PAB1_G60-6 ATTCCAAGAATTGTTTGCCAAATTTGGTCCAATTGTTTCTGCCTCTTTGGAAAAGGATGC 1260
PAB1_G60-7 ATTCCAAGAATTGTTTGCCAAATTTGGTCCAATTGTTTCTGCCTCTTTGGAAAAGGATGC 1260
PAB1_A60-17 ATTCCAAGAATTCTTTGCCAAATTTGGTCCAATTGTTTCTGCCTCTTTGGAAAAGGATGC 1260
* ********** *************************************** *******
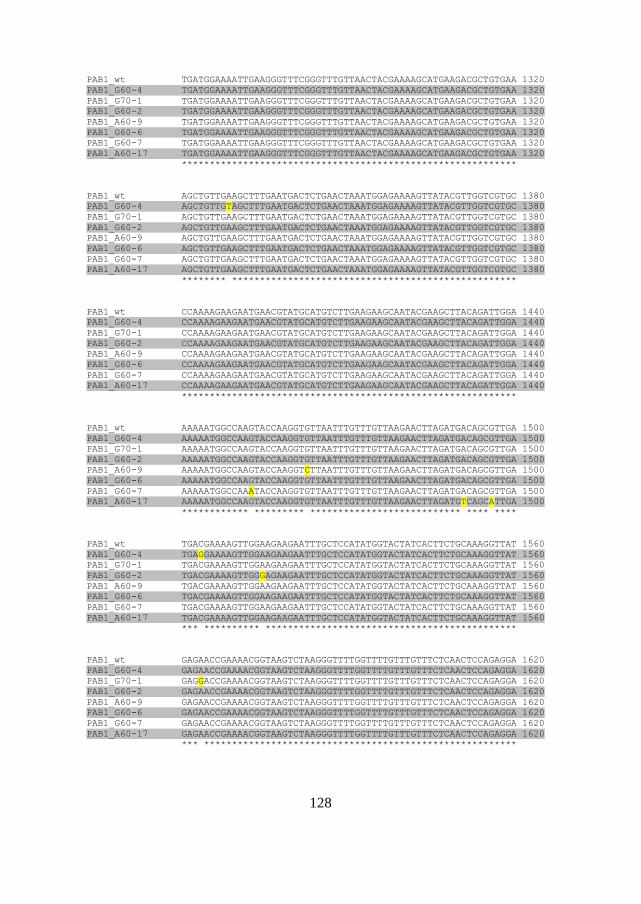
128
PAB1_wt TGATGGAAAATTGAAGGGTTTCGGGTTTGTTAACTACGAAAAGCATGAAGACGCTGTGAA 1320
PAB1_G60-4 TGATGGAAAATTGAAGGGTTTCGGGTTTGTTAACTACGAAAAGCATGAAGACGCTGTGAA 1320
PAB1_G70-1 TGATGGAAAATTGAAGGGTTTCGGGTTTGTTAACTACGAAAAGCATGAAGACGCTGTGAA 1320
PAB1_G60-2 TGATGGAAAATTGAAGGGTTTCGGGTTTGTTAACTACGAAAAGCATGAAGACGCTGTGAA 1320
PAB1_A60-9 TGATGGAAAATTGAAGGGTTTCGGGTTTGTTAACTACGAAAAGCATGAAGACGCTGTGAA 1320
PAB1_G60-6 TGATGGAAAATTGAAGGGTTTCGGGTTTGTTAACTACGAAAAGCATGAAGACGCTGTGAA 1320
PAB1_G60-7 TGATGGAAAATTGAAGGGTTTCGGGTTTGTTAACTACGAAAAGCATGAAGACGCTGTGAA 1320
PAB1_A60-17 TGATGGAAAATTGAAGGGTTTCGGGTTTGTTAACTACGAAAAGCATGAAGACGCTGTGAA 1320
************************************************************
PAB1_wt AGCTGTTGAAGCTTTGAATGACTCTGAACTAAATGGAGAAAAGTTATACGTTGGTCGTGC 1380
PAB1_G60-4 AGCTGTTGTAGCTTTGAATGACTCTGAACTAAATGGAGAAAAGTTATACGTTGGTCGTGC 1380
PAB1_G70-1 AGCTGTTGAAGCTTTGAATGACTCTGAACTAAATGGAGAAAAGTTATACGTTGGTCGTGC 1380
PAB1_G60-2 AGCTGTTGAAGCTTTGAATGACTCTGAACTAAATGGAGAAAAGTTATACGTTGGTCGTGC 1380
PAB1_A60-9 AGCTGTTGAAGCTTTGAATGACTCTGAACTAAATGGAGAAAAGTTATACGTTGGTCGTGC 1380
PAB1_G60-6 AGCTGTTGAAGCTTTGAATGACTCTGAACTAAATGGAGAAAAGTTATACGTTGGTCGTGC 1380
PAB1_G60-7 AGCTGTTGAAGCTTTGAATGACTCTGAACTAAATGGAGAAAAGTTATACGTTGGTCGTGC 1380
PAB1_A60-17 AGCTGTTGAAGCTTTGAATGACTCTGAACTAAATGGAGAAAAGTTATACGTTGGTCGTGC 1380
******** ***************************************************
PAB1_wt CCAAAAGAAGAATGAACGTATGCATGTCTTGAAGAAGCAATACGAAGCTTACAGATTGGA 1440
PAB1_G60-4 CCAAAAGAAGAATGAACGTATGCATGTCTTGAAGAAGCAATACGAAGCTTACAGATTGGA 1440
PAB1_G70-1 CCAAAAGAAGAATGAACGTATGCATGTCTTGAAGAAGCAATACGAAGCTTACAGATTGGA 1440
PAB1_G60-2 CCAAAAGAAGAATGAACGTATGCATGTCTTGAAGAAGCAATACGAAGCTTACAGATTGGA 1440
PAB1_A60-9 CCAAAAGAAGAATGAACGTATGCATGTCTTGAAGAAGCAATACGAAGCTTACAGATTGGA 1440
PAB1_G60-6 CCAAAAGAAGAATGAACGTATGCATGTCTTGAAGAAGCAATACGAAGCTTACAGATTGGA 1440
PAB1_G60-7 CCAAAAGAAGAATGAACGTATGCATGTCTTGAAGAAGCAATACGAAGCTTACAGATTGGA 1440
PAB1_A60-17 CCAAAAGAAGAATGAACGTATGCATGTCTTGAAGAAGCAATACGAAGCTTACAGATTGGA 1440
************************************************************
PAB1_wt AAAAATGGCCAAGTACCAAGGTGTTAATTTGTTTGTTAAGAACTTAGATGACAGCGTTGA 1500
PAB1_G60-4 AAAAATGGCCAAGTACCAAGGTGTTAATTTGTTTGTTAAGAACTTAGATGACAGCGTTGA 1500
PAB1_G70-1 AAAAATGGCCAAGTACCAAGGTGTTAATTTGTTTGTTAAGAACTTAGATGACAGCGTTGA 1500
PAB1_G60-2 AAAAATGGCCAAGTACCAAGGTGTTAATTTGTTTGTTAAGAACTTAGATGACAGCGTTGA 1500
PAB1_A60-9 AAAAATGGCCAAGTACCAAGGTCTTAATTTGTTTGTTAAGAACTTAGATGACAGCGTTGA 1500
PAB1_G60-6 AAAAATGGCCAAGTACCAAGGTGTTAATTTGTTTGTTAAGAACTTAGATGACAGCGTTGA 1500
PAB1_G60-7 AAAAATGGCCAAATACCAAGGTGTTAATTTGTTTGTTAAGAACTTAGATGACAGCGTTGA 1500
PAB1_A60-17 AAAAATGGCCAAGTACCAAGGTGTTAATTTGTTTGTTAAGAACTTAGATGTCAGCATTGA 1500
************ ********* *************************** **** ****
PAB1_wt TGACGAAAAGTTGGAAGAAGAATTTGCTCCATATGGTACTATCACTTCTGCAAAGGTTAT 1560
PAB1_G60-4 TGAGGAAAAGTTGGAAGAAGAATTTGCTCCATATGGTACTATCACTTCTGCAAAGGTTAT 1560
PAB1_G70-1 TGACGAAAAGTTGGAAGAAGAATTTGCTCCATATGGTACTATCACTTCTGCAAAGGTTAT 1560
PAB1_G60-2 TGACGAAAAGTTGGGAGAAGAATTTGCTCCATATGGTACTATCACTTCTGCAAAGGTTAT 1560
PAB1_A60-9 TGACGAAAAGTTGGAAGAAGAATTTGCTCCATATGGTACTATCACTTCTGCAAAGGTTAT 1560
PAB1_G60-6 TGACGAAAAGTTGGAAGAAGAATTTGCTCCATATGGTACTATCACTTCTGCAAAGGTTAT 1560
PAB1_G60-7 TGACGAAAAGTTGGAAGAAGAATTTGCTCCATATGGTACTATCACTTCTGCAAAGGTTAT 1560
PAB1_A60-17 TGACGAAAAGTTGGAAGAAGAATTTGCTCCATATGGTACTATCACTTCTGCAAAGGTTAT 1560
*** ********** *********************************************
PAB1_wt GAGAACCGAAAACGGTAAGTCTAAGGGTTTTGGTTTTGTTTGTTTCTCAACTCCAGAGGA 1620
PAB1_G60-4 GAGAACCGAAAACGGTAAGTCTAAGGGTTTTGGTTTTGTTTGTTTCTCAACTCCAGAGGA 1620
PAB1_G70-1 GAGGACCGAAAACGGTAAGTCTAAGGGTTTTGGTTTTGTTTGTTTCTCAACTCCAGAGGA 1620
PAB1_G60-2 GAGAACCGAAAACGGTAAGTCTAAGGGTTTTGGTTTTGTTTGTTTCTCAACTCCAGAGGA 1620
PAB1_A60-9 GAGAACCGAAAACGGTAAGTCTAAGGGTTTTGGTTTTGTTTGTTTCTCAACTCCAGAGGA 1620
PAB1_G60-6 GAGAACCGAAAACGGTAAGTCTAAGGGTTTTGGTTTTGTTTGTTTCTCAACTCCAGAGGA 1620
PAB1_G60-7 GAGAACCGAAAACGGTAAGTCTAAGGGTTTTGGTTTTGTTTGTTTCTCAACTCCAGAGGA 1620
PAB1_A60-17 GAGAACCGAAAACGGTAAGTCTAAGGGTTTTGGTTTTGTTTGTTTCTCAACTCCAGAGGA 1620
*** ********************************************************
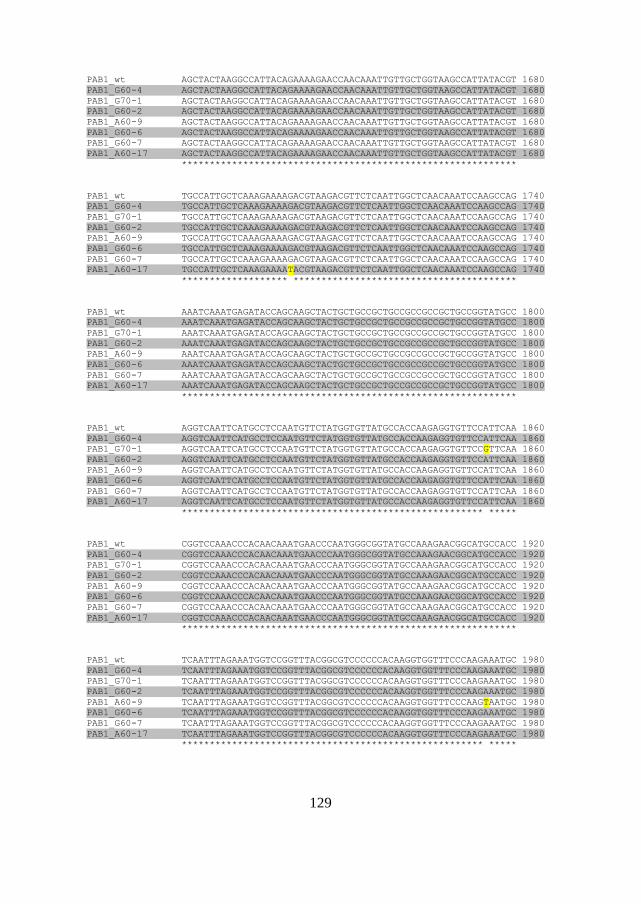
129
PAB1_wt AGCTACTAAGGCCATTACAGAAAAGAACCAACAAATTGTTGCTGGTAAGCCATTATACGT 1680
PAB1_G60-4 AGCTACTAAGGCCATTACAGAAAAGAACCAACAAATTGTTGCTGGTAAGCCATTATACGT 1680
PAB1_G70-1 AGCTACTAAGGCCATTACAGAAAAGAACCAACAAATTGTTGCTGGTAAGCCATTATACGT 1680
PAB1_G60-2 AGCTACTAAGGCCATTACAGAAAAGAACCAACAAATTGTTGCTGGTAAGCCATTATACGT 1680
PAB1_A60-9 AGCTACTAAGGCCATTACAGAAAAGAACCAACAAATTGTTGCTGGTAAGCCATTATACGT 1680
PAB1_G60-6 AGCTACTAAGGCCATTACAGAAAAGAACCAACAAATTGTTGCTGGTAAGCCATTATACGT 1680
PAB1_G60-7 AGCTACTAAGGCCATTACAGAAAAGAACCAACAAATTGTTGCTGGTAAGCCATTATACGT 1680
PAB1_A60-17 AGCTACTAAGGCCATTACAGAAAAGAACCAACAAATTGTTGCTGGTAAGCCATTATACGT 1680
************************************************************
PAB1_wt TGCCATTGCTCAAAGAAAAGACGTAAGACGTTCTCAATTGGCTCAACAAATCCAAGCCAG 1740
PAB1_G60-4 TGCCATTGCTCAAAGAAAAGACGTAAGACGTTCTCAATTGGCTCAACAAATCCAAGCCAG 1740
PAB1_G70-1 TGCCATTGCTCAAAGAAAAGACGTAAGACGTTCTCAATTGGCTCAACAAATCCAAGCCAG 1740
PAB1_G60-2 TGCCATTGCTCAAAGAAAAGACGTAAGACGTTCTCAATTGGCTCAACAAATCCAAGCCAG 1740
PAB1_A60-9 TGCCATTGCTCAAAGAAAAGACGTAAGACGTTCTCAATTGGCTCAACAAATCCAAGCCAG 1740
PAB1_G60-6 TGCCATTGCTCAAAGAAAAGACGTAAGACGTTCTCAATTGGCTCAACAAATCCAAGCCAG 1740
PAB1_G60-7 TGCCATTGCTCAAAGAAAAGACGTAAGACGTTCTCAATTGGCTCAACAAATCCAAGCCAG 1740
PAB1_A60-17 TGCCATTGCTCAAAGAAAATACGTAAGACGTTCTCAATTGGCTCAACAAATCCAAGCCAG 1740
******************* ****************************************
PAB1_wt AAATCAAATGAGATACCAGCAAGCTACTGCTGCCGCTGCCGCCGCCGCTGCCGGTATGCC 1800
PAB1_G60-4 AAATCAAATGAGATACCAGCAAGCTACTGCTGCCGCTGCCGCCGCCGCTGCCGGTATGCC 1800
PAB1_G70-1 AAATCAAATGAGATACCAGCAAGCTACTGCTGCCGCTGCCGCCGCCGCTGCCGGTATGCC 1800
PAB1_G60-2 AAATCAAATGAGATACCAGCAAGCTACTGCTGCCGCTGCCGCCGCCGCTGCCGGTATGCC 1800
PAB1_A60-9 AAATCAAATGAGATACCAGCAAGCTACTGCTGCCGCTGCCGCCGCCGCTGCCGGTATGCC 1800
PAB1_G60-6 AAATCAAATGAGATACCAGCAAGCTACTGCTGCCGCTGCCGCCGCCGCTGCCGGTATGCC 1800
PAB1_G60-7 AAATCAAATGAGATACCAGCAAGCTACTGCTGCCGCTGCCGCCGCCGCTGCCGGTATGCC 1800
PAB1_A60-17 AAATCAAATGAGATACCAGCAAGCTACTGCTGCCGCTGCCGCCGCCGCTGCCGGTATGCC 1800
************************************************************
PAB1_wt AGGTCAATTCATGCCTCCAATGTTCTATGGTGTTATGCCACCAAGAGGTGTTCCATTCAA 1860
PAB1_G60-4 AGGTCAATTCATGCCTCCAATGTTCTATGGTGTTATGCCACCAAGAGGTGTTCCATTCAA 1860
PAB1_G70-1 AGGTCAATTCATGCCTCCAATGTTCTATGGTGTTATGCCACCAAGAGGTGTTCCGTTCAA 1860
PAB1_G60-2 AGGTCAATTCATGCCTCCAATGTTCTATGGTGTTATGCCACCAAGAGGTGTTCCATTCAA 1860
PAB1_A60-9 AGGTCAATTCATGCCTCCAATGTTCTATGGTGTTATGCCACCAAGAGGTGTTCCATTCAA 1860
PAB1_G60-6 AGGTCAATTCATGCCTCCAATGTTCTATGGTGTTATGCCACCAAGAGGTGTTCCATTCAA 1860
PAB1_G60-7 AGGTCAATTCATGCCTCCAATGTTCTATGGTGTTATGCCACCAAGAGGTGTTCCATTCAA 1860
PAB1_A60-17 AGGTCAATTCATGCCTCCAATGTTCTATGGTGTTATGCCACCAAGAGGTGTTCCATTCAA 1860
****************************************************** *****
PAB1_wt CGGTCCAAACCCACAACAAATGAACCCAATGGGCGGTATGCCAAAGAACGGCATGCCACC 1920
PAB1_G60-4 CGGTCCAAACCCACAACAAATGAACCCAATGGGCGGTATGCCAAAGAACGGCATGCCACC 1920
PAB1_G70-1 CGGTCCAAACCCACAACAAATGAACCCAATGGGCGGTATGCCAAAGAACGGCATGCCACC 1920
PAB1_G60-2 CGGTCCAAACCCACAACAAATGAACCCAATGGGCGGTATGCCAAAGAACGGCATGCCACC 1920
PAB1_A60-9 CGGTCCAAACCCACAACAAATGAACCCAATGGGCGGTATGCCAAAGAACGGCATGCCACC 1920
PAB1_G60-6 CGGTCCAAACCCACAACAAATGAACCCAATGGGCGGTATGCCAAAGAACGGCATGCCACC 1920
PAB1_G60-7 CGGTCCAAACCCACAACAAATGAACCCAATGGGCGGTATGCCAAAGAACGGCATGCCACC 1920
PAB1_A60-17 CGGTCCAAACCCACAACAAATGAACCCAATGGGCGGTATGCCAAAGAACGGCATGCCACC 1920
************************************************************
PAB1_wt TCAATTTAGAAATGGTCCGGTTTACGGCGTCCCCCCACAAGGTGGTTTCCCAAGAAATGC 1980
PAB1_G60-4 TCAATTTAGAAATGGTCCGGTTTACGGCGTCCCCCCACAAGGTGGTTTCCCAAGAAATGC 1980
PAB1_G70-1 TCAATTTAGAAATGGTCCGGTTTACGGCGTCCCCCCACAAGGTGGTTTCCCAAGAAATGC 1980
PAB1_G60-2 TCAATTTAGAAATGGTCCGGTTTACGGCGTCCCCCCACAAGGTGGTTTCCCAAGAAATGC 1980
PAB1_A60-9 TCAATTTAGAAATGGTCCGGTTTACGGCGTCCCCCCACAAGGTGGTTTCCCAAGTAATGC 1980
PAB1_G60-6 TCAATTTAGAAATGGTCCGGTTTACGGCGTCCCCCCACAAGGTGGTTTCCCAAGAAATGC 1980
PAB1_G60-7 TCAATTTAGAAATGGTCCGGTTTACGGCGTCCCCCCACAAGGTGGTTTCCCAAGAAATGC 1980
PAB1_A60-17 TCAATTTAGAAATGGTCCGGTTTACGGCGTCCCCCCACAAGGTGGTTTCCCAAGAAATGC 1980
****************************************************** *****
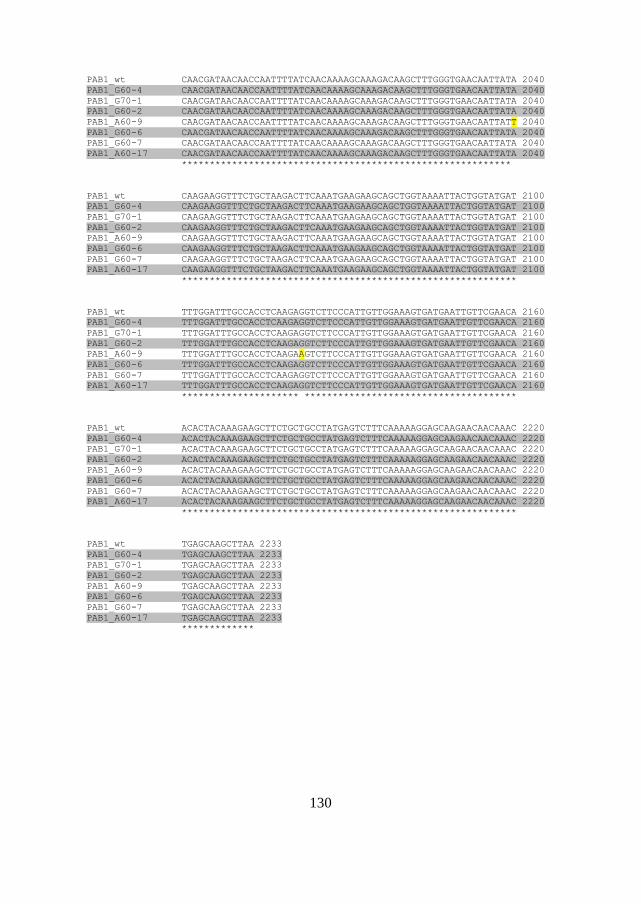
130
PAB1_wt CAACGATAACAACCAATTTTATCAACAAAAGCAAAGACAAGCTTTGGGTGAACAATTATA 2040
PAB1_G60-4 CAACGATAACAACCAATTTTATCAACAAAAGCAAAGACAAGCTTTGGGTGAACAATTATA 2040
PAB1_G70-1 CAACGATAACAACCAATTTTATCAACAAAAGCAAAGACAAGCTTTGGGTGAACAATTATA 2040
PAB1_G60-2 CAACGATAACAACCAATTTTATCAACAAAAGCAAAGACAAGCTTTGGGTGAACAATTATA 2040
PAB1_A60-9 CAACGATAACAACCAATTTTATCAACAAAAGCAAAGACAAGCTTTGGGTGAACAATTATT 2040
PAB1_G60-6 CAACGATAACAACCAATTTTATCAACAAAAGCAAAGACAAGCTTTGGGTGAACAATTATA 2040
PAB1_G60-7 CAACGATAACAACCAATTTTATCAACAAAAGCAAAGACAAGCTTTGGGTGAACAATTATA 2040
PAB1_A60-17 CAACGATAACAACCAATTTTATCAACAAAAGCAAAGACAAGCTTTGGGTGAACAATTATA 2040
***********************************************************
PAB1_wt CAAGAAGGTTTCTGCTAAGACTTCAAATGAAGAAGCAGCTGGTAAAATTACTGGTATGAT 2100
PAB1_G60-4 CAAGAAGGTTTCTGCTAAGACTTCAAATGAAGAAGCAGCTGGTAAAATTACTGGTATGAT 2100
PAB1_G70-1 CAAGAAGGTTTCTGCTAAGACTTCAAATGAAGAAGCAGCTGGTAAAATTACTGGTATGAT 2100
PAB1_G60-2 CAAGAAGGTTTCTGCTAAGACTTCAAATGAAGAAGCAGCTGGTAAAATTACTGGTATGAT 2100
PAB1_A60-9 CAAGAAGGTTTCTGCTAAGACTTCAAATGAAGAAGCAGCTGGTAAAATTACTGGTATGAT 2100
PAB1_G60-6 CAAGAAGGTTTCTGCTAAGACTTCAAATGAAGAAGCAGCTGGTAAAATTACTGGTATGAT 2100
PAB1_G60-7 CAAGAAGGTTTCTGCTAAGACTTCAAATGAAGAAGCAGCTGGTAAAATTACTGGTATGAT 2100
PAB1_A60-17 CAAGAAGGTTTCTGCTAAGACTTCAAATGAAGAAGCAGCTGGTAAAATTACTGGTATGAT 2100
************************************************************
PAB1_wt TTTGGATTTGCCACCTCAAGAGGTCTTCCCATTGTTGGAAAGTGATGAATTGTTCGAACA 2160
PAB1_G60-4 TTTGGATTTGCCACCTCAAGAGGTCTTCCCATTGTTGGAAAGTGATGAATTGTTCGAACA 2160
PAB1_G70-1 TTTGGATTTGCCACCTCAAGAGGTCTTCCCATTGTTGGAAAGTGATGAATTGTTCGAACA 2160
PAB1_G60-2 TTTGGATTTGCCACCTCAAGAGGTCTTCCCATTGTTGGAAAGTGATGAATTGTTCGAACA 2160
PAB1_A60-9 TTTGGATTTGCCACCTCAAGAAGTCTTCCCATTGTTGGAAAGTGATGAATTGTTCGAACA 2160
PAB1_G60-6 TTTGGATTTGCCACCTCAAGAGGTCTTCCCATTGTTGGAAAGTGATGAATTGTTCGAACA 2160
PAB1_G60-7 TTTGGATTTGCCACCTCAAGAGGTCTTCCCATTGTTGGAAAGTGATGAATTGTTCGAACA 2160
PAB1_A60-17 TTTGGATTTGCCACCTCAAGAGGTCTTCCCATTGTTGGAAAGTGATGAATTGTTCGAACA 2160
********************* **************************************
PAB1_wt ACACTACAAAGAAGCTTCTGCTGCCTATGAGTCTTTCAAAAAGGAGCAAGAACAACAAAC 2220
PAB1_G60-4 ACACTACAAAGAAGCTTCTGCTGCCTATGAGTCTTTCAAAAAGGAGCAAGAACAACAAAC 2220
PAB1_G70-1 ACACTACAAAGAAGCTTCTGCTGCCTATGAGTCTTTCAAAAAGGAGCAAGAACAACAAAC 2220
PAB1_G60-2 ACACTACAAAGAAGCTTCTGCTGCCTATGAGTCTTTCAAAAAGGAGCAAGAACAACAAAC 2220
PAB1_A60-9 ACACTACAAAGAAGCTTCTGCTGCCTATGAGTCTTTCAAAAAGGAGCAAGAACAACAAAC 2220
PAB1_G60-6 ACACTACAAAGAAGCTTCTGCTGCCTATGAGTCTTTCAAAAAGGAGCAAGAACAACAAAC 2220
PAB1_G60-7 ACACTACAAAGAAGCTTCTGCTGCCTATGAGTCTTTCAAAAAGGAGCAAGAACAACAAAC 2220
PAB1_A60-17 ACACTACAAAGAAGCTTCTGCTGCCTATGAGTCTTTCAAAAAGGAGCAAGAACAACAAAC 2220
************************************************************
PAB1_wt TGAGCAAGCTTAA 2233
PAB1_G60-4 TGAGCAAGCTTAA 2233
PAB1_G70-1 TGAGCAAGCTTAA 2233
PAB1_G60-2 TGAGCAAGCTTAA 2233
PAB1_A60-9 TGAGCAAGCTTAA 2233
PAB1_G60-6 TGAGCAAGCTTAA 2233
PAB1_G60-7 TGAGCAAGCTTAA 2233
PAB1_A60-17 TGAGCAAGCTTAA 2233
*************
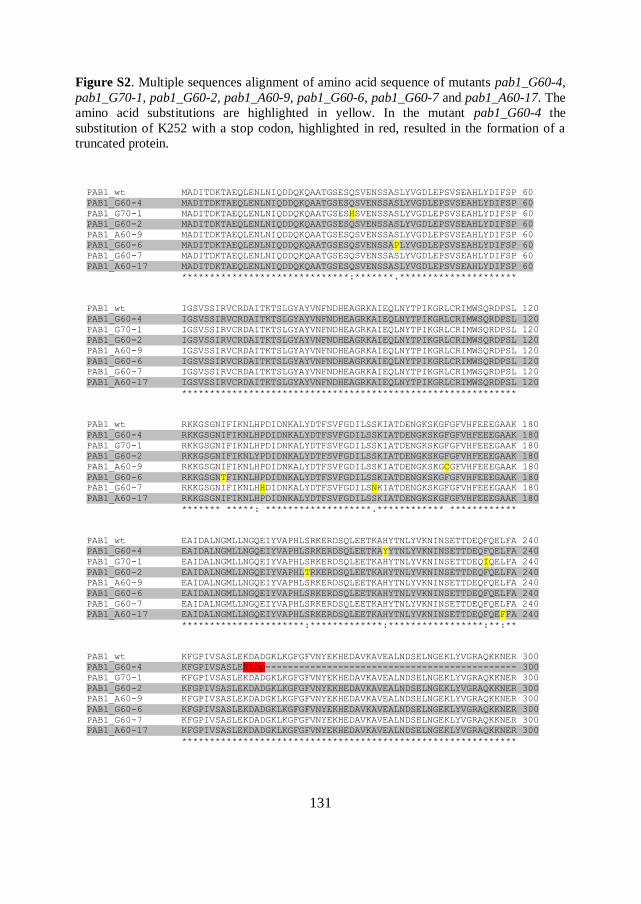
131
Figure S2. Multiple sequences alignment of amino acid sequence of mutants pab1_G60-4,
pab1_G70-1, pab1_G60-2, pab1_A60-9, pab1_G60-6, pab1_G60-7 and pab1_A60-17. The
amino acid substitutions are highlighted in yellow. In the mutant pab1_G60-4 the
substitution of K252 with a stop codon, highlighted in red, resulted in the formation of a
truncated protein.
PAB1_wt MADITDKTAEQLENLNIQDDQKQAATGSESQSVENSSASLYVGDLEPSVSEAHLYDIFSP 60
PAB1_G60-4 MADITDKTAEQLENLNIQDDQKQAATGSESQSVENSSASLYVGDLEPSVSEAHLYDIFSP 60
PAB1_G70-1 MADITDKTAEQLENLNIQDDQKQAATGSESHSVENSSASLYVGDLEPSVSEAHLYDIFSP 60
PAB1_G60-2 MADITDKTAEQLENLNIQDDQKQAATGSESQSVENSSASLYVGDLEPSVSEAHLYDIFSP 60
PAB1_A60-9 MADITDKTAEQLENLNIQDDQKQAATGSESQSVENSSASLYVGDLEPSVSEAHLYDIFSP 60
PAB1_G60-6 MADITDKTAEQLENLNIQDDQKQAATGSESQSVENSSAPLYVGDLEPSVSEAHLYDIFSP 60
PAB1_G60-7 MADITDKTAEQLENLNIQDDQKQAATGSESQSVENSSASLYVGDLEPSVSEAHLYDIFSP 60
PAB1_A60-17 MADITDKTAEQLENLNIQDDQKQAATGSESQSVENSSASLYVGDLEPSVSEAHLYDIFSP 60
******************************:*******.*********************
PAB1_wt IGSVSSIRVCRDAITKTSLGYAYVNFNDHEAGRKAIEQLNYTPIKGRLCRIMWSQRDPSL 120
PAB1_G60-4 IGSVSSIRVCRDAITKTSLGYAYVNFNDHEAGRKAIEQLNYTPIKGRLCRIMWSQRDPSL 120
PAB1_G70-1 IGSVSSIRVCRDAITKTSLGYAYVNFNDHEAGRKAIEQLNYTPIKGRLCRIMWSQRDPSL 120
PAB1_G60-2 IGSVSSIRVCRDAITKTSLGYAYVNFNDHEAGRKAIEQLNYTPIKGRLCRIMWSQRDPSL 120
PAB1_A60-9 IGSVSSIRVCRDAITKTSLGYAYVNFNDHEAGRKAIEQLNYTPIKGRLCRIMWSQRDPSL 120
PAB1_G60-6 IGSVSSIRVCRDAITKTSLGYAYVNFNDHEAGRKAIEQLNYTPIKGRLCRIMWSQRDPSL 120
PAB1_G60-7 IGSVSSIRVCRDAITKTSLGYAYVNFNDHEAGRKAIEQLNYTPIKGRLCRIMWSQRDPSL 120
PAB1_A60-17 IGSVSSIRVCRDAITKTSLGYAYVNFNDHEAGRKAIEQLNYTPIKGRLCRIMWSQRDPSL 120
************************************************************
PAB1_wt RKKGSGNIFIKNLHPDIDNKALYDTFSVFGDILSSKIATDENGKSKGFGFVHFEEEGAAK 180
PAB1_G60-4 RKKGSGNIFIKNLHPDIDNKALYDTFSVFGDILSSKIATDENGKSKGFGFVHFEEEGAAK 180
PAB1_G70-1 RKKGSGNIFIKNLHPDIDNKALYDTFSVFGDILSSKIATDENGKSKGFGFVHFEEEGAAK 180
PAB1_G60-2 RKKGSGNIFIKNLYPDIDNKALYDTFSVFGDILSSKIATDENGKSKGFGFVHFEEEGAAK 180
PAB1_A60-9 RKKGSGNIFIKNLHPDIDNKALYDTFSVFGDILSSKIATDENGKSKGCGFVHFEEEGAAK 180
PAB1_G60-6 RKKGSGNTFIKNLHPDIDNKALYDTFSVFGDILSSKIATDENGKSKGFGFVHFEEEGAAK 180
PAB1_G60-7 RKKGSGNIFIKNLHHDIDNKALYDTFSVFGDILSNKIATDENGKSKGFGFVHFEEEGAAK 180
PAB1_A60-17 RKKGSGNIFIKNLHPDIDNKALYDTFSVFGDILSSKIATDENGKSKGFGFVHFEEEGAAK 180
******* *****: *******************.************ ************
PAB1_wt EAIDALNGMLLNGQEIYVAPHLSRKERDSQLEETKAHYTNLYVKNINSETTDEQFQELFA 240
PAB1_G60-4 EAIDALNGMLLNGQEIYVAPHLSRKERDSQLEETKAYYTNLYVKNINSETTDEQFQELFA 240
PAB1_G70-1 EAIDALNGMLLNGQEIYVAPHLSRKERDSQLEETKAHYTNLYVKNINSETTDEQIQELFA 240
PAB1_G60-2 EAIDALNGMLLNGQEIYVAPHLTRKERDSQLEETKAHYTNLYVKNINSETTDEQFQELFA 240
PAB1_A60-9 EAIDALNGMLLNGQEIYVAPHLSRKERDSQLEETKAHYTNLYVKNINSETTDEQFQELFA 240
PAB1_G60-6 EAIDALNGMLLNGQEIYVAPHLSRKERDSQLEETKAHYTNLYVKNINSETTDEQFQELFA 240
PAB1_G60-7 EAIDALNGMLLNGQEIYVAPHLSRKERDSQLEETKAHYTNLYVKNINSETTDEQFQELFA 240
PAB1_A60-17 EAIDALNGMLLNGQEIYVAPHLSRKERDSQLEETKAHYTNLYVKNINSETTDEQFQEFFA 240
**********************:*************:*****************:**:**
PAB1_wt KFGPIVSASLEKDADGKLKGFGFVNYEKHEDAVKAVEALNDSELNGEKLYVGRAQKKNER 300
PAB1_G60-4 KFGPIVSASLEStop--------------------------------------------- 300
PAB1_G70-1 KFGPIVSASLEKDADGKLKGFGFVNYEKHEDAVKAVEALNDSELNGEKLYVGRAQKKNER 300
PAB1_G60-2 KFGPIVSASLEKDADGKLKGFGFVNYEKHEDAVKAVEALNDSELNGEKLYVGRAQKKNER 300
PAB1_A60-9 KFGPIVSASLEKDADGKLKGFGFVNYEKHEDAVKAVEALNDSELNGEKLYVGRAQKKNER 300
PAB1_G60-6 KFGPIVSASLEKDADGKLKGFGFVNYEKHEDAVKAVEALNDSELNGEKLYVGRAQKKNER 300
PAB1_G60-7 KFGPIVSASLEKDADGKLKGFGFVNYEKHEDAVKAVEALNDSELNGEKLYVGRAQKKNER 300
PAB1_A60-17 KFGPIVSASLEKDADGKLKGFGFVNYEKHEDAVKAVEALNDSELNGEKLYVGRAQKKNER 300
************************************************************

132
PAB1_wt MHVLKKQYEAYRLEKMAKYQGVNLFVKNLDDSVDDEKLEEEFAPYGTITSAKVMRTENGK 360
PAB1_G60-4 ------------------------------------------------------------ 360
PAB1_G70-1 MHVLKKQYEAYRLEKMAKYQGVNLFVKNLDDSVDDEKLEEEFAPYGTITSAKVMRTENGK 360
PAB1_G60-2 MHVLKKQYEAYRLEKMAKYQGVNLFVKNLDDSVDDEKLGEEFAPYGTITSAKVMRTENGK 360
PAB1_A60-9 MHVLKKQYEAYRLEKMAKYQGLNLFVKNLDDSVDDEKLEEEFAPYGTITSAKVMRTENGK 360
PAB1_G60-6 MHVLKKQYEAYRLEKMAKYQGVNLFVKNLDDSVDDEKLEEEFAPYGTITSAKVMRTENGK 360
PAB1_G60-7 MHVLKKQYEAYRLEKMAKYQGVNLFVKNLDDSVDDEKLEEEFAPYGTITSAKVMRTENGK 360
PAB1_A60-17 MHVLKKQYEAYRLEKMAKYQGVNLFVKNLDVSIDDEKLEEEFAPYGTITSAKVMRTENGK 360
*********************:******** *:*:*** *********************
PAB1_wt SKGFGFVCFSTPEEATKAITEKNQQIVAGKPLYVAIAQRKDVRRSQLAQQIQARNQMRYQ 420
PAB1_G60-4 ------------------------------------------------------------ 420
PAB1_G70-1 SKGFGFVCFSTPEEATKAITEKNQQIVAGKPLYVAIAQRKDVRRSQLAQQIQARNQMRYQ 420
PAB1_G60-2 SKGFGFVCFSTPEEATKAITEKNQQIVAGKPLYVAIAQRKDVRRSQLAQQIQARNQMRYQ 420
PAB1_A60-9 SKGFGFVCFSTPEEATKAITEKNQQIVAGKPLYVAIAQRKDVRRSQLAQQIQARNQMRYQ 420
PAB1_G60-6 SKGFGFVCFSTPEEATKAITEKNQQIVAGKPLYVAIAQRKDVRRSQLAQQIQARNQMRYQ 420
PAB1_G60-7 SKGFGFVCFSTPEEATKAITEKNQQIVAGKPLYVAIAQRKDVRRSQLAQQIQARNQMRYQ 420
PAB1_A60-17 SKGFGFVCFSTPEEATKAITEKNQQIVAGKPLYVAIAQRKYVRRSQLAQQIQARNQMRYQ 420
**************************************** *******************
PAB1_wt QATAAAAAAAAGMPGQFMPPMFYGVMPPRGVPFNGPNPQQMNPMGGMPKNGMPPQFRNGP 480
PAB1_G60-4 ------------------------------------------------------------ 480
PAB1_G70-1 QATAAAAAAAAGMPGQFMPPMFYGVMPPRGVPFNGPNPQQMNPMGGMPKNGMPPQFRNGP 480
PAB1_G60-2 QATAAAAAAAAGMPGQFMPPMFYGVMPPRGVPFNGPNPQQMNPMGGMPKNGMPPQFRNGP 480
PAB1_A60-9 QATAAAAAAAAGMPGQFMPPMFYGVMPPRGVPFNGPNPQQMNPMGGMPKNGMPPQFRNGP 480
PAB1_G60-6 QATAAAAAAAAGMPGQFMPPMFYGVMPPRGVPFNGPNPQQMNPMGGMPKNGMPPQFRNGP 480
PAB1_G60-7 QATAAAAAAAAGMPGQFMPPMFYGVMPPRGVPFNGPNPQQMNPMGGMPKNGMPPQFRNGP 480
PAB1_A60-17 QATAAAAAAAAGMPGQFMPPMFYGVMPPRGVPFNGPNPQQMNPMGGMPKNGMPPQFRNGP 480
************************************************************
PAB1_wt VYGVPPQGGFPRNANDNNQFYQQKQRQALGEQLYKKVSAKTSNEEAAGKITGMILDLPPQ 540
PAB1_G60-4 ------------------------------------------------------------ 540
PAB1_G70-1 VYGVPPQGGFPRNANDNNQFYQQKQRQALGEQLYKKVSAKTSNEEAAGKITGMILDLPPQ 540
PAB1_G60-2 VYGVPPQGGFPRNANDNNQFYQQKQRQALGEQLYKKVSAKTSNEEAAGKITGMILDLPPQ 540
PAB1_A60-9 VYGVPPQGGFPSNANDNNQFYQQKQRQALGEQLFKKVSAKTSNEEAAGKITGMILDLPPQ 540
PAB1_G60-6 VYGVPPQGGFPRNANDNNQFYQQKQRQALGEQLYKKVSAKTSNEEAAGKITGMILDLPPQ 540
PAB1_G60-7 VYGVPPQGGFPRNANDNNQFYQQKQRQALGEQLYKKVSAKTSNEEAAGKITGMILDLPPQ 540
PAB1_A60-17 VYGVPPQGGFPRNANDNNQFYQQKQRQALGEQLYKKVSAKTSNEEAAGKITGMILDLPPQ 540
*********** *********************:**************************
PAB1_wt EVFPLLESDELFEQHYKEASAAYESFKKEQEQQTEQA 577
PAB1_G60-4 ------------------------------------- 577
PAB1_G70-1 EVFPLLESDELFEQHYKEASAAYESFKKEQEQQTEQA 577
PAB1_G60-2 EVFPLLESDELFEQHYKEASAAYESFKKEQEQQTEQA 577
PAB1_A60-9 EVFPLLESDELFEQHYKEASAAYESFKKEQEQQTEQA 577
PAB1_G60-6 EVFPLLESDELFEQHYKEASAAYESFKKEQEQQTEQA 577
PAB1_G60-7 EVFPLLESDELFEQHYKEASAAYESFKKEQEQQTEQA 577
PAB1_A60-17 EVFPLLESDELFEQHYKEASAAYESFKKEQEQQTEQA 577
*************************************

133
Conclusions

134
135
The results presented in this work demonstrated that the engineering of both the
intracellular antioxidant availability and the mRNA metabolism are efficient
strategies to improve the robustness of a cell factory.
In one case, the goal was obtained through the metabolic engineering of a S.
cerevisiae strain for the intracellular production of the highly effective antioxidant
L-ascorbic acid. This strain was shown to be more resistant to acetic acid
principally because of a lower ROS accumulation compared with the parental
strain. Furthermore, the discovery that in the L-AA producing strain some
endogenous stress response mechanisms were reduced suggests that the production
of this antioxidant can reorganize the stress response at different levels. Moreover,
an effect on lifespan and on acetate consumption during CLS experiments was
observed. Despite the mechanisms of these phenomena have not been established
yet, it is therefore possible to speculate that the phenotype of the engineered strain
may be also the result of some interactions of L-AA with the endogenous cellular
mechanisms. Remarkably, the extended survival in stationary phase (CLS)
exhibited by the L-AA producing strain is an additional important trait that might
be exploited in industrial processes where re-pitching is used, or in those requiring
the production during stationary phase, such as the production of secondary
metabolites.
An increased resistance to acetic acid was also obtained through the modulation of
abundance or with variants of the poly(A)-binding protein Pab1, one of the key
molecule involved in the control of mRNA metabolism. This approach was applied
with the aim to obtain an improved phenotype by modifying global gene
expression at the post-transcriptional level. Although the effect of this engineering
approach on mRNA stability, storage, and translation has yet to be verified at the
molecular level, the preliminary results clearly show an improvement of acetic acid
tolerance in growth experiments and an effect on stress granule dimension and
persistence. Future experiments will be run in bioreactor, in conditions approaching
136
industrial production, to verify the robustness of the obtained results. Furthermore,
additional experiments on mutant strains will help in clarifying the effect of the
Pab1 variants, providing useful information about its role in cells.
The results reported in this thesis strongly suggest that the engineering of vitamin
C production (or, more generally, of the antioxidant level) or of the mRNA
metabolism may represent effective approaches to improve a cell factory. We
suggest that, similarly to whole genome wide engineering approaches, these
methods can allow the obtainment of complex phenotypes. Remarkably, by altering
the redox balance or the post-transcriptional control, the results of said
modifications are more directly connected to protein translation/levels and to their
function.

137
References

138
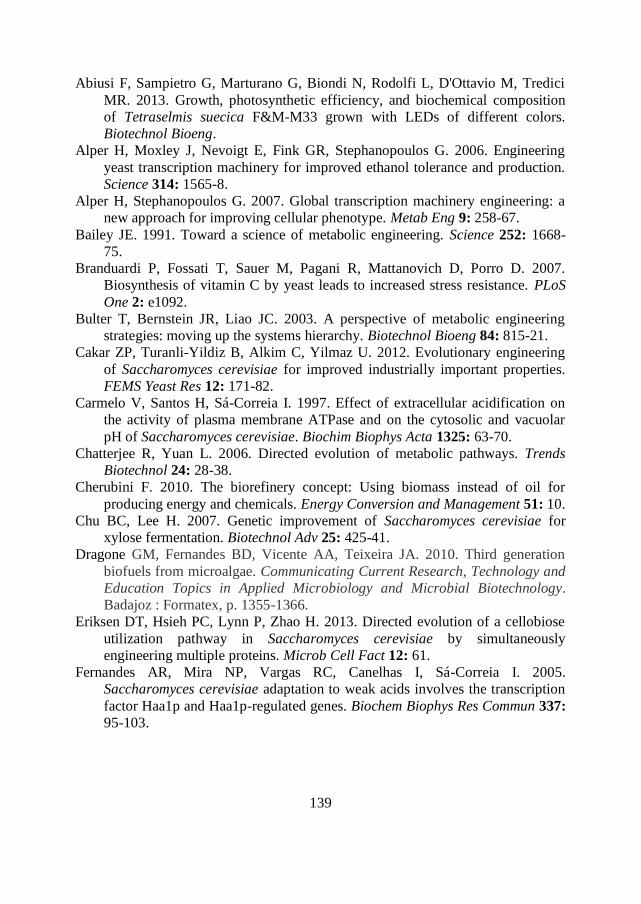
139
Abiusi F, Sampietro G, Marturano G, Biondi N, Rodolfi L, D'Ottavio M, Tredici
MR. 2013. Growth, photosynthetic efficiency, and biochemical composition
of Tetraselmis suecica F&M-M33 grown with LEDs of different colors.
Biotechnol Bioeng.
Alper H, Moxley J, Nevoigt E, Fink GR, Stephanopoulos G. 2006. Engineering
yeast transcription machinery for improved ethanol tolerance and production.
Science 314: 1565-8.
Alper H, Stephanopoulos G. 2007. Global transcription machinery engineering: a
new approach for improving cellular phenotype. Metab Eng 9: 258-67.
Bailey JE. 1991. Toward a science of metabolic engineering. Science 252: 1668-
75.
Branduardi P, Fossati T, Sauer M, Pagani R, Mattanovich D, Porro D. 2007.
Biosynthesis of vitamin C by yeast leads to increased stress resistance. PLoS
One 2: e1092.
Bulter T, Bernstein JR, Liao JC. 2003. A perspective of metabolic engineering
strategies: moving up the systems hierarchy. Biotechnol Bioeng 84: 815-21.
Cakar ZP, Turanli-Yildiz B, Alkim C, Yilmaz U. 2012. Evolutionary engineering
of Saccharomyces cerevisiae for improved industrially important properties.
FEMS Yeast Res 12: 171-82.
Carmelo V, Santos H, Sá-Correia I. 1997. Effect of extracellular acidification on
the activity of plasma membrane ATPase and on the cytosolic and vacuolar
pH of Saccharomyces cerevisiae. Biochim Biophys Acta 1325: 63-70.
Chatterjee R, Yuan L. 2006. Directed evolution of metabolic pathways. Trends
Biotechnol 24: 28-38.
Cherubini F. 2010. The biorefinery concept: Using biomass instead of oil for
producing energy and chemicals. Energy Conversion and Management 51: 10.
Chu BC, Lee H. 2007. Genetic improvement of Saccharomyces cerevisiae for
xylose fermentation. Biotechnol Adv 25: 425-41.
Dragone GM, Fernandes BD, Vicente AA, Teixeira JA. 2010. Third generation
biofuels from microalgae. Communicating Current Research, Technology and
Education Topics in Applied Microbiology and Microbial Biotechnology.
Badajoz : Formatex, p. 1355-1366.
Eriksen DT, Hsieh PC, Lynn P, Zhao H. 2013. Directed evolution of a cellobiose
utilization pathway in Saccharomyces cerevisiae by simultaneously
engineering multiple proteins. Microb Cell Fact 12: 61.
Fernandes AR, Mira NP, Vargas RC, Canelhas I, Sá-Correia I. 2005.
Saccharomyces cerevisiae adaptation to weak acids involves the transcription
factor Haa1p and Haa1p-regulated genes. Biochem Biophys Res Commun 337:
95-103.
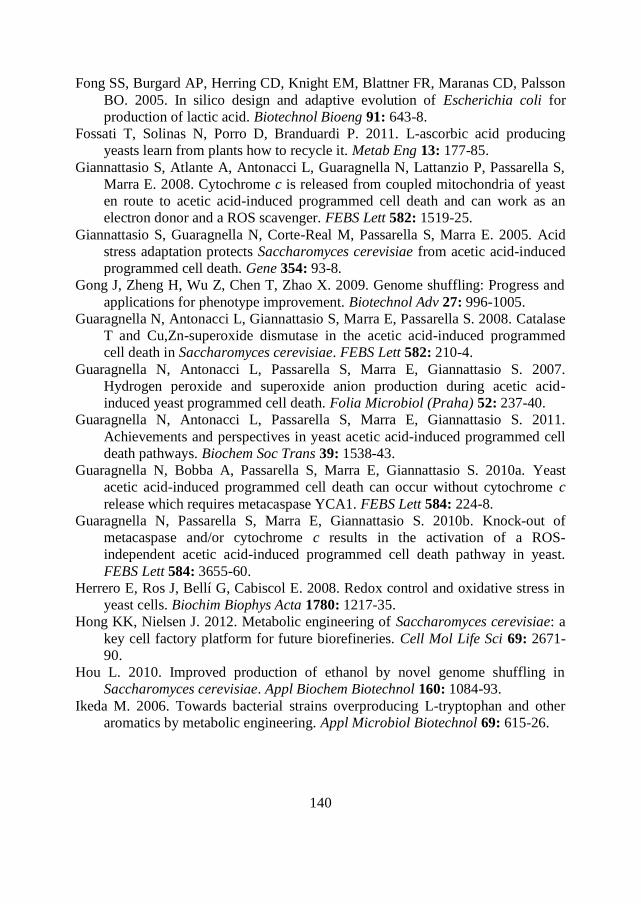
140
Fong SS, Burgard AP, Herring CD, Knight EM, Blattner FR, Maranas CD, Palsson
BO. 2005. In silico design and adaptive evolution of Escherichia coli for
production of lactic acid. Biotechnol Bioeng 91: 643-8.
Fossati T, Solinas N, Porro D, Branduardi P. 2011. L-ascorbic acid producing
yeasts learn from plants how to recycle it. Metab Eng 13: 177-85.
Giannattasio S, Atlante A, Antonacci L, Guaragnella N, Lattanzio P, Passarella S,
Marra E. 2008. Cytochrome c is released from coupled mitochondria of yeast
en route to acetic acid-induced programmed cell death and can work as an
electron donor and a ROS scavenger. FEBS Lett 582: 1519-25.
Giannattasio S, Guaragnella N, Corte-Real M, Passarella S, Marra E. 2005. Acid
stress adaptation protects Saccharomyces cerevisiae from acetic acid-induced
programmed cell death. Gene 354: 93-8.
Gong J, Zheng H, Wu Z, Chen T, Zhao X. 2009. Genome shuffling: Progress and
applications for phenotype improvement. Biotechnol Adv 27: 996-1005.
Guaragnella N, Antonacci L, Giannattasio S, Marra E, Passarella S. 2008. Catalase
T and Cu,Zn-superoxide dismutase in the acetic acid-induced programmed
cell death in Saccharomyces cerevisiae. FEBS Lett 582: 210-4.
Guaragnella N, Antonacci L, Passarella S, Marra E, Giannattasio S. 2007.
Hydrogen peroxide and superoxide anion production during acetic acid-
induced yeast programmed cell death. Folia Microbiol (Praha) 52: 237-40.
Guaragnella N, Antonacci L, Passarella S, Marra E, Giannattasio S. 2011.
Achievements and perspectives in yeast acetic acid-induced programmed cell
death pathways. Biochem Soc Trans 39: 1538-43.
Guaragnella N, Bobba A, Passarella S, Marra E, Giannattasio S. 2010a. Yeast
acetic acid-induced programmed cell death can occur without cytochrome c
release which requires metacaspase YCA1. FEBS Lett 584: 224-8.
Guaragnella N, Passarella S, Marra E, Giannattasio S. 2010b. Knock-out of
metacaspase and/or cytochrome c results in the activation of a ROS-
independent acetic acid-induced programmed cell death pathway in yeast.
FEBS Lett 584: 3655-60.
Herrero E, Ros J, Bellí G, Cabiscol E. 2008. Redox control and oxidative stress in
yeast cells. Biochim Biophys Acta 1780: 1217-35.
Hong KK, Nielsen J. 2012. Metabolic engineering of Saccharomyces cerevisiae: a
key cell factory platform for future biorefineries. Cell Mol Life Sci 69: 2671-
90.
Hou L. 2010. Improved production of ethanol by novel genome shuffling in
Saccharomyces cerevisiae. Appl Biochem Biotechnol 160: 1084-93.
Ikeda M. 2006. Towards bacterial strains overproducing L-tryptophan and other
aromatics by metabolic engineering. Appl Microbiol Biotechnol 69: 615-26.
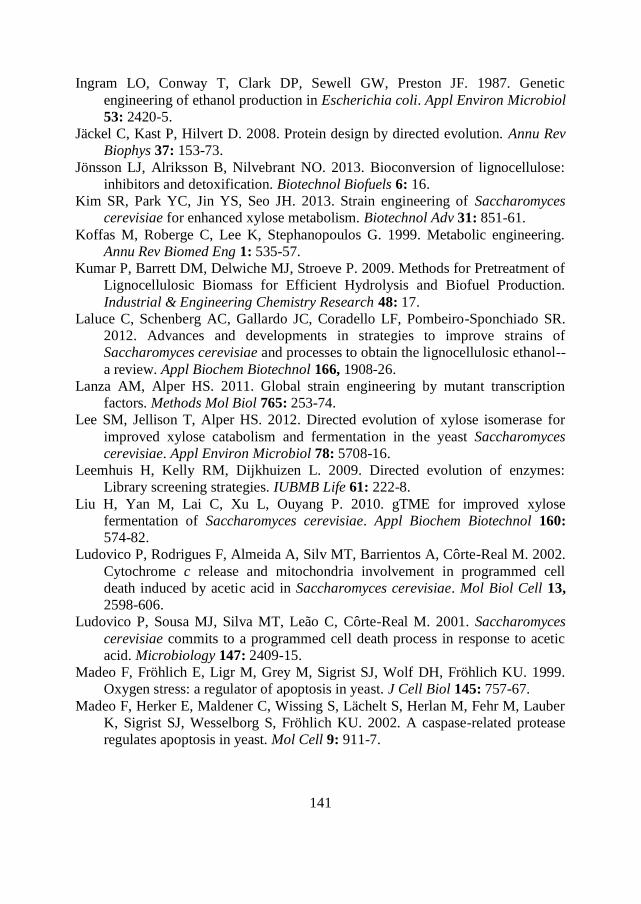
141
Ingram LO, Conway T, Clark DP, Sewell GW, Preston JF. 1987. Genetic
engineering of ethanol production in Escherichia coli. Appl Environ Microbiol
53: 2420-5.
Jäckel C, Kast P, Hilvert D. 2008. Protein design by directed evolution. Annu Rev
Biophys 37: 153-73.
Jönsson LJ, Alriksson B, Nilvebrant NO. 2013. Bioconversion of lignocellulose:
inhibitors and detoxification. Biotechnol Biofuels 6: 16.
Kim SR, Park YC, Jin YS, Seo JH. 2013. Strain engineering of Saccharomyces
cerevisiae for enhanced xylose metabolism. Biotechnol Adv 31: 851-61.
Koffas M, Roberge C, Lee K, Stephanopoulos G. 1999. Metabolic engineering.
Annu Rev Biomed Eng 1: 535-57.
Kumar P, Barrett DM, Delwiche MJ, Stroeve P. 2009. Methods for Pretreatment of
Lignocellulosic Biomass for Efficient Hydrolysis and Biofuel Production.
Industrial & Engineering Chemistry Research 48: 17.
Laluce C, Schenberg AC, Gallardo JC, Coradello LF, Pombeiro-Sponchiado SR.
2012. Advances and developments in strategies to improve strains of
Saccharomyces cerevisiae and processes to obtain the lignocellulosic ethanol--
a review. Appl Biochem Biotechnol 166, 1908-26.
Lanza AM, Alper HS. 2011. Global strain engineering by mutant transcription
factors. Methods Mol Biol 765: 253-74.
Lee SM, Jellison T, Alper HS. 2012. Directed evolution of xylose isomerase for
improved xylose catabolism and fermentation in the yeast Saccharomyces
cerevisiae. Appl Environ Microbiol 78: 5708-16.
Leemhuis H, Kelly RM, Dijkhuizen L. 2009. Directed evolution of enzymes:
Library screening strategies. IUBMB Life 61: 222-8.
Liu H, Yan M, Lai C, Xu L, Ouyang P. 2010. gTME for improved xylose
fermentation of Saccharomyces cerevisiae. Appl Biochem Biotechnol 160:
574-82.
Ludovico P, Rodrigues F, Almeida A, Silv MT, Barrientos A, Côrte-Real M. 2002.
Cytochrome c release and mitochondria involvement in programmed cell
death induced by acetic acid in Saccharomyces cerevisiae. Mol Biol Cell 13,
2598-606.
Ludovico P, Sousa MJ, Silva MT, Leão C, Côrte-Real M. 2001. Saccharomyces
cerevisiae commits to a programmed cell death process in response to acetic
acid. Microbiology 147: 2409-15.
Madeo F, Fröhlich E, Ligr M, Grey M, Sigrist SJ, Wolf DH, Fröhlich KU. 1999.
Oxygen stress: a regulator of apoptosis in yeast. J Cell Biol 145: 757-67.
Madeo F, Herker E, Maldener C, Wissing S, Lächelt S, Herlan M, Fehr M, Lauber
K, Sigrist SJ, Wesselborg S, Fröhlich KU. 2002. A caspase-related protease
regulates apoptosis in yeast. Mol Cell 9: 911-7.
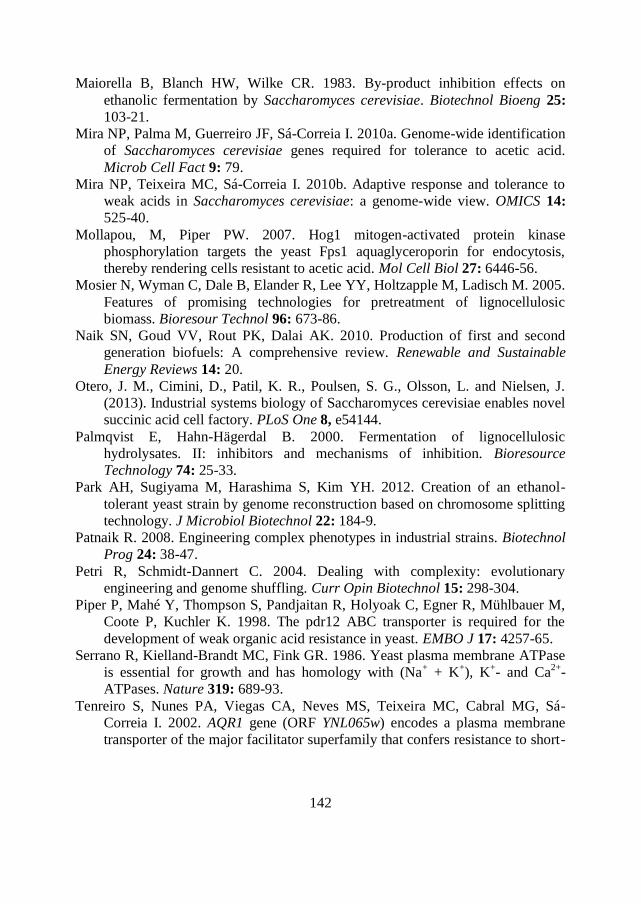
142
Maiorella B, Blanch HW, Wilke CR. 1983. By-product inhibition effects on
ethanolic fermentation by Saccharomyces cerevisiae. Biotechnol Bioeng 25:
103-21.
Mira NP, Palma M, Guerreiro JF, Sá-Correia I. 2010a. Genome-wide identification
of Saccharomyces cerevisiae genes required for tolerance to acetic acid.
Microb Cell Fact 9: 79.
Mira NP, Teixeira MC, Sá-Correia I. 2010b. Adaptive response and tolerance to
weak acids in Saccharomyces cerevisiae: a genome-wide view. OMICS 14:
525-40.
Mollapou, M, Piper PW. 2007. Hog1 mitogen-activated protein kinase
phosphorylation targets the yeast Fps1 aquaglyceroporin for endocytosis,
thereby rendering cells resistant to acetic acid. Mol Cell Biol 27: 6446-56.
Mosier N, Wyman C, Dale B, Elander R, Lee YY, Holtzapple M, Ladisch M. 2005.
Features of promising technologies for pretreatment of lignocellulosic
biomass. Bioresour Technol 96: 673-86.
Naik SN, Goud VV, Rout PK, Dalai AK. 2010. Production of first and second
generation biofuels: A comprehensive review. Renewable and Sustainable
Energy Reviews 14: 20.
Otero, J. M., Cimini, D., Patil, K. R., Poulsen, S. G., Olsson, L. and Nielsen, J.
(2013). Industrial systems biology of Saccharomyces cerevisiae enables novel
succinic acid cell factory. PLoS One 8, e54144.
Palmqvist E, Hahn-Hägerdal B. 2000. Fermentation of lignocellulosic
hydrolysates. II: inhibitors and mechanisms of inhibition. Bioresource
Technology 74: 25-33.
Park AH, Sugiyama M, Harashima S, Kim YH. 2012. Creation of an ethanol-
tolerant yeast strain by genome reconstruction based on chromosome splitting
technology. J Microbiol Biotechnol 22: 184-9.
Patnaik R. 2008. Engineering complex phenotypes in industrial strains. Biotechnol
Prog 24: 38-47.
Petri R, Schmidt-Dannert C. 2004. Dealing with complexity: evolutionary
engineering and genome shuffling. Curr Opin Biotechnol 15: 298-304.
Piper P, Mahé Y, Thompson S, Pandjaitan R, Holyoak C, Egner R, Mühlbauer M,
Coote P, Kuchler K. 1998. The pdr12 ABC transporter is required for the
development of weak organic acid resistance in yeast. EMBO J 17: 4257-65.
Serrano R, Kielland-Brandt MC, Fink GR. 1986. Yeast plasma membrane ATPase
is essential for growth and has homology with (Na+ + K
+), K
+- and Ca
2+-
ATPases. Nature 319: 689-93.
Tenreiro S, Nunes PA, Viegas CA, Neves MS, Teixeira MC, Cabral MG, Sá-
Correia I. 2002. AQR1 gene (ORF YNL065w) encodes a plasma membrane
transporter of the major facilitator superfamily that confers resistance to short-
143
chain monocarboxylic acids and quinidine in Saccharomyces cerevisiae.
Biochem Biophys Res Commun 292: 741-8.
Tenreiro S, Rosa PC, Viegas CA, Sá-Correia I. 2000. Expression of the AZR1 gene
(ORF YGR224w), encoding a plasma membrane transporter of the major
facilitator superfamily, is required for adaptation to acetic acid and resistance
to azoles in Saccharomyces cerevisiae. Yeast 16: 1469-81.
Valenti D, Vacca RA, Guaragnella N, Passarella S, Marra E, Giannattasio S. 2008.
A transient proteasome activation is needed for acetic acid-induced
programmed cell death to occur in Saccharomyces cerevisiae. FEMS Yeast
Res 8: 400-4.
Wallace-Salinas V, Gorwa-Grauslund MF. 2013. Adaptive evolution of an
industrial strain of Saccharomyces cerevisiae for combined tolerance to
inhibitors and temperature. Biotechnol Biofuels 6: 151.
Weikert C, Sauer U, Bailey JE. 1997. Use of a glycerol-limited, long-term
chemostat for isolation of Escherichia coli mutants with improved
physiological properties. Microbiology 143 (Pt 5): 1567-74.
Zhang YX, Perry K, Vinci VA, Powell K, Stemmer WP, del Cardayré SB. 2002.
Genome shuffling leads to rapid phenotypic improvement in bacteria. Nature
415: 644-6.

Ringraziamenti
Ringrazio il Prof. Porro e Paola per avermi accolto nel loro laboratorio ed avermi
permesso di intraprendere questa “avventura” che mi ha formato in diversi aspetti.
Ringrazio particolarmente Paola per avermi costantemente incoraggiato e
supportato, e per tutti i preziosi consigli che hai saputo darmi di cui farò certamente
tesoro.
Ringrazio tutti i/le ragazzi/e del Brandulab che si sono mostrati degli ottimi
colleghi di lavoro e amici. Senza nulla togliere agli altri, ringrazio in particolare
Tizi per avermi affiancato sia durante il lavoro che la stesura dell’articolo. Un
ringraziamento doveroso va a Francy, la quale è stata preziosa durante il mio
ultimo anno di dottorato e con cui ho condiviso soddisfazioni, risate e sigarette.
Grazie a Nadia, per aver condiviso con me tre interi anni in cui ci siamo supportate
e anche sopportate a vicenda, e per la dose di allegria che quotidianamente sei
riuscita a darmi.
Ringrazio mia madre e mio fratello, perché nonostante tutte le difficoltà so che
potrò sempre contare su di voi e su ciò che ci unisce.
Ringrazio Michael, per svariati motivi che non serve dire, ma soprattutto per la tua
capacità di alleggerirmi i problemi.
Ringrazio tutti i miei amici, in particolare Erika, Enzo, Ilaria, Elena, Luca, Ripa,
Alba, Neps, Ainhoa, Ivan, Federica e Alex, per l’affetto che mi date, che per me è
molto importante.
Ringrazio Rachele e Saverio, per avermi accolto come una figlia e per l’aiuto che
più di una volta mi avete dato.