Embed Size (px)
Citation preview
From Listing to Delisting: Foreign Firms’ Entry and Exit from the U.S. *
Susan Chaplinskya and Latha Ramchandb
aDarden Graduate School of Business, University of Virginia, Charlottesville, VA bCollege of Business Administration, Dept. of Finance, University of Houston, Houston, TX
Abstract
We examine the listings and delistings of foreign firms from major U.S. exchanges over the period 1961 – 2004. Over this period a total of 1,330 firms listed and 728 firms delisted due to merger and acquisitions, involuntary, or voluntary reasons. The large number of listings and delistings spanning over 40 years suggests that there is a long standing dynamic to foreign firms’ entry and exit from the United States. Over this period, we find a steady decline in the length of time foreign firms stay listed in the U.S. A major reason for this decline is that, not unlike the pattern for U.S. new lists, the quality of foreign firms listing in the U.S. has deteriorated over time. Probit analysis suggests that large, profitable firms able to attract U.S. trading volume survive, whereas weak firms exit. We also examine the circumstances surrounding the voluntary delistings as their exit has raised the greatest concern about the overall competitiveness of the U.S. market. After controlling for firms close to distress, we find only 48 “true” voluntary delistings. The firms voluntarily delisting following passage of Sarbanes-Oxley have low average profitability, median assets and market capitalization less than $230 million, stock prices that decline by over 50% from listing to delisting, and 60% have no analyst coverage. The evidence suggests these firms are driven from the U.S. as much by a lack of quality and investor interest as regulatory costs. Our results suggest that foreign firms’ decision to delist from U.S. exchanges must be examined within the broader context of what makes foreign firms viable candidates for listing. JEL codes: F36, G15, G28 Key words: international finance, ADRs, delistings, Sarbanes Oxley First Draft: November 2006; Revised Draft: February 2007 Not for Quotation, Comments Welcome *We thank Michael Schill and the participants of the University of Virginia Darden Research Seminar for helpful comments. Kulwant Rai provided excellent research assistance. Author contact information: a. Susan Chaplinsky (corresponding), Darden Graduate School of Business, University of Virginia, Charlottesville, VA 22906-6550, email: [email protected], phone: 434-924-4810. b. Latha Ramchand, University of Houston, College of Business Administration, Department of Finance, Houston, TX 77204-6282, email: [email protected], phone: 713-743-4769.
From Listing to Delisting: Foreign Firms’ Entry and Exit from the U.S.
Abstract
We examine the listings and delistings of foreign firms from major U.S. exchanges over the period 1961 – 2004. Over this period a total of 1,330 firms listed and 728 firms delisted due to merger and acquisitions, involuntary, or voluntary reasons. The large number of listings and delistings spanning over 40 years suggests that there is a long standing dynamic to foreign firms’ entry and exit from the United States. Over this period, we find a steady decline in the length of time foreign firms stay listed in the U.S. A major reason for this decline is that, not unlike the pattern for U.S. new lists, the quality of foreign firms listing in the U.S. has deteriorated over time. Probit analysis suggests that large, profitable firms able to attract U.S. trading volume survive, whereas weak firms exit. We also examine the circumstances surrounding the voluntary delistings as their exit has raised the greatest concern about the overall competitiveness of the U.S. market. After controlling for firms close to distress, we find only 48 “true” voluntary delistings. The firms voluntarily delisting following passage of Sarbanes-Oxley have low average profitability, median assets and market capitalization less than $230 million, stock prices that decline by over 50% from listing to delisting, and 60% have no analyst coverage. The evidence suggests these firms are driven from the U.S. as much by a lack of quality and investor interest as regulatory costs. Our results suggest that foreign firms’ decision to delist from U.S. exchanges must be examined within the broader context of what makes foreign firms viable candidates for listing.
1
From Listing to Delisting: Foreign Firms’ Entry and Exit from the U.S.
Visits give pleasure ― if not the coming, then the going.
Portuguese saying 1. Introduction
Over the past 30 years the U.S. capital markets have been the primary destination of
foreign firms seeking into increase their global footprint and opportunities. Recently a number of
international firms have announced their intentions to delist from major U.S. stock exchanges.
Among other reasons, these firms often cite the low U.S. trading volume in foreign owned shares,
the increased complexity of U.S. capital market regulation, spurred by passage of the Sarbanes-
Oxley Act in 2002, and the belief that non-U.S. markets can meet U.S. shareholders’ and capital
raising needs. These actions have raised concerns that the U.S. capital markets could be losing
competitiveness and that increased regulation may be driving foreign firms away. At the same
time, foreign firms continue to list in the U.S. In this paper we examine the entry and exit of
foreign firms into the U.S. over the period 1961 – 2004. In total, there have been 1,330 listings
and 728 delistings of foreign firms from major U.S. exchanges over this period.1 The large
number of listings and delistings spanning some 43 years suggests there is a long standing
dynamic to foreign firm’s entry and exit from the United States. This pattern – as revealed in the
characteristics of the entering and exiting firms – provides insight into two important and timely
questions. First, by examining the characteristics of foreign firms listing in the U.S. over time we
observe the profile of foreign firms that are viable candidates for public listing. Earlier studies
examining the motivation of firms to list in the U.S have been conducted at different points in a
1 While there is a large literature on foreign listings (Karolyi 1998, 2004 provides a survey), we are aware of only three studies examining foreign delistings. Liu (2004) examines the announcement date effects to 103 involuntary foreign delistings from 1990-May 2003, Smith (2005) examines abnormal returns for a sample of 179 foreign delistings from 2000-September 2004, and Witmer (2006) examines announcement date effects and other aspects of delisting for 140 cross delistings from 1990-2003. All three studies find significantly negative announcement date returns to delisting announcements.
2
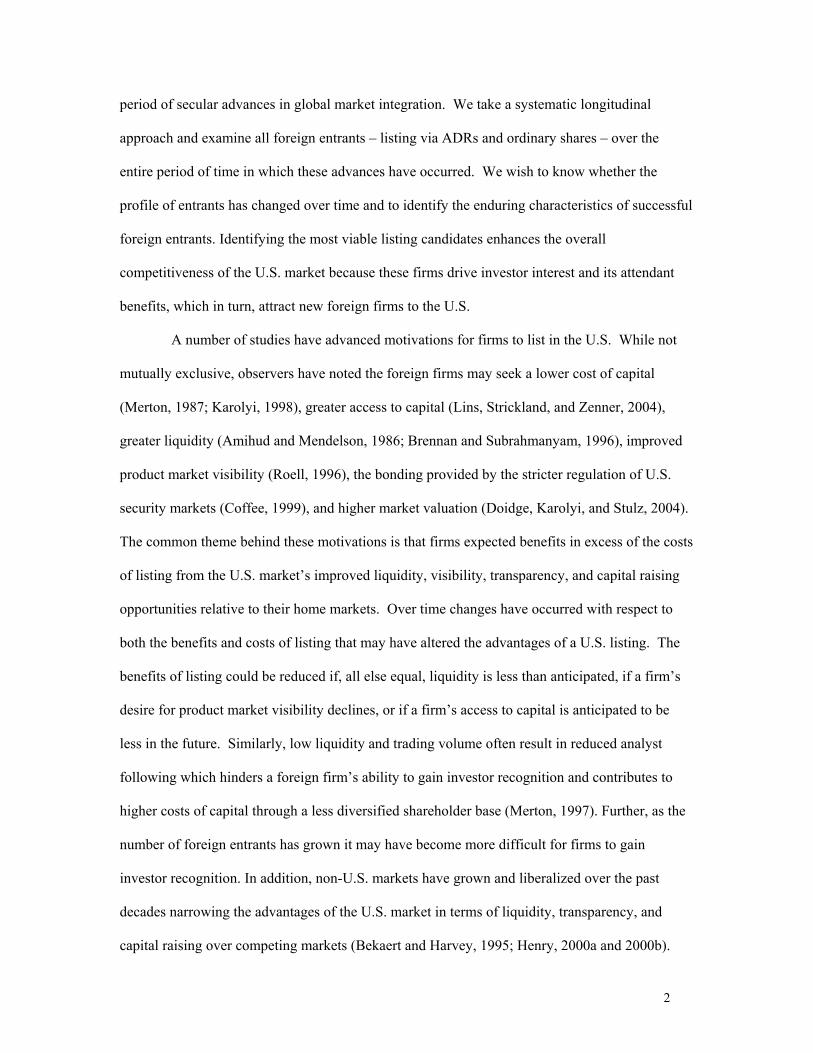
period of secular advances in global market integration. We take a systematic longitudinal
approach and examine all foreign entrants – listing via ADRs and ordinary shares – over the
entire period of time in which these advances have occurred. We wish to know whether the
profile of entrants has changed over time and to identify the enduring characteristics of successful
foreign entrants. Identifying the most viable listing candidates enhances the overall
competitiveness of the U.S. market because these firms drive investor interest and its attendant
benefits, which in turn, attract new foreign firms to the U.S.
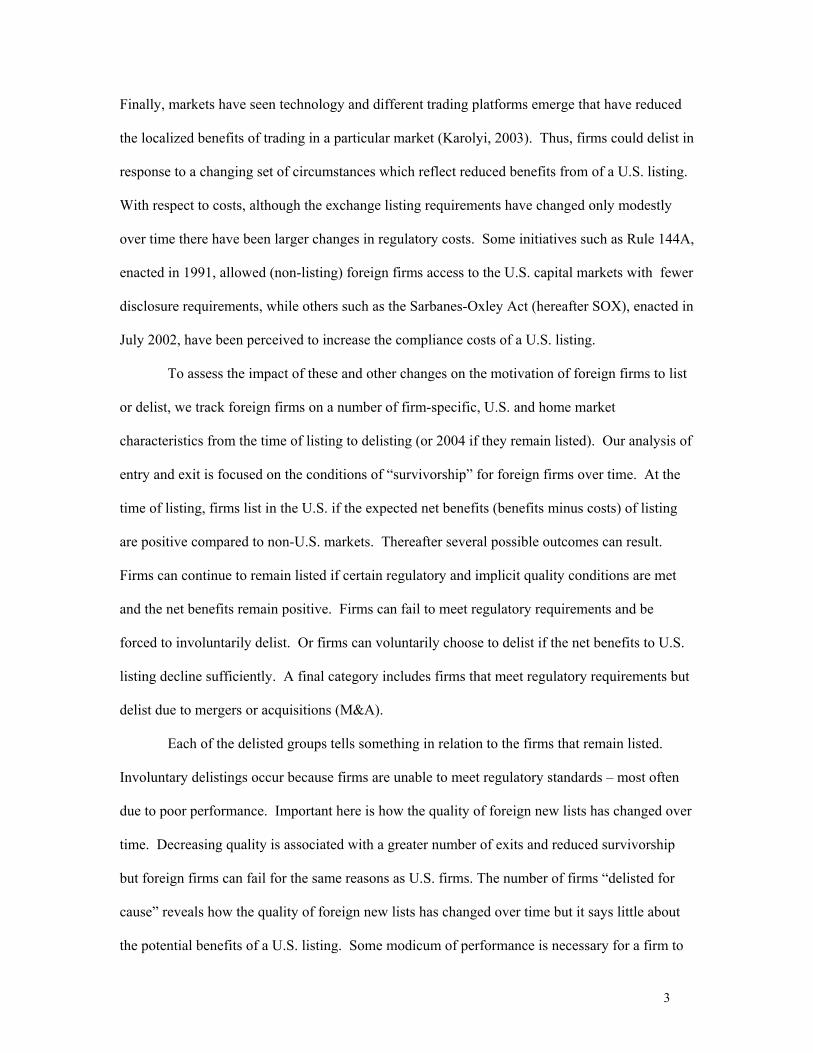
A number of studies have advanced motivations for firms to list in the U.S. While not
mutually exclusive, observers have noted the foreign firms may seek a lower cost of capital
(Merton, 1987; Karolyi, 1998), greater access to capital (Lins, Strickland, and Zenner, 2004),
greater liquidity (Amihud and Mendelson, 1986; Brennan and Subrahmanyam, 1996), improved
product market visibility (Roell, 1996), the bonding provided by the stricter regulation of U.S.
security markets (Coffee, 1999), and higher market valuation (Doidge, Karolyi, and Stulz, 2004).
The common theme behind these motivations is that firms expected benefits in excess of the costs
of listing from the U.S. market’s improved liquidity, visibility, transparency, and capital raising
opportunities relative to their home markets. Over time changes have occurred with respect to
both the benefits and costs of listing that may have altered the advantages of a U.S. listing. The
benefits of listing could be reduced if, all else equal, liquidity is less than anticipated, if a firm’s
desire for product market visibility declines, or if a firm’s access to capital is anticipated to be
less in the future. Similarly, low liquidity and trading volume often result in reduced analyst
following which hinders a foreign firm’s ability to gain investor recognition and contributes to
higher costs of capital through a less diversified shareholder base (Merton, 1997). Further, as the
number of foreign entrants has grown it may have become more difficult for firms to gain
investor recognition. In addition, non-U.S. markets have grown and liberalized over the past
decades narrowing the advantages of the U.S. market in terms of liquidity, transparency, and
capital raising over competing markets (Bekaert and Harvey, 1995; Henry, 2000a and 2000b).
3
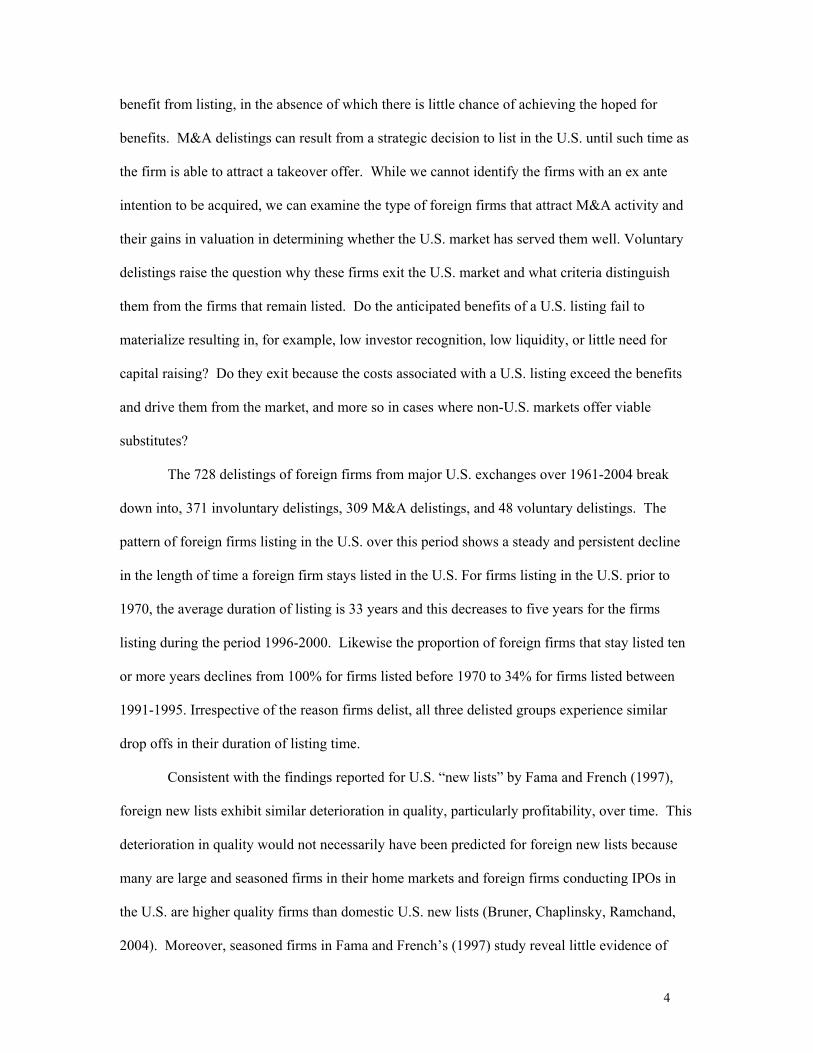
Finally, markets have seen technology and different trading platforms emerge that have reduced
the localized benefits of trading in a particular market (Karolyi, 2003). Thus, firms could delist in
response to a changing set of circumstances which reflect reduced benefits from of a U.S. listing.
With respect to costs, although the exchange listing requirements have changed only modestly
over time there have been larger changes in regulatory costs. Some initiatives such as Rule 144A,
enacted in 1991, allowed (non-listing) foreign firms access to the U.S. capital markets with fewer
disclosure requirements, while others such as the Sarbanes-Oxley Act (hereafter SOX), enacted in
July 2002, have been perceived to increase the compliance costs of a U.S. listing.
To assess the impact of these and other changes on the motivation of foreign firms to list
or delist, we track foreign firms on a number of firm-specific, U.S. and home market
characteristics from the time of listing to delisting (or 2004 if they remain listed). Our analysis of
entry and exit is focused on the conditions of “survivorship” for foreign firms over time. At the
time of listing, firms list in the U.S. if the expected net benefits (benefits minus costs) of listing
are positive compared to non-U.S. markets. Thereafter several possible outcomes can result.
Firms can continue to remain listed if certain regulatory and implicit quality conditions are met
and the net benefits remain positive. Firms can fail to meet regulatory requirements and be
forced to involuntarily delist. Or firms can voluntarily choose to delist if the net benefits to U.S.
listing decline sufficiently. A final category includes firms that meet regulatory requirements but
delist due to mergers or acquisitions (M&A).
Each of the delisted groups tells something in relation to the firms that remain listed.
Involuntary delistings occur because firms are unable to meet regulatory standards – most often
due to poor performance. Important here is how the quality of foreign new lists has changed over
time. Decreasing quality is associated with a greater number of exits and reduced survivorship
but foreign firms can fail for the same reasons as U.S. firms. The number of firms “delisted for
cause” reveals how the quality of foreign new lists has changed over time but it says little about
the potential benefits of a U.S. listing. Some modicum of performance is necessary for a firm to
4
benefit from listing, in the absence of which there is little chance of achieving the hoped for
benefits. M&A delistings can result from a strategic decision to list in the U.S. until such time as
the firm is able to attract a takeover offer. While we cannot identify the firms with an ex ante
intention to be acquired, we can examine the type of foreign firms that attract M&A activity and
their gains in valuation in determining whether the U.S. market has served them well. Voluntary
delistings raise the question why these firms exit the U.S. market and what criteria distinguish
them from the firms that remain listed. Do the anticipated benefits of a U.S. listing fail to
materialize resulting in, for example, low investor recognition, low liquidity, or little need for
capital raising? Do they exit because the costs associated with a U.S. listing exceed the benefits
and drive them from the market, and more so in cases where non-U.S. markets offer viable
substitutes?
The 728 delistings of foreign firms from major U.S. exchanges over 1961-2004 break
down into, 371 involuntary delistings, 309 M&A delistings, and 48 voluntary delistings. The
pattern of foreign firms listing in the U.S. over this period shows a steady and persistent decline
in the length of time a foreign firm stays listed in the U.S. For firms listing in the U.S. prior to
1970, the average duration of listing is 33 years and this decreases to five years for the firms
listing during the period 1996-2000. Likewise the proportion of foreign firms that stay listed ten
or more years declines from 100% for firms listed before 1970 to 34% for firms listed between
1991-1995. Irrespective of the reason firms delist, all three delisted groups experience similar
drop offs in their duration of listing time.
Consistent with the findings reported for U.S. “new lists” by Fama and French (1997),
foreign new lists exhibit similar deterioration in quality, particularly profitability, over time. This
deterioration in quality would not necessarily have been predicted for foreign new lists because
many are large and seasoned firms in their home markets and foreign firms conducting IPOs in
the U.S. are higher quality firms than domestic U.S. new lists (Bruner, Chaplinsky, Ramchand,
2004). Moreover, seasoned firms in Fama and French’s (1997) study reveal little evidence of
5
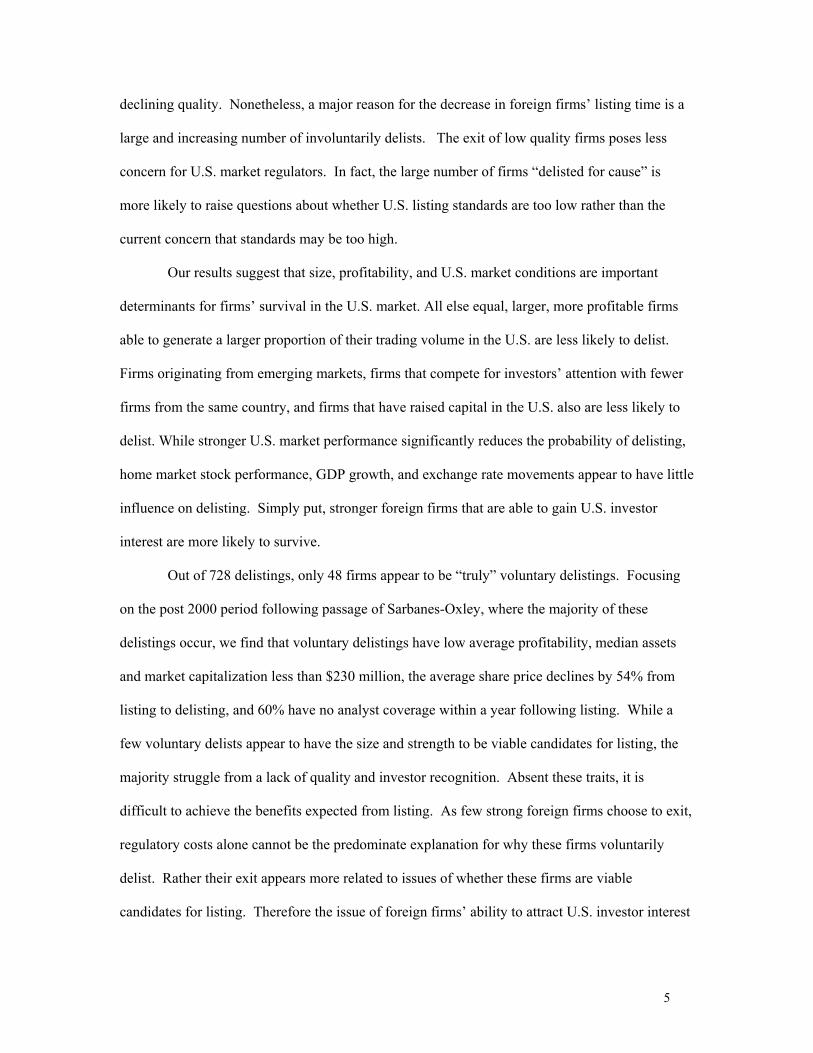
declining quality. Nonetheless, a major reason for the decrease in foreign firms’ listing time is a
large and increasing number of involuntarily delists. The exit of low quality firms poses less
concern for U.S. market regulators. In fact, the large number of firms “delisted for cause” is
more likely to raise questions about whether U.S. listing standards are too low rather than the
current concern that standards may be too high.
Our results suggest that size, profitability, and U.S. market conditions are important
determinants for firms’ survival in the U.S. market. All else equal, larger, more profitable firms
able to generate a larger proportion of their trading volume in the U.S. are less likely to delist.
Firms originating from emerging markets, firms that compete for investors’ attention with fewer
firms from the same country, and firms that have raised capital in the U.S. also are less likely to
delist. While stronger U.S. market performance significantly reduces the probability of delisting,
home market stock performance, GDP growth, and exchange rate movements appear to have little
influence on delisting. Simply put, stronger foreign firms that are able to gain U.S. investor
interest are more likely to survive.
Out of 728 delistings, only 48 firms appear to be “truly” voluntary delistings. Focusing
on the post 2000 period following passage of Sarbanes-Oxley, where the majority of these
delistings occur, we find that voluntary delistings have low average profitability, median assets
and market capitalization less than $230 million, the average share price declines by 54% from
listing to delisting, and 60% have no analyst coverage within a year following listing. While a
few voluntary delists appear to have the size and strength to be viable candidates for listing, the
majority struggle from a lack of quality and investor recognition. Absent these traits, it is
difficult to achieve the benefits expected from listing. As few strong foreign firms choose to exit,
regulatory costs alone cannot be the predominate explanation for why these firms voluntarily
delist. Rather their exit appears more related to issues of whether these firms are viable
candidates for listing. Therefore the issue of foreign firms’ ability to attract U.S. investor interest
6
merits greater attention in determining the role of SOX and the competitiveness of the U.S.
markets.
The paper is organized as follows. Section 2 describes the sample of foreign listed and
delisted firms and examines the characteristics of listed firms over time. Section 3 explores the
delisted firms in more detail and the factors associated with various types of delistings. Section 4
examines in more detail the characteristics of M&A and voluntary delists, or foreign firms that
have more choice about their decision to delist. Section 5 contains our conclusions.
2. Exit and Entry into the U.S.
2.1 Sample of Lists and Delists
Using the shares codes 12 and 30 and 31 from CRSP, we identify all foreign firms that
listed on a major U.S. stock exchange from 1961 – 2004.2 Because of the use of exchange
listings, our sample includes Level II and III ADRs and ordinary share listings but does not
include Level I and Rule 144A ADRs. We focus on listings on major stock exchanges to ensure
better data availability and more uniform listing requirements.3 Although CRSP indicates that a
share is foreign owned, it does not give the country of origin and therefore to be included in our
sample we must be able to independently verify the country of origin.4 From this sample of
exchange listed firms, we eliminate all duplicate entries with the same company name and
identify all firms that delisted through 2004.5 A total of 1,579 foreign firms meet these two
requirements. To ensure a more uniform set of firms are used in the ensuing analysis we also
require these firms to have Compustat data available on total assets (item #6) in either their first 2 Share code 12 refers to an ordinary share listed by a firm incorporated outside the U.S. and share codes of 30 and 31 denote American Depositary Receipts (ADRs). 3 Our sample also does not include ADRs which originally began as Rule 144A and Level I ADRs and later become Level II or Level III ADRs. Since we are interested in the profile of entrants at the point of listing these firms have already had some exposure to the U.S. market prior to their exchange listing. 4 Compustat provides country information for a subset of firms but we find errors in the data as many firms listed as foreign firms turn out to be U.S. firms. Therefore we hand check each firm to verify its country of origin using the Mergent and Hoover’s databases, or consulting the firm’s own website. 5 Duplicate entries can result for example if a foreign firm has dual class shares or common and preferred shares. In our sample, each observation represents one firm.
7
or second year post-listing, which reduces the number of listed firms to 1,330.6 From this sample
we compile the sample of delisted firms also using the CRSP share codes. We verify that the
delisted firms do not trade under a new name and that the firm did not move from one major
exchange to another. Firms that move from one major exchange to another are not treated as
delists whereas firms that delist to the Over the Counter (OTC) market or to the “Pink Sheets” are
treated as delists. A total of 728 foreign firms delist from a major exchange over the period 1961-
2004. Therefore our final sample of 1,330 firms is made up of 728 firms that subsequently delist
and 602 firms that continue to be listed on the NYSE/AMEX or NASDAQ as of December 31,
2004. The 602 foreign firms that continue to be listed in the U.S. are referred to in the remainder
of the paper as the “stay listed” sample. Our final sample is the most complete sample of foreign
listings and delistings to date.
Figure 1a illustrates the total number of foreign firms listed (cumulative sum of listings
minus delistings) on major U.S. exchanges over the sample period. From a beginning of no
listings in 1961, total listings increase to 85 in 1980, to 279 in 1990, peak at 738 in 2000, and
then decrease to 602 in 2004. The figure reveals that the stretch of time from 1994-2000 has the
largest increase in the number of foreign listings, which is followed by a period from 2001-2004
where delistings outnumber listings. Figure 1b shows the annual number of foreign firms listing
and delisting from major U.S. stock exchanges over 1961-2004. Before 1980, there are two years
with a sizeable number of listings but otherwise listings are sparse. Thereafter there is a steady
increase in the number of foreign listings – no year has fewer than 15 listings and listings peak at
143 in 2000. The first delistings occur in 1980 and grow more pronounced after 1997. The ratio
of the number of delists to lists over five year intervals shows a rise in the proportion of delists
over time. For example, the ratio of delists to lists is 0.16 from 1981-1985, 0.36 from 1986-1990,
6 There are a total of 1,579 foreign firms that list on a major exchange for which we can verify the country of origin and confirm they are not dual or cross exchange listings. The imposition of the data requirement that sample firms have data on total assets available from Compustat in either their first or second year post-listing results in a loss of 249 firms. Seventy percent or 171 firms of the 249 firms omitted for this reason were listed before 1986. The results of the paper are not sensitive to the exclusion of the 249 firms.
8
0.31 from 1991-1995, 0.53 from 1996-2000, and 1.96 from 2001-2004. It is the spike in this ratio
over 2001-04 – a rise in delists coupled with a decline in lists – that has raised concerns about the
competitiveness of the U.S. market.
Figure 2 shows the length of time foreign firms stay listed in the U.S. Firms listed before
1970 stay listed an average of 33 years and this declines steadily over the next three decades to
five years for firms listed after 1995. We also compute the proportion of firms that stay listed at
least ten years following their listing date. The proportion of firms staying listed at least ten years
declines from 100% for firms listed prior to 1970 to 34% for firms listed from 1991-1995. A
similar trend emerges if we examine the proportion of firms that stay listed five or more years.
Hence, there has been a gradual reduction in the time foreign firms maintain a U.S. listing and
this pattern is apparent well before the passage of SOX.
2.2 Characteristics of Listing Firms over Time
A reduction in listing time has also been observed for U.S. “new lists.” Fama and French
(1997) attribute the reduction in listing time to greater acceptance of risks by U.S. investors as
evidenced by an increase in the number of poor quality firms that go public after 1980. Among
domestic IPOs, they attribute the drop in survivorship primarily to the large increase in new lists
“delisted for cause” after 1980. However, foreign new lists differ from U.S. new lists in several
respects that could impact their survivorship. First, a large number of foreign new lists are listed
in their home markets prior to their U.S. listing and thus are seasoned firms. Seasoned firms in
Fama and French’s (1997) study reveal little evidence based on profitability and asset growth of
declining quality. Second, the characteristics of “first time” U.S. IPOs by foreign firms (i.e.,
those without a prior trading history in their home market) indicate they are higher quality firms
at the point of listing compared to a matched sample of domestic U.S. IPOs (Bruner, Chaplinsky,
and Ramchand, 2004). All else equal, these factors might point to a higher survivorship rate for
foreign firms. Third, a foreign firm can voluntarily delist if a U.S. listing fails to provide positive
net benefits on an on-going basis and this is more likely to happen if the firm has a viable listing
9
in a non-U.S. market, typically its home market. These firms exit the U.S. market but since they
are able to meet regulatory requirements their choice to leave is presumably not related to poor
quality. All of this suggests that the factors affecting “survivorship” could differ between foreign
and U.S. new lists. On the other hand, foreign firms are not immune from poor performance and
the reduction in survivorship that is attributable to poor performance is also important to
ascertain. The U.S. market is regarded as having the highest listing standards in the world and one
role of standards is to ensure that high quality firms list in the U.S. Regulators are likely to be
less concerned about the loss of foreign firms that delist due to poor performance.
In Table 1 we examine characteristics related to the quality of foreign new lists over time.
The average and median values of the characteristics are reported for the first year of listing for
the full sample of listings over five year time periods from 1961-2004. To adjust for the effects
of nominal price increases over time, the reported levels of assets and sales are deflated by the
Consumer Price Index. Generally speaking, prior to 1980, the foreign firms listing in the U.S. are
large based on asset size, have high levels of sales and profitability, and originate exclusively
from developed market countries.7 The return on assets (ROA) is consistently above 17% on
average (median=15%) prior to 1980 and thereafter exhibits a distinct downtrend trend resulting
in an average ROA of 4% or less (median= 8%) in the final two five year periods. Hence, the
average and median firm’s operating profitability is cut by half or more over the course of the
sample period. At the same time, the growth rates in assets and sales generally increase over time
as does the market-to-book ratio. In the final time period, there is also some evidence of a
reversal in these general trends. During 2001-2004, firms have the largest asset size, positive
average and median ROA, higher levels of sales than in all but the pre-1980 periods, and are
more frequently listed on the NYSE, an indicator of quality (Baker, Powell, and Weaver, 1999).
7 Emerging and developed country status are based on country risk (CR) ratings from EuroMoney. EuroMoney ratings are not available at the beginning of our sample. The first rating that becomes available for the country is used to fill in the ratings in the early sample years. Rating levels below 85 are used as the cut-off for emerging markets, because this cut-off results in all G-8 countries being included in the developed market sample.
10
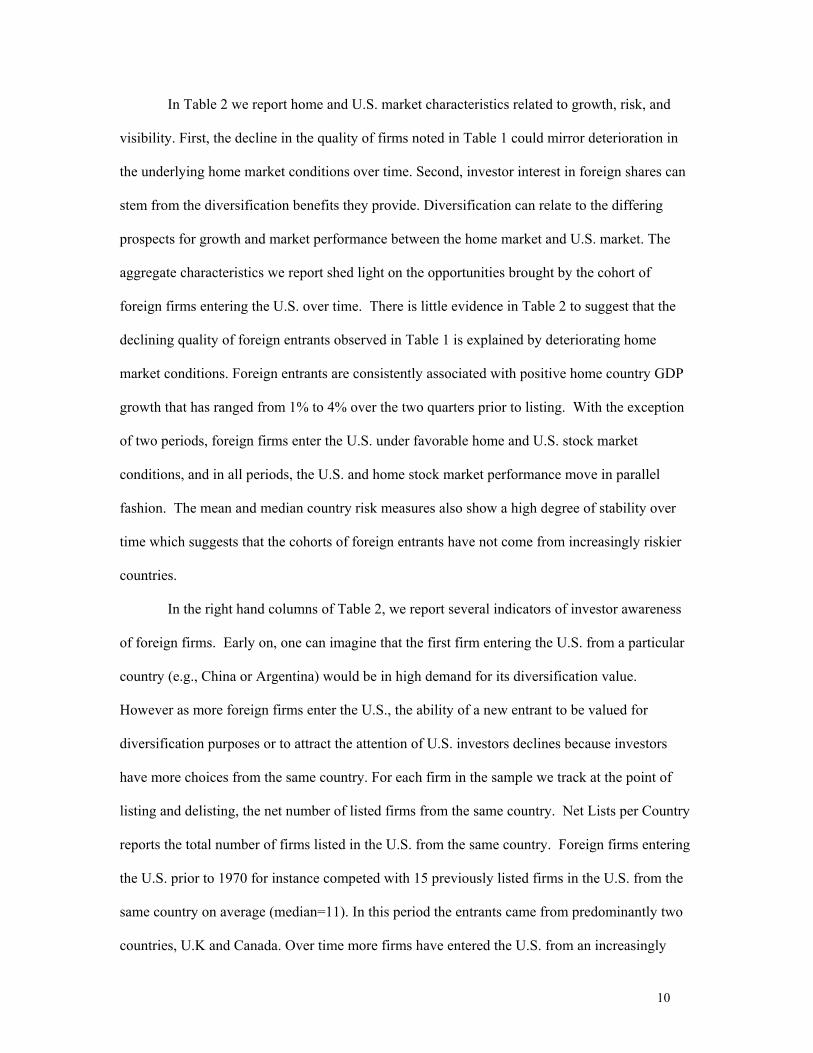
In Table 2 we report home and U.S. market characteristics related to growth, risk, and
visibility. First, the decline in the quality of firms noted in Table 1 could mirror deterioration in
the underlying home market conditions over time. Second, investor interest in foreign shares can
stem from the diversification benefits they provide. Diversification can relate to the differing
prospects for growth and market performance between the home market and U.S. market. The
aggregate characteristics we report shed light on the opportunities brought by the cohort of
foreign firms entering the U.S. over time. There is little evidence in Table 2 to suggest that the
declining quality of foreign entrants observed in Table 1 is explained by deteriorating home
market conditions. Foreign entrants are consistently associated with positive home country GDP
growth that has ranged from 1% to 4% over the two quarters prior to listing. With the exception
of two periods, foreign firms enter the U.S. under favorable home and U.S. stock market
conditions, and in all periods, the U.S. and home stock market performance move in parallel
fashion. The mean and median country risk measures also show a high degree of stability over
time which suggests that the cohorts of foreign entrants have not come from increasingly riskier
countries.
In the right hand columns of Table 2, we report several indicators of investor awareness
of foreign firms. Early on, one can imagine that the first firm entering the U.S. from a particular
country (e.g., China or Argentina) would be in high demand for its diversification value.
However as more foreign firms enter the U.S., the ability of a new entrant to be valued for
diversification purposes or to attract the attention of U.S. investors declines because investors
have more choices from the same country. For each firm in the sample we track at the point of
listing and delisting, the net number of listed firms from the same country. Net Lists per Country
reports the total number of firms listed in the U.S. from the same country. Foreign firms entering
the U.S. prior to 1970 for instance competed with 15 previously listed firms in the U.S. from the
same country on average (median=11). In this period the entrants came from predominantly two
countries, U.K and Canada. Over time more firms have entered the U.S. from an increasingly
11
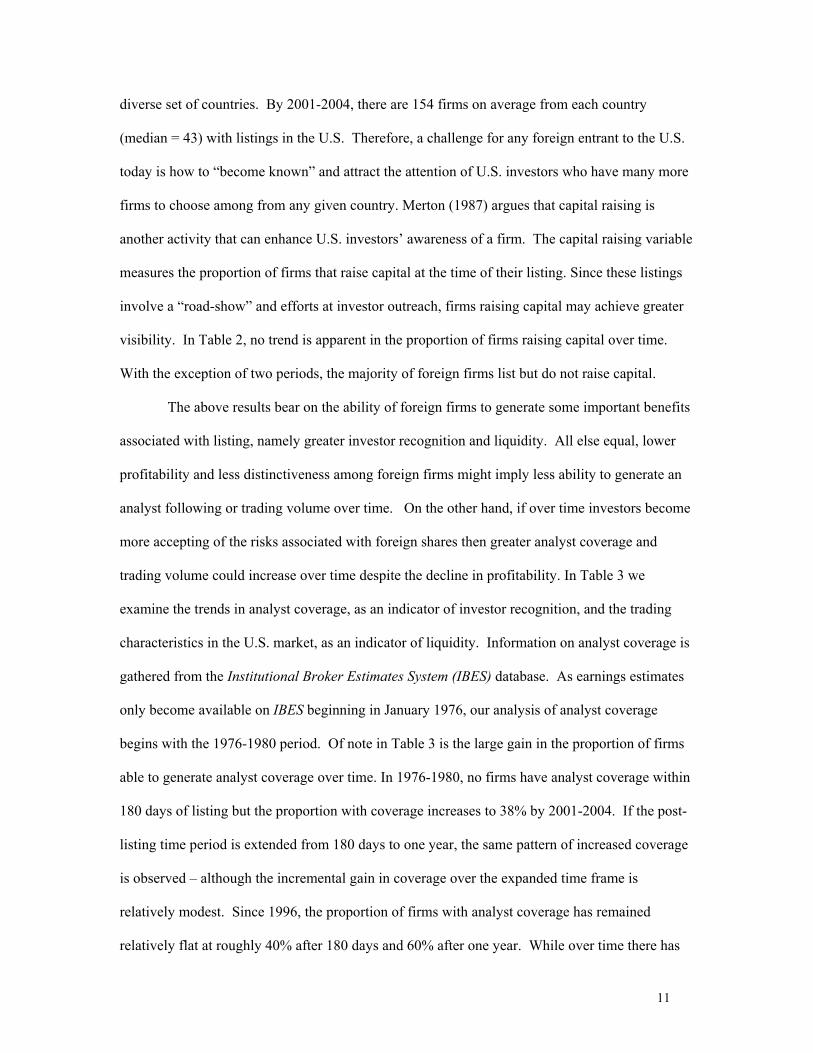
diverse set of countries. By 2001-2004, there are 154 firms on average from each country
(median = 43) with listings in the U.S. Therefore, a challenge for any foreign entrant to the U.S.
today is how to “become known” and attract the attention of U.S. investors who have many more
firms to choose among from any given country. Merton (1987) argues that capital raising is
another activity that can enhance U.S. investors’ awareness of a firm. The capital raising variable
measures the proportion of firms that raise capital at the time of their listing. Since these listings
involve a “road-show” and efforts at investor outreach, firms raising capital may achieve greater
visibility. In Table 2, no trend is apparent in the proportion of firms raising capital over time.
With the exception of two periods, the majority of foreign firms list but do not raise capital.
The above results bear on the ability of foreign firms to generate some important benefits
associated with listing, namely greater investor recognition and liquidity. All else equal, lower
profitability and less distinctiveness among foreign firms might imply less ability to generate an
analyst following or trading volume over time. On the other hand, if over time investors become
more accepting of the risks associated with foreign shares then greater analyst coverage and
trading volume could increase over time despite the decline in profitability. In Table 3 we
examine the trends in analyst coverage, as an indicator of investor recognition, and the trading
characteristics in the U.S. market, as an indicator of liquidity. Information on analyst coverage is
gathered from the Institutional Broker Estimates System (IBES) database. As earnings estimates
only become available on IBES beginning in January 1976, our analysis of analyst coverage
begins with the 1976-1980 period. Of note in Table 3 is the large gain in the proportion of firms
able to generate analyst coverage over time. In 1976-1980, no firms have analyst coverage within
180 days of listing but the proportion with coverage increases to 38% by 2001-2004. If the post-
listing time period is extended from 180 days to one year, the same pattern of increased coverage
is observed – although the incremental gain in coverage over the expanded time frame is
relatively modest. Since 1996, the proportion of firms with analyst coverage has remained
relatively flat at roughly 40% after 180 days and 60% after one year. While over time there has
12
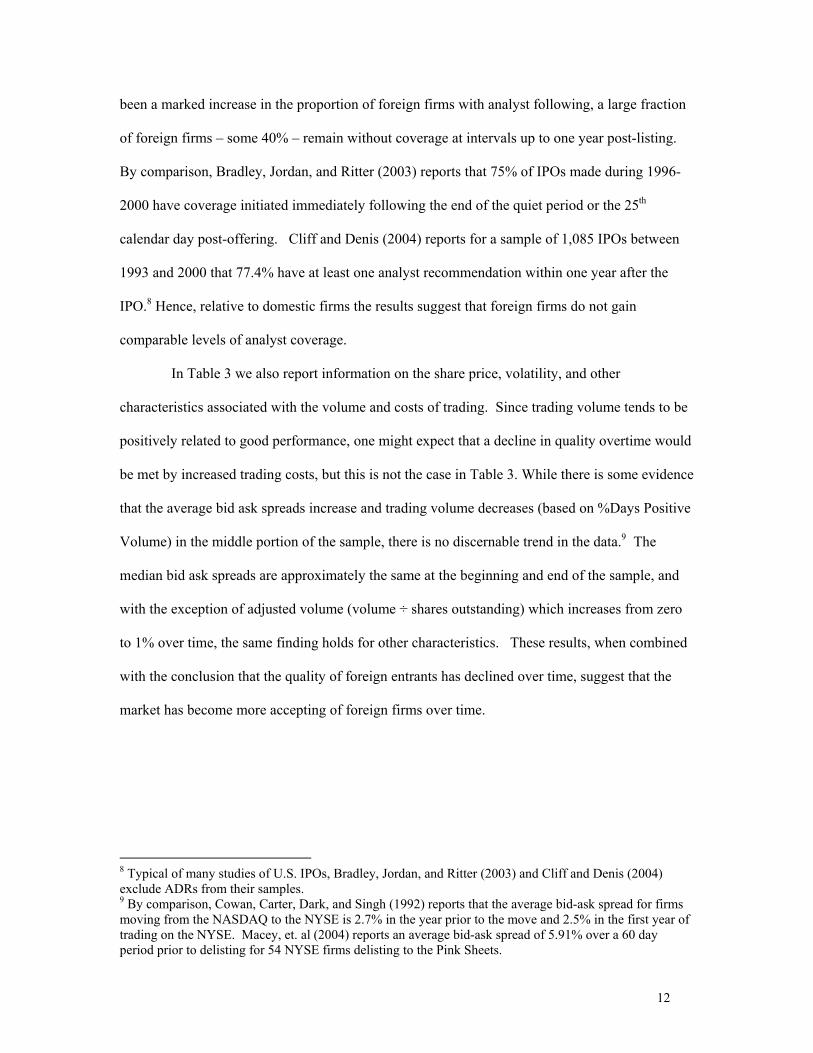
been a marked increase in the proportion of foreign firms with analyst following, a large fraction
of foreign firms – some 40% – remain without coverage at intervals up to one year post-listing.
By comparison, Bradley, Jordan, and Ritter (2003) reports that 75% of IPOs made during 1996-
2000 have coverage initiated immediately following the end of the quiet period or the 25th
calendar day post-offering. Cliff and Denis (2004) reports for a sample of 1,085 IPOs between
1993 and 2000 that 77.4% have at least one analyst recommendation within one year after the
IPO.8 Hence, relative to domestic firms the results suggest that foreign firms do not gain
comparable levels of analyst coverage.
In Table 3 we also report information on the share price, volatility, and other
characteristics associated with the volume and costs of trading. Since trading volume tends to be
positively related to good performance, one might expect that a decline in quality overtime would
be met by increased trading costs, but this is not the case in Table 3. While there is some evidence
that the average bid ask spreads increase and trading volume decreases (based on %Days Positive
Volume) in the middle portion of the sample, there is no discernable trend in the data.9 The
median bid ask spreads are approximately the same at the beginning and end of the sample, and
with the exception of adjusted volume (volume ÷ shares outstanding) which increases from zero
to 1% over time, the same finding holds for other characteristics. These results, when combined
with the conclusion that the quality of foreign entrants has declined over time, suggest that the
market has become more accepting of foreign firms over time.
8 Typical of many studies of U.S. IPOs, Bradley, Jordan, and Ritter (2003) and Cliff and Denis (2004) exclude ADRs from their samples. 9 By comparison, Cowan, Carter, Dark, and Singh (1992) reports that the average bid-ask spread for firms moving from the NASDAQ to the NYSE is 2.7% in the year prior to the move and 2.5% in the first year of trading on the NYSE. Macey, et. al (2004) reports an average bid-ask spread of 5.91% over a 60 day period prior to delisting for 54 NYSE firms delisting to the Pink Sheets.
13
3. Characteristics of Foreign Delistings
3.1 Classifications of Delistings
The pattern of survivorship is directly traceable to the firms that delist and in this section
we explore the characteristics of the delistings over time. We classify delistings into three broad
categories based on the CRSP share codes and our independent verification of the CRSP code.
Firms that are removed from major exchanges are classified into mergers and acquisition (CRSP
codes 200 - 400), involuntary (CRSP codes ≥ 400 excluding 570 and 573), or voluntarily
delistings (CRSP code 570). We verify that none of the delisted firms trades under a new name
or ticker on the NYSE or NASDAQ through December 31, 2004. Because code 570 delistings are
“delisted at the request of the company” and not at the behest of the exchange or market
regulators, they are classified as “voluntary” delistings. We check the accuracy of the voluntary
delists and the other categories of delists through text and web searches. For example, a firm
with CRSP code 570 is initially classified as a voluntary delisting. If, however, our search
uncovers information that the firm is in financial difficulty (i.e., missed interest payments,
rumored to be near Chapter 11, previously served a delisting notice by the exchange), its delisting
status is changed to involuntary. In these instances, we view the company’s request to be delisted
as akin to “resigning in advance of being fired.” Other code 570 delistings which prove to be the
result of a previously agreed to merger or tender offer are reclassified as M&A delistings. CRSP
code 551 (“too few shareholders”) is almost always associated with the successful completion of
a tender offer and these delistings are classified as M&A delists rather than involuntary delists.
An important caveat is that the amount and quality of information about the delisted firms has
improved over time. In those instances, where we are unable to find information about the firm,
typically for delists occurring before 1990, we rely on the CRSP code for the classification.10 As
a result, the distinctions between voluntary and other categories of delists are likely to be noisier 10 The large number of reclassifications suggests that the CRSP codes are noisy indicators of the reasons for delisting. For example, of the 96 firms with initial delist codes of 570 we end up with 48 as “voluntary” delists after the verification process.
14
in the early part of the sample. Nonetheless, to the greatest degree possible the code verification
process ensures that our final coding reflects the firm’s actual reason for delisting.
When foreign firms list on a U.S. exchange, they must meet both the listing requirements
of the exchange and the registration requirements of the SEC. By contrast, delisting removes the
obligation to meet exchange requirements but it does not eliminate SEC registration
requirements. To eliminate all costs of compliance of U.S. regulation, foreign firms must also
deregister which requires them to establish and maintain fewer than 300 U.S. shareholders over
time. Because deregistration has implications for the potential costs savings firms can realize
from ending SEC reporting obligations and compliance with Sarbanes-Oxley, we defer our
discussion of this topic to section 4.2 on voluntary delistings. To voluntarily terminate a listing,
the NYSE requires that a firm gain the approval of its audit committee and Board of Directors
before delisting, while NASDAQ simply requires a letter stating the reasons for delisting. In
neither case is shareholder approval required.11
If a foreign firm has ADRs trading and delists, there is also no reason to maintain its
ADR program. An ADR program generally may be terminated by giving the depositary bank at
least 30 days written notice of termination. Until the stated termination date, ADR holders
typically receive the underlying ordinary shares in exchange for their ADRs. At the stated
termination date a depositary bank ceases to make new ADRs and active trading in the ADRs is
suspended. The depositary agreement generally allows ADR holders up to a year following the
stated termination date to remit their ADRs for cash. However, because “cashed-out” holders are
no longer counted as U.S. shareholders, which helps in meeting the 300 limit for deregistration,
issuers frequently amend the depository agreement to accelerate the termination date of an ADR.
11 See Macey, et. al (2004) for a discussion of NYSE and NASDAQ delisting procedures.
15
As a result, it typically takes four to five months from the notification of the intent to delist until
the actual cessation of trading.12
Table 4 presents the number and type of delists over time. Although our sample period
covers 1961-2004, the first delists do not occur until 1980. Of the 728 delistings, 463 firms
(63.6%) of the sample delist from NASDAQ and 265 (36.4%) delist from the NYSE/AMEX over
the period 1980-2004. For the overall sample of delistings, M&As make up the largest category
of NYSE delistings (62%) and involuntary delistings make up the largest category of the
NASDAQ sample (61%). For all exchanges, 51% of delistings are M&A, 42% are involuntary,
and 7% are voluntary. While all categories of delists trend upward over time, one observes a large
increase in the number of voluntary delistings in the final period. Over the twenty year period
from 1980-2000, there are a total of 17 voluntary delistings but this increases to 28 in 2001-2004
alone. Thus, the increase in voluntary delistings occurs in the period following passage of
Sarbanes-Oxley in July 31, 2002. The results for foreign firms parallel the findings of Leuz,
Triantis, and Wang (2004) and Marosi and Massoud (2005) which document an increase in the
number of U.S. firms delisting post Sarbanes-Oxley.
3.2 Reasons for Foreign Delistings
The results in Table 1 point to a deterioration in the quality of foreign entrants over time.
Yet some firms stay listed while others do not. In this section, we explore several potential
explanations for this finding. At the time of entry, delisted firms may have hoped to achieve a
level of benefits that ultimately failed to materialize and the question is why these listings prove
less successful. A useful analogy by which to consider foreign listings is the college admission
process. Foreign new lists are all “admitted” to the U.S. market but admission alone is not a
complete indicator of the success that a firm might ultimately achieve. At the point of entry stay
listed firms could be higher quality firms compared to delisted firms in a way that presages
12 Liu (2004) reports an average of 70 trading days between the announcement of an involuntary foreign delisting and actual delisting.
16
greater likelihood of success. That is, delisted firms could have lower admission criteria (e.g.,
lower grades and test scores) and be “weaker students” in the pool of admits than stay listed firms
and thus have a lower probability of success from the beginning. If these quality differences are
evident at entry, then it follows that there will also be differences between the firms entering and
the firms exiting in any given period. Alternatively, it could be that delisted firms deteriorate in
quality after listing. If this is the predominate explanation for their exit, then at the point of entry
all firms should be of similar quality. Likewise, one would expect to see deterioration in quality
on average between listing and delisting firms. In the ensuing analysis we look for evidence
consistent with these effects. First, we compare the entry characteristics of firms that stay listed
to firms that delist. This comparison occurs for the first year of listing. Second, we compare the
characteristics of entering firms to exiting firms at the same point in time. Finally we focus on
the delisted firms and compare their characteristics at various points in time between their entry
and exit. The change in the characteristics of the firms from listing to delisting amounts to a
“report card” on the firm’s stay in the U.S.
In Table 5, we compare entry characteristics related to quality for the stay listed firms and
the firms that delist. This analysis provides a first look at the “seeding” of the players upon their
arrival in the U.S. Looking first at the results over the entire sample period, 1961 – 2004, one
observes that at the time of listing the stay listed firms are larger in terms of size (%Size_Home,
Assets, and Sales) and have the highest profitability in comparison to the delisted firms.13
However the firms that eventually delist due to mergers and acquisitions are closer in size and
equal in profitability to the stay listed firms compared to the voluntary and involuntary delists. At
the time of listing, voluntary delistings are similar in size to the involuntary delistings but they are
distinguished by higher levels of profitability. Involuntary delistings are revealed to be inferior
13 With respect to time listed, as of year end 2004 the firms in the stay listed group have been listed in the U.S. for an average of nine years.
17
on many dimensions – small size and negative operating performance – in comparison to the
other groups.
When we break the full sample into five year time periods, with few exceptions the
findings for the overall sample continue to hold. M&A delistings remain closer in terms of size
and profitability to the stay listed firms. In all periods the stay listed and M&A delistings
experience positive ROA on average. Involuntary delistings are profitable firms on average
before 1986 but thereafter their profitability turns markedly negative until the final period. Since
the averages of the size variables exceed the medians by wide margins, involuntary delistings are
exceedingly small firms at the time of listing. Similar to the full sample, voluntary delistings tend
to be similar in size but more profitable than the involuntary delistings with the exception of
1991-1995 where voluntary delistings are the smallest and least profitable firms. Finally of note,
in the last period the voluntary delistings are closer in size to the stay listed firms than in the
previous periods and have the highest ROA of all groups. Thus, the evidence suggests that the
firms voluntarily delisting in 2000-2004 are of higher quality compared to the earlier sub-periods.
In Table 6, we compare the characteristics of the firms entering and exiting in a particular
time period. For example, the “New Lists” category shows characteristics of the firms entering
during 1980-1985, while the delist categories show characteristics of the firms delisting during
1980-1985. In any given time period, entering firms are presumed to be acceptable to U.S.
investors. Hence, holding the time period constant, comparing the characteristics of entering
firms with those exiting provides a framework to gauge acceptability. Without some minimal
level of acceptability, it is hard for firms to gain the investor recognition, liquidity and the other
benefits anticipated from listing. Focusing on the periods after 1986 where there are a larger
number of delists in each category, with the exception of 1991-1995, the profitability of M&A
delists at exit exceeds that of New Lists and they are closer in size to the New Lists than the other
18
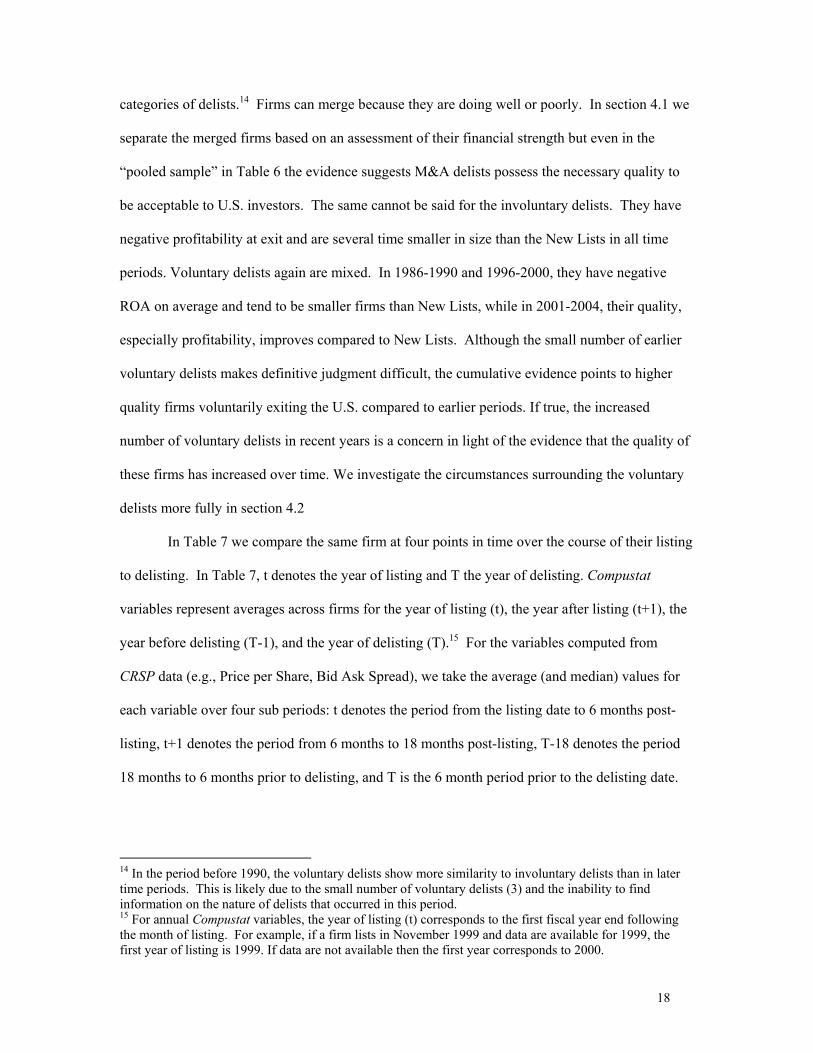
categories of delists.14 Firms can merge because they are doing well or poorly. In section 4.1 we
separate the merged firms based on an assessment of their financial strength but even in the
“pooled sample” in Table 6 the evidence suggests M&A delists possess the necessary quality to
be acceptable to U.S. investors. The same cannot be said for the involuntary delists. They have
negative profitability at exit and are several time smaller in size than the New Lists in all time
periods. Voluntary delists again are mixed. In 1986-1990 and 1996-2000, they have negative
ROA on average and tend to be smaller firms than New Lists, while in 2001-2004, their quality,
especially profitability, improves compared to New Lists. Although the small number of earlier
voluntary delists makes definitive judgment difficult, the cumulative evidence points to higher
quality firms voluntarily exiting the U.S. compared to earlier periods. If true, the increased
number of voluntary delists in recent years is a concern in light of the evidence that the quality of
these firms has increased over time. We investigate the circumstances surrounding the voluntary
delists more fully in section 4.2
In Table 7 we compare the same firm at four points in time over the course of their listing
to delisting. In Table 7, t denotes the year of listing and T the year of delisting. Compustat
variables represent averages across firms for the year of listing (t), the year after listing (t+1), the
year before delisting (T-1), and the year of delisting (T).15 For the variables computed from
CRSP data (e.g., Price per Share, Bid Ask Spread), we take the average (and median) values for
each variable over four sub periods: t denotes the period from the listing date to 6 months post-
listing, t+1 denotes the period from 6 months to 18 months post-listing, T-18 denotes the period
18 months to 6 months prior to delisting, and T is the 6 month period prior to the delisting date.
14 In the period before 1990, the voluntary delists show more similarity to involuntary delists than in later time periods. This is likely due to the small number of voluntary delists (3) and the inability to find information on the nature of delists that occurred in this period. 15 For annual Compustat variables, the year of listing (t) corresponds to the first fiscal year end following the month of listing. For example, if a firm lists in November 1999 and data are available for 1999, the first year of listing is 1999. If data are not available then the first year corresponds to 2000.
19
The use of four periods isolates the periods closest to listing and delisting which might be colored
by the events of listing or delisting.
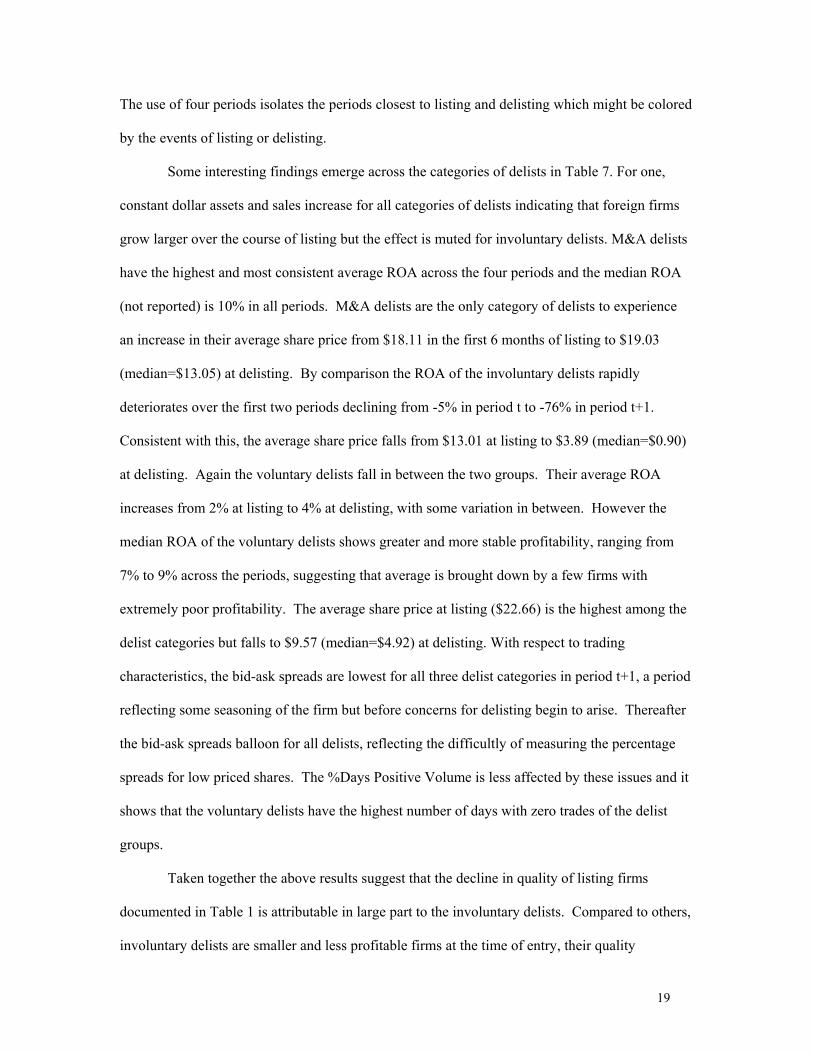
Some interesting findings emerge across the categories of delists in Table 7. For one,
constant dollar assets and sales increase for all categories of delists indicating that foreign firms
grow larger over the course of listing but the effect is muted for involuntary delists. M&A delists
have the highest and most consistent average ROA across the four periods and the median ROA
(not reported) is 10% in all periods. M&A delists are the only category of delists to experience
an increase in their average share price from $18.11 in the first 6 months of listing to $19.03
(median=$13.05) at delisting. By comparison the ROA of the involuntary delists rapidly
deteriorates over the first two periods declining from -5% in period t to -76% in period t+1.
Consistent with this, the average share price falls from $13.01 at listing to $3.89 (median=$0.90)
at delisting. Again the voluntary delists fall in between the two groups. Their average ROA
increases from 2% at listing to 4% at delisting, with some variation in between. However the
median ROA of the voluntary delists shows greater and more stable profitability, ranging from
7% to 9% across the periods, suggesting that average is brought down by a few firms with
extremely poor profitability. The average share price at listing ($22.66) is the highest among the
delist categories but falls to $9.57 (median=$4.92) at delisting. With respect to trading
characteristics, the bid-ask spreads are lowest for all three delist categories in period t+1, a period
reflecting some seasoning of the firm but before concerns for delisting begin to arise. Thereafter
the bid-ask spreads balloon for all delists, reflecting the difficultly of measuring the percentage
spreads for low priced shares. The %Days Positive Volume is less affected by these issues and it
shows that the voluntary delists have the highest number of days with zero trades of the delist
groups.
Taken together the above results suggest that the decline in quality of listing firms
documented in Table 1 is attributable in large part to the involuntary delists. Compared to others,
involuntary delists are smaller and less profitable firms at the time of entry, their quality
20
deteriorates between listing and delisting, and over the sample period. By contrast M&A delists
are larger firms at entry, increase in size over the course of listing, and have, almost without
exception, positive and stable profits. The voluntary delists fall in between the other groups but
their numbers are so few that their influence is small on the overall results. That poor quality
firms leave the U.S. is not an indictment of the U.S. market but rather a strength. Of greater
import is how firms with the requisite quality to be of interest to investors and that can potentially
benefit from listing fare in the U.S. market. From the univariate results, it appears that the U.S.
market is retaining the largest sized firms while facilitating mergers of better performing firms.
Some quality firms also appear to be voluntarily exiting the U.S. market. We examine whether
these findings hold in a multivariate setting in the next section.
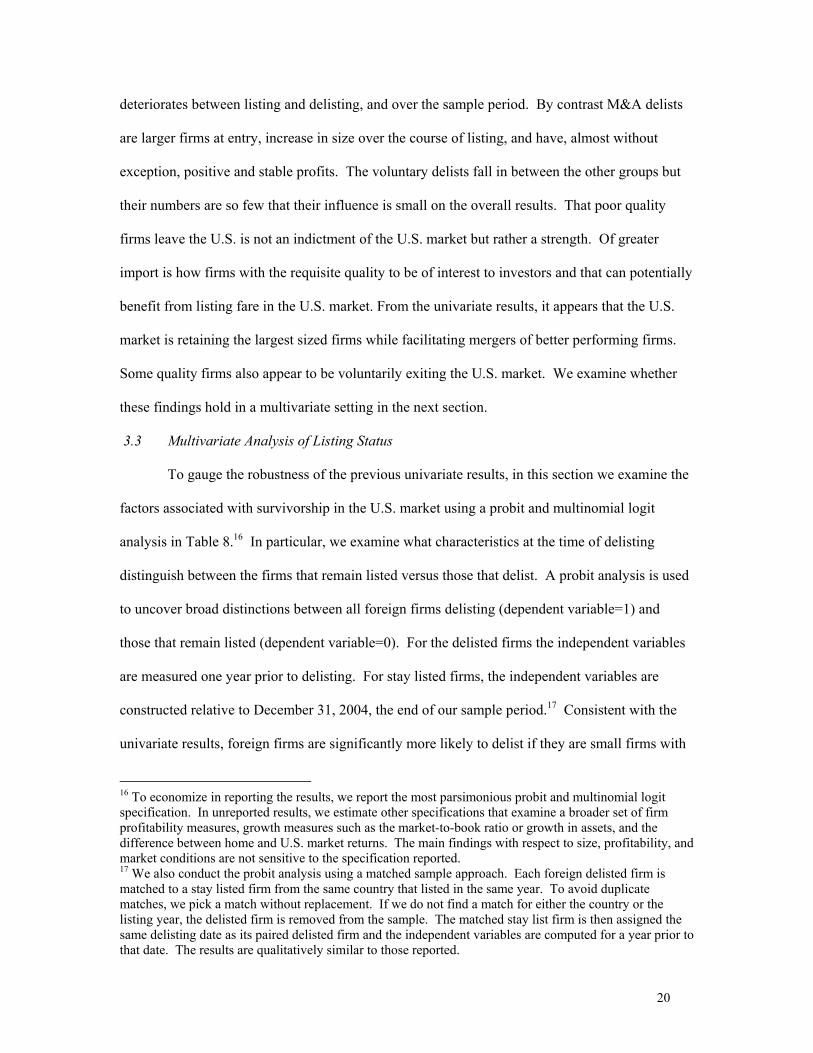
3.3 Multivariate Analysis of Listing Status
To gauge the robustness of the previous univariate results, in this section we examine the
factors associated with survivorship in the U.S. market using a probit and multinomial logit
analysis in Table 8.16 In particular, we examine what characteristics at the time of delisting
distinguish between the firms that remain listed versus those that delist. A probit analysis is used
to uncover broad distinctions between all foreign firms delisting (dependent variable=1) and
those that remain listed (dependent variable=0). For the delisted firms the independent variables
are measured one year prior to delisting. For stay listed firms, the independent variables are
constructed relative to December 31, 2004, the end of our sample period.17 Consistent with the
univariate results, foreign firms are significantly more likely to delist if they are small firms with
16 To economize in reporting the results, we report the most parsimonious probit and multinomial logit specification. In unreported results, we estimate other specifications that examine a broader set of firm profitability measures, growth measures such as the market-to-book ratio or growth in assets, and the difference between home and U.S. market returns. The main findings with respect to size, profitability, and market conditions are not sensitive to the specification reported. 17 We also conduct the probit analysis using a matched sample approach. Each foreign delisted firm is matched to a stay listed firm from the same country that listed in the same year. To avoid duplicate matches, we pick a match without replacement. If we do not find a match for either the country or the listing year, the delisted firm is removed from the sample. The matched stay list firm is then assigned the same delisting date as its paired delisted firm and the independent variables are computed for a year prior to that date. The results are qualitatively similar to those reported.
21
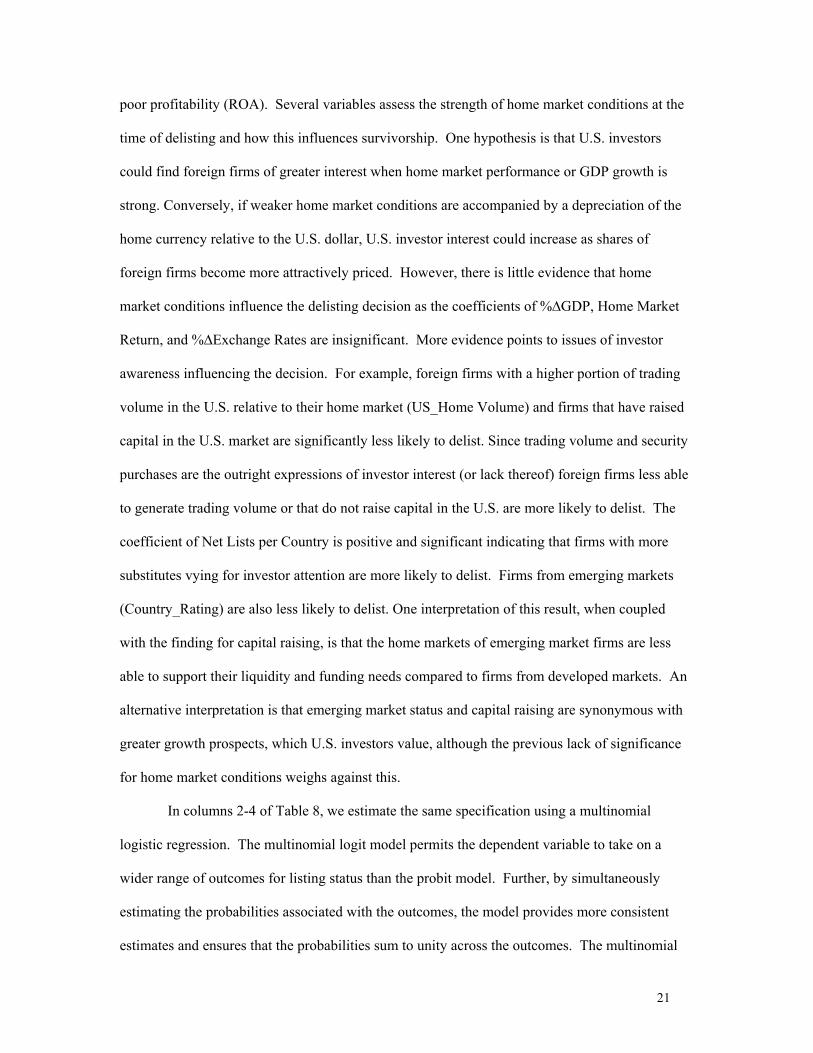
poor profitability (ROA). Several variables assess the strength of home market conditions at the
time of delisting and how this influences survivorship. One hypothesis is that U.S. investors
could find foreign firms of greater interest when home market performance or GDP growth is
strong. Conversely, if weaker home market conditions are accompanied by a depreciation of the
home currency relative to the U.S. dollar, U.S. investor interest could increase as shares of
foreign firms become more attractively priced. However, there is little evidence that home
market conditions influence the delisting decision as the coefficients of %∆GDP, Home Market
Return, and %∆Exchange Rates are insignificant. More evidence points to issues of investor
awareness influencing the decision. For example, foreign firms with a higher portion of trading
volume in the U.S. relative to their home market (US_Home Volume) and firms that have raised
capital in the U.S. market are significantly less likely to delist. Since trading volume and security
purchases are the outright expressions of investor interest (or lack thereof) foreign firms less able
to generate trading volume or that do not raise capital in the U.S. are more likely to delist. The
coefficient of Net Lists per Country is positive and significant indicating that firms with more
substitutes vying for investor attention are more likely to delist. Firms from emerging markets
(Country_Rating) are also less likely to delist. One interpretation of this result, when coupled
with the finding for capital raising, is that the home markets of emerging market firms are less
able to support their liquidity and funding needs compared to firms from developed markets. An
alternative interpretation is that emerging market status and capital raising are synonymous with
greater growth prospects, which U.S. investors value, although the previous lack of significance
for home market conditions weighs against this.
In columns 2-4 of Table 8, we estimate the same specification using a multinomial
logistic regression. The multinomial logit model permits the dependent variable to take on a
wider range of outcomes for listing status than the probit model. Further, by simultaneously
estimating the probabilities associated with the outcomes, the model provides more consistent
estimates and ensures that the probabilities sum to unity across the outcomes. The multinomial
22
logit is modeled as Pj=exp(X βj )/ [1 + Σkexp(Xβk)] where β is a vector of coefficients, X, the
vector of independent variables, and k equals 1 to J. The probability that the foreign firm “stays
listed” equals P0 = 1/[1 + ΣkexpXβk)], which represents our base case. The categorical dependent
variable is equal to 1 if a foreign firm is delisted for cause (“involuntary”), 2 if a foreign firm is
delisted following a merger or acquisition (“M&A”), and 3 if a foreign firm voluntarily delists
from a major U.S. exchange (“voluntary.”) These categories of the dependent variable measure
the probability relative to the base case of “stay listed.” The multinomial results reveal that
greater size, stronger U.S. market conditions, and more firms listed per country significantly
reduce the probability of delisting for all categories of delists. Again there is little evidence that
home market conditions influence delisting. Lower profitability increases the probability of M&A
and involuntary delisting but does not significantly affect the probability of voluntarily delisting.
Voluntary delists are more likely to occur for ADRs and NASDAQ quoted firms.
For firms having more choice about delisting, the multivariate results suggest that M&A
delists are more likely to occur for smaller firms, less profitable firms originating from developed
markets compared to stay listed firms. M&A delists also have a greater likelihood of occurrence
if firms do not raise capital with their listing, have lower percentages of U.S. trading volume, and
when there are more listed firms from the same country. Voluntary delists are more likely to
occur for smaller, NASDAQ quoted firms, and in circumstances where there are more firms from
the same country. Firm specific and U.S. market characteristics rather than home market
characteristics appear to be more influential in delisting. Further, it should be noted, that many of
the above noted factors also reflect lower investor interest in the firms’ shares.
4. A Closer Look at M&A and Voluntary Delists
In this section we examine two groups of firms, the M&A and voluntary delists, that can
meet regulatory standards but choose to delist. Because firms that are of sufficient quality to
23
meet listing standards represent a larger potential opportunity loss to U.S. investors than the firms
delisted for cause, these delisting firms deserve further attention.
4.1 M&A Delists
As noted earlier, M&A delists provide a mixed signal with respect to quality. Some
firms are acquired because it is a better alternative than failing; others choose to be acquired
because they have some asset or potential value that other firms recognize and will pay for. In
this section, we identify the firms that merge “from strength” as opposed to those which appear to
have few alternatives. These firms have greater potential to be of interest to other firms and in
delisting choose to avail themselves of the opportunities that arise following listing in the U.S.
By eliminating the weaker M&A delists, we obtain a clearer picture of how these firms compare
to the stay listed firms than in the earlier analysis.
To focus on the M&A delists with stronger performance, we search Mergent for more
information on the firms. We previously eliminated firms that were classified by their CRSP
codes as M&A delists but showed evidence of financial distress, moved to the Pink Sheets, or to
the OTC market. For this analysis we further eliminate firms that have average share prices
below $5 in the six months prior to delisting. Since $5 is often used as a threshold below which
certain institutional investors cannot hold the shares, it is a reasonable first cut at quality,
although the results are not sensitive to cut-offs between $1.50 and $5.00. Relative to the 309
M&A delists in the original sample, this criterion eliminates 74 firms. The 235 M&A delists that
remain are compared to stay listed firms with average share prices above $5 in the six months
prior to December 31, 2004. The original stay listed sample is reduced by 123 firms by the
imposition of the $5 price cut-off.
The elimination of weaker M&A delists in Table 9 produces, as expected, a sample of
larger and more profitable firms relative to Table 5. For example, in Table 5 the original sample
of M&A delists had at listing average total assets of $1,666 million, sales of $959 million, and
8% ROA. By comparison “strong” M&A delists are larger in terms of total assets ($2,130
24
million) and sales ($1,222 million) and have higher ROA of 10%. The stay listed group remains
significantly larger firms in terms of assets and sales but have comparable profitability and
growth rates of assets and sales. Strong M&A delists and stay listed firms also have similar
analyst coverage and similar proportions of volume traded in the U.S. versus the home market.
This evidence indicates that the firms achieve equivalent levels of investor recognition as the stay
listed firms, which helps create the opportunity to be acquired. Relative to earlier results, one
also observes a larger change in share price from listing to delisting for this group as their average
share price increases by 21% over the course of listing.
We repeat the analysis in Table 9 using a matched sample of strong M&A delists and stay
listed firms (not reported). For this analysis we match each M&A delist to a stay listed firm from
the same country that listed in the same year (see footnote 17 for a discussion of the approach).
The matched sample results in 51 pairs of firms for comparison. In the year of listing strong
M&A delists have average assets of $2.1 billion and a share price at listing of $20.35 compared
$21.8 billion in assets and a $26.85 share price for the matched firms. The other variables, such as
ROA, growth rates in assets and sales, and analyst coverage, do not differ between the groups.
Thus, the results are qualitatively similar to those reported in Table 9.
In unreported results, we find that the majority of the strong M&A delists do not leave
the U.S. but become part of a larger entity that stays in the U.S. Although these foreign firms
delist, their entry and subsequent take over by firms operating in the U.S. redounds to the benefit
of the U.S. economy.
4.2 Voluntary Delists
Voluntary delistings raise the question why firms that can meet the necessary regulatory
thresholds exit the U.S. market. Because these firms possess the requisite quality, their exit raises
the greatest concern about the competitiveness of the U.S. markets. Since 2002 most this concern
has centered on whether the high regulatory costs accompanied by the passage of SOX are
driving foreign firms to leave the U.S. There are several reasons to believe that SOX may not be
25
the only driver of voluntary delistings. First, as discussed in the studies of U.S. delistings by
Leuz, Triantis and Wang, (2004) and Marosi and Massoud (2005) the extent of potential cost
savings from delisting is complicated by the fact that delisting from a U.S. exchange removes the
obligation to meet exchange requirements but it does not eliminate SEC registration
requirements. There is general agreement that the bulk of listing requirements and costs involve
SEC registration.18 By comparison to U.S. firms, the process of deregistration is more arduous
for foreign firms. SEC registration is triggered not only by listing, but also by the existence of a
significant shareholder base. Foreign firms with assets greater than $10 million that have over
500 shareholders world-wide of whom 300 or more are resident in the United States, are required
to register their shares under Section 12 of the Exchange Act, regardless of whether they are
exchange listed. Hence, before a foreign firm can terminate its registration and cease filing with
the SEC it must verify that it has fewer than 300 shareholders in the United States. If the firm has
fewer than 300 U.S. shareholders, it can terminate its registration under the Exchange Act by
filing Form 15 with the SEC. However, Form 15 is effective only for as long as the issuer
maintains fewer than 300 shareholders in the United States. For firms that have previously issued
securities in the U.S., if the number of shareholders in the United States increases above 300, the
issuer can again find itself subject to the reporting requirements of the Exchange Act.19 Moreover
for dual listed firms, it is difficult to police the nationality of individuals purchasing their shares –
18If the foreign firm conducts a public offering, the issuer will have filed a Form F-1 registration statement with the SEC under the Securities Act and Form 8-A to effect the registration under the Exchange Act. If the firm only lists securities, it will have filed a Form 20 – F registration statement under the Exchange Act. In either case, if the issuer enters the United States using an ADR, it will have also filed a Form F-6 registration statement. 19 This complication occurs for firms that conduct public offerings in the United States. They become subject to an independent SEC reporting requirement under Section 15(d). Section 15(d) provides that if an issuer has ever filed an effective registration under the Securities Act of 1933, the issuer has continuing reporting obligations under the Exchange Act. For issuers that are registered under Section 12 (b) and (g) of the Exchange Act, practically speaking this is a redundant reporting requirement. However, should the foreign firm later terminate its Exchange Act registration, Section 15(d) reporting obligations do not terminate and can only be temporarily suspended if U.S. shareholders number less than 300.
26
making it potentially more difficult for foreign firms to stay permanently below the 300
shareholder limit. 20
An additional challenge foreign firms’ face in meeting the 300 shareholder limit is the
manner in which they are required to count the number of U.S. shareholders who hold their ADRs
and the underlying ordinary shares. If securities are held in street name by financial institutions
(e.g., brokers, mutual finds, and banks), foreign firms are currently required to identify the
number of separate accounts containing shares of U.S. residents on a worldwide basis.21 In
meeting the 300 holder limit, a foreign firm must count each of the separate accounts as a holder
of record, whereas a U.S. firm is allowed treat all the shares held in street name by a single
institution as one holder of record. Also counting toward the 300 holder limit are the ordinary
shares held by U.S. investors in accounts at foreign banks and brokers. The law is silent with
respect to whether firms can rely on third parties to assist in counting their shares. Consequently,
foreign firms frequently complain that it is more difficult for them to accurately identify the
number of U.S. shareholders and to meet the 300 holder limit than for U.S. firms. Absent
deregistering, foreign firms do not escape SEC regulation and are unable to achieve the bulk of
the costs savings from exiting the U.S.22
While foreign firms voluntarily exiting the U.S. often point to the increased regulatory
burden of the U.S. markets post-SOX, they often cite other reasons for their delistings. The
20 The temporary nature of the suspension from registration has prompted some deregistered foreign issuers to amend their articles of incorporation to limit the number of U.S. shareholders below 300. 21For example, if 10 individuals hold shares at Fidelity, Inc. in individual accounts a U.S. firm can count that as one holder of record, whereas a foreign firm must count it as 10 holders of record. 22 Another distinction between U.S. and foreign firms’ delistings concerns access to alternative vehicles for liquidity and capital in the U.S. U.S. firms that “go dark” will often immediately become eligible to trade on the Pink Sheets which does not require that a firm be registered with the SEC (see Leuz, Triantis and Wang, 2004, and Marosi and Massoud, 2005). Foreign firms quoted on the Pink Sheets are required to have a Rule 12g3-2(b) exemption from registration, which allows a foreign firm, not otherwise listed in the U.S., to avoid registration if it furnishes an English translation of its local filings to the SEC. Before a delisted foreign firm can seek a Rule 12g3-2(b) exemption it must establish that it has fewer than 300 U.S. shareholders for a continuous period of at least eighteen months. Were this rule not in place, more foreign firms might upon delisting establish Level I ADRs that trade on the Pink Sheets and maintain a market for U.S. investors without being subject to SEC regulation. In addition, access to the Rule144A market and the potential capital raising opportunities provided through Qualified Institutional Buyers also requires a 12g3-2(b) exemption.
27
recent experience of Fisher and Paykel Industries illustrates the set of circumstances that
managers face in delisting their securities. Fisher and Paykel Industries, a New Zealand
conglomerate, had a low-growth appliance division and high-growth healthcare division. In
November 2001, the company decided to separate into two companies and conducted a U.S. IPO
on NASDAQ of the health care company issuing 4.4 million ADRs representing 17.6 million
ordinary shares or 18% of its outstanding shares. Tony Buckley the CFO of Fisher and Paykel
describes the motivation to voluntarily delist from NASDAQ just 15 months later.
“In February, 2003, the board made the decision that the ADR wasn’t cost effective. Only 1% of our shareholders held ADRs, we had Sarbanes-Oxley and heavy compliance costs and our shareholders in Australia and New Zealand kept asking us why were we still listed in the U.S. when it was costing as half a million bucks a year. Our New Zealand and Australian investors told us they would fund our capital raising so it wasn’t as if we couldn’t raise capital elsewhere. The decision was made to remove the compliance cost and return to being an Australasian listed company – where the volume was and at that stage too where the majority of the investors were. Of course if we had 20% of our shares in ADRs and there was reasonable trading in them then Sarbanes-Oxley would’ve been just another thing to manage.”
This example underscores what most firms say upon delisting – that the costs of SOX are not in
proportion to the extent of U.S. investor interest in their shares.23 This suggests that the role
regulatory costs play in affecting the firm’s decision to stay or exit the U.S. market is properly
placed within the larger context of understanding what factors contribute to viable foreign
listings.24 Also contributing to this view is an acknowledgement among some practitioners that
too many firms have ADRs. Patrick Colle, Global Business Head for the JP Morgan ADR group,
notes: “In slow times some banks do go out and pitch ADRs to three men and a shovel. There are
23 Consistent with this, a recent survey by the Bank of New York finds that only 8% of foreign firms view of the provisions of Sarbanes-Oxley as onerous enough to consider delisting (see Bank of New York, 2004). 24 A related study by Karolyi (2003) recounts the creation of global registered share (GRS) by DaimlerChrysler in November 1998. The DCX share, created following the merger of Daimler Benz and Chrysler, attempted to increase shareholder value by creating a fully fungible, seamlessly traded security that was expected to increase liquidity, and reduce volatility and cross-border trading and settlement costs. Ironically a security designed to facilitate trading across a number of markets resulted in a higher concentration of trading in one market–Frankfurt–and a drying up of liquidity in other markets.
28
too many ADR programs. There are companies that have them and don’t know why they have
one and clearly do not need one (Neville, 2004).” ADRs that result from pitches to “three men
and a shovel” are more likely to be the kind of firms that struggle to achieve benefits from listing
and in the face of increased regulatory costs these firms are more likely to delist. These firms
then are also less likely to have been viable candidates for listing.
In Table 10 we examine characteristics of the 20 firms that voluntarily delisted from a
major U.S. exchange between 2001 and 2004. This sample is smaller than the 28 voluntarily
delists reported in Table 4 over the same period because we require the firms to have CRSP data
available over the course of listing. Our sample starts a year before the first reported notice of
SOX in February 2002, but in a year colored by concerns in the press about corporate excesses
and lax corporate governance (Smith, 2005). First note that the firms voluntarily delisting are
almost exclusively from developed countries. This is consistent with the view frequently
expressed by the firms that their home markets are of sufficient size to meet their needs. Twelve
of the 20 firms voluntarily delisting were also listed after 1999 (60%), indicating the rapid speed
of delisting. Firms listed after 1999 also reflect the deteriorating quality of new lists as they are
generally smaller and less profitable firms than those listed before 1999. In the year of listing
assets average $1,378 million but the average is driven by a few large firms so that the median
assets is $161 million. Likewise, the median market capitalization of the firms at listing and
delisting is less than $230 million. Eleven firms have share prices lower at delisting than at
listing (55%) and the average firm’s share price declines by 54% (median=42%) over the course
of listing. Despite our attempts to screen for evidence of distress, five firms have share prices
below $5 at delisting. Only eight of the 20 firms (40%) have analyst coverage within a year
following listing. Overall, the picture that emerges from Table 10 is that while a few voluntary
delists appear to have the size and strength to be viable candidates for listing, the majority
struggle to gain U.S. investor recognition. Absent investor recognition, it is difficult to achieve
the benefits expected from listing. Therefore, foreign firms’ decision to voluntarily delist appears
29
to involve issues of quality and investor recognition or the lack thereof. No doubt an increase in
regulatory costs can cause firms to revisit their decision to list.25 Since we do not observe large
numbers of strong firms voluntarily delisting, the evidence does not suggest that regulatory costs
alone are driving firms from the U.S. The dimension of foreign firms’ ability to attract U.S.
investor interest deserves to be a greater part of the discussion in determining the role of SOX.
5. Conclusions
Much (too much in our view) of the discussion about the overall competitiveness of the
U.S. capital markets has taken place without regard for the factors that contribute to viable
foreign listings. Firms choose to list in the U.S. if the benefits of listing exceed the costs – but to
focus only on the costs without examining the potential for firms to benefit from listing misses an
important part of the equation. Absent sufficient quality, it is difficult for firms to achieve the
benefits expected from listing. To address this issue, we examine the listings and delistings of
foreign firms from major U.S. exchanges over the period 1961 – 2004. Over this period a total of
1,330 foreign firms listed and 728 firms delisted due to merger and acquisitions, involuntary, or
voluntary reasons. The large number of listings and delistings spanning over 40 years suggests
that there is a long standing dynamic to foreign firm’s entry and exit from the U.S. The pattern of
foreign firms listing and delisting in the U.S. over this period shows a steady and persistent
decline in the length of time a foreign firm stays listed in the U.S. Firms listed before 1970 stay
listed an average of 33 years and this declines steadily over the next three decades to five years
for firms listed after 1995. A major reason for the decline is that over time, not unlike the pattern
for U.S. new lists, there has been deterioration in the quality of foreign firms listing in the U.S.
with respect to their size and profitability.
25 While it may seem that the voluntary delists in Table 10 are similar to the voluntary delists reported in Table 5 (last row, 2001-04), the difference is that the delists in Table 5 for 2001-04 are the voluntary delists that listed during 2001-04, whereas in Table 10 we use the voluntary delists that delisted during 2001-04.
30
The 728 delistings of foreign firms from major U.S. exchanges over 1961-2004 break
down into, 371 involuntary delistings, 309 M&A delistings, and 48 voluntary delistings. Our
results show that larger, more profitable firms, with proportionally more U.S. trading volume, and
the ability to raise capital are more likely to survive in the U.S. market. Strong U.S. market
conditions rather than home market conditions also improve the chances of survival in the U.S.
Taken together these characteristics suggest either reasons why or evidence that U.S. investors
find these firms attractive. Investor recognition is central to achieving many of the oft cited
benefits of listing.
When we look at the voluntary delists in the period 2001-2004 we find that these firms
have median assets and market capitalizations of less than $230 million. Fifty-five percent of the
firms have share prices lower at delisting than at listing and the average firm’s share price
declines by 54% over the course of listing. Sixty percent of the firms are without analyst
coverage a year following listing. It is doubtful that the delisting of these firms from the U.S.
market constitutes a large loss to investors. Just as importantly if one looks at the firms listing in
2001-2004, one observes for the first time in many years rising quality among the firms entering
the U.S. Whether this is due to perceptions of increased regulatory costs prompting higher
quality firms to list, one cannot say. But these firms possess greater size and profitability at
listing, characteristics which have been historically associated with higher levels of survivorship.
Since one role of listing standards is to ensure that high quality firms list in the U.S., our evidence
indicates that the market appears to be working and that better firms are choosing to list.
While our findings are important in assessing the impact of regulatory changes, they are
only part of the story. An examination of the foreign firms “choosing not to come” to the U.S. is
also necessary to understand the full implications of recent regulatory changes. It appears from
anecdotal evidence that firms are choosing to issue in relatively unregulated oversees markets.
Future studies will be aided by more time elapsing since the passage of SOX which will permit a
greater range of market conditions to be observed. Nonetheless, future inquiries will be aided by

31
the baselines we have set forth about foreign firms’ patterns of exit and entry in the world’s
largest capital markets.
32
References
Amihud, Y. and H. Mendelson, 1986, Asset pricing and the bid-ask spread, Journal of Financial
Economics 17, 223-249. Baker, K, H., Powell G., and D. Weaver, 1999, Does NYSE Listing Affect Visibility?, Financial
Management 28, 46-54. Bank of New York, 2004, ADR issuers complying with Sarbanes-Oxley governance standards,
(with Broadgate Capital Advisors and The Value Alliance Company), June. Bekaert, G. and C. Harvey, 1995, Time-varying world market integration, Journal of Finance 50,
403-444. Bradley, D., Jordon B., and J. Ritter, 2003, The quiet period goes out with a bang, Journal of
Finance 58, 1-36. Brennan, M. and A. Subrahmanyam, 1996, Market microstructure and asset pricing: On the
compensation for illiquidity in stock returns, Journal of Financial Economics 41, 441-464.
Bruner, R., Chaplinsky, S., and L. Ramchand, 2004, U.S.-bound IPOs: Issue costs and selective
entry, Financial Management, no. 3, Autumn 2004, 39-60. Cliff, M. T. and D. Denis, 2004, Do IPO firms purchase analyst coverage with underpricing?,
Journal of Finance 59, 2871-2962. Coffee, J., 1999, The future as history: the prospects for global convergence in corporate
governance and its implications, Northwestern University Law Review 93, 641-708. Cowan, A., Carter R.., Dark F., and A. Singh, 1992, Explaining the NYSE listing choices of
NASDAQ firms, Financial Management 21, no. 4, 73-86. Doidge, C., Karoyli G.A., and R. Stulz, 2004, Why are foreign firms listed in the U.S. worth
more?, Journal of Financial Economics 71, 205-238. Errunza, V., and D.P. Miller, 2000, Market segmentation and the cost of capital in international
markets, Journal of Financial and Quantitative Analysis 35, 577-600. Foerster, S., and G.A. Karolyi, 1999, The effects of market segmentation and investor recognition
on asset prices: Evidence of foreign stock listings in the U.S., 54, 981-1014. Henry, P. B., 2000a, Stock market liberalization, economic reform, and emerging market equity
prices, Journal of Finance 55, 529-564. Henry, P. B., 2000b, Do stock market liberalizations cause investment booms?, Journal of
Financial Economics 58, 301-334. Karolyi, G. A., 1998, What happens to stocks that list shares abroad? A survey of evidence and its
managerial implications, NYU Salomon Brothers Center Monograph Series 7, 1-60.
33
Karoyli, G.A., 2003, DaimlerChrysler AG, The first truly global share, Journal of Applied
Corporate Finance 9, 409-430. Karoyli, G.A., 2004, The world of cross listings and cross listings of the world: Challenging the
conventional wisdom, Ohio State University, Fisher College of Business working paper, November.
Leuz, C., Triantis, A., and T. Wang, 2004, Why do firms go dark? Causes and economic
consequences of voluntary SEC deregistrations, University of Pennsylvania: Wharton School, working paper.
Lins, K., Strickland, D., and M. Zenner, 2004, Do non-U.S. firms issue stock on U.S. equity
markets to relax capital constraints?, Journal of Financial and Quantitative Analysis forthcoming.
Liu, S., 2004, The impacts of foreign involuntary delistings: An empirical analysis, Texas A&M
International University working paper, November. Macey, J., Ohara, M., and D. Pompillo, 2004, Down and out in the stock market: the law and
finance of the delisting process, Cornell University working paper, February. Marosi, A. and N. Massoud, 2005, Why do firms go dark?, University of Alberta working paper,
Journal of Financial and Quantitative Analysis forthcoming. Merton, R., 1987, A simple model of capital market equilibrium with incomplete information,
Journal of Finance 42, 483-510. Miller, D. P., 1999, The market reaction to international cross-listing: Evidence from depositary
receipts, Journal of Financial Economics 51, 103-124. Neville, T., 2004, Value trumps prestige, Corporate Finance, July/August, 30-33. Sanchez, J., 2005, European firms find American delisting not a simple task, IR Magazine, June,
62-65. Sarkissian, S., and M.J Schill, 2004, The overseas listing decision: New evidence of proximity
preference, Review of Financial Studies 17, 769-809. Smith, Geoffrey, 2005, Why do non-U.S. firms cross list in the U.S.? A test of the bonding
hypothesis, University of Georgia, Terry College of Business working paper, November. Witmer, J., 2006, Why do firms cross-delist? An examination of the determinants and effects of
cross-delisting, Bank of Canada, Financial Markets Department working paper, September.
Yehezkel, A., 2005, Foreign corporations listing in the United States – does law matter? Testing
the Israeli phenomenon, University of Illinois College of Law working paper.
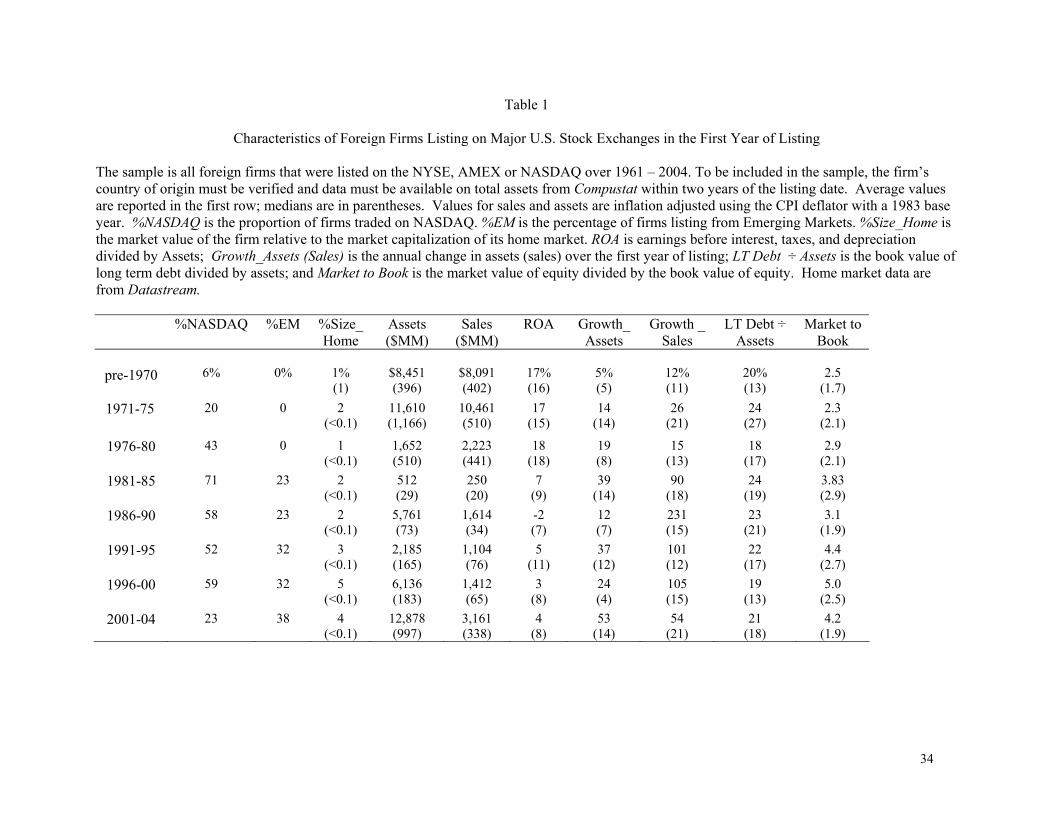
34
Table 1
Characteristics of Foreign Firms Listing on Major U.S. Stock Exchanges in the First Year of Listing
The sample is all foreign firms that were listed on the NYSE, AMEX or NASDAQ over 1961 – 2004. To be included in the sample, the firm’s country of origin must be verified and data must be available on total assets from Compustat within two years of the listing date. Average values are reported in the first row; medians are in parentheses. Values for sales and assets are inflation adjusted using the CPI deflator with a 1983 base year. %NASDAQ is the proportion of firms traded on NASDAQ. %EM is the percentage of firms listing from Emerging Markets. %Size_Home is the market value of the firm relative to the market capitalization of its home market. ROA is earnings before interest, taxes, and depreciation divided by Assets; Growth_Assets (Sales) is the annual change in assets (sales) over the first year of listing; LT Debt ÷ Assets is the book value of long term debt divided by assets; and Market to Book is the market value of equity divided by the book value of equity. Home market data are from Datastream.
%NASDAQ %EM %Size_
Home Assets ($MM)
Sales ($MM)
ROA Growth_ Assets
Growth _ Sales
LT Debt ÷ Assets
Market to Book
pre-1970
6%
0%
1% (1)
$8,451 (396)
$8,091 (402)
17% (16)
5% (5)
12% (11)
20% (13)
2.5
(1.7) 1971-75
20 0 2 (<0.1)
11,610 (1,166)
10,461 (510)
17 (15)
14 (14)
26 (21)
24 (27)
2.3 (2.1)
1976-80 43 0 1 (<0.1)
1,652 (510)
2,223 (441)
18 (18)
19 (8)
15 (13)
18 (17)
2.9 (2.1)
1981-85 71 23 2 (<0.1)
512 (29)
250 (20)
7 (9)
39 (14)
90 (18)
24 (19)
3.83 (2.9)
1986-90 58 23 2 (<0.1)
5,761 (73)
1,614 (34)
-2 (7)
12 (7)
231 (15)
23 (21)
3.1 (1.9)
1991-95 52 32 3 (<0.1)
2,185 (165)
1,104 (76)
5 (11)
37 (12)
101 (12)
22 (17)
4.4 (2.7)
1996-00 59 32 5 (<0.1)
6,136 (183)
1,412 (65)
3 (8)
24 (4)
105 (15)
19 (13)
5.0 (2.5)
2001-04 23 38 4 (<0.1)
12,878 (997)
3,161 (338)
4 (8)
53 (14)
54 (21)
21 (18)
4.2 (1.9)
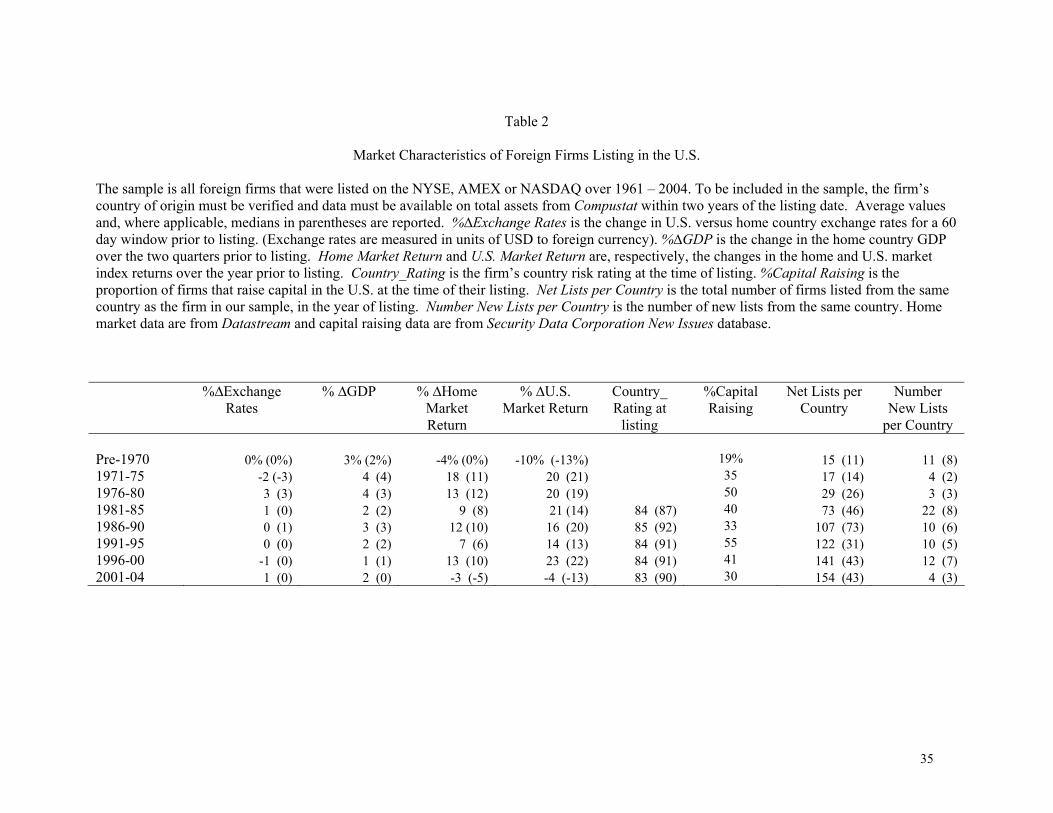
35
Table 2
Market Characteristics of Foreign Firms Listing in the U.S.
The sample is all foreign firms that were listed on the NYSE, AMEX or NASDAQ over 1961 – 2004. To be included in the sample, the firm’s country of origin must be verified and data must be available on total assets from Compustat within two years of the listing date. Average values and, where applicable, medians in parentheses are reported. %∆Exchange Rates is the change in U.S. versus home country exchange rates for a 60 day window prior to listing. (Exchange rates are measured in units of USD to foreign currency). %∆GDP is the change in the home country GDP over the two quarters prior to listing. Home Market Return and U.S. Market Return are, respectively, the changes in the home and U.S. market index returns over the year prior to listing. Country_Rating is the firm’s country risk rating at the time of listing. %Capital Raising is the proportion of firms that raise capital in the U.S. at the time of their listing. Net Lists per Country is the total number of firms listed from the same country as the firm in our sample, in the year of listing. Number New Lists per Country is the number of new lists from the same country. Home market data are from Datastream and capital raising data are from Security Data Corporation New Issues database.
%∆Exchange Rates
% ∆GDP % ∆Home Market Return
% ∆U.S. Market Return
Country_ Rating at
listing
%Capital Raising
Net Lists per Country
Number New Lists
per Country
Pre-1970 0% (0%) 3% (2%) -4% (0%) -10% (-13%) 19% 15 (11) 11 (8) 1971-75 -2 (-3) 4 (4) 18 (11) 20 (21) 35 17 (14) 4 (2) 1976-80 3 (3) 4 (3) 13 (12) 20 (19) 50 29 (26) 3 (3) 1981-85 1 (0) 2 (2) 9 (8) 21 (14) 84 (87) 40 73 (46) 22 (8) 1986-90 0 (1) 3 (3) 12 (10) 16 (20) 85 (92) 33 107 (73) 10 (6) 1991-95 0 (0) 2 (2) 7 (6) 14 (13) 84 (91) 55 122 (31) 10 (5) 1996-00 -1 (0) 1 (1) 13 (10) 23 (22) 84 (91) 41 141 (43) 12 (7) 2001-04 1 (0) 2 (0) -3 (-5) -4 (-13) 83 (90) 30 154 (43) 4 (3)
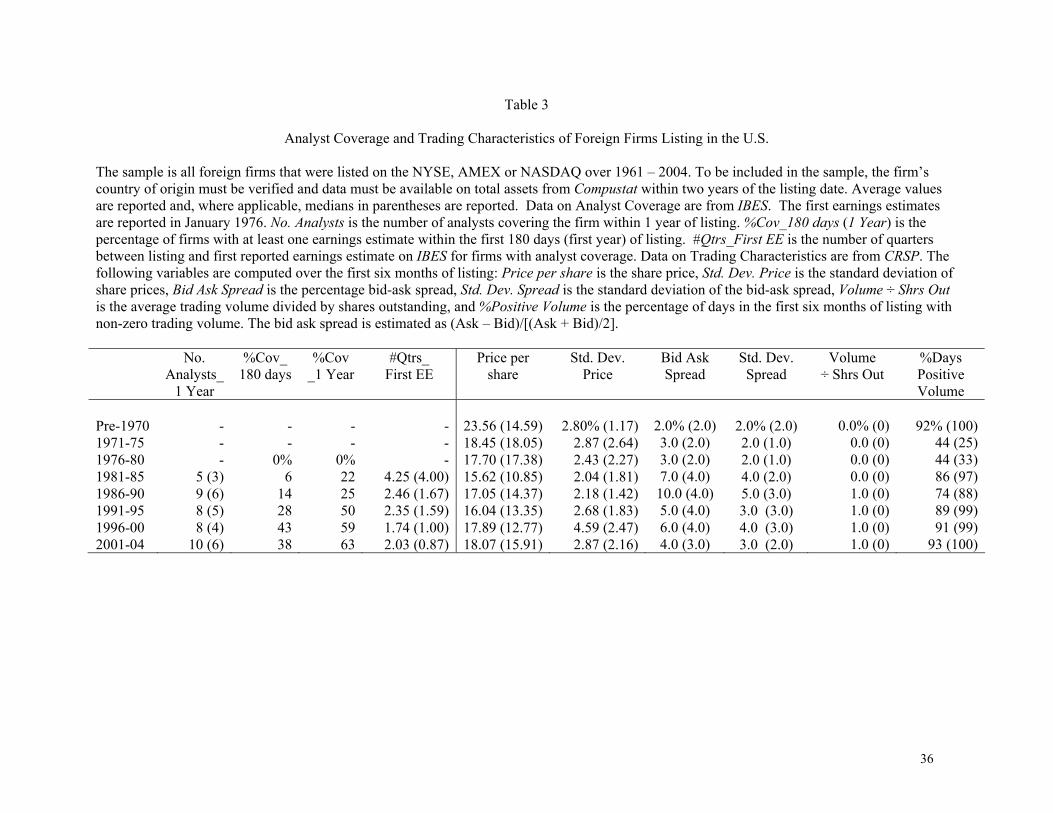
36
Table 3
Analyst Coverage and Trading Characteristics of Foreign Firms Listing in the U.S. The sample is all foreign firms that were listed on the NYSE, AMEX or NASDAQ over 1961 – 2004. To be included in the sample, the firm’s country of origin must be verified and data must be available on total assets from Compustat within two years of the listing date. Average values are reported and, where applicable, medians in parentheses are reported. Data on Analyst Coverage are from IBES. The first earnings estimates are reported in January 1976. No. Analysts is the number of analysts covering the firm within 1 year of listing. %Cov_180 days (1 Year) is the percentage of firms with at least one earnings estimate within the first 180 days (first year) of listing. #Qtrs_First EE is the number of quarters between listing and first reported earnings estimate on IBES for firms with analyst coverage. Data on Trading Characteristics are from CRSP. The following variables are computed over the first six months of listing: Price per share is the share price, Std. Dev. Price is the standard deviation of share prices, Bid Ask Spread is the percentage bid-ask spread, Std. Dev. Spread is the standard deviation of the bid-ask spread, Volume ÷ Shrs Out is the average trading volume divided by shares outstanding, and %Positive Volume is the percentage of days in the first six months of listing with non-zero trading volume. The bid ask spread is estimated as (Ask – Bid)/[(Ask + Bid)/2].
No. Analysts_
1 Year
%Cov_ 180 days
%Cov _1 Year
#Qtrs_ First EE
Price per share
Std. Dev. Price
Bid Ask Spread
Std. Dev. Spread
Volume ÷ Shrs Out
%Days Positive Volume
Pre-1970 - - - - 23.56 (14.59) 2.80% (1.17) 2.0% (2.0) 2.0% (2.0) 0.0% (0) 92% (100)1971-75 - - - - 18.45 (18.05) 2.87 (2.64) 3.0 (2.0) 2.0 (1.0) 0.0 (0) 44 (25)1976-80 - 0% 0% - 17.70 (17.38) 2.43 (2.27) 3.0 (2.0) 2.0 (1.0) 0.0 (0) 44 (33)1981-85 5 (3) 6 22 4.25 (4.00) 15.62 (10.85) 2.04 (1.81) 7.0 (4.0) 4.0 (2.0) 0.0 (0) 86 (97)1986-90 9 (6) 14 25 2.46 (1.67) 17.05 (14.37) 2.18 (1.42) 10.0 (4.0) 5.0 (3.0) 1.0 (0) 74 (88)1991-95 8 (5) 28 50 2.35 (1.59) 16.04 (13.35) 2.68 (1.83) 5.0 (4.0) 3.0 (3.0) 1.0 (0) 89 (99)1996-00 8 (4) 43 59 1.74 (1.00) 17.89 (12.77) 4.59 (2.47) 6.0 (4.0) 4.0 (3.0) 1.0 (0) 91 (99)2001-04 10 (6) 38 63 2.03 (0.87) 18.07 (15.91) 2.87 (2.16) 4.0 (3.0) 3.0 (2.0) 1.0 (0) 93 (100)
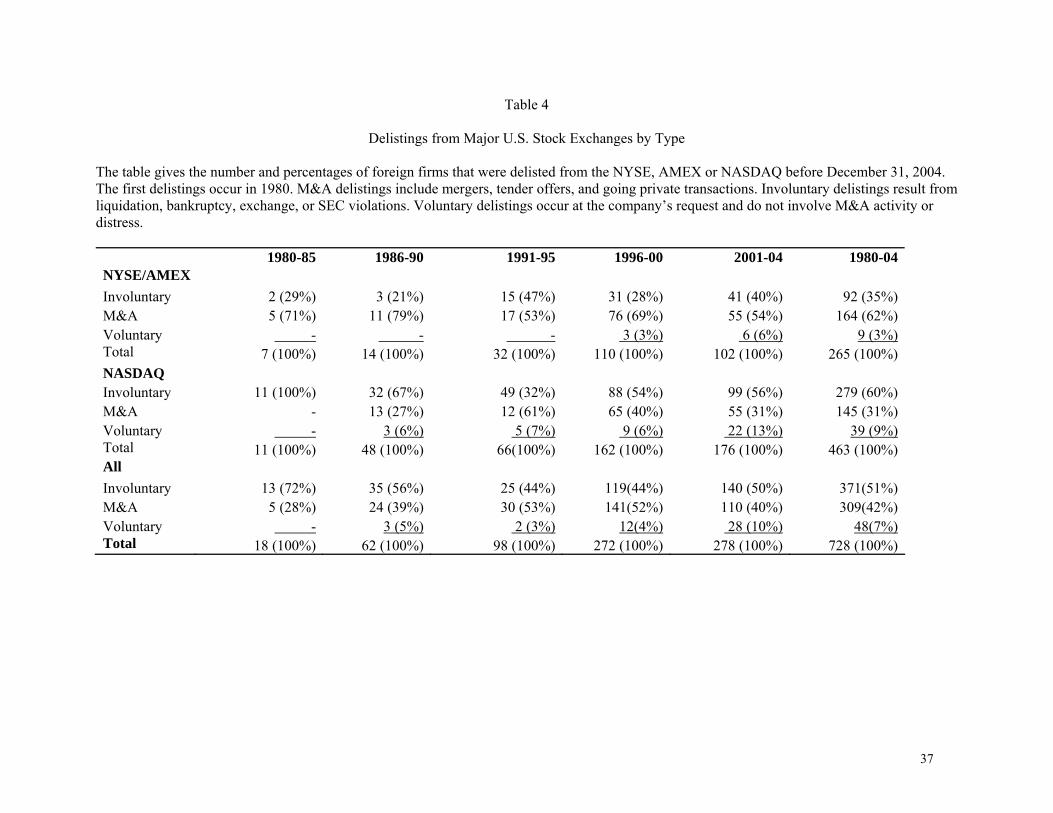
37
Table 4
Delistings from Major U.S. Stock Exchanges by Type
The table gives the number and percentages of foreign firms that were delisted from the NYSE, AMEX or NASDAQ before December 31, 2004. The first delistings occur in 1980. M&A delistings include mergers, tender offers, and going private transactions. Involuntary delistings result from liquidation, bankruptcy, exchange, or SEC violations. Voluntary delistings occur at the company’s request and do not involve M&A activity or distress. 1980-85 1986-90 1991-95 1996-00 2001-04 1980-04NYSE/AMEX
Involuntary 2 (29%) 3 (21%) 15 (47%) 31 (28%) 41 (40%) 92 (35%)M&A 5 (71%) 11 (79%) 17 (53%) 76 (69%) 55 (54%) 164 (62%)Voluntary - - - 3 (3%) 6 (6%) 9 (3%)Total 7 (100%) 14 (100%) 32 (100%) 110 (100%) 102 (100%) 265 (100%)NASDAQ Involuntary 11 (100%) 32 (67%) 49 (32%) 88 (54%) 99 (56%) 279 (60%)M&A - 13 (27%) 12 (61%) 65 (40%) 55 (31%) 145 (31%)Voluntary - 3 (6%) 5 (7%) 9 (6%) 22 (13%) 39 (9%)Total 11 (100%) 48 (100%) 66(100%) 162 (100%) 176 (100%) 463 (100%)All Involuntary 13 (72%) 35 (56%) 25 (44%) 119(44%) 140 (50%) 371(51%)M&A 5 (28%) 24 (39%) 30 (53%) 141(52%) 110 (40%) 309(42%)Voluntary - 3 (5%) 2 (3%) 12(4%) 28 (10%) 48(7%)Total 18 (100%) 62 (100%) 98 (100%) 272 (100%) 278 (100%) 728 (100%)
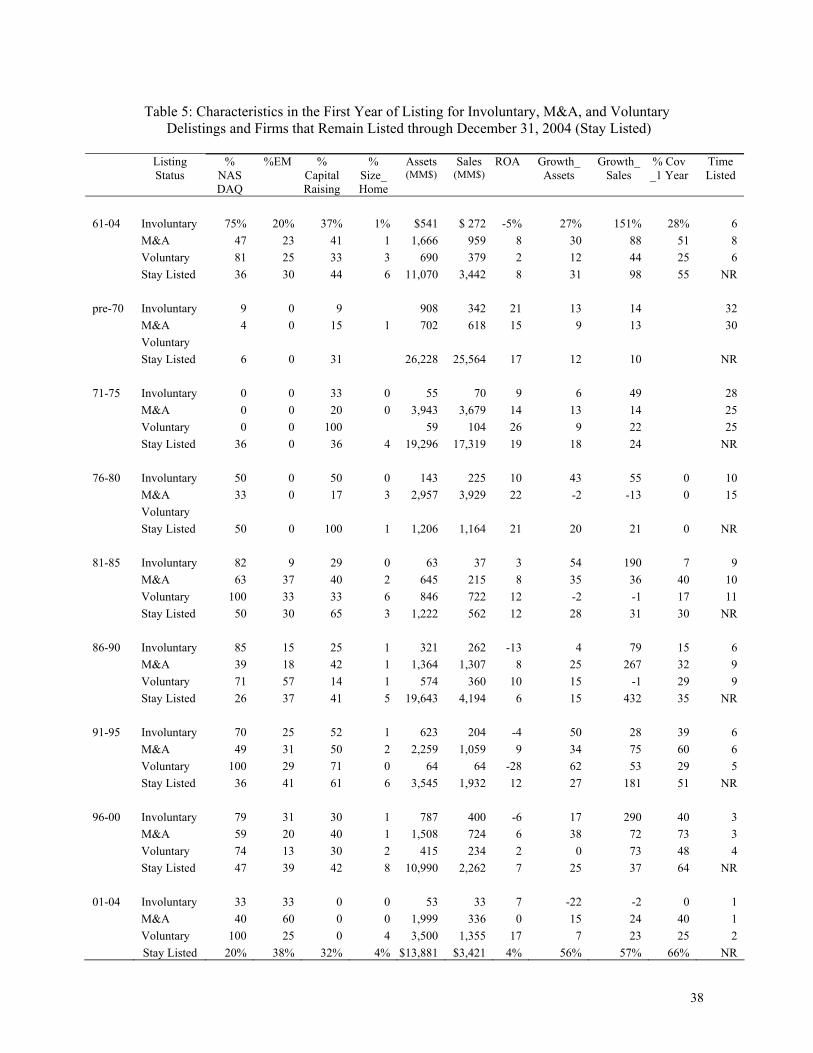
38
Table 5: Characteristics in the First Year of Listing for Involuntary, M&A, and Voluntary
Delistings and Firms that Remain Listed through December 31, 2004 (Stay Listed)
Listing Status
% NAS DAQ
%EM % Capital Raising
% Size_ Home
Assets (MM$)
Sales (MM$)
ROA Growth_ Assets
Growth_ Sales
% Cov _1 Year
Time Listed
61-04 Involuntary 75% 20% 37% 1% $541 $ 272 -5% 27% 151% 28% 6 M&A 47 23 41 1 1,666 959 8 30 88 51 8 Voluntary 81 25 33 3 690 379 2 12 44 25 6 Stay Listed 36 30 44 6 11,070 3,442 8 31 98 55 NR pre-70 Involuntary 9 0 9 908 342 21 13 14 32 M&A 4 0 15 1 702 618 15 9 13 30 Voluntary Stay Listed 6 0 31 26,228 25,564 17 12 10 NR 71-75 Involuntary 0 0 33 0 55 70 9 6 49 28 M&A 0 0 20 0 3,943 3,679 14 13 14 25 Voluntary 0 0 100 59 104 26 9 22 25 Stay Listed 36 0 36 4 19,296 17,319 19 18 24 NR 76-80 Involuntary 50 0 50 0 143 225 10 43 55 0 10 M&A 33 0 17 3 2,957 3,929 22 -2 -13 0 15 Voluntary Stay Listed 50 0 100 1 1,206 1,164 21 20 21 0 NR 81-85 Involuntary 82 9 29 0 63 37 3 54 190 7 9 M&A 63 37 40 2 645 215 8 35 36 40 10 Voluntary 100 33 33 6 846 722 12 -2 -1 17 11 Stay Listed 50 30 65 3 1,222 562 12 28 31 30 NR 86-90 Involuntary 85 15 25 1 321 262 -13 4 79 15 6 M&A 39 18 42 1 1,364 1,307 8 25 267 32 9 Voluntary 71 57 14 1 574 360 10 15 -1 29 9 Stay Listed 26 37 41 5 19,643 4,194 6 15 432 35 NR 91-95 Involuntary 70 25 52 1 623 204 -4 50 28 39 6 M&A 49 31 50 2 2,259 1,059 9 34 75 60 6 Voluntary 100 29 71 0 64 64 -28 62 53 29 5 Stay Listed 36 41 61 6 3,545 1,932 12 27 181 51 NR 96-00 Involuntary 79 31 30 1 787 400 -6 17 290 40 3 M&A 59 20 40 1 1,508 724 6 38 72 73 3 Voluntary 74 13 30 2 415 234 2 0 73 48 4 Stay Listed 47 39 42 8 10,990 2,262 7 25 37 64 NR 01-04 Involuntary 33 33 0 0 53 33 7 -22 -2 0 1 M&A 40 60 0 0 1,999 336 0 15 24 40 1 Voluntary 100 25 0 4 3,500 1,355 17 7 23 25 2 Stay Listed 20% 38% 32% 4% $13,881 $3,421 4% 56% 57% 66% NR
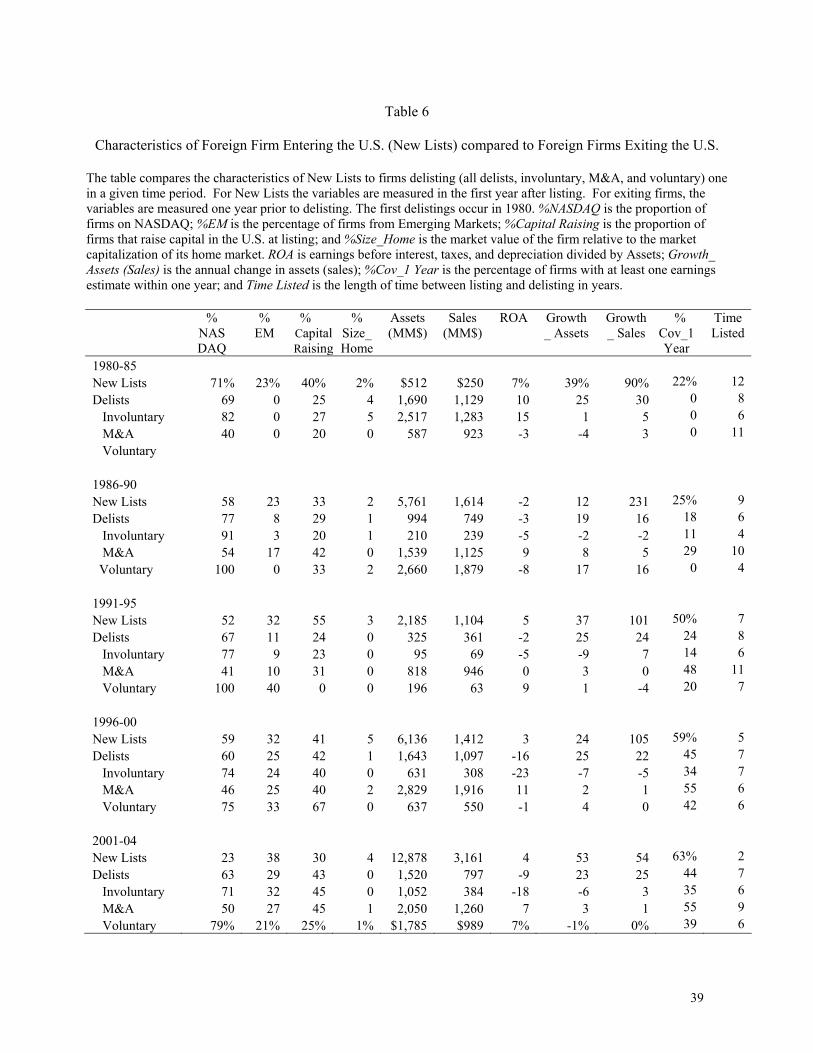
39
Table 6
Characteristics of Foreign Firm Entering the U.S. (New Lists) compared to Foreign Firms Exiting the U.S.
The table compares the characteristics of New Lists to firms delisting (all delists, involuntary, M&A, and voluntary) one in a given time period. For New Lists the variables are measured in the first year after listing. For exiting firms, the variables are measured one year prior to delisting. The first delistings occur in 1980. %NASDAQ is the proportion of firms on NASDAQ; %EM is the percentage of firms from Emerging Markets; %Capital Raising is the proportion of firms that raise capital in the U.S. at listing; and %Size_Home is the market value of the firm relative to the market capitalization of its home market. ROA is earnings before interest, taxes, and depreciation divided by Assets; Growth_ Assets (Sales) is the annual change in assets (sales); %Cov_1 Year is the percentage of firms with at least one earnings estimate within one year; and Time Listed is the length of time between listing and delisting in years.
% NAS DAQ
% EM
% CapitalRaising
% Size_ Home
Assets (MM$)
Sales (MM$)
ROA Growth_ Assets
Growth_ Sales
% Cov_1 Year
Time Listed
1980-85 New Lists 71% 23% 40% 2% $512 $250 7% 39% 90% 22% 12 Delists 69 0 25 4 1,690 1,129 10 25 30 0 8 Involuntary 82 0 27 5 2,517 1,283 15 1 5 0 6 M&A 40 0 20 0 587 923 -3 -4 3 0 11 Voluntary 1986-90 New Lists 58 23 33 2 5,761 1,614 -2 12 231 25% 9 Delists 77 8 29 1 994 749 -3 19 16 18 6 Involuntary 91 3 20 1 210 239 -5 -2 -2 11 4 M&A 54 17 42 0 1,539 1,125 9 8 5 29 10 Voluntary 100 0 33 2 2,660 1,879 -8 17 16 0 4 1991-95 New Lists 52 32 55 3 2,185 1,104 5 37 101 50% 7 Delists 67 11 24 0 325 361 -2 25 24 24 8 Involuntary 77 9 23 0 95 69 -5 -9 7 14 6 M&A 41 10 31 0 818 946 0 3 0 48 11 Voluntary 100 40 0 0 196 63 9 1 -4 20 7 1996-00 New Lists 59 32 41 5 6,136 1,412 3 24 105 59% 5 Delists 60 25 42 1 1,643 1,097 -16 25 22 45 7 Involuntary 74 24 40 0 631 308 -23 -7 -5 34 7 M&A 46 25 40 2 2,829 1,916 11 2 1 55 6 Voluntary 75 33 67 0 637 550 -1 4 0 42 6 2001-04 New Lists 23 38 30 4 12,878 3,161 4 53 54 63% 2 Delists 63 29 43 0 1,520 797 -9 23 25 44 7 Involuntary 71 32 45 0 1,052 384 -18 -6 3 35 6 M&A 50 27 45 1 2,050 1,260 7 3 1 55 9 Voluntary 79% 21% 25% 1% $1,785 $989 7% -1% 0% 39 6
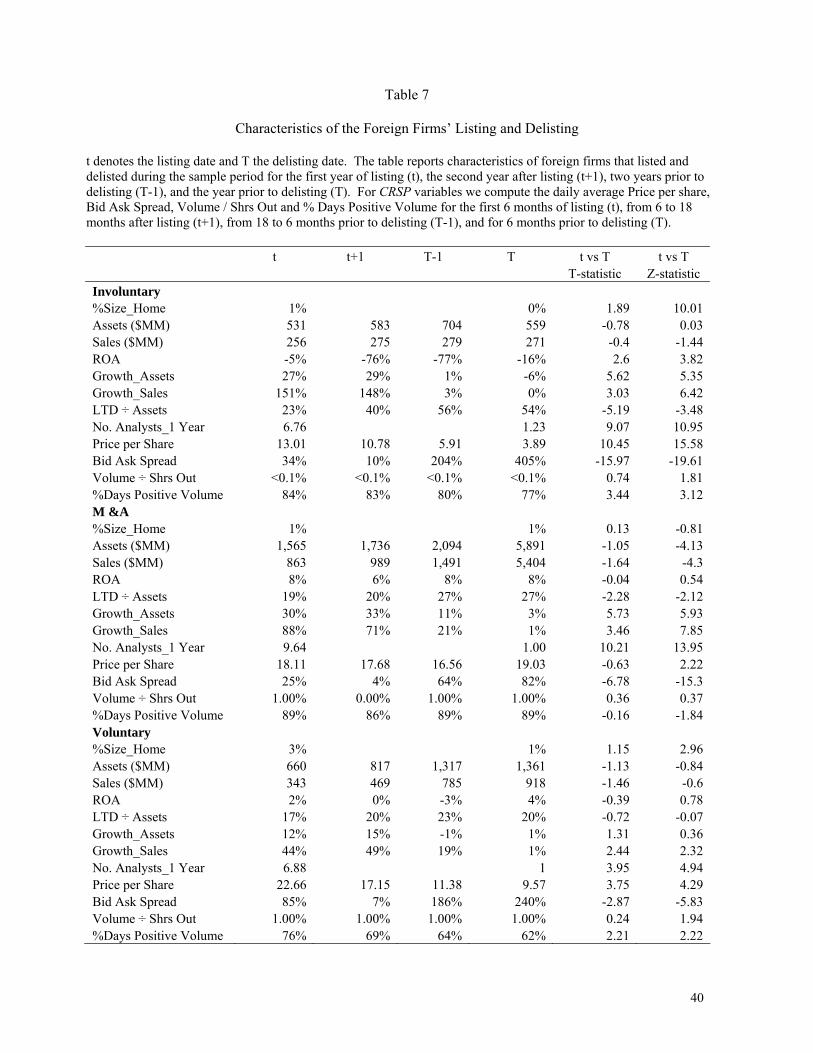
40
Table 7
Characteristics of the Foreign Firms’ Listing and Delisting
t denotes the listing date and T the delisting date. The table reports characteristics of foreign firms that listed and delisted during the sample period for the first year of listing (t), the second year after listing (t+1), two years prior to delisting (T-1), and the year prior to delisting (T). For CRSP variables we compute the daily average Price per share, Bid Ask Spread, Volume / Shrs Out and % Days Positive Volume for the first 6 months of listing (t), from 6 to 18 months after listing (t+1), from 18 to 6 months prior to delisting (T-1), and for 6 months prior to delisting (T). t t+1 T-1 T t vs T t vs T T-statistic Z-statistic Involuntary %Size_Home 1% 0% 1.89 10.01 Assets ($MM) 531 583 704 559 -0.78 0.03 Sales ($MM) 256 275 279 271 -0.4 -1.44 ROA -5% -76% -77% -16% 2.6 3.82 Growth_Assets 27% 29% 1% -6% 5.62 5.35 Growth_Sales 151% 148% 3% 0% 3.03 6.42 LTD ÷ Assets 23% 40% 56% 54% -5.19 -3.48 No. Analysts_1 Year 6.76 1.23 9.07 10.95 Price per Share 13.01 10.78 5.91 3.89 10.45 15.58 Bid Ask Spread 34% 10% 204% 405% -15.97 -19.61 Volume ÷ Shrs Out <0.1% <0.1% <0.1% <0.1% 0.74 1.81 %Days Positive Volume 84% 83% 80% 77% 3.44 3.12 M &A %Size_Home 1% 1% 0.13 -0.81 Assets ($MM) 1,565 1,736 2,094 5,891 -1.05 -4.13 Sales ($MM) 863 989 1,491 5,404 -1.64 -4.3 ROA 8% 6% 8% 8% -0.04 0.54 LTD ÷ Assets 19% 20% 27% 27% -2.28 -2.12 Growth_Assets 30% 33% 11% 3% 5.73 5.93 Growth_Sales 88% 71% 21% 1% 3.46 7.85 No. Analysts_1 Year 9.64 1.00 10.21 13.95 Price per Share 18.11 17.68 16.56 19.03 -0.63 2.22 Bid Ask Spread 25% 4% 64% 82% -6.78 -15.3 Volume ÷ Shrs Out 1.00% 0.00% 1.00% 1.00% 0.36 0.37 %Days Positive Volume 89% 86% 89% 89% -0.16 -1.84 Voluntary %Size_Home 3% 1% 1.15 2.96 Assets ($MM) 660 817 1,317 1,361 -1.13 -0.84 Sales ($MM) 343 469 785 918 -1.46 -0.6 ROA 2% 0% -3% 4% -0.39 0.78 LTD ÷ Assets 17% 20% 23% 20% -0.72 -0.07 Growth_Assets 12% 15% -1% 1% 1.31 0.36 Growth_Sales 44% 49% 19% 1% 2.44 2.32 No. Analysts_1 Year 6.88 1 3.95 4.94 Price per Share 22.66 17.15 11.38 9.57 3.75 4.29 Bid Ask Spread 85% 7% 186% 240% -2.87 -5.83 Volume ÷ Shrs Out 1.00% 1.00% 1.00% 1.00% 0.24 1.94 %Days Positive Volume 76% 69% 64% 62% 2.21 2.22
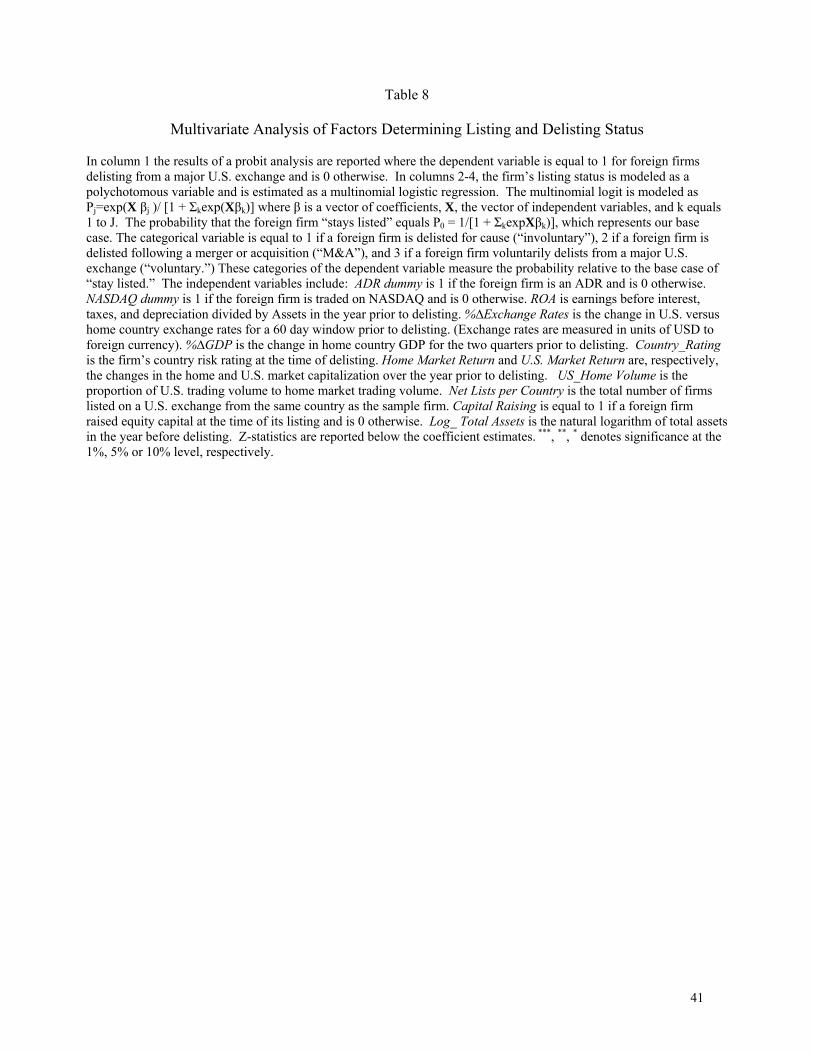
41
Table 8
Multivariate Analysis of Factors Determining Listing and Delisting Status In column 1 the results of a probit analysis are reported where the dependent variable is equal to 1 for foreign firms delisting from a major U.S. exchange and is 0 otherwise. In columns 2-4, the firm’s listing status is modeled as a polychotomous variable and is estimated as a multinomial logistic regression. The multinomial logit is modeled as Pj=exp(X βj )/ [1 + Σkexp(Xβk)] where β is a vector of coefficients, X, the vector of independent variables, and k equals 1 to J. The probability that the foreign firm “stays listed” equals P0 = 1/[1 + ΣkexpXβk)], which represents our base case. The categorical variable is equal to 1 if a foreign firm is delisted for cause (“involuntary”), 2 if a foreign firm is delisted following a merger or acquisition (“M&A”), and 3 if a foreign firm voluntarily delists from a major U.S. exchange (“voluntary.”) These categories of the dependent variable measure the probability relative to the base case of “stay listed.” The independent variables include: ADR dummy is 1 if the foreign firm is an ADR and is 0 otherwise. NASDAQ dummy is 1 if the foreign firm is traded on NASDAQ and is 0 otherwise. ROA is earnings before interest, taxes, and depreciation divided by Assets in the year prior to delisting. %∆Exchange Rates is the change in U.S. versus home country exchange rates for a 60 day window prior to delisting. (Exchange rates are measured in units of USD to foreign currency). %∆GDP is the change in home country GDP for the two quarters prior to delisting. Country_Rating is the firm’s country risk rating at the time of delisting. Home Market Return and U.S. Market Return are, respectively, the changes in the home and U.S. market capitalization over the year prior to delisting. US_Home Volume is the proportion of U.S. trading volume to home market trading volume. Net Lists per Country is the total number of firms listed on a U.S. exchange from the same country as the sample firm. Capital Raising is equal to 1 if a foreign firm raised equity capital at the time of its listing and is 0 otherwise. Log_ Total Assets is the natural logarithm of total assets in the year before delisting. Z-statistics are reported below the coefficient estimates. ***, **, * denotes significance at the 1%, 5% or 10% level, respectively.
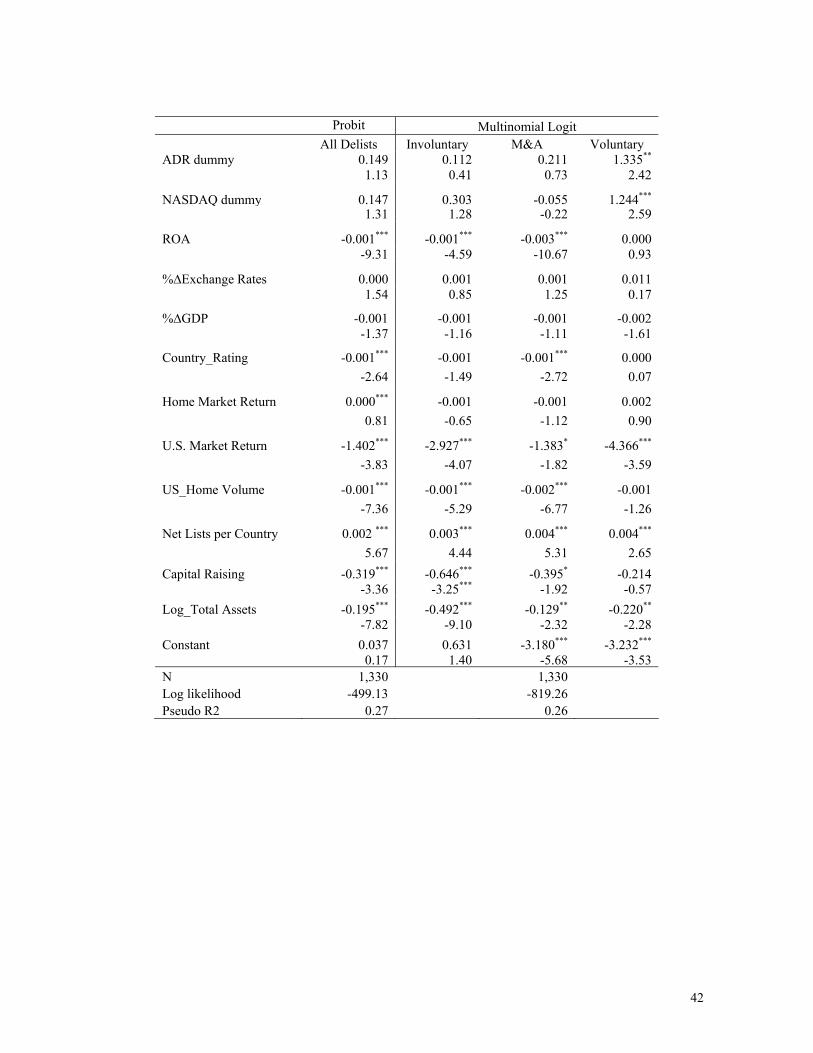
42
Probit Multinomial Logit All Delists Involuntary M&A Voluntary ADR dummy 0.149 0.112 0.211 1.335** 1.13 0.41 0.73 2.42
NASDAQ dummy 0.147 0.303 -0.055 1.244*** 1.31 1.28 -0.22 2.59
ROA -0.001*** -0.001*** -0.003*** 0.000 -9.31 -4.59 -10.67 0.93
%∆Exchange Rates 0.000 0.001 0.001 0.011 1.54 0.85 1.25 0.17
%∆GDP -0.001 -0.001 -0.001 -0.002 -1.37 -1.16 -1.11 -1.61
Country_Rating -0.001*** -0.001 -0.001*** 0.000 -2.64 -1.49 -2.72 0.07
Home Market Return 0.000*** -0.001 -0.001 0.002 0.81 -0.65 -1.12 0.90
U.S. Market Return -1.402*** -2.927*** -1.383* -4.366*** -3.83 -4.07 -1.82 -3.59
US_Home Volume -0.001*** -0.001*** -0.002*** -0.001 -7.36 -5.29 -6.77 -1.26
Net Lists per Country 0.002 *** 0.003*** 0.004*** 0.004*** 5.67 4.44 5.31 2.65 Capital Raising -0.319*** -0.646*** -0.395* -0.214 -3.36 -3.25*** -1.92 -0.57 Log_Total Assets -0.195*** -0.492*** -0.129** -0.220**
-7.82 -9.10 -2.32 -2.28 Constant 0.037 0.631 -3.180*** -3.232*** 0.17 1.40 -5.68 -3.53 N 1,330 1,330 Log likelihood -499.13 -819.26 Pseudo R2 0.27 0.26
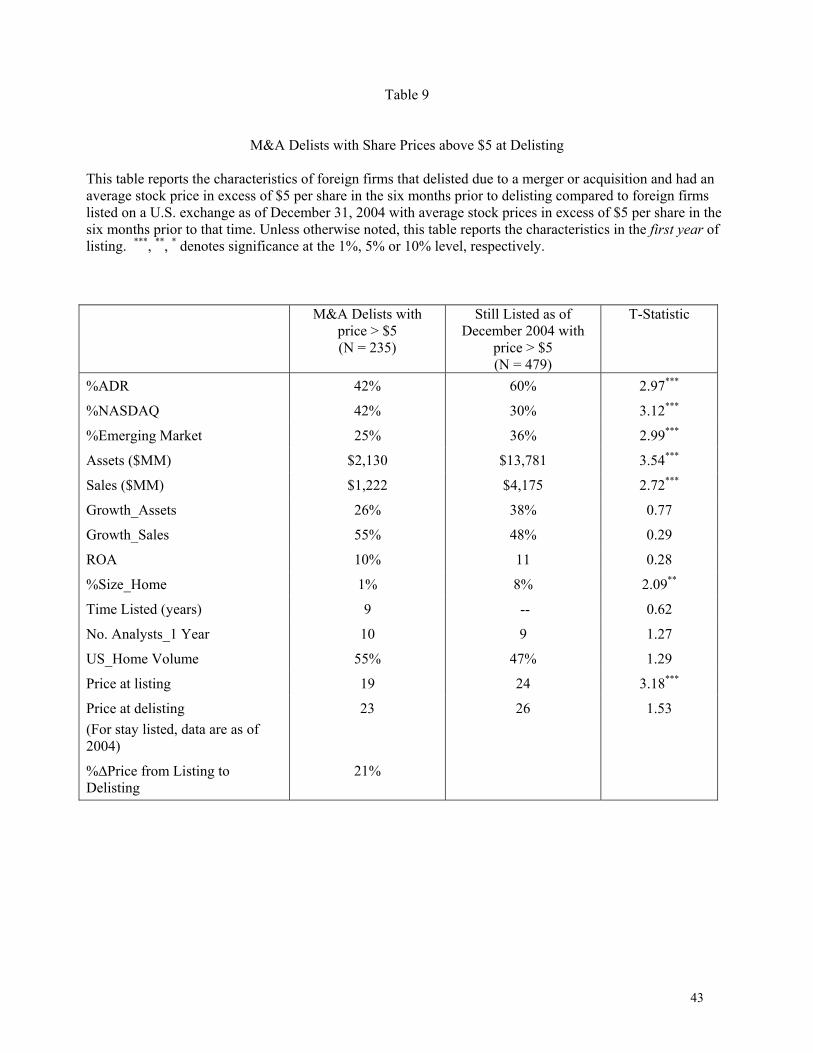
43
Table 9
M&A Delists with Share Prices above $5 at Delisting
This table reports the characteristics of foreign firms that delisted due to a merger or acquisition and had an average stock price in excess of $5 per share in the six months prior to delisting compared to foreign firms listed on a U.S. exchange as of December 31, 2004 with average stock prices in excess of $5 per share in the six months prior to that time. Unless otherwise noted, this table reports the characteristics in the first year of listing. ***, **, * denotes significance at the 1%, 5% or 10% level, respectively. M&A Delists with
price > $5 (N = 235)
Still Listed as of December 2004 with
price > $5 (N = 479)
T-Statistic
%ADR 42% 60% 2.97***
%NASDAQ 42% 30% 3.12***
%Emerging Market 25% 36% 2.99***
Assets ($MM) $2,130 $13,781 3.54***
Sales ($MM) $1,222 $4,175 2.72***
Growth_Assets 26% 38% 0.77
Growth_Sales 55% 48% 0.29
ROA 10% 11 0.28
%Size_Home 1% 8% 2.09**
Time Listed (years) 9 -- 0.62
No. Analysts_1 Year 10 9 1.27
US_Home Volume 55% 47% 1.29
Price at listing 19 24 3.18***
Price at delisting (For stay listed, data are as of 2004)
23 26 1.53
%∆Price from Listing to Delisting
21%
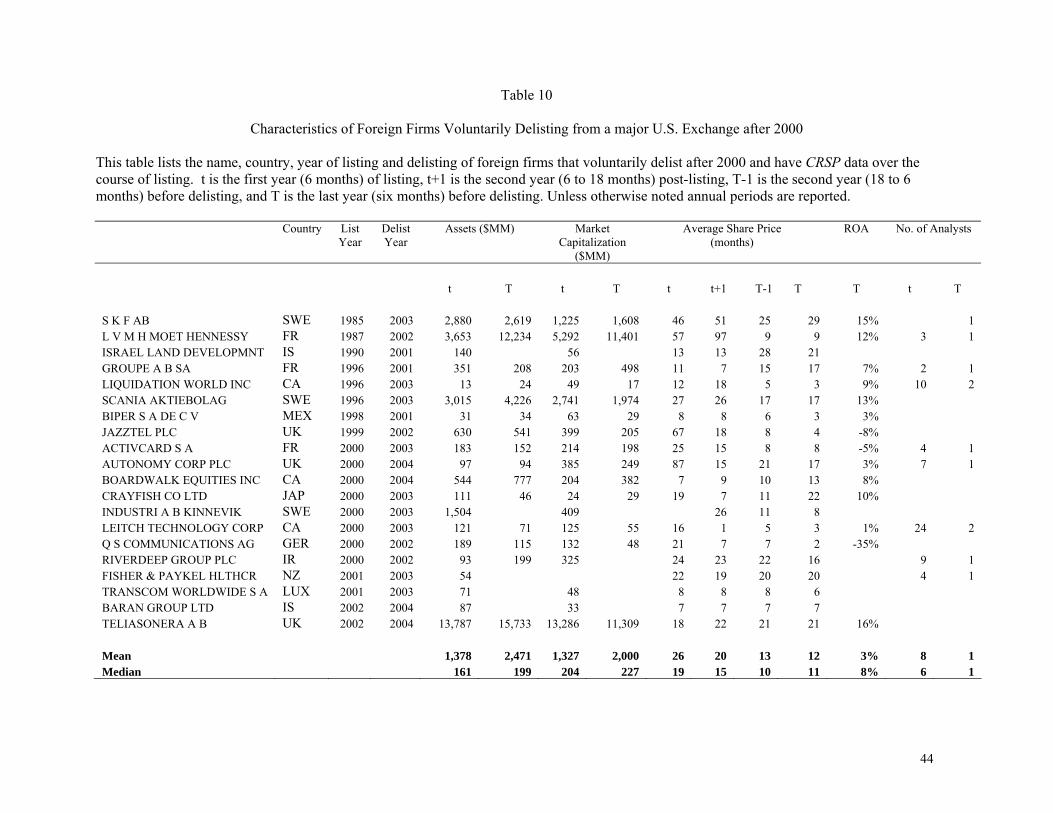
44
Table 10
Characteristics of Foreign Firms Voluntarily Delisting from a major U.S. Exchange after 2000 This table lists the name, country, year of listing and delisting of foreign firms that voluntarily delist after 2000 and have CRSP data over the course of listing. t is the first year (6 months) of listing, t+1 is the second year (6 to 18 months) post-listing, T-1 is the second year (18 to 6 months) before delisting, and T is the last year (six months) before delisting. Unless otherwise noted annual periods are reported.
Country List Year
Delist Year
Assets ($MM) Market Capitalization
($MM)
Average Share Price (months)
ROA No. of Analysts
t T t T t t+1 T-1 T T t T S K F AB SWE 1985 2003 2,880 2,619 1,225 1,608 46 51 25 29 15% 1 L V M H MOET HENNESSY FR 1987 2002 3,653 12,234 5,292 11,401 57 97 9 9 12% 3 1 ISRAEL LAND DEVELOPMNT IS 1990 2001 140 56 13 13 28 21 GROUPE A B SA FR 1996 2001 351 208 203 498 11 7 15 17 7% 2 1 LIQUIDATION WORLD INC CA 1996 2003 13 24 49 17 12 18 5 3 9% 10 2 SCANIA AKTIEBOLAG SWE 1996 2003 3,015 4,226 2,741 1,974 27 26 17 17 13% BIPER S A DE C V MEX 1998 2001 31 34 63 29 8 8 6 3 3% JAZZTEL PLC UK 1999 2002 630 541 399 205 67 18 8 4 -8% ACTIVCARD S A FR 2000 2003 183 152 214 198 25 15 8 8 -5% 4 1 AUTONOMY CORP PLC UK 2000 2004 97 94 385 249 87 15 21 17 3% 7 1 BOARDWALK EQUITIES INC CA 2000 2004 544 777 204 382 7 9 10 13 8% CRAYFISH CO LTD JAP 2000 2003 111 46 24 29 19 7 11 22 10% INDUSTRI A B KINNEVIK SWE 2000 2003 1,504 409 26 11 8 LEITCH TECHNOLOGY CORP CA 2000 2003 121 71 125 55 16 1 5 3 1% 24 2 Q S COMMUNICATIONS AG GER 2000 2002 189 115 132 48 21 7 7 2 -35% RIVERDEEP GROUP PLC IR 2000 2002 93 199 325 24 23 22 16 9 1 FISHER & PAYKEL HLTHCR NZ 2001 2003 54 22 19 20 20 4 1 TRANSCOM WORLDWIDE S A LUX 2001 2003 71 48 8 8 8 6 BARAN GROUP LTD IS 2002 2004 87 33 7 7 7 7 TELIASONERA A B UK 2002 2004 13,787 15,733 13,286 11,309 18 22 21 21 16% Mean 1,378 2,471 1,327 2,000 26 20 13 12 3% 8 1 Median 161 199 204 227 19 15 10 11 8% 6 1
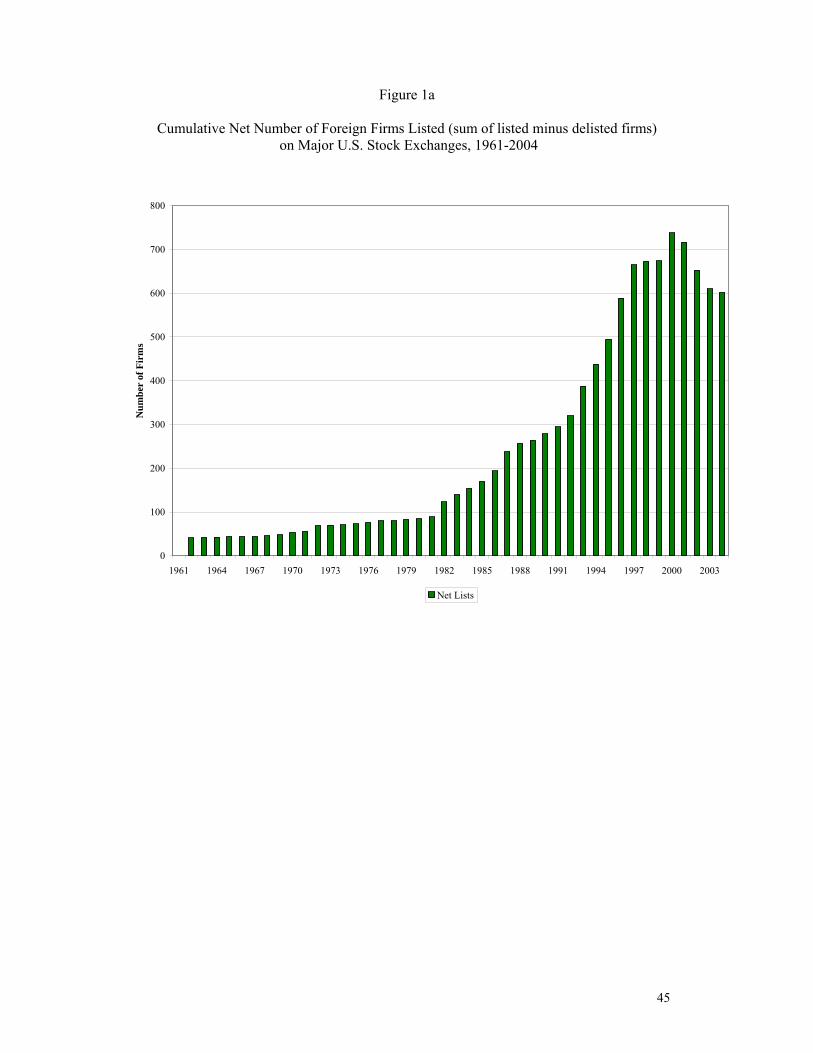
45
Figure 1a
Cumulative Net Number of Foreign Firms Listed (sum of listed minus delisted firms) on Major U.S. Stock Exchanges, 1961-2004
0
100
200
300
400
500
600
700
800
1961 1964 1967 1970 1973 1976 1979 1982 1985 1988 1991 1994 1997 2000 2003
Num
ber
of F
irm
s
Net Lists
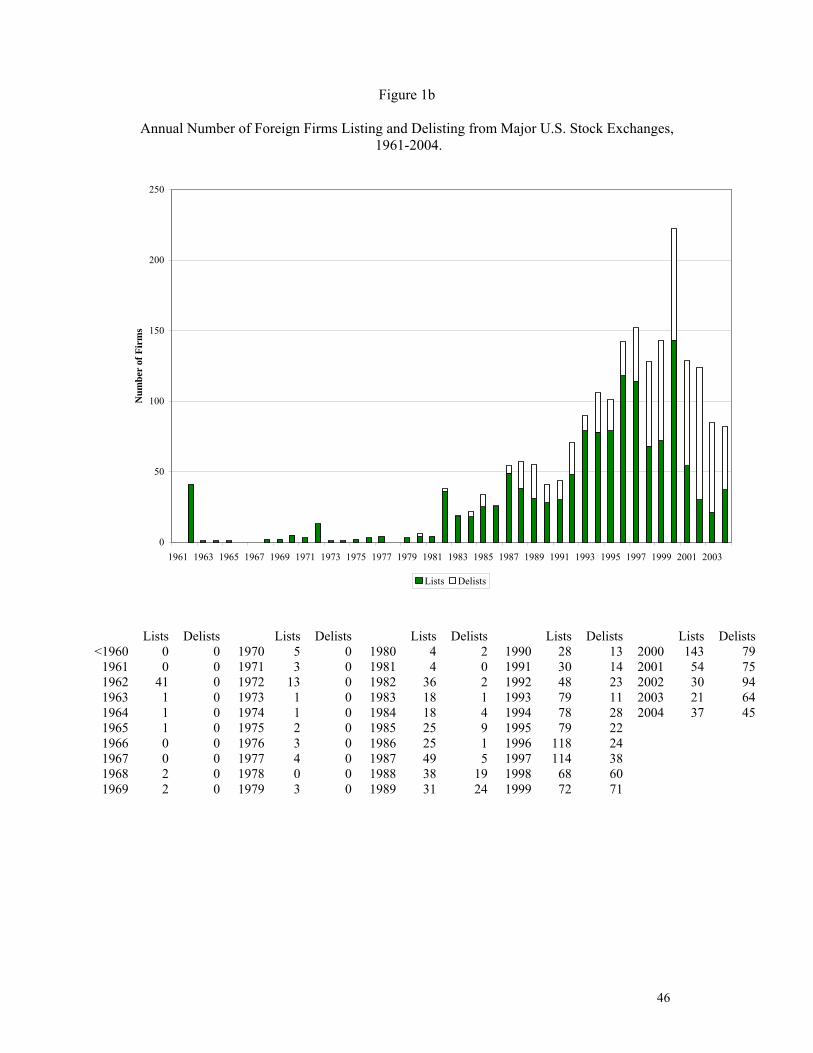
46
Figure 1b
Annual Number of Foreign Firms Listing and Delisting from Major U.S. Stock Exchanges, 1961-2004.
0
50
100
150
200
250
1961 1963 1965 1967 1969 1971 1973 1975 1977 1979 1981 1983 1985 1987 1989 1991 1993 1995 1997 1999 2001 2003
Num
ber
of F
irm
s
Lists Delists
Lists Delists Lists Delists Lists Delists Lists Delists Lists Delists <1960 0 0 1970 5 0 1980 4 2 1990 28 13 2000 143 79
1961 0 0 1971 3 0 1981 4 0 1991 30 14 2001 54 75 1962 41 0 1972 13 0 1982 36 2 1992 48 23 2002 30 94 1963 1 0 1973 1 0 1983 18 1 1993 79 11 2003 21 64 1964 1 0 1974 1 0 1984 18 4 1994 78 28 2004 37 45 1965 1 0 1975 2 0 1985 25 9 1995 79 22 1966 0 0 1976 3 0 1986 25 1 1996 118 24 1967 0 0 1977 4 0 1987 49 5 1997 114 38 1968 2 0 1978 0 0 1988 38 19 1998 68 60 1969 2 0 1979 3 0 1989 31 24 1999 72 71
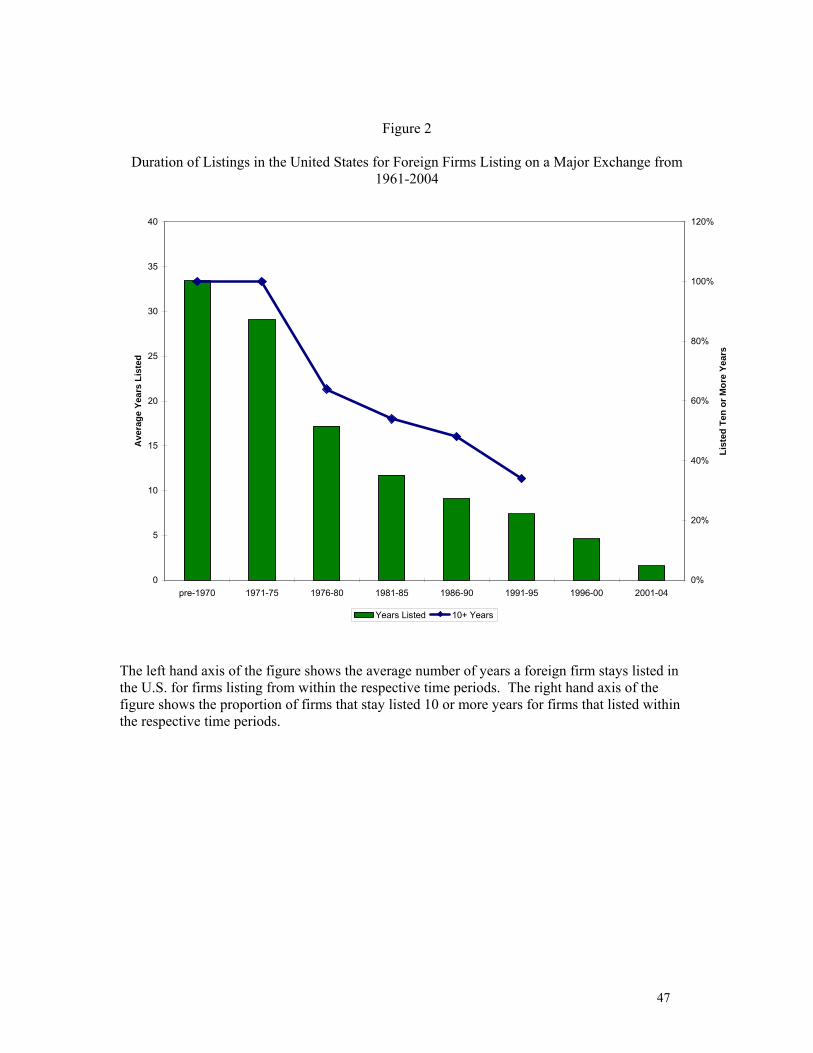
47
Figure 2
Duration of Listings in the United States for Foreign Firms Listing on a Major Exchange from 1961-2004
0
5
10
15
20
25
30
35
40
pre-1970 1971-75 1976-80 1981-85 1986-90 1991-95 1996-00 2001-04
Ave
rage
Yea
rs L
iste
d
0%
20%
40%
60%
80%
100%
120%
List
ed T
en o
r Mor
e Ye
ars
Years Listed 10+ Years
The left hand axis of the figure shows the average number of years a foreign firm stays listed in the U.S. for firms listing from within the respective time periods. The right hand axis of the figure shows the proportion of firms that stay listed 10 or more years for firms that listed within the respective time periods.


![What How When DELISTING. IN. SEBI(DELISTING OF EQUITY SHARES) REGULATIONS, 2009 SCRA[ SECURITIES CONTRACT( REGULATION ACT) 1956] LISTING AGREEMENT COMPANIES](https://img.pdfslide.net/doc/110x75/56649daf5503460f94a9d128/what-how-when-delisting-in-sebidelisting-of-equity-shares-regulations.jpg)