Embed Size (px)
Citation preview
Full Terms & Conditions of access and use can be found athttp://www.tandfonline.com/action/journalInformation?journalCode=mcsa20
Chinese Sociological Review
ISSN: 2162-0555 (Print) 2162-0563 (Online) Journal homepage: http://www.tandfonline.com/loi/mcsa20
From Poverty to Prosperity: College Education,Noncognitive Abilities, and First-Job Earnings
Duoduo Xu
To cite this article: Duoduo Xu (2018) From Poverty to Prosperity: College Education,Noncognitive Abilities, and First-Job Earnings, Chinese Sociological Review, 50:1, 53-82, DOI:10.1080/21620555.2017.1376581
To link to this article: https://doi.org/10.1080/21620555.2017.1376581
Published online: 17 Oct 2017.
Submit your article to this journal
Article views: 69
View related articles
View Crossmark data
Citing articles: 1 View citing articles
Chinese Sociological Review, 50(1): 53–82, 2018 Copyright © Taylor & Francis Group, LLC ISSN 2162-0555 print / 2162-0563 online DOI: 10.1080/21620555.2017.1376581
From Poverty to Prosperity: College Education, Noncognitive Abilities, and First-Job Earnings
Duoduo Xu, Hong Kong University of Science and Technology
Abstract: Previous studies have attributed the impact of the weaker family background among college graduates either to the selective admission process or to the signaling effect of a college diploma in the labor market. In this paper, I aim to provide an alternative explanation by focusing on the human capital accumulation during college. Based on data from the Beijing College Students Panel Survey, I employ growth curve models to reveal that students from poor households gradually caught up with their nonpoor counterparts in terms of noncognitive abilities during their four years of college education, which eventually compensated for their potential disadvantage in terms of first-job earnings. The empirical evidence suggests, in addition to sorting and certifying, higher education can weaken the impact of a disadvantaged family background by offering an open and fair stage for students of different social origins, helping them develop their noncognitive skills in their future careers.
none defined
Address correspondence to Duoduo Xu, Division of Social Science & Institute for Advanced Studies (IAS), Center for Applied Social and Economic Research (CASER), Hong Kong University of Science and Technology (HKUST), Room 3302, Academic Building, Clear Water Bay, Kowloon, Hong Kong SAR, China. E-mail: [email protected] Color versions of one or more of the figures in the article can be found online at www.tandfonline.com/mcsa.
53
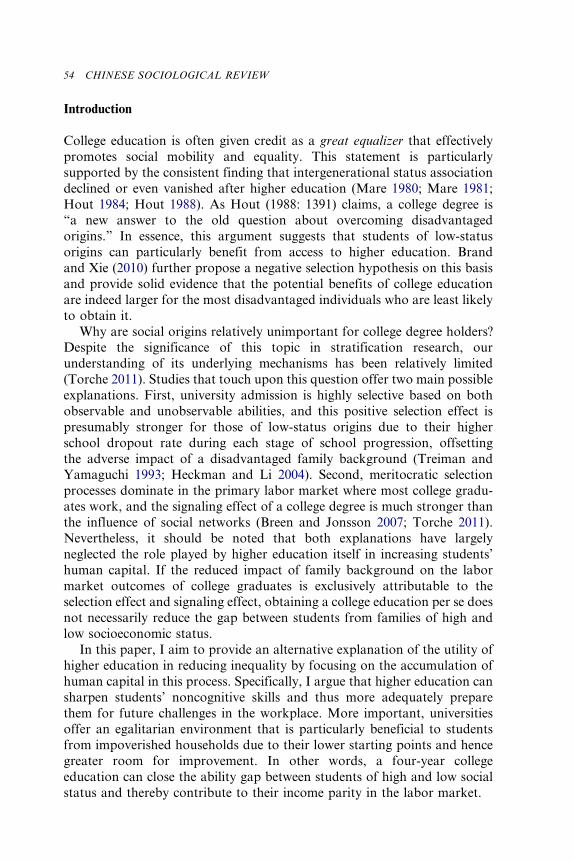
Introduction
College education is often given credit as a great equalizer that effectively promotes social mobility and equality. This statement is particularly supported by the consistent finding that intergenerational status association declined or even vanished after higher education (Mare 1980; Mare 1981; Hout 1984; Hout 1988). As Hout (1988: 1391) claims, a college degree is “a new answer to the old question about overcoming disadvantaged origins.” In essence, this argument suggests that students of low-status origins can particularly benefit from access to higher education. Brand and Xie (2010) further propose a negative selection hypothesis on this basis and provide solid evidence that the potential benefits of college education are indeed larger for the most disadvantaged individuals who are least likely to obtain it.
Why are social origins relatively unimportant for college degree holders? Despite the significance of this topic in stratification research, our understanding of its underlying mechanisms has been relatively limited (Torche 2011). Studies that touch upon this question offer two main possible explanations. First, university admission is highly selective based on both observable and unobservable abilities, and this positive selection effect is presumably stronger for those of low-status origins due to their higher school dropout rate during each stage of school progression, offsetting the adverse impact of a disadvantaged family background (Treiman and Yamaguchi 1993; Heckman and Li 2004). Second, meritocratic selection processes dominate in the primary labor market where most college gradu-ates work, and the signaling effect of a college degree is much stronger than the influence of social networks (Breen and Jonsson 2007; Torche 2011). Nevertheless, it should be noted that both explanations have largely neglected the role played by higher education itself in increasing students’ human capital. If the reduced impact of family background on the labor market outcomes of college graduates is exclusively attributable to the selection effect and signaling effect, obtaining a college education per se does not necessarily reduce the gap between students from families of high and low socioeconomic status.
In this paper, I aim to provide an alternative explanation of the utility of higher education in reducing inequality by focusing on the accumulation of human capital in this process. Specifically, I argue that higher education can sharpen students’ noncognitive skills and thus more adequately prepare them for future challenges in the workplace. More important, universities offer an egalitarian environment that is particularly beneficial to students from impoverished households due to their lower starting points and hence greater room for improvement. In other words, a four-year college education can close the ability gap between students of high and low social status and thereby contribute to their income parity in the labor market.
54 CHINESE SOCIOLOGICAL REVIEW
The validity of this assumption is evaluated using data from the Beijing College Students Panel Survey (BCSPS). This five-year panel survey provides us with a rare opportunity to directly examine the gradual accumu-lation of human capital during college as it continuously tracks students’ performance throughout their studies as well as during their transition from school to work. The Chinese context is highly relevant due to its substantial rural-urban divide in which obtaining a college degree is one of the limited pathways through which poor individuals from rural areas can overcome their disadvantaged origins and achieve upward mobility (Wu and Treiman 2004). However, along with the rapid growth in university expenses in recent decades, as well as increasing job opportunities in the secondary labor market, students from poor families are increasingly confronted with the practical concern of whether a college education pays off (Shi et al. 2015). In this study I also examine the returns on higher education for impover-ished individuals, and the findings carry important implications for the value of higher education in China.
Conceptual Framework
Previous literature has provided two main plausible mechanisms to explain the much weaker influence of family background on labor market outcomes among college graduates.
One is the selection effect hypothesis. Treiman and Yamaguchi (1993) argue that at each educational transition, fewer but superior students of low-status origins are selected than those of high-status origins, and this bias becomes stronger in successive transitions. Thus at the higher education level, the student body is relatively heterogeneous, comprising a more selected group of students of low-status origins and a less selected group of students of high-status origins. This heterogeneity finally counteracts the advantage of high-status origins. Nevertheless, this hypothesis is chal-lenged by two pieces of empirical counterevidence. Firstly, the hypothesis indicates that as higher education expands, its selectivity drops, reducing the heterogeneity of the student body, which should theoretically increase the impact of family background again. However, empirical findings from thirteen countries have demonstrated mixed results (Shavit and Blossfeld 1993). Second, if the degree of selectivity increases with educational level, we should expect to find an even smaller impact of family socioeconomic status among advanced degree holders compared to bachelor degree holders. Empirical findings again contradict this hypothesis (Torche 2011).
The other explanation is the signaling effect hypothesis. Because of the internal segmentation of labor markets, the average return on earnings in the primary sector is significantly higher than in the secondary sector (Piore 1983). As for selection mechanisms, meritocracy dominates cronyism in the
FALL 2017 55
primary labor market, and a college degree signals an employee’s ability and usually produces high returns regardless of family socioeconomic status, whereas the secondary labor market only requires limited human capital, and thus the impact of social networks and family background is signifi-cantly greater (Breen and Jonsson 2007). This hypothesis has received some empirical support in China. For instance, Wu (2011) finds that highly-educated and less-educated workers are in two segmented labor markets in urban China, and human capital only has a significant effect on the income of the former in the primary labor market.
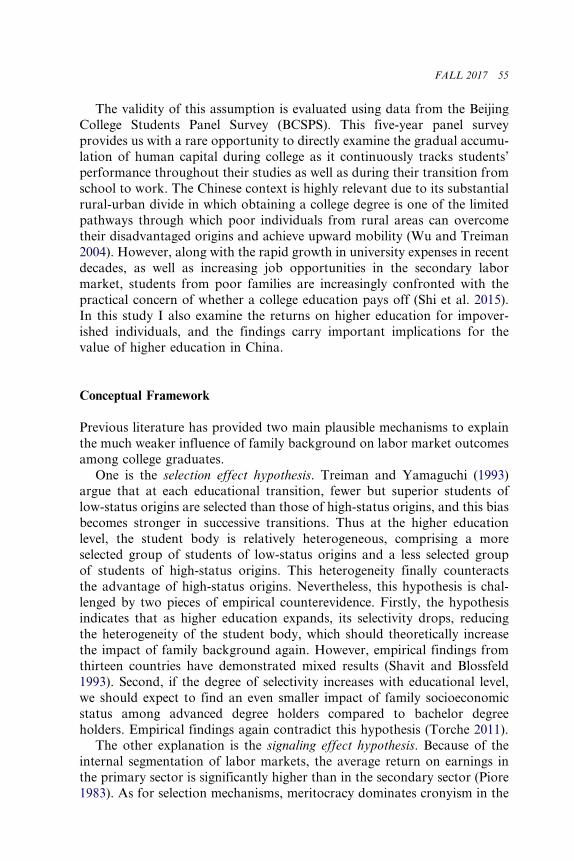
Based on discussions in the existing literature, I summarize the relations between social origin, college education, and job earnings in hypothetic Model I in Figure 1. The black line represents college graduates, while the gray line represents workers without a college education. Two patterns
Figure 1. Hypothetic model: Social origin, higher education, and earnings.
56 CHINESE SOCIOLOGICAL REVIEW
can be observed here. First, college graduates earn a higher average wage than workers without a degree because the selection process of the education system filters out the most capable students, and most college graduates work in the primary labor market, which in turn offers a higher average salary. Second, the correlation between social origins and earnings is virtually nonexistent for college graduates but positive for those without a degree. This is partly due to the greater selectivity among college graduates from disadvantaged origins and, on the other hand, the relative significance of family socioeconomic status in the secondary labor market, where a college degree is not always required. The longitudinal gap between the two lines can be regarded as the earnings returns to higher education, which can be explained by either the selection effect or the signaling effect according to the previous literature.
Nonetheless, although these two hypotheses attempt to explain the value of higher education, they do not imply that it plays any substantive role per se. If universities merely screen and certify the most capable students, the marginal benefit of investing in higher education would be called into question. This has indeed been a long-standing concern. Collins (1979) and Arum and Roksa (2011) both argue that, apart from the selection effect and signaling effect, universities contribute very little in terms of developing students’ skills and enhancing their abilities.
Meanwhile, many empirical studies have suggested a divergence emerges among college students after graduation, although they are typically con-sidered to be a relatively homogenous group. They find that the earnings of college graduates are closely related to both their GPA and other nonacademic skills (e.g., leadership and interpersonal skills) in school (Wise 1975; Rumberger and Thomas 1993; Chevalier et al. 2004; Chia and Miller 2008). In an in-depth review of the returns to investing in higher education, Hout (2012) asserts that a college degree pays off in the United States because it not only sorts and certifies students but also adds value by providing them with new skills and perspectives that enhance their abilities as workers, life partners, and citizens. These findings suggest that the schooling process and students’ engagement in university indeed affect their labor market performance later in life. Incorporating this as a missing piece in our understanding of higher education, I propose a modified hypothetic Model II, which is depicted in Figure 1.
The model is based on the human capital theory, which assumes higher education indeed enhances students’ skills and abilities, and this “college effect” (measured by the longitudinal distance between the black solid line and dotted line) is more pronounced for students with low family socioeconomic status given their lower starting points. Given that students of all socioeconomic backgrounds have comparable abilities by graduation, we expect a much smaller income discrepancy among college graduates later in life regardless of family background. This modified hypothetic model
FALL 2017 57
implies that the equalization effect of higher education is also derived from its effectiveness at enhancing the human capital of students of low-status origins.
Background
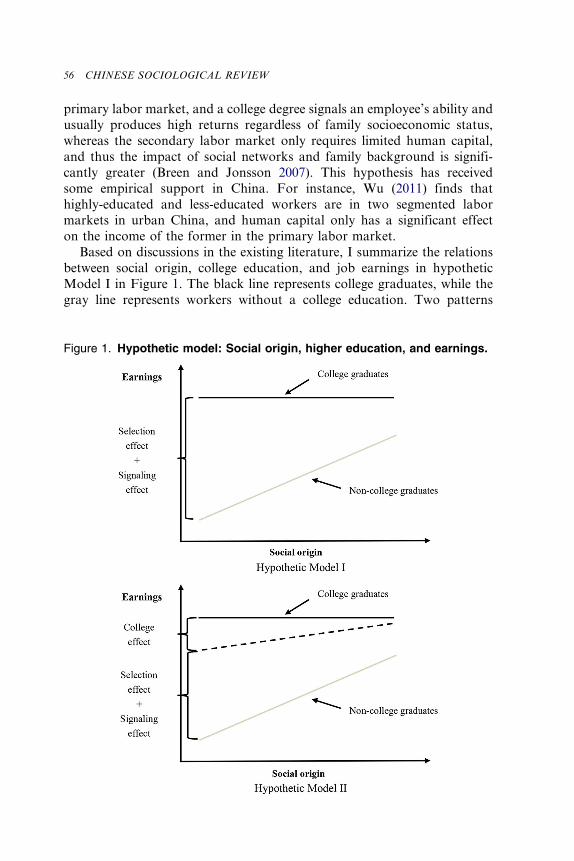
Chinese universities did not charge tuition fees until 1989. However, the tuition fees skyrocketed after an education policy reform in 1996 that unified different tracks in admission (binggui zhaosheng). As shown in Figure 2, the average tuition had quadrupled by 2011, even surpassing the growth rate of rural disposable income, accounting for over 20 percent of gross domestic product (GDP) per capita. According to a government report in 2012 (Wang 2012), university tuition fees had surged twenty-five times since they were first introduced in 1989. On average, the total cost of tuition for one student from primary through tertiary education is equivalent to 4.2 years of income for an average urban resident and 13.6 years of income for an average rural resident (Wang 2012). The high cost of education inevitably places a heavy burden on poor families and has led to considerable debate on the equity in access to education among academics and policy makers alike (Wu 2017). Some studies find that China’s school expansion has mainly benefited disadvantaged groups at the 9-year compulsory education level, but family
Figure 2. Changes in tuition fees for Chinese university students (1997 ¼ 100).
Source: China Educational Statistical Yearbooks, China Statistic Yearbooks.
58 CHINESE SOCIOLOGICAL REVIEW
background continues to play a vital role in determining one’s access to senior high school and higher education (Wu 2010; Treiman 2013; Yeung 2013).
In Western context, poverty on campus usually increases the likelihood of school dropout, causes physical and psychological health problems, and even leads to crime (Li et al. 2013), thus is assumed to be harmful for students’ performance in college. However, some survey data in China provide contradictory conclusions. For instance, in a survey on 9,461 university students from seventeen institutions in Middle and Western China, researchers find no significant difference between poor and nonpoor students in terms of employment expectation and cognition (Zhang and Wang 2008). This may be because higher education per se can narrow the gap in students’ abilities and social capital, which alleviates the adverse effects of a disadvantaged family background. These findings suggest that we pay particular attention to the experience and performance of students during their college years, especially the development of their personal abilities and skills.
There has been mounting interest in the impact of noncognitive abilities and skills on labor market outcomes over the past decade (Bowles, Gintis, and Osborne 2001; Heckman and Rubinstein 2001; Heckman, Stixrud, and Urzua 2006). Economists emphasize that, despite human capital such as education, work experience, and cognitive ability, psychological traits are also important impactors of economic success. The term “noncognitive abilities” is used to cover a broad and ill-defined category of these metrics encompassing personality, socioemotional skills, and behaviors. Self-efficacy and self-esteem are two widely used measures of noncognitive abilities. Self-efficacy is the extent or strength of one’s belief in one’s own ability to complete tasks and achieve goals, while self-esteem reflects one’s overall subjective emotional evaluation of one’s own worth or value. The existing literature shows that individuals with high self-efficacy tend to invest more effort (e.g., work harder and longer) for personal achievement, while self-esteem has been consistently shown to be positively associated with job earnings (Goldsmith, Veum, and Darity 1997; Bowles, Gintis, and Osborne 2001; Heckman and Rubinstein 2001; Heckman, Stixrud, and Urzua 2006). Moreover, work experience and certain activities on campus in turn can affect the development of noncognitive abilities (Heckman, Stixrud, and Urzua 2006). For instance, internships and part- time work experience can familiarize university students with a work environment, cultivate a sense of responsibility and professionalism, and teach them to build positive relationships at work. Some studies also find that poor university students in China face no disadvantages in terms of psychological pressure, self-efficacy, and self-esteem, because these students may have gradually improved their abilities through activities on campus (Wang et al. 2013).
FALL 2017 59
Data, Variables, and Method
Data
The lack of studies on the college effect per se is largely due to data limita-tions. Most social surveys only allow abilities and labor market outcomes to be observed after graduation, whereas a student’s initial and gradual accumulation of abilities during college are not shown. It is therefore impossible to identify the effect of higher education on human capital without continuous observations of students’ performance on campus. The empirical analysis here is based on data from the BCSPS, which enables us to track dynamic changes in students’ abilities and performance during college, as well as their transitions from school to work.
The BCSPS is a five-round panel survey on over 5,000 students from fifteen universities in Beijing, China. The survey employs a multistage strati-fied sampling strategy, with school as the primary sampling unit and major as the secondary sampling unit. In 2009 it sampled 2,473 first-year students (class of 2012) and 2,298 third-year students (class of 2010), respectively. The sampled university students were then interviewed annually over the next five years. While not nationally representative, this sample is a micro-cosm of Chinese university students given the well-developed higher edu-cation system in Beijing consisting of various different levels and types of institutions that enroll students from all over China. The panel survey covers students’ family background, personal abilities, school performance, and labor market outcomes in detail who achieved a relatively high retention rate over the five waves of data collection. Over 84 percent of the respon-dents completed four rounds of survey, and 55 percent completed all five rounds of survey (Wu 2017).
The following empirical analysis is based on data from all five rounds of the survey. The full sample was divided in two parts for analysis. One is referred to as the school sample and comprises students from the class of 2012 surveyed in the first four waves (i.e., throughout their four years in college) and students from the class 2010 surveyed in the first two waves (i.e., from their third to their fourth year in college). The other part is referred to as the work sample and includes graduates from the class of 2012 surveyed in the fifth wave (i.e., during their first year after graduation) and graduates from the class of 2010 surveyed in the third to fifth waves (i.e., during their first three years after graduation). In addition, the school sample was also restricted to participants who had been observed at least twice, while the work sample was restricted to participants who provided valid income data on their first jobs. After deleting some nonmainland students, as well as other cases with missing values on selected variables, the final school sample consists of 4,369 individuals and 13,069 person-year observations, while the work sample comprises 1,336 individuals.
60 CHINESE SOCIOLOGICAL REVIEW
Variables
The key independent variable is poverty on campus, which has no standard definition in China. It is nevertheless a common practice for scholars to contrast family income to the cost of study, including tuition fees and accommodation and living costs, with those whose family income falls short of meeting the cost of study defined as poor (Li et al. 2013). In practice, it is impossible for a family to invest 100 percent of its income into its children’s education, and thus some students whose family income exceeds the cost of study may nonetheless face financial difficulties. An alternative measure of poverty based on self-evaluation is potentially more informative than an objective measure based on income, which is clearly too strict. However, given that perceptions and attitudes toward poverty differ widely, I incorporate aspects of both measures in defining poverty in the analysis. Specifically, in the subjective measure, I regard students as subjectively poor when they perceive financial difficulties in affording university expenses. In the objective measure, I construct a university-major-specific poverty line, broken down based on the median of expenses by major and by university, and students whose family annual income falls below this poverty line are regarded as objectively poor. Finally, a student is defined as poor if he or she is either objectively poor or subjectively poor. We only asked these poverty-related questions in the first wave survey as students’ financial circumstances were assumed to be relatively stable during college, and so the poverty variable here is time-invariant. By this definition, we have obtained 1,155 poor students among a total of 4,369 students in our sample. This equates to a poverty rate of about 26 percent, suggesting that over a quarter of the students in the sample faced financial difficulties during university study.
In our sample, the median annual university expenses for students in Beijing were 5,000 yuan in tuition fees, 900 yuan in accommodation, 8,400 yuan in living costs (700 yuan per month), and 15,100 yuan for total cost.1 To put these figures into perspective, in 2009 (the year the baseline survey was conducted), China’s GDP per capita was 25,575 yuan, the average disposable income of urban residents was 17,175 yuan, and the average disposable income of rural residents was 5,153 yuan. In other words, the total annual expenses for a university student in Beijing were equivalent to 60 percent of GDP per capita at the time, 90 percent of an urban resident’s disposable income, and almost triple that of a rural resident.
The other key variable is noncognitive abilities, measured by self-efficacy and self-esteem in this paper following the approach adopted in previous research (Heckman, Stixrud, and Urzua 2006). In the BCSPS, self-efficacy is measured using the General Self-Efficacy Scale, which was developed by Matthias Jerusalem and Ralf Schwarzer in 1981 and is used worldwide.
FALL 2017 61
This scale was designed to assess an individual’s optimistic self-beliefs in coping with a variety of difficult demands in life. Respondents are requested to score each of ten items, with a higher score suggesting higher self-efficacy. As for self-esteem, the BCSPS employs the conventional Rosenberg Self- Esteem Scale, which assesses an individual’s self-evaluation of his or her worth and value. The scale also has ten items, but five are positively scored, while the other five are negatively scored. After inversing the negatively- scored items, a higher score suggests higher self-esteem. In both scales, the mean scores of all of the items are calculated to construct composite indexes, but if respondents fail to answer three or more items, the final scores are invalid and coded as missing.2 The BCSPS uses the same questions each year to repeatedly measure students’ self-efficacy and self-esteem to identify changes in their noncognitive abilities during college.
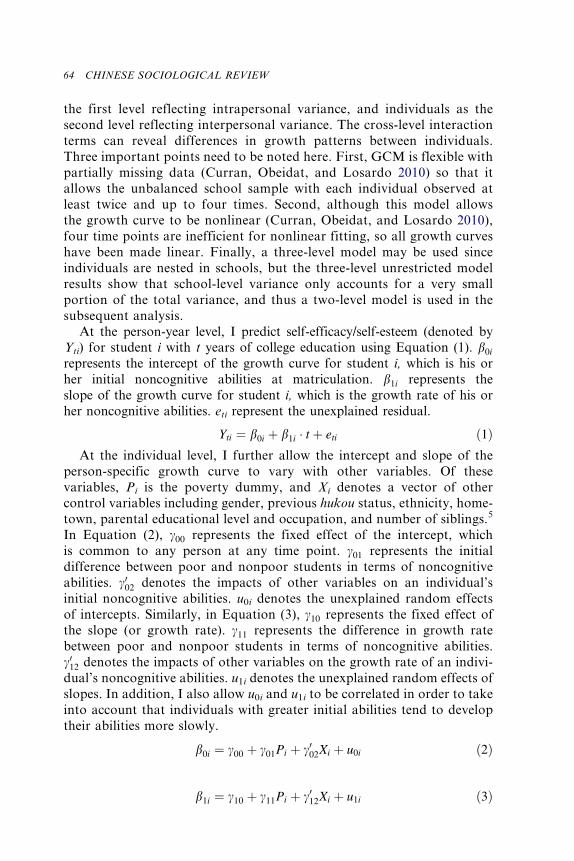
I use the natural logarithm of the hourly wage of a college graduate’s first job as the major outcome variable and also attempt to control for other labor market characteristics that may potentially affect earnings, including job location (Beijing ¼ 1), type of work unit (government agency or insti-tution, state-owned enterprise, private enterprise, other, or missing), job industry (primary or secondary sector, information technology, finance, other tertiary sector, other, or missing), and also occupation (manager, professional, clerk, other, or missing).
Other control variables include individual characteristics, such as gender (male ¼ 1), hukou status before university (urban ¼ 1), ethnicity (minority ¼ 1), hometown (Beijing ¼ 1); and family background indicators, such as parental educational level (at least one parent has a college degree ¼ 1), parental occupation (at least one parent has a middle-class occupation),3 and number of siblings; as well as a set of dummy variables for class (class of 2010 ¼ 1), university, and major.4
Table 1 and Table 2 present the descriptive statistics by poverty status for the school sample and the work sample, respectively. Table 1 shows that, in general, poor students came from significantly disadvantaged social backgrounds compared to their nonpoor counterparts. For instance, they were more likely to have originated in rural areas, and their parents were less likely to have college degrees or middle-class occupations. More important, they also demonstrated significantly lower noncognitive abilities than other students when entering college. However, this ability gap appeared to have gradually declined over time and had closed completely by graduation. Similarly, Table 2 also shows no significant differences between poor and nonpoor college graduates in the labor market in terms of personal abilities and school performance. These two groups also earned similar hourly wages in their first jobs, although nonpoor students appeared to enjoy a slight advantage in status attainment. For instance, larger proportions worked in the public sector or the financial industry, and acquired managerial occupations.
62 CHINESE SOCIOLOGICAL REVIEW
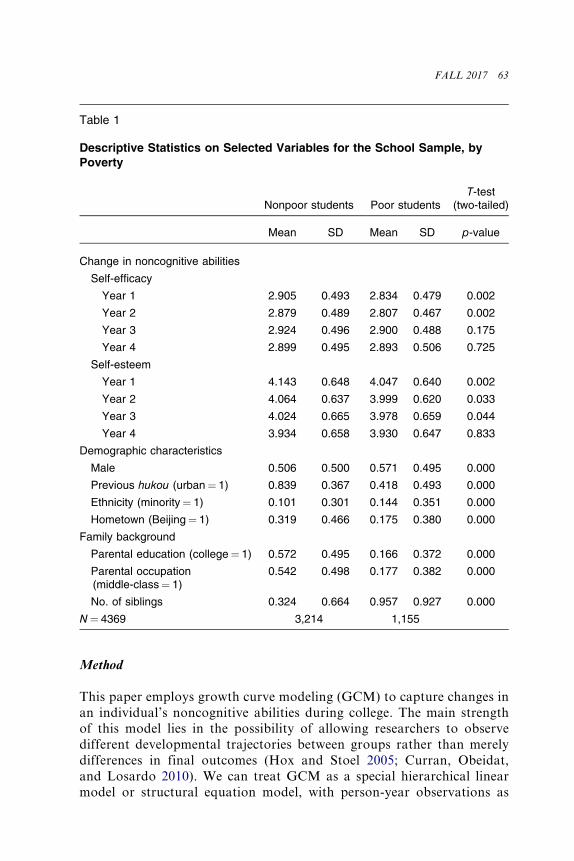
Method
This paper employs growth curve modeling (GCM) to capture changes in an individual’s noncognitive abilities during college. The main strength of this model lies in the possibility of allowing researchers to observe different developmental trajectories between groups rather than merely differences in final outcomes (Hox and Stoel 2005; Curran, Obeidat, and Losardo 2010). We can treat GCM as a special hierarchical linear model or structural equation model, with person-year observations as
Table 1
Descriptive Statistics on Selected Variables for the School Sample, by Poverty
Nonpoor students Poor students T-test
(two-tailed)
Mean SD Mean SD p-value
Change in noncognitive abilities
Self-efficacy
Year 1 2.905 0.493 2.834 0.479 0.002
Year 2 2.879 0.489 2.807 0.467 0.002
Year 3 2.924 0.496 2.900 0.488 0.175
Year 4 2.899 0.495 2.893 0.506 0.725
Self-esteem
Year 1 4.143 0.648 4.047 0.640 0.002
Year 2 4.064 0.637 3.999 0.620 0.033
Year 3 4.024 0.665 3.978 0.659 0.044
Year 4 3.934 0.658 3.930 0.647 0.833
Demographic characteristics
Male 0.506 0.500 0.571 0.495 0.000
Previous hukou (urban ¼ 1) 0.839 0.367 0.418 0.493 0.000
Ethnicity (minority ¼ 1) 0.101 0.301 0.144 0.351 0.000
Hometown (Beijing ¼ 1) 0.319 0.466 0.175 0.380 0.000
Family background
Parental education (college ¼ 1) 0.572 0.495 0.166 0.372 0.000
Parental occupation (middle-class ¼ 1)
0.542 0.498 0.177 0.382 0.000
No. of siblings 0.324 0.664 0.957 0.927 0.000
N ¼ 4369 3,214 1,155
FALL 2017 63
the first level reflecting intrapersonal variance, and individuals as the second level reflecting interpersonal variance. The cross-level interaction terms can reveal differences in growth patterns between individuals. Three important points need to be noted here. First, GCM is flexible with partially missing data (Curran, Obeidat, and Losardo 2010) so that it allows the unbalanced school sample with each individual observed at least twice and up to four times. Second, although this model allows the growth curve to be nonlinear (Curran, Obeidat, and Losardo 2010), four time points are inefficient for nonlinear fitting, so all growth curves have been made linear. Finally, a three-level model may be used since individuals are nested in schools, but the three-level unrestricted model results show that school-level variance only accounts for a very small portion of the total variance, and thus a two-level model is used in the subsequent analysis.
At the person-year level, I predict self-efficacy/self-esteem (denoted by Yti) for student i with t years of college education using Equation (1). b0i
represents the intercept of the growth curve for student i, which is his or her initial noncognitive abilities at matriculation. b1i represents the slope of the growth curve for student i, which is the growth rate of his or her noncognitive abilities. eti represent the unexplained residual.
Yti ¼ b0i þ b1i � t þ eti ð1Þ
At the individual level, I further allow the intercept and slope of the person-specific growth curve to vary with other variables. Of these variables, Pi is the poverty dummy, and Xi denotes a vector of other control variables including gender, previous hukou status, ethnicity, home-town, parental educational level and occupation, and number of siblings.5
In Equation (2), c00 represents the fixed effect of the intercept, which is common to any person at any time point. c01 represents the initial difference between poor and nonpoor students in terms of noncognitive abilities. c002 denotes the impacts of other variables on an individual’s initial noncognitive abilities. u0i denotes the unexplained random effects of intercepts. Similarly, in Equation (3), c10 represents the fixed effect of the slope (or growth rate). c11 represents the difference in growth rate between poor and nonpoor students in terms of noncognitive abilities. c012 denotes the impacts of other variables on the growth rate of an indivi-dual’s noncognitive abilities. u1i denotes the unexplained random effects of slopes. In addition, I also allow u0i and u1i to be correlated in order to take into account that individuals with greater initial abilities tend to develop their abilities more slowly.
b0i ¼ c00 þ c01Pi þ c002Xi þ u0i ð2Þ
b1i ¼ c10 þ c11Pi þ c012Xi þ u1i ð3Þ
64 CHINESE SOCIOLOGICAL REVIEW
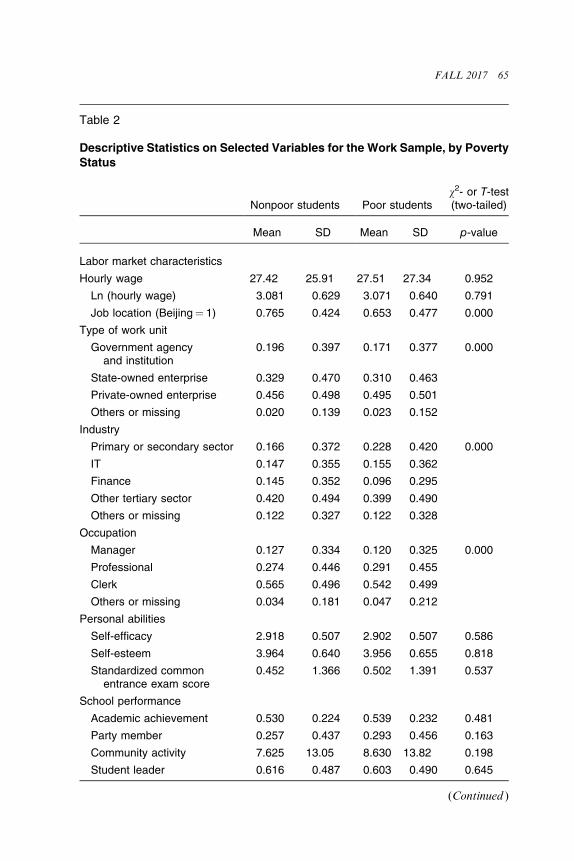
Table 2
Descriptive Statistics on Selected Variables for the Work Sample, by Poverty Status
Nonpoor students Poor students v2- or T-test (two-tailed)
Mean SD Mean SD p-value
Labor market characteristics
Hourly wage 27.42 25.91 27.51 27.34 0.952
Ln (hourly wage) 3.081 0.629 3.071 0.640 0.791
Job location (Beijing ¼ 1) 0.765 0.424 0.653 0.477 0.000
Type of work unit
Government agency and institution
0.196 0.397 0.171 0.377 0.000
State-owned enterprise 0.329 0.470 0.310 0.463
Private-owned enterprise 0.456 0.498 0.495 0.501
Others or missing 0.020 0.139 0.023 0.152
Industry
Primary or secondary sector 0.166 0.372 0.228 0.420 0.000
IT 0.147 0.355 0.155 0.362
Finance 0.145 0.352 0.096 0.295
Other tertiary sector 0.420 0.494 0.399 0.490
Others or missing 0.122 0.327 0.122 0.328
Occupation
Manager 0.127 0.334 0.120 0.325 0.000
Professional 0.274 0.446 0.291 0.455
Clerk 0.565 0.496 0.542 0.499
Others or missing 0.034 0.181 0.047 0.212
Personal abilities
Self-efficacy 2.918 0.507 2.902 0.507 0.586
Self-esteem 3.964 0.640 3.956 0.655 0.818
Standardized common entrance exam score
0.452 1.366 0.502 1.391 0.537
School performance
Academic achievement 0.530 0.224 0.539 0.232 0.481
Party member 0.257 0.437 0.293 0.456 0.163
Community activity 7.625 13.05 8.630 13.82 0.198
Student leader 0.616 0.487 0.603 0.490 0.645
(Continued )
FALL 2017 65
Results
The Growth of Non-Cognitive Abilities during College
The fundamental argument of my research hypothesis is that a four-year college education can increase students’ human capital to more effectively prepare them for future challenges. There is mounting evidence pointing to the significant influence of non-cognitive abilities on the labor market perfor-mance of college graduates, and is therefore essential to examine dynamic changes in students’ noncognitive abilities during their university life.
First, we aimed to determine whether or not students’ noncognitive abilities vary based on their social origins when they first enter college. The selection hypothesis implies that poor students should exhibit equal, if not greater, abilities compared to nonpoor students. Nevertheless, con-sidering that the development of noncognitive skills is likely to be influenced by family investment and developmental environment (Cunha and Heckman 2008), and China’s current college entrance exam (CEE) system only screens students based on their test scores and does not evaluate their other abilities, university students from impoverished families are assumed to have lower noncognitive abilities on average at matriculation.
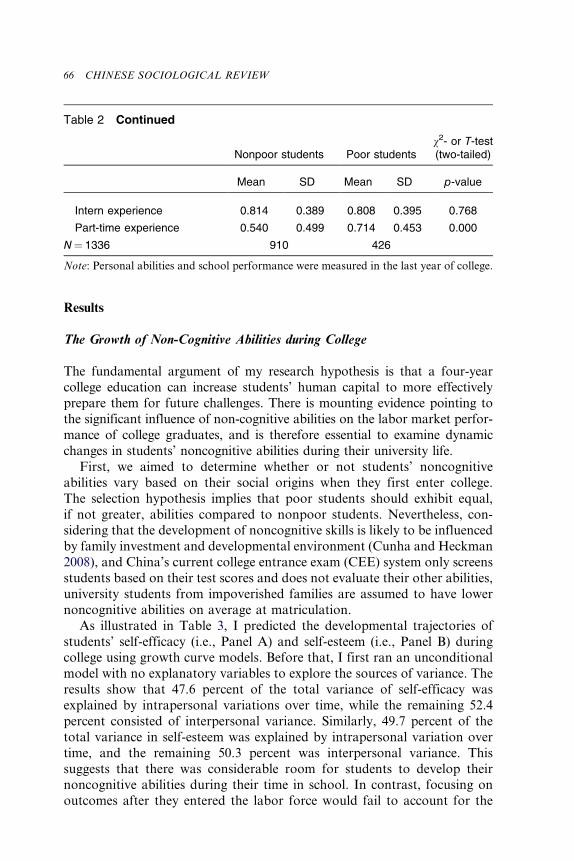
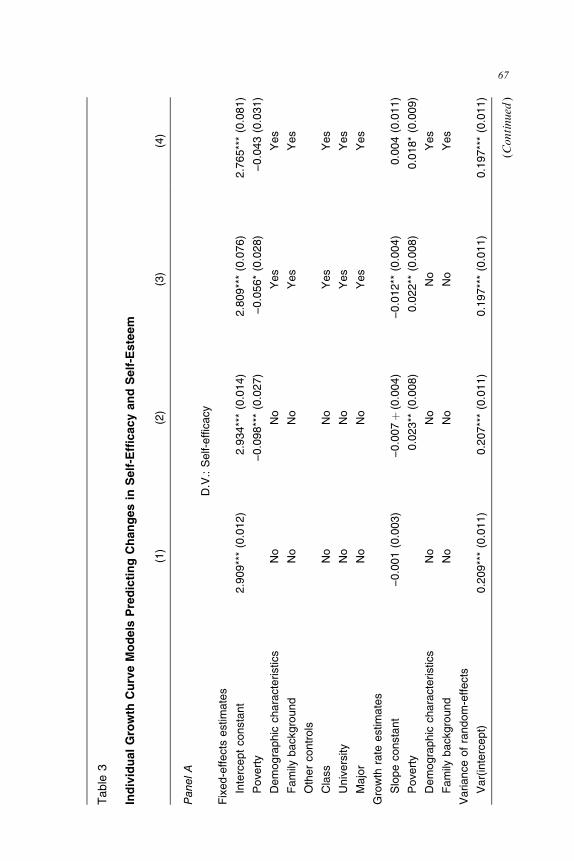
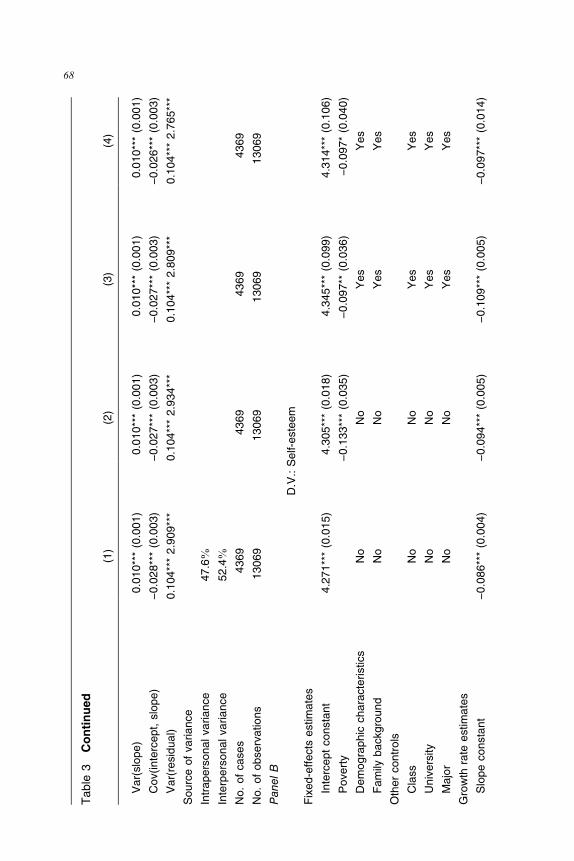
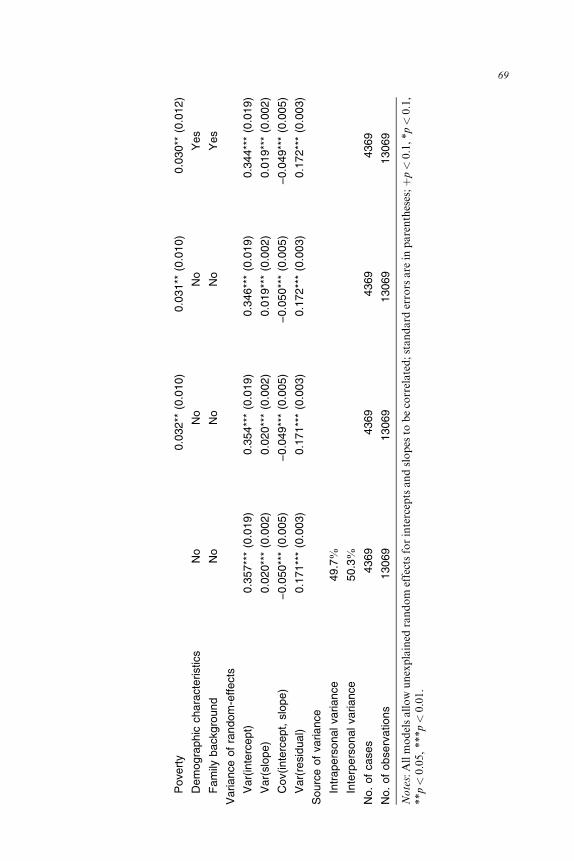
As illustrated in Table 3, I predicted the developmental trajectories of students’ self-efficacy (i.e., Panel A) and self-esteem (i.e., Panel B) during college using growth curve models. Before that, I first ran an unconditional model with no explanatory variables to explore the sources of variance. The results show that 47.6 percent of the total variance of self-efficacy was explained by intrapersonal variations over time, while the remaining 52.4 percent consisted of interpersonal variance. Similarly, 49.7 percent of the total variance in self-esteem was explained by intrapersonal variation over time, and the remaining 50.3 percent was interpersonal variance. This suggests that there was considerable room for students to develop their noncognitive abilities during their time in school. In contrast, focusing on outcomes after they entered the labor force would fail to account for the
Table 2 Continued
Nonpoor students Poor students v2- or T-test (two-tailed)
Mean SD Mean SD p-value
Intern experience 0.814 0.389 0.808 0.395 0.768
Part-time experience 0.540 0.499 0.714 0.453 0.000
N ¼ 1336 910 426
Note: Personal abilities and school performance were measured in the last year of college.
66 CHINESE SOCIOLOGICAL REVIEW
Tab
le 3
Ind
ivid
ual
Gro
wth
Cu
rve
Mo
del
s P
red
icti
ng
Ch
ang
es i
n S
elf-
Eff
icac
y an
d S
elf-
Est
eem
(1)
(2)
(3)
(4)
Pan
el A
D.V
.: S
elf-
effic
acy
Fix
ed-e
ffect
s es
timat
es
Inte
rcep
t co
nsta
nt
2.90
9***
(0.
012)
2.
934*
** (
0.01
4)
2.80
9***
(0.
076)
2.
765*
** (
0.08
1)
Pov
erty
−
0.09
8***
(0.
027)
−
0.05
6* (
0.02
8)
−0.
043
(0.0
31)
Dem
ogra
phic
cha
ract
eris
tics
No
No
Yes
Y
es
Fam
ily b
ackg
roun
d N
o N
o Y
es
Yes
Oth
er c
ontr
ols
Cla
ss
No
No
Yes
Y
es
Uni
vers
ity
No
No
Yes
Y
es
Maj
or
No
No
Yes
Y
es
Gro
wth
rat
e es
timat
es
Slo
pe c
onst
ant
−0.
001
(0.0
03)
−
0.00
7 þ
(0.0
04)
−
0.01
2**
(0.0
04)
0.
004
(0.0
11)
Pov
erty
0.
023*
* (0
.008
)
0.02
2**
(0.0
08)
0.
018*
(0.
009)
Dem
ogra
phic
cha
ract
eris
tics
No
No
No
Yes
Fam
ily b
ackg
roun
d N
o N
o N
o Y
es
Var
ianc
e of
ran
dom
-effe
cts
Var
(inte
rcep
t)
0.20
9***
(0.
011)
0.
207*
** (
0.01
1)
0.19
7***
(0.
011)
0.
197*
** (
0.01
1)
(Con
tinu
ed )
67
Tab
le 3
C
on
tin
ued
(1)
(2)
(3)
(4)
Var
(slo
pe)
0.
010*
** (
0.00
1)
0.01
0***
(0.
001)
0.
010*
** (
0.00
1)
0.01
0***
(0.
001)
Cov
(inte
rcep
t, sl
ope)
−
0.02
8***
(0.
003)
−
0.02
7***
(0.
003)
−
0.02
7***
(0.
003)
−
0.02
6***
(0.
003)
Var
(res
idua
l) 0.
104*
** 2
.909
***
0.10
4***
2.9
34**
* 0.
104*
** 2
.809
***
0.10
4***
2.7
65**
*
Sou
rce
of v
aria
nce
Intr
aper
sona
l var
ianc
e
47.6%
�
Inte
rper
sona
l var
ianc
e
52.4%
�
No.
of
case
s
4369
43
69
4369
43
69
No.
of
obse
rvat
ions
13
069
13
069
13
069
13
069
Pan
el B
D.V
.: S
elf-
este
em
Fix
ed-e
ffect
s es
timat
es
Inte
rcep
t co
nsta
nt
4.27
1***
(0.
015)
4.
305*
** (
0.01
8)
4.34
5***
(0.
099)
4.
314*
** (
0.10
6)
Pov
erty
−
0.13
3***
(0.
035)
−
0.09
7**
(0.0
36)
−
0.09
7* (
0.04
0)
Dem
ogra
phic
cha
ract
eris
tics
No
No
Yes
Y
es
Fam
ily b
ackg
roun
d N
o N
o Y
es
Yes
Oth
er c
ontr
ols
Cla
ss
No
No
Yes
Y
es
Uni
vers
ity
No
No
Yes
Y
es
Maj
or
No
No
Yes
Y
es
Gro
wth
rat
e es
timat
es
Slo
pe c
onst
ant
−0.
086*
** (
0.00
4)
−0.
094*
** (
0.00
5)
−0.
109*
** (
0.00
5)
−0.
097*
** (
0.01
4)
68
Pov
erty
0.
032*
* (0
.010
)
0.03
1**
(0.0
10)
0.
030*
* (0
.012
)
Dem
ogra
phic
cha
ract
eris
tics
No
No
No
Yes
Fam
ily b
ackg
roun
d N
o N
o N
o Y
es
Var
ianc
e of
ran
dom
-effe
cts
Var
(inte
rcep
t)
0.35
7***
(0.
019)
0.
354*
** (
0.01
9)
0.34
6***
(0.
019)
0.
344*
** (
0.01
9)
Var
(slo
pe)
0.
020*
** (
0.00
2)
0.02
0***
(0.
002)
0.
019*
** (
0.00
2)
0.01
9***
(0.
002)
Cov
(inte
rcep
t, sl
ope)
−
0.05
0***
(0.
005)
−
0.04
9***
(0.
005)
−
0.05
0***
(0.
005)
−
0.04
9***
(0.
005)
Var
(res
idua
l)
0.17
1***
(0.
003)
0.
171*
** (
0.00
3)
0.17
2***
(0.
003)
0.
172*
** (
0.00
3)
Sou
rce
of v
aria
nce
Intr
aper
sona
l var
ianc
e
49.7%
��
Inte
rper
sona
l var
ianc
e
50.3%
�
No.
of
case
s
4369
43
69
4369
43
69
No.
of
obse
rvat
ions
13
069
13
069
13
069
13
069
Not
es: A
ll m
odel
s al
low
une
xpla
ined
ran
dom
eff
ects
for
inte
rcep
ts a
nd s
lope
s to
be
corr
elat
ed; s
tand
ard
erro
rs a
re in
par
enth
eses
; þp <
0.1,
*p <
0.1,
**
p <
0.05
, **
*p <
0.01
.
69
contribution of higher education to their accumulation of human capital. Model (1) only includes the time variable, and the constant of the slope reflects the growth rate of noncognitive abilities for all university students. Surprisingly, we can see no significant change in terms of self-efficacy, and self-esteem even declined slightly. The latter could potentially be explained by a short spike in self-esteem after a strong performance in the CEE, followed by a return to normal levels after matriculation.
More important, we are interested in determining whether developmental trajectories differ between groups due to variations in the college effect. There-fore, in Model (2), I further include the poverty dummy together with other individual controls and allow poor and nonpoor students to exhibit different growth rates of noncognitive abilities. As the fixed-effect estimates show, the coefficients of the poverty dummy are negative and significant, suggesting that poor students actually have lower noncognitive abilities compared to their nonpoor counterparts at matriculation, which contradicts the selection hypothesis. In addition, the cross-level interaction terms (i.e., growth rates) are positive and significant, suggesting that poor students developed their noncognitive abilities more rapidly. This result holds even after we control for the fixed and random effects of other variables in Models (3) and (4).
To visualize this dynamic process of change, Figure 3 is drawn based on the estimations in Model (4) of Table 3. The upper panel clearly shows that on average, poor students had much lower self-efficacy than nonpoor students during their first year of college but developed them much more rapidly and the gap between these two groups had disappeared by graduation accordingly. A similar pattern is observed in the lower panel. Nonpoor students had higher levels of self-esteem on average, but this also decreased more rapidly over time so that they had almost the same level of self-esteem as poor students at gradu-ation. To sum up, although poor students lagged behind in terms of noncog-nitive abilities when they first entered college, their access to four-year higher education reduced or even eliminated their disadvantage compared with other students. Thus after graduation, these two groups with similar noncognitive abilities performed comparably in the labor force, which also explains the limited influence of poverty on first-job earnings. These results lend strong support to the hypothetic Model II proposed earlier, namely, the positive effect of higher education on human capital is especially significant for disad-vantaged students because their more affluent counterparts already have relatively developed noncognitive abilities before entering college.
The Effects of Noncognitive Abilities on the First-Job Earnings of College Graduates
Previous findings have attested to the equalization effect of higher education in terms of eliminating the ability gap between poor and nonpoor students.
70 CHINESE SOCIOLOGICAL REVIEW
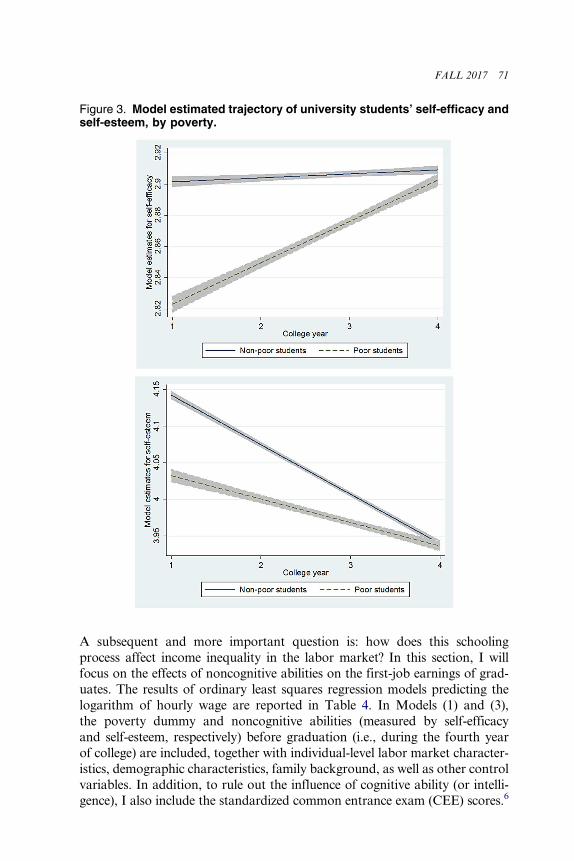
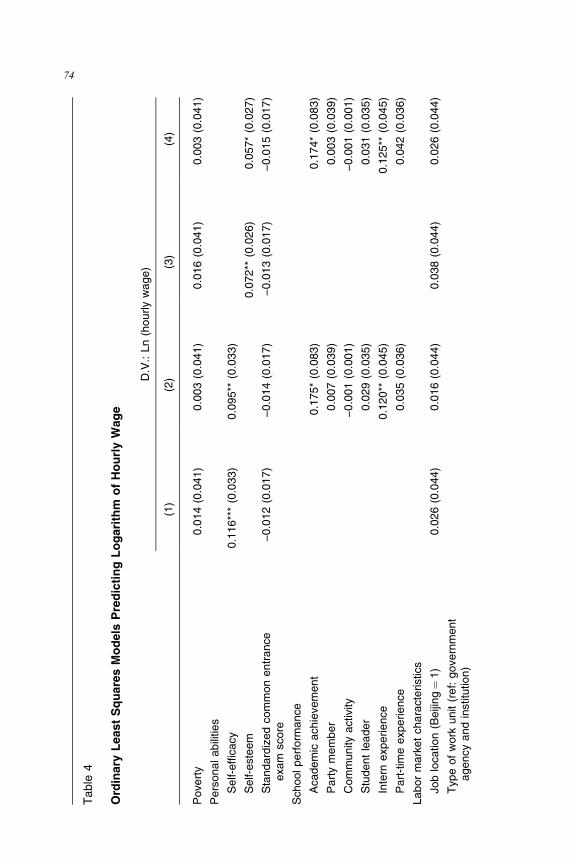
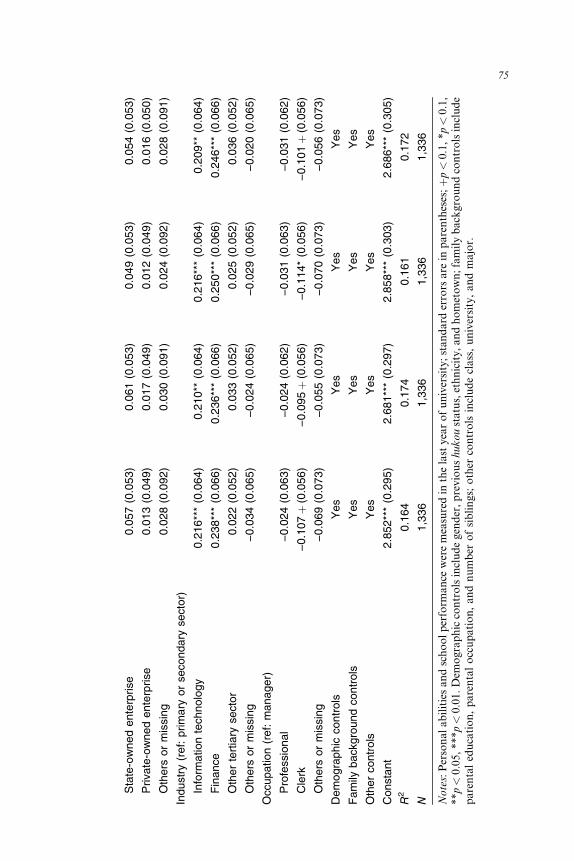
A subsequent and more important question is: how does this schooling process affect income inequality in the labor market? In this section, I will focus on the effects of noncognitive abilities on the first-job earnings of grad-uates. The results of ordinary least squares regression models predicting the logarithm of hourly wage are reported in Table 4. In Models (1) and (3), the poverty dummy and noncognitive abilities (measured by self-efficacy and self-esteem, respectively) before graduation (i.e., during the fourth year of college) are included, together with individual-level labor market character-istics, demographic characteristics, family background, as well as other control variables. In addition, to rule out the influence of cognitive ability (or intelli-gence), I also include the standardized common entrance exam (CEE) scores.6
Figure 3. Model estimated trajectory of university students’ self-efficacy and self-esteem, by poverty.
FALL 2017 71
The insignificant model estimates of the poverty dummy suggest no systematic difference between poor and nonpoor students in terms of first-job earnings. Moreover, consistent with previous studies, most family background variables have no significant impact on earnings among college graduates. This finding confirms that, at the higher education level, the association between family socioeconomic status and personal labor market outcomes has disappeared. As predicted, we also find that the two measures of noncognitive abilities, self-efficacy and self-esteem, both exert sizable impacts on the logarithm of hourly wages. For instance, a one point increase (on a scale of 1–5) in self-efficacy can boost respondents’ first-job earnings by 11.6 percent; and a one-point increase (on a scale of 1–4) in self-esteem can boost respondents’ first-job earnings by 9.5 percent. Cognitive abilities (as measured by standardized CEE scores), on the other hand, had no significant impact on earnings, presumably because the selection process of college admission is largely based on the screening of these abilities, resulting in an intellectually homogenous group.
These results reveal that the differences between college graduates mainly originates in unmeasured or unobserved personal traits, and the impacts of noncognitive abilities on the earnings of graduates are more decisive than those of their social origins and even cognitive abilities. Combining previous findings on changes in respondents’ noncognitive abilities during college, it is reasonable to counterfactually infer that, if poor students had failed to catch up with their nonpoor counterparts in developing their noncognitive abilities during their studies, they may not have performed as well in the labor force. Indeed, according to our model, if the gaps in self-efficacy or self-esteem between the two groups had remained at the same level at graduation as when they first entered university, graduates from poor house-holds would have earned an average of 1.14 percent (0.098*11.6%) or 1.26 percent (0.133*9.5%) less than nonpoor graduates.
Robustness Check
Apart from acquiring professional knowledge and skills, university students of different social origins obtain the opportunity to connect with young people from all over the country, participate in various social and community activities, and gain work experience through internships and part-time jobs. Through this process, their social capital is accumulated, their worldviews are broadened, and their practical skills are sharpened. These activities can significantly improve their noncognitive abilities as well as their performance in the workplace after graduation.
I examined a wide variety of measures of respondents’ academic performance and extracurricular participation during each year of college, including academic achievement (relative GPA ranking within their class),7
72 CHINESE SOCIOLOGICAL REVIEW
membership of the Chinese Communist Party (CCP) (yes ¼ 1), community activity participation (average hours spent on community activities per week), whether they had ever led a student organization, and whether they had interned or worked part-time. The subsequent correlation analysis suggests positive and significant associations between noncognitive abilities and all of these school performance indicators.8 In other words, students who performed well academically and actively engaged in extracurricular activities tended to have more developed noncognitive abilities. This is unsurprising, but a distinctive pattern emerges when we consider differences between poor and nonpoor students. Contrary to our expectations, poor students actually performed better, rather than worse, in almost all aspects. In each year of college, poor students developed much quicker in terms of academic achievement and community activity participation, and they were also more likely to join the CCP and become leaders of student organizations as well as to gain work experience through internships and part-time jobs. All of these activities can potentially increase self-efficacy and self-esteem, and thus despite lagging behind at matriculation, poor stu-dents were able to continually enhance their noncognitive abilities through these activities on campus.
Nevertheless, we should also consider the potential direct influence of academic performance and extracurricular participation during college on job earnings after graduation. If this is the case, the increase in noncognitive abilities may be a mere side-effect of this process, and after including these performance variables in models predicting college graduates’ earnings, the positive impacts of noncognitive abilities may decrease dramatically, or even vanish. To test this possibility, in Models (2) and (4) of Table 4, I introduce a series of indicators of academic performance and extracurricular partici-pation. The results suggest that apart from academic achievement and intern experience, most of the school performance variables had no direct influence on earnings. Moreover, after including all of these variables, the effects of noncognitive abilities only decreased slightly and remained statistically sig-nificant. This result suggests that academic performance and extracurricular activities are indeed important for success in the labor force but only indirectly by gradually improving the noncognitive abilities of university students.
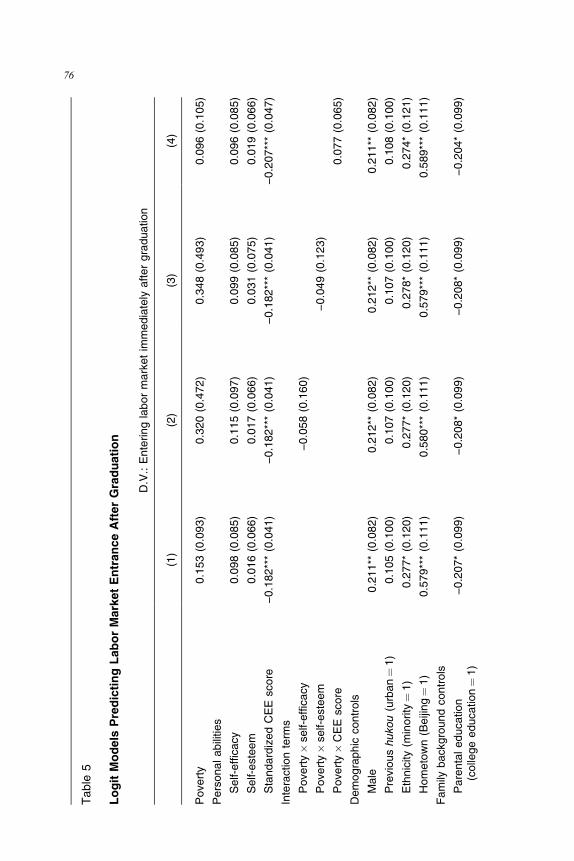
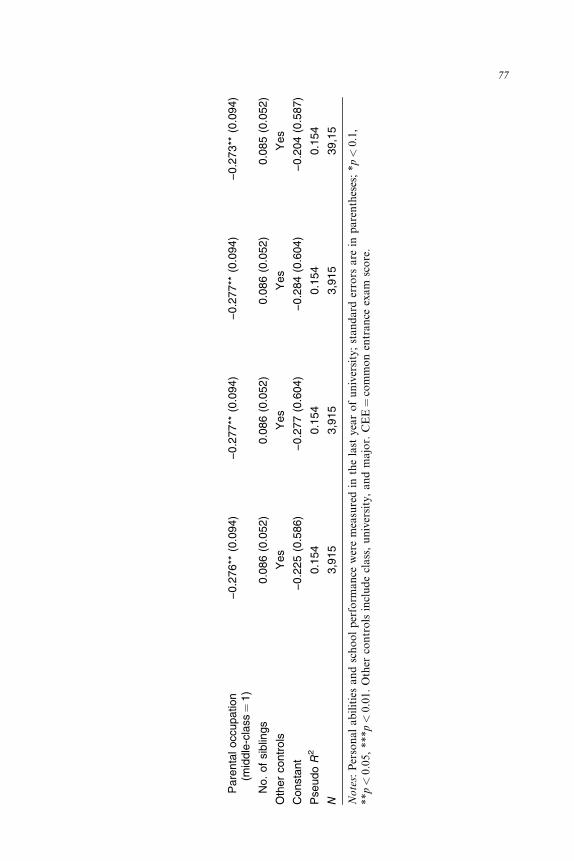
Another potential threat to the empirical findings is the sample selection problem. Since a considerable proportion of university students engage in advanced studies instead of entering the workforce immediately after graduation, this selection process may potentially bias our results given the rational assumption that poor students are more likely to work immediately after graduation due to economic constraints and family responsibilities. In Table 5, I also predict the probability of a student starting to work immediately after graduation. In the first baseline model, the results show, that after controlling for other factors, there is
FALL 2017 73
Tab
le 4
Ord
inar
y L
east
Sq
uar
es M
od
els
Pre
dic
tin
g L
og
arit
hm
of
Ho
url
y W
age
D.V
.: Ln
(ho
urly
wag
e)
(1)
(2)
(3)
(4)
Pov
erty
0.
014
(0.0
41)
0.
003
(0.0
41)
0.
016
(0.0
41)
0.
003
(0.0
41)
Per
sona
l abi
litie
s
Sel
f-ef
ficac
y
0.11
6***
(0.
033)
0.
095*
* (0
.033
)
Sel
f-es
teem
0.07
2**
(0.0
26)
0.
057*
(0.
027)
Sta
ndar
dize
d co
mm
on e
ntra
nce
ex
am s
core
−
0.01
2 (0
.017
)
−0.
014
(0.0
17)
−
0.01
3 (0
.017
)
−0.
015
(0.0
17)
Sch
ool p
erfo
rman
ce
Aca
dem
ic a
chie
vem
ent
0.
175*
(0.
083)
0.
174*
(0.
083)
Par
ty m
embe
r
0.00
7 (0
.039
)
0.00
3 (0
.039
)
Com
mun
ity a
ctiv
ity
−0.
001
(0.0
01)
−
0.00
1 (0
.001
)
Stu
dent
lead
er
0.02
9 (0
.035
)
0.03
1 (0
.035
)
Inte
rn e
xper
ienc
e
0.12
0**
(0.0
45)
0.
125*
* (0
.045
)
Par
t-tim
e ex
perie
nce
0.
035
(0.0
36)
0.
042
(0.0
36)
Labo
r m
arke
t ch
arac
teris
tics
Job
loca
tion
(Bei
jing ¼
1)
0.02
6 (0
.044
)
0.01
6 (0
.044
)
0.03
8 (0
.044
)
0.02
6 (0
.044
)
Typ
e of
wor
k un
it (r
ef:
gove
rnm
ent
agen
cy a
nd in
stitu
tion)
74
Sta
te-o
wne
d en
terp
rise
0.
057
(0.0
53)
0.
061
(0.0
53)
0.
049
(0.0
53)
0.
054
(0.0
53)
Priv
ate-
owne
d en
terp
rise
0.
013
(0.0
49)
0.
017
(0.0
49)
0.
012
(0.0
49)
0.
016
(0.0
50)
Oth
ers
or m
issi
ng
0.02
8 (0
.092
)
0.03
0 (0
.091
)
0.02
4 (0
.092
)
0.02
8 (0
.091
)
Indu
stry
(re
f: pr
imar
y or
sec
onda
ry s
ecto
r)
Info
rmat
ion
tech
nolo
gy
0.21
6***
(0.
064)
0.
210*
* (0
.064
)
0.21
6***
(0.
064)
0.
209*
* (0
.064
)
Fin
ance
0.
238*
** (
0.06
6)
0.23
6***
(0.
066)
0.
250*
** (
0.06
6)
0.24
6***
(0.
066)
Oth
er t
ertia
ry s
ecto
r
0.02
2 (0
.052
)
0.03
3 (0
.052
)
0.02
5 (0
.052
)
0.03
6 (0
.052
)
Oth
ers
or m
issi
ng
−0.
034
(0.0
65)
−
0.02
4 (0
.065
)
−0.
029
(0.0
65)
−
0.02
0 (0
.065
)
Occ
upat
ion
(ref
: m
anag
er)
Pro
fess
iona
l −
0.02
4 (0
.063
)
−0.
024
(0.0
62)
−
0.03
1 (0
.063
)
−0.
031
(0.0
62)
Cle
rk
−0.
107 þ
(0.0
56)
−
0.09
5 þ
(0.0
56)
−
0.11
4* (
0.05
6)
−0.
101 þ
(0.0
56)
Oth
ers
or m
issi
ng
−0.
069
(0.0
73)
−
0.05
5 (0
.073
)
−0.
070
(0.0
73)
−
0.05
6 (0
.073
)
Dem
ogra
phic
con
trol
s Y
es
Yes
Y
es
Yes
Fam
ily b
ackg
roun
d co
ntro
ls
Yes
Y
es
Yes
Y
es
Oth
er c
ontr
ols
Yes
Y
es
Yes
Y
es
Con
stan
t 2.
852*
** (
0.29
5)
2.68
1***
(0.
297)
2.
858*
** (
0.30
3)
2.68
6***
(0.
305)
R2
0.
164
0.
174
0.
161
0.
172
N
1,33
6
1,33
6
1,33
6
1,33
6
Not
es: P
erso
nal a
bilit
ies
and
scho
ol p
erfo
rman
ce w
ere
mea
sure
d in
the
last
yea
r of
uni
vers
ity;
sta
ndar
d er
rors
are
in p
aren
thes
es; þ
p <
0.1,
*p <
0.1,
**
p <
0.05
, ***
p <
0.01
. Dem
ogra
phic
con
trol
s in
clud
e ge
nder
, pre
viou
s hu
kou
stat
us, e
thni
city
, and
hom
etow
n; f
amily
bac
kgro
und
cont
rols
incl
ude
pare
ntal
edu
cati
on,
pare
ntal
occ
upat
ion,
and
num
ber
of s
iblin
gs;
othe
r co
ntro
ls i
nclu
de c
lass
, un
iver
sity
, an
d m
ajor
.
75
Tab
le 5
Lo
git
Mo
del
s P
red
icti
ng
Lab
or
Mar
ket
En
tran
ce A
fter
Gra
du
atio
n
D.V
.: E
nter
ing
labo
r m
arke
t im
med
iate
ly a
fter
grad
uatio
n
(1)
(2)
(3)
(4)
Pov
erty
0.
153
(0.0
93)
0.
320
(0.4
72)
0.
348
(0.4
93)
0.
096
(0.1
05)
Per
sona
l abi
litie
s
Sel
f-ef
ficac
y
0.09
8 (0
.085
)
0.11
5 (0
.097
)
0.09
9 (0
.085
)
0.09
6 (0
.085
)
Sel
f-es
teem
0.
016
(0.0
66)
0.
017
(0.0
66)
0.
031
(0.0
75)
0.
019
(0.0
66)
Sta
ndar
dize
d C
EE
sco
re
−0.
182*
** (
0.04
1)
−0.
182*
** (
0.04
1)
−0.
182*
** (
0.04
1)
−0.
207*
** (
0.04
7)
Inte
ract
ion
term
s
Pov
erty
�se
lf-ef
ficac
y
−0.
058
(0.1
60)
Pov
erty
�se
lf-es
teem
−0.
049
(0.1
23)
Pov
erty
�C
EE
sco
re
0.
077
(0.0
65)
Dem
ogra
phic
con
trol
s
Mal
e
0.21
1**
(0.0
82)
0.
212*
* (0
.082
)
0.21
2**
(0.0
82)
0.
211*
* (0
.082
)
Pre
viou
s hu
kou
(urb
an ¼
1)
0.10
5 (0
.100
)
0.10
7 (0
.100
)
0.10
7 (0
.100
)
0.10
8 (0
.100
)
Eth
nici
ty (
min
ority
¼1)
0.
277*
(0.
120)
0.
277*
(0.
120)
0.
278*
(0.
120)
0.
274*
(0.
121)
Hom
etow
n (B
eijin
g ¼
1)
0.57
9***
(0.
111)
0.
580*
** (
0.11
1)
0.57
9***
(0.
111)
0.
589*
** (
0.11
1)
Fam
ily b
ackg
roun
d co
ntro
ls
Par
enta
l edu
catio
n
(col
lege
edu
catio
n ¼
1)
−0.
207*
(0.
099)
−
0.20
8* (
0.09
9)
−0.
208*
(0.
099)
−
0.20
4* (
0.09
9)
76
Par
enta
l occ
upat
ion
(m
iddl
e-cl
ass ¼
1)
−0.
276*
* (0
.094
)
−0.
277*
* (0
.094
)
−0.
277*
* (0
.094
)
−0.
273*
* (0
.094
)
No.
of
sibl
ings
0.
086
(0.0
52)
0.
086
(0.0
52)
0.
086
(0.0
52)
0.
085
(0.0
52)
Oth
er c
ontr
ols
Yes
Y
es
Yes
Y
es
Con
stan
t −
0.22
5 (0
.586
)
−0.
277
(0.6
04)
−
0.28
4 (0
.604
)
−0.
204
(0.5
87)
Pse
udo
R2
0.
154
0.15
4 0.
154
0.15
4
N
3,91
5 3,
915
3,91
5 39
,15
Not
es:
Per
sona
l ab
iliti
es a
nd s
choo
l pe
rfor
man
ce w
ere
mea
sure
d in
the
las
t ye
ar o
f un
iver
sity
; st
anda
rd e
rror
s ar
e in
par
enth
eses
; *p
<0.
1,
**p <
0.05
, **
*p <
0.01
. O
ther
con
trol
s in
clud
e cl
ass,
uni
vers
ity,
and
maj
or.
CE
E ¼
com
mon
ent
ranc
e ex
am s
core
.
77
no significant difference between poor and nonpoor students in terms of their options after graduation. However, students with greater cognitive abilities (measured by standardized CEE score) are more likely to continue their studies instead of entering the labor force immediately after graduation. Noncognitive abilities, on the other hand, have no such influ-ence on these decisions. In addition, the following models show that the interaction terms between the poverty dummy and personal ability measures are insignificant, suggesting that it is unlikely that the sample selection process contributed to the small ability gap between poor and nonpoor graduates in the work sample.
Conclusions and Discussion
Sociologists have long regarded higher education as a “great equalizer” as considerable evidence has shown that investing in higher education does pay off, especially for students of low-status origins (Brand and Xie 2010; Hout 2012). Nevertheless, the underlying mechanisms of this effect has been attributed either to the highly selective nature of higher education or to the signaling effect of a college diploma in the labor market. These perspectives have raised the question of whether the true value of higher education lies merely in screening and certifying. The primary goal of this paper is to draw attention to the effect of higher education per se. I argue college also has a direct effect on future income by enabling students to accumulate human capital, especially for those from families of low socioeconomic status.
In recent years a large number of studies have demonstrated strong positive associations between noncognitive skills and economic success (Goldsmith, Veum, and Darity 1997; Bowles, Gintis, and Osborne 2001; Heckman and Rubinstein 2001; Heckman, Stixrud, and Urzua 2006). These skills appear to be particularly malleable early in life, raising the possibility of interventions that can reduce inequality and enhance economic pro-ductivity. Findings in this paper also suggest that even among a group of relatively homogenous college graduates, noncognitive abilities are nonethe-less important factors that strongly influence job earnings. Thus, to enable a more in-depth understanding of the effect of higher education on income inequality in society, it is essential to investigate the ability gap between students of high- and low-status origins as well as the dynamic changes in this gap during university.
Based on the data from a five-wave panel survey on Beijing college students, the analysis using growth curve models reveals that a four-year higher education gradually closed the gaps in noncognitive abilities between poor and nonpoor students. This equalization process compensated for the potential disadvantage in the first-job earnings of college degree holders from impoverished households by more than one percent. These are
78 CHINESE SOCIOLOGICAL REVIEW
admittedly small effects in absolute terms but are significant considering that we are making comparisons within a relatively homogenous group. Moreover, the results here demonstrate that the accumulation of noncogni-tive abilities can be achieved within a relatively short period of time, while other ascribed factors such as social origins and genetic attributes are intrinsically immutable. Finally, mounting evidence has shown that noncog-nitive abilities are closely associated with not only labor market performance but also other developmental outcomes such as health and health-related behaviors. The effect of noncognitive ability growth on first-job earnings that we have identified thus only partially explains the positive effects of higher education.
Despite lagging initially, poor students are able to continually enhance their noncognitive abilities through a wide variety of activities and practices on campus. Specifically, they progress more quickly in terms of academic achievement, community activity participation, party membership and student leadership, and intern and part-time work experience. These activities and practices gradually improve their noncognitive abilities, which eventually enable them to overcome their social disadvantages and achieve equal earnings with their nonpoor counterparts in the labor market.
The findings in this paper provide new evidence that higher education reduces the influence of family background by offering a more egalitarian environment for students to acquire skills (Downey et al. 2004). In addition, this study is also in line with existing literature that implies that the main beneficiaries of higher education is not the most talented students but rather the socially disadvantaged (Brand and Xie 2010; Hout 2012). Finally, dynamic changes in noncognitive abilities during university, as demon-strated by the panel data in this study, can deepen our understanding of the relationship between higher education and earnings inequality in the labor market.
Acknowledgments
The author would like to thank Prof. Shizheng Feng, Dr. Weidong Wang, and Dr. Ding Li for their contributions to the data collection, and Prof. Xiaogang Wu for his valuable comments on earlier visions of this paper. The author is solely responsible for remaining omissions and errors.
Funding
Empirical analysis in this paper is based on data from the BCSPS, conducted by the National Survey Research Center (NSRC) at Renmin University of China. The 2009 and 2010 surveys received financial support from the HKUST Research Project Competition Fund (RPC07/08.HS02) (to Xiaogang Wu), the General Research Fund of Hong Kong Research Grants
FALL 2017 79
Council (644510) (to Xiaogang Wu), and the Scientific Research Fund of Renmin University of China (2009030080, 20100030415) (to Shizheng Feng).
Notes
1. Mean values may not accurately reflect general university expenses as they can be influenced by extreme values. Median values are therefore used instead.
2. Another conventional approach is to sum up all of the item scores. The advantage of using a mean score is that it uses the same scale as that of the original questions (e.g., from 1 to 4 for self-efficacy) to enable the final score to be more easily interpreted.
3. Professional and managerial occupations are defined as middle-class occupations.
4. Including economics, other social sciences, humanities, science, engineering, agriculture, medicine, and management, among others.
5. In Equation (2), I further include a set of dummy variables including class, universities, and majors.
6. For the specific standardization procedure, refer to Han and Li (2009). 7. This variable ranges from 0 to 1, with larger values indicating superior
academic performance. For instance, the number 0.8 signifies that a respondent’s grades exceeded those of 80 percent of students and ranked in the top 20 percent of his or her class.
8. The association table is omitted here due to limited space.
References
Arum, R., and J. Roksa. 2011. Academically Adrift: Limited Learning on College Campuses. Chicago, IL: University of Chicago Press.
Bowles, S., H. Gintis, and M. Osborne. 2001. “The Determinants of Earnings: A Behavioral Approach.” Journal of Economic Literature 39: 1137–76. doi:10.1257/jel.39.4.1137
Brand, J. E., and Y. Xie. 2010. “Who Benefits Most from College? Evidence for Negative Selection in Heterogeneous Economic Returns to Higher Education.” American Sociological Review 75(2): 273–302. doi:10.1177/0003122410363567
Breen, R., and J. O. Jonsson. 2007. “Explaining Change in Social Fluidity: Educational Equalization and Educational Expansion in Twentieth‐Century Sweden.” American Journal of Sociology 112(6): 1775–810. doi:10.1086/508790
Chevalier, A., C. Harmon, I. Walker, and Y. Zhu. 2004. “Does Education Raise Productivity, or Just Reflect It?” The Economic Journal 114(499): F499–517. doi:10.1111/j.1468-0297.2004.00256.x
Chia, G., and P. W. Miller. 2008. “Tertiary Performance, Field of Study and Graduate Starting Salaries.” Australian Economic Review 41(1): 15–31. doi:10.1111/j.1467-8462.2008.00471.x
Collins, R. 1979. The Credential Society: An Historical Sociology of Education and Stratification. New York: Academic Press.
Cunha, F., and J. J. Heckman. 2008. “Formulating, Identifying and Estimating the Technology of Cognitive and Noncognitive Skill Formation.” The Journal of Human Resources 43(4): 738–82. doi:10.3368/jhr.43.4.738
80 CHINESE SOCIOLOGICAL REVIEW
Curran, P. J., K. Obeidat, and D. Losardo. 2010. “Twelve Frequently Asked Questions about Growth Curve Modeling.” Journal of Cognition and Development 11(2): 121–36. doi:10.1080/15248371003699969
Downey, D. B., T. von Hippel Paul, and B. A. Broh. 2004. “Are Schools the Great Equalizer? Cognitive Inequality during the Summer Months and the School Year.” American Sociological Review 69(5): 613–635. doi:10.2307/3593031
Goldsmith, A. H., J. R. Veum, and W. Darity. 1997. “The Impact of Psychological and Human Capital on Wages.” Economic Inquiry 35(4): 815–29. doi:10.1111/ j.1465-7295.1997.tb01966.x
Han, L., and T. Li. 2009. “The Gender Difference of Peer Influence in Higher Education.” Economics of Education Review 28(1): 129–34. doi:10.1016/j. econedurev.2007.12.002
Heckman, J. J., and X. Li. 2004. “Selection Bias, Comparative Advantage and Heterogeneous Returns to Education: Evidence from China in 2000.” Pacific Economic Review 9(3): 155–71. doi:10.1111/j.1468-0106.2004.00242.x
Heckman, J. J., and Y. Rubinstein. 2001. “The Importance of Noncognitive Skills: Lessons from the GED Testing Program.” American Economic Review 91: 145–49. doi:10.1257/aer.91.2.145
Heckman, J. J., J. Stixrud, and S. Urzua. 2006. “The Effects of Cognitive and Noncognitive Abilities on Labor Market Outcomes and Social Behavior.” Journal of Labor Economics 24(3): 411–82. doi:10.1086/504455
Hout, M. 1984. “Status, Autonomy, and Training in Occupational Mobility.” American Journal of Sociology 89: 1379–409. doi:10.1086/228020
–––. 1988. “More Universalism, Less Structural Mobility: The American Occupational Structure in the 1980s.” American Journal of Sociology 93: 1358–400. doi:10.1086/228904
–––. 2012. “Social and Economic Returns to College Education in the United States.” Annual Review of Sociology 38: 379–400. doi:10.1146/annurev.soc. 012809.102503
Hox, J., and R. D. Stoel. 2005. “Multilevel and SEM Approaches to Growth Curve Modeling.” Pp. 1296–305 in Encyclopedia of Statistics in Behavioral Science, edited by B. S. Everitt and D. C. Howell. Chichester, UK: John Wiley & Sons.
Li, H., L. Meng, X. Shi, and B. Wu. 2013. “Poverty in China’s Colleges and the Targeting of Financial Aid.” The China Quarterly 216: 970–92. doi:10.1017/ s0305741013001082
Mare, R. D. 1980. “Social Background and School Continuation Decisions.” Journal of the American Statistical Association 75(370): 295–305. doi:10.2307/2287448
–––. 1981. “Change and Stability in Educational Stratification.” American Sociologi-cal Review 46(1): 72–87. doi:10.2307/2095027
Piore, M. J. 1983. “Labor Market Segmentation: To What Paradigm Does It Belong?” The American Economic Review 73(2): 249–53.
Rumberger, R. W., and S. L. Thomas. 1993. “The Economic Returns to College Major, Quality and Performance: A Multilevel Analysis of Recent Graduates.” Economics of Education Review 12(1): 1–19. doi:10.1016/0272-7757(93)90040-n
Shavit, Y., and H.-P. Blossfeld. 1993. Persistent Inequality: Changing Educational Attain-ment in Thirteen Countries. Social Inequality Series. Boulder, CO: Westview Press.
Shi, Y., L. Zhang, Y. Ma, H. Yi, C. Liu, N. Johnson, J. Chu, P. Loyalka, and S. Rozelle. 2015. “Dropout in Rural China’s Secondary Schools: A Mixed- Methods Analysis.” China Quarterly 224: 1048–69. doi:10.1017/ s0305741015001277.
Torche, F. 2011. “Is a College Degree Still the Great Equalizer? Intergenerational Mobility across Levels of Schooling in the United States.” American Journal of Sociology 117(3): 763–807. doi:10.1086/661904
FALL 2017 81
Treiman, D. J. 2013. “Trends in Educational Attainment in China.” Chinese Sociological Review 45(3): 3–25. doi:10.2753/csa2162-0555450301
Treiman, D. J., and K. Yamaguchi. 1993. “Trends in Educational Attainment in Japan.” Pp. 229–50 in Persistent Inequality: Changing Educational Attainment in Thirteen Countries, edited by Y. Shavit and H.-P. Blossfeld. Boulder, CO: Westview Press.
Wang, X., C. Liu, L. Zhang, A. Yue, Y. Shi, J. Chu, and S. Rozelle. 2013. “Does Financial aid Help Poor Students Succeed in College?” China Economic Review 25: 27–43. doi:10.1016/j.chieco.2013.01.003
Wang, Y. (Ed.). 2012. China Social Security System Development Report 2012 (in Chinese). Beijing: Social Sciences Academic Press.
Wise, D. A. 1975. “Academic Achievement and Job Performance.” The American Economic Review 65(3): 350–66.
Wu, X. 2010. “Economic Transition, School Expansion and Educational Inequality in China, 1990–2000.” Research in Social Stratification and Mobility 28(1): 91–108. doi:10.1016/j.rssm.2009.12.003
–––. 2017. “Higher Education, Elite Formation and Social Stratification in Contemporary China: Preliminary Findings from the Beijing College Students Panel Survey.” Chinese Journal of Sociology 3(1): 3–31. doi:10.1177/ 2057150x16688144
Wu, X., and D. J. Treiman. 2004. “The Household Registration System and Social Stratification in China: 1955–1996.” Demography 41(2): 363–84. doi:10.1353/ dem.2004.0010
Wu, Y. 2011. “Labor Market Segmentation, Job Mobility and the Two-Track Model of Chinese Urban Workersp Acquisition of Economic Status.” Social Science in China (Zhongguo shehui kexue) 1: 119–37. doi:10.1080/02529203.2011.598301 (in Chinese)
Yeung, W.-J. J. 2013. “Higher Education Expansion and Social Stratification in China.” Chinese Sociological Review 45(4): 54–80. doi:10.2753/csa2162- 0555450403
Zhang, H., and L. Wang. 2008. “Investigation into Poverty-Stricken Under-graduates’ Employment Vision in Ten Provinces of Western and Middle China.” Journal of Higher Education (Gaodeng jaoyu yanjiu) 29(3): 39–45 (in Chinese).
About the Author
Duoduo Xu ([email protected]) is a research assistant professor in the Social Science Division, and a junior research fellow at the Institute for Advanced Studies at Hong Kong University of Science & Technology. Her areas of interest include social stratification and mobility, sociology of education, and child and youth development. Her current research centers on educational inequalities in Chinese societies, including mainland China, Hong Kong, Macau, and Taiwan.
82 CHINESE SOCIOLOGICAL REVIEW