Embed Size (px)
Citation preview
From Subthreshold to Firing-Rate Resonance
Magnus J. E. Richardson,1,2 Nicolas Brunel,3 and Vincent Hakim1
1Laboratoire de Physique Statistique, Ecole Normale Supe´rieure, 75231 Paris Cedex 05, France;2Laboratory of ComputationalNeuroscience, Brain and Mind Institute, Ecole Polytechnique Fe´derale de Lausanne, CH 1015 Lausanne, Switzerland; and3Centre National dela Recherche Scientifique, Neurophysique et Physiologie duSyste`me Moteur, Universite´ ReneDescartes, 75270 Paris Cedex 06, France
Submitted 24 October 2002; accepted in final form 16 December 2002
Richardson, Magnus J. E., Nicolas Brunel, and Vincent Hakim.From subthreshold to firing-rate resonance. J Neurophysiol89: 2538–2554, 2003. First published December 27, 2002; 10.1152/jn.00955.2002. Many types of neurons exhibit subthreshold resonance. How-ever, little is known about whether this frequency preference influ-ences spike emission. Here, the link between subthreshold resonanceand firing rate is examined in the framework of conductance-basedmodels. A classification of the subthreshold properties of a generalclass of neurons is first provided. In particular, a class of neurons isidentified in which the input impedance exhibits a suppression at anonzero low frequency as well as a peak at higher frequency. Theanalysis is then extended to the effect of subthreshold resonance onthe dynamics of the firing rate. The considered input current com-prises a background noise term, mimicking the massive synapticbombardment in vivo. Of interest is the modulatory effect an addi-tional weak oscillating current has on the instantaneous firing rate.When the noise is weak and firing regular, the frequency mostpreferentially modulated is the firing rate itself. Conversely, when thenoise is strong and firing irregular, the modulation is strongest at thesubthreshold resonance frequency. These results are demonstrated fortwo specific conductance-based models and for a generalization of theintegrate-and-fire model that captures subthreshold resonance. Theysuggest that resonant neurons are able to communicate their frequencypreference to postsynaptic targets when the level of noise is compa-rable to that prevailing in vivo.
I N T R O D U C T I O N
Oscillations have long been observed in neuronal structures(Adrian and Matthews 1934) but their role, mechanisms, andinterplay with single neuron biophysical characteristics haveonly recently been submitted to detailed scrutiny. Experimentshave tested the response of neurons to oscillating currentinjection. Subthreshold resonance, in which the response of theinduced oscillating voltage peaks at a preferred input fre-quency, has been found in inferior olive neurons (De Zeeuw etal. 1998; Lampl and Yarom 1993, 1997; Llinas and Yarom1986), trigeminal root ganglion neurons (Puil et al. 1986),thalamic neurons (Hutcheon et al. 1994; Jahnsen and Karnup1994; Puil et al. 1994), cortical neurons (Dickson et al. 2000;Gutfreund et al. 1995; Hutcheon et al. 1996b; Llinas et al.1991), and both hippocampal CA1 pyramidal cells (Leung andYu 1998; Pike et al. 2000) and interneurons (Pike et al. 2000).Many of these structures are known to support oscillations invivo, suggesting an interplay between single-cell frequency
preference and oscillations at the network level. Most of therecorded neurons show a single peak at a finite frequency intheir voltage response. However, some interneurons of thehippocampus show a more complex response with a trough atlow frequency followed by a peak at higher frequencies (Pikeet al. 2000). Although a great deal of effort has been directedat understanding the input properties of resonant neurons,surprisingly little attention has been addressed to the effect ofsubthreshold resonance on the temporal properties of the firingrate. This is despite the common assumption that the presenceof resonant neurons might provide a stabilizing influence onoscillations at the level of the network.
It is known from Hodgkin and Huxley (1952) and manystudies since (see e.g., Gutfreund et al. 1995; Hutcheon et al.1996a, 1994; Koch 1984; Mauro et al. 1970; Rinzel andErmentrout 1989; White et al. 1995) that the resonance prop-erties of neurons can be related to their ionic channel charac-teristics through a mathematical linearization of the corre-sponding conductance-based description. Several scenarios in-volving voltage-gated ionic currents have been shown togenerate resonant behavior (for a review, see Hutcheon andYarom 2000). Reduced two-variable descriptions have provenuseful as a mathematical tool to study these and other neuronalproperties (Gutfreund et al. 1995; Hutcheon et al. 1996a;Rinzel and Ermentrout 1989; White et al. 1995).
In the first part of this paper, a systematic classification oftwo-variable models is provided. The analysis highlights thepossible types of subthreshold behavior associated with differ-ent neuronal characteristics. The results can be summarized ina graphical description. The change of membrane properties asthe neuron is depolarized toward threshold is represented bytrajectories crossing boundaries separating different types ofbehavior (e.g., passive from resonant). This description isillustrated with two conductance-based model neurons. Morecomplex types of resonance cannot be described by a two-variable model. For this reason, a three-variable model, whichexhibits a richer repertoire of behaviors, is also analyzed. Aparameter region is identified with a suppression as well as aresonance in the impedance curve, a feature recently observedexperimentally in hippocampal fast-spiking interneurons (Pikeet al. 2000).
In the second part of the paper, the circumstances are ex-amined in which a resonant neuron can communicate its sub-
Address for reprint requests: M.J.E. Richardson, Laboratory of Computa-tional Neuroscience, Brain and Mind Institute, EPFL, CH 1015, Lausanne,Switzerland (E-mail: [email protected]).
The costs of publication of this article were defrayed in part by the paymentof page charges. The article must therefore be hereby marked ‘‘advertisement’’in accordance with 18 U.S.C. Section 1734 solely to indicate this fact.
J Neurophysiol89: 2538–2554, 2003.First published December 27, 2002; 10.1152/jn.00955.2002.
2538 0022-3077/03 $5.00 Copyright © 2003 The American Physiological Society www.jn.org
threshold frequency preference through the dynamics of itsfiring rate. This property of resonant neurons manifests itself asa preferential amplification of input signals that are at theresonant frequency and requires an analysis of how the firingrate is modulated by an oscillatory current. To this end, thetwo-variable approach is extended to include spike emission,providing a generalized integrate-and-fire or GIF model. Themodel captures a wide range of subthreshold dynamics with asimplified firing and reset mechanism. The firing-rate dynam-ics of this model, as well as two specific conductance-basedmodels which exhibit a subthreshold resonance, are studied indetail. The crucial role that noise plays in shaping the responseis highlighted.
M E T H O D S
Glossary
v deviation of the membrane potential from the holdingpotential (mV).
C or CM membrane capacity (nF).g effective leak conductance (�S).w or w1 auxiliary variable characterizing the membrane
dynamics (mV).�1 time scale of the dynamics of the w variable (ms).g1 conductance measuring the membrane potential
variation resulting from a change of w (�S).� dimensionless parameter proportional to leak
conductance g.� dimensionless parameter proportional to conductance
g1.w2 second auxiliary variable (mV).g2 analogous to g1 for the second variable w2 (�S).Iapp total applied external current (nA).Isyn synaptic current (nA).geo and gio average excitatory and inhibitory total synaptic
conductances (�S).�e and �i magnitude of excitatory and inhibitory synaptic noise
(�S).�e and �i correlation timescales of the excitatory and inhibitory
synaptic noise (ms).IN magnitude of the fluctuations of synaptic current (nA).I0 constant (DC) current (nA).I1 magnitude of oscillatory current (nA).f frequency of injected current (Hz).�V strength of the synaptic noise as measured by the
resulting amplitude of membrane potentialfluctuations (mV).
Z(f ) cell impedance for an injected current of frequency f(M�).
fR resonant frequency corresponding to a maximum ofthe amplitude of Z(f ) (Hz).
f0 natural frequency of the membrane potential dampedoscillations (Hz).
Q strength of the resonance peak (dimensionless).r0 average spike rate (Hz).r1(f ) magnitude of oscillatory component in spike rate
induced by injected oscillatory current (Hz).�A(f )� signal gain (Hz/nA).�(f ) phase of oscillatory component in spike rate with
respect to oscillatory current (deg).v� threshold for spike emission for the GIF model
(defined in METHODS; mV)vr membrane potential reset after spike emission for the
GIF model (defined in METHODS; mV)
Linearization of conductance-based models
The starting point for the analysis in this paper is the conductance-based Hodgkin-Huxley formalism. The state of a neuron is describedby a potential difference V across a membrane with a capacitance CM,a set of trans-membrane currents Imem (comprising the leak andvarious active ionic currents), a synaptic current Isyn (to be describedin the following text) and an applied current Iapp
CM
dV
dt� �Imem Isyn Iapp (1)
The active ionic currents comprise both activation and inactivationvariables xk where k � 1, . . ., N counts over all the variables that obeyequations of the form
�k�V�dxk
dt� xk,��V� xk (2)
where both the relaxation times �k(V) and the steady-state valuesxk,�(V) are functions of the membrane voltage.
Below threshold for action potential generation, Eqs. 1 and 2 can belinearized around a holding voltage V* (see e.g., Koch 1999, chapter10, and refs therein). For the sake of simplicity, the notation X* willbe used to denote the quantity X evaluated at V � V*. Linearizationof the Eq. set 1 and 2 allows for a direct categorization of the rangeof behavior that a neuron exhibits in its response to small inputcurrents, for example, the response to an oscillating or square-pulsecurrent considered here. The linearized equations will also provide thebasis for a generalization of the IF model, to be described at the endof this section. The linear equations can be written in the followingform
CM
dv
dt� �gMv �
k�1
N
gKwK Isyn Iapp
�k
dwk
dt� v wk where k � 1, . . . , N (3)
with v � V � V* being the deviation of the voltage from itssteady-state value and gM � (�Imem/�V)* is the slope of the instan-taneous I-V curve. The time-dependent variables
wk � �xk x*k ���dxk,�
dV�*
for k � 1, . . . , N (4)
are proportional to the deviation of the activation or inactivationvariables xk from their steady-state values x*k � xk,� (V*) and areexpressed in units of millivolts. The time constants �k correspond tothose of the activation and inactivation variables evaluated at V* andthe parameters
gk � ��Imem
�xk�*�dxk,�
dV�*
(5)
written in units of conductance, measure the strength of the effect thatthe variable xk has on the voltage. Note that in the linear approxima-tion, the dynamical variables wk are no longer multiplied by a voltage-dependent term as they were in the original conductance-based de-scription.
Activation or inactivation variables can be classified according tothe sign of their corresponding parameter gk. Examples of variableswith gk � 0 are the activation variables of Na� and Ca2� currents andinactivation variables of K� currents. Examples of variables withgk 0 include inactivation variables of Na�, Ca2� currents, activa-tion variables of K� currents, and the activation variable of the Hcurrent. For gk 0, the corresponding variable opposes voltagechange (negative feedback), whereas gk � 0 indicates that the variable
2539FROM SUBTHRESHOLD TO FIRING-RATE RESONANCE
J Neurophysiol • VOL 89 • MAY 2003 • www.jn.org

amplifies voltage change (positive feedback). Previous modeling stud-ies (reviewed in Hutcheon and Yarom 2000) have shown that avariable with gk 0 can create a subthreshold resonance (a resonantvariable), whereas a variable with gk � 0 can amplify an existingresonance (an amplifying variable).
Conductance-based models generally comprise many active ioniccurrents and are therefore described by a large number of activation orinactivation variables. Despite the simplification of linearity, suchsystems of equations can still be hard to handle analytically. However,it is often possible to reduce the number of variables to two or three,while still accurately modeling the behavior near the holding voltage.This can be achieved by considering that very fast variables (such asthe activation variable of fast sodium channels) are instantaneous, bymerging together variables with similar time constants, and by notingthat very slow variables average over the voltage to provide a steadycurrent. The resulting equations have the same form as Eq. 3 but witheffective values C and g for the capacitance and leak respectively. Theeffective leak g can be zero or even negative, while the restingpotential remains stable. Examples of the linearization method aregiven in the APPENDIX for two conductance-based models together withthe further approximations leading to reductions in the number ofvariables to two or three.
TWO-VARIABLE SUBTHRESHOLD DYNAMICS. For the case of twovariables, the neuron is described by the two equations
Cdv
dt� �gv g1w Iapp�t�
�1
dw
dt� v w (6)
with four parameters, C, g, g1, and �1. However, expressing time inunits of �1, and dividing the voltage Eq. 6 by C makes it apparent thatthe model only depends on two dimensionless parameters � � g�1/Cand � � g1�1/C. The quantities � and � parameterize the behavior ofthe neuron near V* and can be considered as representing a point ona plane. � represents an effective leak, whereas � represents aneffective coupling between the two variables. � measures the influ-ence of the w variable on the membrane potential.
THREE-VARIABLE SUBTHRESHOLD DYNAMICS. The analysis is alsoextended to include a third variable. The subthreshold dynamics isthen described by
Cdv
dt� �gv g1w1 g2w2 Iapp�t�
�1
dw1
dt� v w1
�2
dw2
dt� v w2 (7)
where in this paper a restriction is made to g 0. Four independentand dimensionless parameters g1/g, g2/g, �1g/C, and �2g/C are nowneeded to fully describe the model.
Models of spiking neurons
One of the major goals of the present paper is to investigate theeffect of subthreshold resonance on the dynamics of spike emission.To this end, a simple spiking neuron model that exhibits subthresholdresonance, the generalized IF neuron, is introduced. To demonstratethat the general results derived for this simplified model carry over tomore realistic neurons, two representative conductance-based modelsthat are known from the literature to produce subthreshold resonanceare also examined (Models I and II). In an attempt to cover the range
of possible behaviors, the models are chosen to have different reso-nance mechanisms (hyperpolarization or depolarization activated cur-rents) and also different resonant frequencies (near 10 and 50 Hz,respectively).
GENERALIZED IF NEURON. The IF model neuron provides a pow-erful tool for the understanding of neurons with passive membraneproperties and is the standard component of large numerical simula-tions of recurrent networks. However, its passive subthreshold behav-ior cannot capture the phenomenon of resonance. An extension of theIF model, which captures the subthreshold behavior of the two-variable model with a simple spike mechanism, is therefore the firstspiking neuron model to be introduced here. The generalized IF (GIF)neuron is obtained by supplementing Eq. 3 with a threshold for spikegeneration at v � v�, followed by a reset of the membrane voltage atv � vr (the auxiliary variables wk considered here have a slowerdynamics than the spike, and therefore it is not appropriate to resetthem also). In the case gk � 0 for all k, the voltage equation reducesto the IF model. With two variables, this model is similar to a modelrecently proposed by Izhikevich (2001). The two-variable GIF modelsubject to an applied current is described by Eq. 6 where the param-eters C, g, g1, and �1 are kept fixed for the whole of the subthresholdregime. Isyn is the modeled synaptic current and Iapp(t) represents theapplied current, to be described in the following text. In this paper, thethreshold is chosen to be at �50 mV, the rest (in absence of any inputcurrents) at �70 mV, and the reset at �56 mV. Because v measuresthe deviation from rest v � V � Vrest, this corresponds to v� � 20 mVand vr � 14 mV.
Conductance-based neurons
MODEL I. A NEURON WITH INA, IK, AND IH CURRENTS. The firstmodel comprises a hyperpolarization-activated mixed cation currentIH and the Hodgkin-Huxley spike-generating currents. The form of theIH current is taken from Spain et al. (1987) and comprises both fast fand slow s activation variables. The time scales of the two compo-nents are �f � 38 ms and �s � 319 ms and, as in Spain et al. (1987),taken to be voltage independent. The fast component has the greatercontribution and determines the resonant frequency fR, which is near10 Hz at physiological temperatures. A detailed model description canbe found in the APPENDIX.
MODEL II. A NEURON WITH INA, IK, INAP, AND IKS CURRENTS. Incontrast to the IH model defined in the preceding section, the secondmodel neuron features two depolarization-activated currents: the slowpotassium current IKs and the persistent sodium current INaP. In thelanguage of Hutcheon and Yarom (2000), the IKs current generates theresonance and the INaP current amplifies its effect. A noninactivatingform (Gutfreund et al. 1995) is used for the IKs with an activation timescale of �q � 6 ms (Wang 1993), giving a subthreshold resonance thatis strongest at resonant frequencies 35–55 Hz. Neurons with aresonance frequency or subthreshold oscillations at 40 Hz are wide-spread (Pike et al. 2000; Puil et al. 1986), and the underlying mech-anism is thought to sometimes involve the IKs and INaP currents(Llinas et al. 1991). Again, full details of this model are given in theAPPENDIX.
Modeling the noisy synaptic input
The massive synaptic bombardment received by neurons in vivorepresents a strong source of noise. Destexhe et al. (2001) providedevidence that an appropriate model of such a synaptic input is givenby a fluctuating conductance with short correlation times related to theshapes of typical excitatory and inhibitory postsynaptic potentials.Hence, for the analysis of the firing rates of the two conductance-based models I and II, the noise is modeled as in Destexhe et al.(2001) by the equations
2540 M.J.E. RICHARDSON, N. BRUNEL, AND V. HAKIM
J Neurophysiol • VOL 89 • MAY 2003 • www.jn.org

Isyn � ge�t��V Ee� gi�t��V Ei�
�e
dge
dt� geo ge �e�2�e �e�t�
�i
dgi
dt� gio gi �i�2�i �i�t� (8)
where �e, �i are delta-correlated Gaussian white-noise terms. Repre-sentative values of the correlation times �e � 3 ms and �i � 10 ms areused here. The reversal potentials are taken to be Ee � 0 mV and Ei ��75 mV. The average conductances geo, gio and the noise amplitudes�e and �i can be varied to explore a range of input conditions.
MODELING NOISE FOR THE GIF NEURON. To have a simple modelwith a membrane-potential-independent subthreshold resonance, thesynaptic inputs are modeled by a current comprising a direct drive I0
and a white-noise source
Isyn � I0 IN��N ��t� (9)
where �(t) is the delta-correlated Gaussian white-noise term with unitvariance and IN is the measure of the noise strength in nanoAmpere.The factor �N is introduced to preserve units, and throughout thispaper, it is arbitrarily fixed at �N � 1 ms without affecting thegenerality of the results. The noise strength IN can be related to a moreintuitive measure: the SD of the membrane voltage (in the absence ofthe spiking mechanism). In the two-variable GIF model, the SD of thevoltage �V takes the form
�V � IN� �C g�1 g1�1��N
2C�g g1��g�1 C�(10)
Response of the neuron to an oscillatory driveSUBTHRESHOLD RESPONSE. To characterize the subthreshold re-sponse, an oscillating current of frequency f is used. The appliedcurrent and resulting voltage response to this current are given by
Iapp � I0 I1 sin �2 f t�
V � V* V1�f � sin �2 f t ��f �� (11)
where both the phase difference �(f ) and the magnitude of the im-pedance
�Z�f �� � V1�f �/I1 (12)
are functions of the driving frequency f. The existence of a peak in the�Z(f )� versus frequency curve provides the definition of subthresholdresonance. The impedance Z(f ) can also be measured experimentallyusing a ZAP current (Puil et al. 1986).
FIRING-RATE RESPONSE. In the context of examining the interac-tions between membrane frequency preference (resonance) and net-work oscillations, it is of interest to examine how the instantaneousfiring rate of a neuron responds to a sine-wave modulation in thebackground of a noisy synaptic current
Iapp � I1 sin �2 f t�
A regime is considered where the noisy synaptic drive is suffi-ciently strong to cause the neuron to fire stochastically, at an averagerate r0. The weak sinusoidal component then causes a weak modula-tion of the firing rate that will be apparent over many trials, see Fig.1. This quantity can also be thought of as the firing rate, averaged overa population of neurons each individually receiving a noisy drive butresponding collectively to the same weak oscillatory componentpresent in the firing rates of presynaptic neurons. The form of thispopulation, or trial-averaged instantaneous rate is
r � r0 r1�f � sin �2 f t ��f �� (13)
The analogy with the subthreshold voltage form in Eq. 11 is clear.Similarly, the response r1(f ) is proportional to the strength of themodulatory current, leading to the introduction of the following quan-tity that measures the ability of a neuron to amplify a particularfrequency
�A�f �� � r1�f �/I1 (14)
called the signal gain, see for example (Gerstner 2000). In the sameway that a peak in the impedance �Z(f )� quantifies subthreshold reso-nance, the existence and position of the peak in the quantity �A(f )� willbe the corresponding firing-rate measure of resonance.
Experimental studies have used either large amplitude sine-wavecurrents (Hutcheon et al. 1996b) or small-amplitude sine-wavecurrents when the voltage is very close to threshold (Pike et al.2000). In both of these studies, a strong effect was measured in thetime-averaged rate itself and not in its modulation. The situationconsidered here is of weak oscillatory input leading to a linearresponse of the firing rate (higher-order harmonics are negligiblysmall). In this case, the signal gain is a more sensitive measure ofthe frequency dependence of spike emission than the time-aver-aged firing rate.
ANALYTICAL METHODS. The firing-rate response of the GIF neuroncan be computed analytically in the limit of large �1. Methods aresketched in the APPENDIX (see also Brunel et al. 2003).
NUMERICAL METHODS. The numerical analysis of the firing-rateresponse of the GIF and conductance-based models was performedusing a stochastic second-order Runge-Kutta algorithm (Honeycutt1992) with a time step of 10 and 20 �s, respectively. The amplitudeof the modulatory current I1 used in numerical measurements of thesignal gain was varied until it was sufficiently small such that higherorder nonlinear effects were negligible. The length of simulation timeneeded to get accurate measurements for each frequency point variedbetween 1,000 and 50,000 s, depending on the firing rate and theparticular level of noise chosen in the input current. To estimate thefiring rate modulation at a given frequency, the instantaneous firingrate is computed in bins of 1 ms. The resulting histogram, sketched inFig. 1, is then fitted by a sinusoid with a frequency equal to that of theoscillatory input current.
FIG. 1. The response of the instantaneous firing rate to a weak sinusoidalinput. The oscillatory current is applied on top of a noisy input that itself elicitsfiring at an average rate r0 (see top). By averaging over many realizations(shown in the raster plot), the modulation of the instantaneous firing rate canbe computed, and the characteristics (amplitude and phase) of the inducedsinusoidal component of the firing rate obtained (bottom). A bin width of 8 mswas used for illustrative purposes in this figure.
2541FROM SUBTHRESHOLD TO FIRING-RATE RESONANCE
J Neurophysiol • VOL 89 • MAY 2003 • www.jn.org
R E S U L T S
Subthreshold properties of the membrane potential
The different classes of behavior in the subthreshold regimeare examined first. Two- and three-variable models, with pa-rameters directly related to measurable membrane properties,are used to classify the different types of response to standardtest currents. It is shown that the types of behavior that theneuron can exhibit at different holding voltages can be conve-niently presented in graphical form for both the two- andthree-variable descriptions. The results are illustrated by twoconductance-based models of spiking resonant neurons.
Subthreshold behavior of the two-variable model
The subthreshold behavior of the two-variable model is firstclassified with respect to stability and the response to standardtest currents. Because the two-variable model is related to anunderlying conductance-based description near a holding volt-age V*, it is parameterized by an effective leak � � g�1/C andan effective coupling between the two variables � � g1�1/C.The parameters � and � can be used to represent the behaviorof the neuron by a string of points on a plane, as the neuron isdepolarized or hyperpolarized by an injected current. Theborders separating different types of behavior are obtainedthrough the analysis of Eq. 6, presented in detail in the APPEN-DIX.
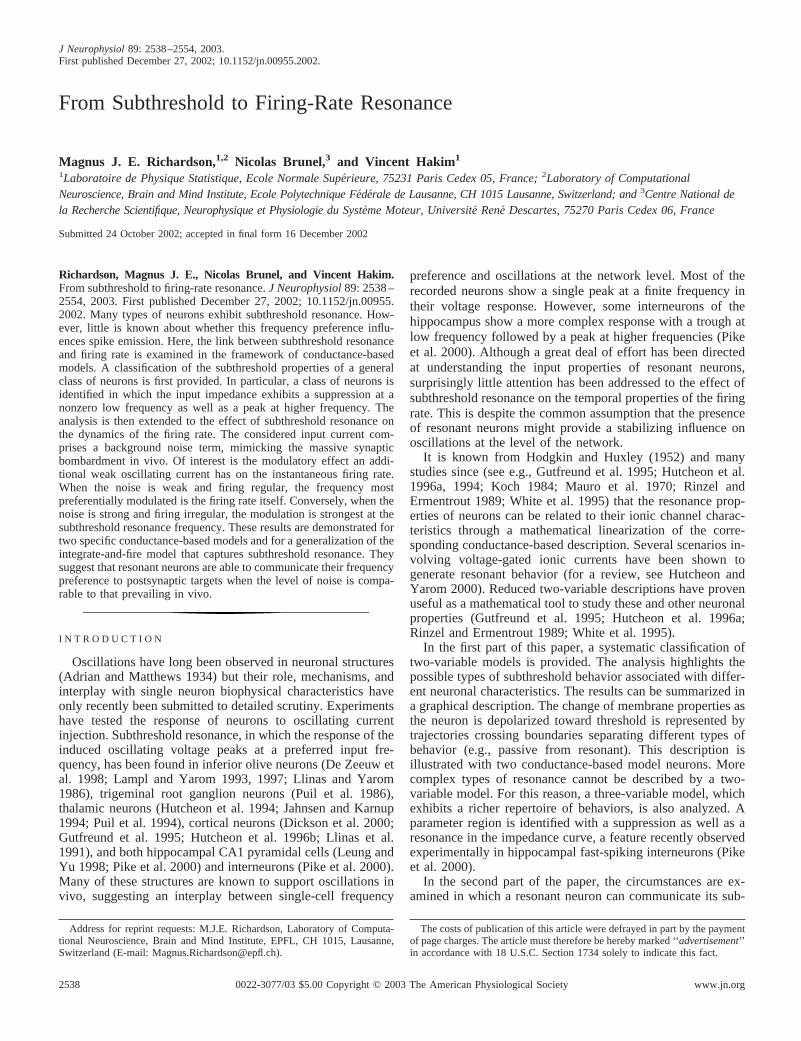
STABILITY. The classification of the subthreshold regimestarts with the determination of the parameter region where theneuron remains stable at the holding potential (without e.g.,subthreshold oscillations or spike emission). Analysis of thestability of the membrane potential of the two-variable modeldetermines an unstable region shown in brown in Fig. 2. Theregion is bounded on one side by the vertical dashed line thatsignals the onset of spontaneous oscillations. On the other side,it is bounded by a diagonal line that corresponds to the totalinput conductance becoming zero, which can lead to spikeemission. The rest of the analysis will focus on the stableregion to the right of these two lines.
RESPONSE TO OSCILLATING CURRENT. The first experimentalmeasure of subthreshold properties considered here is the volt-age response to an oscillating input current. The magnitude andphase of this response measure the impedance of the neuronalmembrane. A subthreshold resonance, signaled by the exis-tence of peak in �Z(f )� at some nonzero frequency fR, occurs inthe whole of the green region of Fig. 2A (Hutcheon et al.1996a). The line that bounds the region of the phase diagram inwhich resonance occurs starts at the point � � �1, � � 1 (theintersection between the two instability lines), and for large �,it tends toward the axis � � 0. Thus in most of the stableregion with � 0 resonant behavior occurs. Positivity of �implies that the associated activation or inactivation variable isa resonant variable (Hutcheon and Yarom 2000).
PHASE RESPONSE TO OSCILLATING CURRENT. Another quantityof interest is the existence of a zero phase-lag in the membranepotential response at nonzero frequency, seen in cortical neu-rons (Gutfreund et al. 1995). Analysis of the phase difference�(f ) between the oscillating current and the voltage response,defined in Eq. 11, shows that a zero phase-lag exists for � 1. This quantity also coincides with the existence of a maxi-
mum in the phase and a phase advance from the drivingcurrent. A second line � � 0 signifies the existence of aminimum in the phase, implying that at some frequencies thephase lag is greater than 90°. Taken together, these criteriadivide the phase diagram into four regions, plotted in Fig. 2B.It should be noted that none of the lines separating the differentqualitative responses of the phase correspond exactly to thepresence of a resonance in the amplitude of the impedance.
RESPONSE TO A SQUARE-PULSE CURRENT. The application of asmall step change in applied current provides a different as-sessment of subthreshold membrane properties. The responseof the neuron to such a current can be obtained explicitly (seeAPPENDIX for details). At the level of the two-variable descrip-tion the neuron can exhibit three different types of response tothe square-pulse current shown, the voltage-time profiles ofwhich are shown in the insets of Fig. 2C:
A B
DC
FIG. 2. The subthreshold behavior of two-variable models. Brown marksthe unstable region. Insets: the qualitative response to the relevant test currentin regions in the space of parameters � � g�1/C (the effective leak) and � �g1�1/C (the effective coupling between the two variables). A: oscillatingcurrent injection, amplitude of the impedance. B: phase of the impedance. C:response to a square-pulse current. D: trajectories of the two conductance-based model neurons in parameter space as their holding potential is increased.Model I (full line): g1 � gf (see text and APPENDIX) parameterizes the effect ofthe fast component of the current IH on the voltage. The trajectory covers therange from �100 to �56.5 mV at which point the resting state is unstable andspikes are emitted. Model II (dotted line): g1 � gq (see text and APPENDIX)parameterizes the effect of the slow-potassium current IKs on the voltage. Thetrajectory covers the range �100 to �57 mV at which point spontaneousoscillations occur. In both cases, the black points are at 5-mV intervals with thelast point plotted before destabilization occurring at �60 mV, and the arrowsrepresent the direction of depolarizing membrane potential.
2542 M.J.E. RICHARDSON, N. BRUNEL, AND V. HAKIM
J Neurophysiol • VOL 89 • MAY 2003 • www.jn.org
Damped oscillations. The neuron exhibits damped oscilla-tions at frequency f0 as it approaches its new holding mem-brane potential, when � is sufficiently large compared with �(the red region shown in Fig. 2C).
Overshoot or sag. When � 1 and � 0, but below the redregion, the voltage time course has a single overshoot (or sagif the current pulse is hyperpolarizing). This corresponds to theyellow region of Fig. 2C.
Passive decay. In all other areas of parameter space (thewhite region), the voltage changes monotonically from itsinitial to final resting voltage.
It is clear from Fig. 2, A and C, that subthreshold resonanceand damped oscillations are not equivalent. This fact, whichwas implicit in experimental measures of the resonant andnatural frequencies (Puil et al. 1986), is often overlooked. Anexamination of Fig. 2 shows that neurons can have dampedoscillations but no resonance and vice versa. In fact none of theother measurements (the phase or response to a square-pulsecurrent) of the neuron examined here give complete informa-tion about the existence of a resonance. However, close to theinstability line, where the neuron is almost spontaneouslyoscillating, both resonance and damped oscillations are guar-anteed to occur together.
Subthreshold behavior of the two conductance-based models
The diagram introduced in Fig. 2 allows a visualization ofthe trajectory of the neuron through the space of parameters�(V*) and �(V*) as the holding voltage V* is varied. This isshown for the two model neurons defined in METHODS anddetailed in the APPENDIX. As the trajectory crosses differentboundaries, so the neuronal response to input current willchange qualitatively. The trajectories of the two model neu-rons, as parameterized by the changing effective leak g andcoupling variable g1 � gf or g1 � gq, are plotted in Fig. 2D.MODEL I. A NEURON WITH INA, IK, AND IH CURRENTS. Theresonance curve of the neuron is plotted in Fig. 3A for a
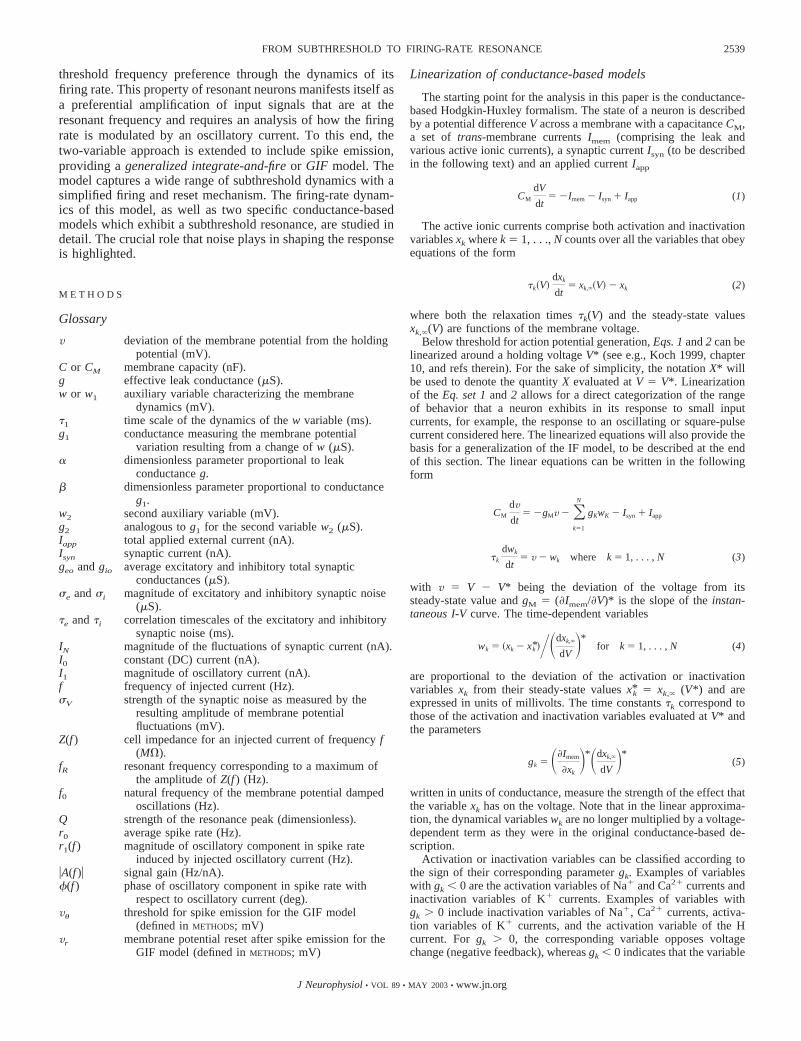
holding potential of �65 mV. The spike-generating currentsare much faster than other time scales in the system and can betaken as instantaneous, reducing the full model to a three-variable description: the membrane potential and the two ac-tivation variables of the H current (see APPENDIX for details).The impedance curve of the reduced three-variable descriptionis also shown in Fig. 3A. Comparison with the full modelshows that this reduction is extremely accurate. A furtherapproximation, that the slow variable of the IH current averagesto a steady value, provides the two-variable description. Thebehavior of the neuron is therefore classified by its leak con-ductance g and the effect of the IH fast variable f, through thetwo dimensionless parameters � � g�f /C and � � gf�f /C. Thistwo-variable description provides an excellent approximationof the original model for driving frequencies greater than 2 Hzas shown in Fig. 3A. At frequencies greater than 2 Hz, thedynamics of the slow variable of the H current is too slow tofollow the voltage changes and therefore to affect the reso-nance curve.
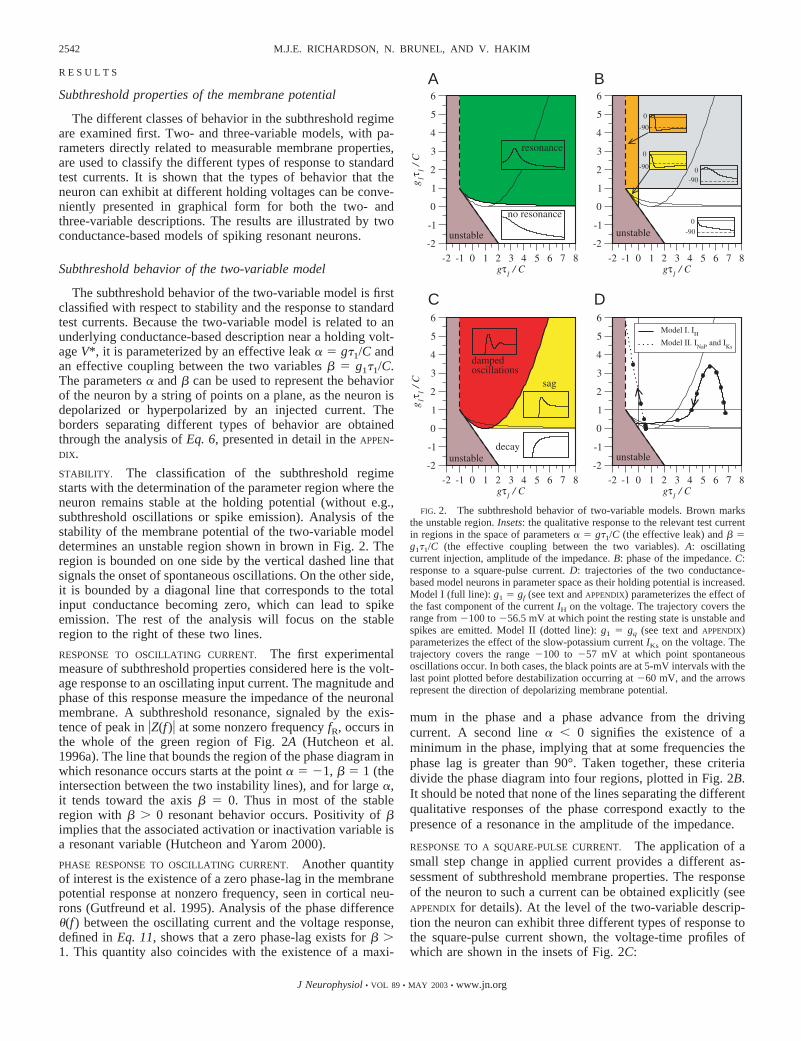
The effective leak � and effective coupling between voltageand H current � are calculated for a subthreshold voltage rangeof �100 to �56.5 mV using the linearization procedure. Thecorresponding trajectory is shown in Fig. 2D, and the reso-nance and damped oscillation frequencies are shown in Fig.4A. As can be seen, model I exhibits a strong resonance athyperpolarized values in the absence of damped oscillations(except in a narrow range between �58.5 and �56.6 mV nearthe firing threshold). This illustrates again that resonance anddamped oscillations are distinct phenomena: oscillating andstep currents probe different membrane properties. The Qvalue, defined as �Z(fR)�/�Z(0)� (Hutcheon et al. 1996b), gives ameasure of the strength of the resonance. As can be seen in Fig.4A, the IH current provides the strongest resonance of 10 Hzat a holding voltage of �80 mV. The trajectory also shows thatthe neuron responds with a sag/rebound to a step-current pulse:a well-known characteristic of the IH current (Dickson et al.
FIG. 3. The frequency-dependent input impedance for the two model neurons held at �65 mV, showing the level ofapproximation between the full (F and E), three-variable (—) and two-variable (- - -) descriptions. A: model I. The three-variablemodel is obtained by taking the spike-generating currents to be instantaneous. The full and three-variable models agree closely forall frequencies plotted. The two-variable approximation is obtained by noting that the slow variable of the IH current averages toa steady value for frequencies greater than 2 Hz. B: model II. The full noninactivating IKs model (F) and its two-variableapproximation, obtained by taking the spike-generating currents to be fast. If an inactivation variable is included in the definitionof the IKs current, an impedance profile (E) with a trough at 3 Hz as well as a resonance at 30 Hz is seen (see Three-variable modeland the APPENDIX for details). The corresponding three-variable model obtained by taking the spike-generating currents to be fast,but retaining the activation and inactivation variables of the IKs current, provides a good approximation of the full model.
2543FROM SUBTHRESHOLD TO FIRING-RATE RESONANCE
J Neurophysiol • VOL 89 • MAY 2003 • www.jn.org
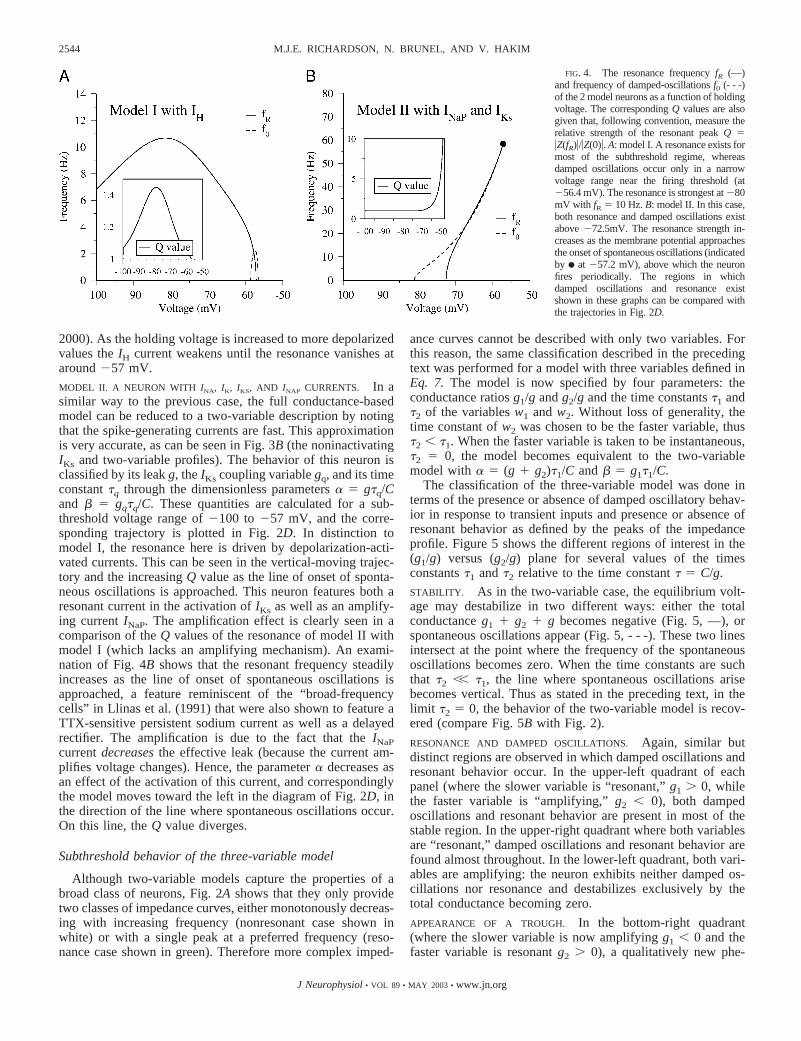
2000). As the holding voltage is increased to more depolarizedvalues the IH current weakens until the resonance vanishes ataround �57 mV.
MODEL II. A NEURON WITH INA, IK, IKS, AND INAP CURRENTS. In asimilar way to the previous case, the full conductance-basedmodel can be reduced to a two-variable description by notingthat the spike-generating currents are fast. This approximationis very accurate, as can be seen in Fig. 3B (the noninactivatingIKs and two-variable profiles). The behavior of this neuron isclassified by its leak g, the IKs coupling variable gq, and its timeconstant �q through the dimensionless parameters � � g�q/Cand � � gq�q/C. These quantities are calculated for a sub-threshold voltage range of �100 to �57 mV, and the corre-sponding trajectory is plotted in Fig. 2D. In distinction tomodel I, the resonance here is driven by depolarization-acti-vated currents. This can be seen in the vertical-moving trajec-tory and the increasing Q value as the line of onset of sponta-neous oscillations is approached. This neuron features both aresonant current in the activation of IKs as well as an amplify-ing current INaP. The amplification effect is clearly seen in acomparison of the Q values of the resonance of model II withmodel I (which lacks an amplifying mechanism). An exami-nation of Fig. 4B shows that the resonant frequency steadilyincreases as the line of onset of spontaneous oscillations isapproached, a feature reminiscent of the “broad-frequencycells” in Llinas et al. (1991) that were also shown to feature aTTX-sensitive persistent sodium current as well as a delayedrectifier. The amplification is due to the fact that the INaPcurrent decreases the effective leak (because the current am-plifies voltage changes). Hence, the parameter � decreases asan effect of the activation of this current, and correspondinglythe model moves toward the left in the diagram of Fig. 2D, inthe direction of the line where spontaneous oscillations occur.On this line, the Q value diverges.
Subthreshold behavior of the three-variable model
Although two-variable models capture the properties of abroad class of neurons, Fig. 2A shows that they only providetwo classes of impedance curves, either monotonously decreas-ing with increasing frequency (nonresonant case shown inwhite) or with a single peak at a preferred frequency (reso-nance case shown in green). Therefore more complex imped-
ance curves cannot be described with only two variables. Forthis reason, the same classification described in the precedingtext was performed for a model with three variables defined inEq. 7. The model is now specified by four parameters: theconductance ratios g1/g and g2/g and the time constants �1 and�2 of the variables w1 and w2. Without loss of generality, thetime constant of w2 was chosen to be the faster variable, thus�2 � �1. When the faster variable is taken to be instantaneous,�2 � 0, the model becomes equivalent to the two-variablemodel with � � (g � g2)�1/C and � � g1�1/C.
The classification of the three-variable model was done interms of the presence or absence of damped oscillatory behav-ior in response to transient inputs and presence or absence ofresonant behavior as defined by the peaks of the impedanceprofile. Figure 5 shows the different regions of interest in the(g1/g) versus (g2/g) plane for several values of the timesconstants �1 and �2 relative to the time constant � � C/g.
STABILITY. As in the two-variable case, the equilibrium volt-age may destabilize in two different ways: either the totalconductance g1 � g2 � g becomes negative (Fig. 5, —), orspontaneous oscillations appear (Fig. 5, - - -). These two linesintersect at the point where the frequency of the spontaneousoscillations becomes zero. When the time constants are suchthat �2 �� �1, the line where spontaneous oscillations arisebecomes vertical. Thus as stated in the preceding text, in thelimit �2 � 0, the behavior of the two-variable model is recov-ered (compare Fig. 5B with Fig. 2).
RESONANCE AND DAMPED OSCILLATIONS. Again, similar butdistinct regions are observed in which damped oscillations andresonant behavior occur. In the upper-left quadrant of eachpanel (where the slower variable is “resonant,” g1 0, whilethe faster variable is “amplifying,” g2 � 0), both dampedoscillations and resonant behavior are present in most of thestable region. In the upper-right quadrant where both variablesare “resonant,” damped oscillations and resonant behavior arefound almost throughout. In the lower-left quadrant, both vari-ables are amplifying: the neuron exhibits neither damped os-cillations nor resonance and destabilizes exclusively by thetotal conductance becoming zero.
APPEARANCE OF A TROUGH. In the bottom-right quadrant(where the slower variable is now amplifying g1 � 0 and thefaster variable is resonant g2 0), a qualitatively new phe-
FIG. 4. The resonance frequency fR (—)and frequency of damped-oscillations f0 (- - -)of the 2 model neurons as a function of holdingvoltage. The corresponding Q values are alsogiven that, following convention, measure therelative strength of the resonant peak Q ��Z(fR)�/�Z(0)�. A: model I. A resonance exists formost of the subthreshold regime, whereasdamped oscillations occur only in a narrowvoltage range near the firing threshold (at�56.4 mV). The resonance is strongest at �80mV with fR � 10 Hz. B: model II. In this case,both resonance and damped oscillations existabove �72.5mV. The resonance strength in-creases as the membrane potential approachesthe onset of spontaneous oscillations (indicatedby F at �57.2 mV), above which the neuronfires periodically. The regions in whichdamped oscillations and resonance existshown in these graphs can be compared withthe trajectories in Fig. 2D.
2544 M.J.E. RICHARDSON, N. BRUNEL, AND V. HAKIM
J Neurophysiol • VOL 89 • MAY 2003 • www.jn.org

nomenon is observed, depending on the values of the timeconstants. When the two variables �1 and �2 are slower than thetime constant � � C/g, the amplitude of the impedance has alocal minimum or trough at a finite frequency (indicating asuppression of the membrane response at that frequency) fol-lowed by a resonant peak at higher frequency. One example ofsuch subthreshold dynamics is a neuron with an inactivatingpotassium current with a relatively large activation time con-stant �2 and a much larger inactivation time constant �1 withoverlapping steady-state activation and inactivation functions(a window current). In fact, a model of the IKs current that alsoincludes an inactivation variable (see APPENDIX for details)gives exactly this effect. The frequency-impedance curve forsuch a neuron is plotted in Fig. 3B and shows a close similarityto the experimentally measured impedance curve of the fast-spiking interneurons measured in Pike et al. (2000). A two- andthree-variable reduction of this full conductance-based modelare also plotted for comparison. Another possibility would beto have the two variables implemented in two active persistentcurrents: a potassium current with activation time constant �2and a sodium or a calcium current with slower activation timeconstant �1.
As expected, increasing the complexity of the model interms of the number of descriptive variables also increases therange of neuronal behavior that can be modeled. In summary,
a one-variable model (like the subthreshold dynamics of theleaky IF neuron) can have only a monotonously decayingimpedance; a two-variable model can have either a monoto-nously decaying impedance, or an impedance with a resonantpeak, whereas a three-variable model can describe the twoabove-mentioned behaviors, and in addition, an impedancewith a trough at low frequency followed by a peak at higherfrequency.
Firing-rate resonance
In this section, the effect of the subthreshold resonance onthe dynamics of the firing rate is investigated. The aim of theanalysis is to determine when a small oscillatory component inthe synaptic inputs of a given neuron will be amplified in itsoutput and how this depends on the subthreshold properties ofthe considered neuron.
The current used to model the synaptic bombardment such aneuron would experience in vivo comprises a noisy hyperpo-larizing or depolarizing drive as well as a weak sinusoidalcomponent of frequency f. The signal gain A(f ) defined in Eq.14 and illustrated in Fig. 1 measures the strength of the tem-poral modulation of the instantaneous firing rate induced by theoscillating current. It is the firing-rate analog of the impedanceZ(f ), and it is the existence of a peak in the signal gain thatcategorizes the amplification of frequencies in the outgoingspike train of resonant neurons. As will be shown, the noiseinherent in biological networks is an important factor in deter-mining the frequency that is maximally amplified.
The range of behavior is first examined by the use of a GIFmodel neuron. These results are then illustrated by two con-ductance-based models with spike generating currents and alsoan IH current or INaP and IKs currents.
Firing-rate resonance in the GIF model neuron
In the previous section, the subthreshold behavior of ageneral two-variable model was analyzed in detail. As de-scribed in METHODS, a simple spike mechanism (threshold andreset) can be added to the two-variable description to producea generalization of the IF neuron. This provides the simplestmathematical description of a spiking neuron with resonantsubthreshold dynamics and allows a direct link to be madebetween the subthreshold characteristics and the statisticalproperties of the outgoing spike train. In spite of its simplicity,the GIF model provides a good approximation to more com-plete descriptions of neurons as will be seen in the next section.
The model examined here is parameterized by C � 0.5 nF,g � 0.025 �S, g1 � 0.025 �S, and �1 � 100 ms, giving asubthreshold resonance frequency fR near 5 Hz. The signal gainA(f ) was examined as a function of frequency for differentrespective strengths of the constant I0 and noisy IN componentsof the injected current, defined in Eq. 9. It should be noted thatthe sinusoidal component I1 is always taken to be weak in thepresent work.
The fact that the neuron is induced to fire at a frequency r0by the applied current implies that there are now two distinctand independent frequency scales: the subthreshold resonantfrequency fR, controlled by the subthreshold dynamics of themembrane potential, and the background firing frequency r0,
FIG. 5. Phase diagram of the three-variable model in the plane g1/g, g2/g,for different values of the time constants �1 and �2 relative to � � C/g (markedabove each panel). Brown, unstable region; green, regions where resonanceoccur; dark green, resonance with a trough at a lower frequency; red lines, theboundaries of the regions in which damped oscillations occur in response to acurrent step. See text for more details.
2545FROM SUBTHRESHOLD TO FIRING-RATE RESONANCE
J Neurophysiol • VOL 89 • MAY 2003 • www.jn.org
which is controlled by the characteristics of the externallyapplied noisy current. It is useful to distinguish situationsdepending on whether r0 is lower or greater than fR.
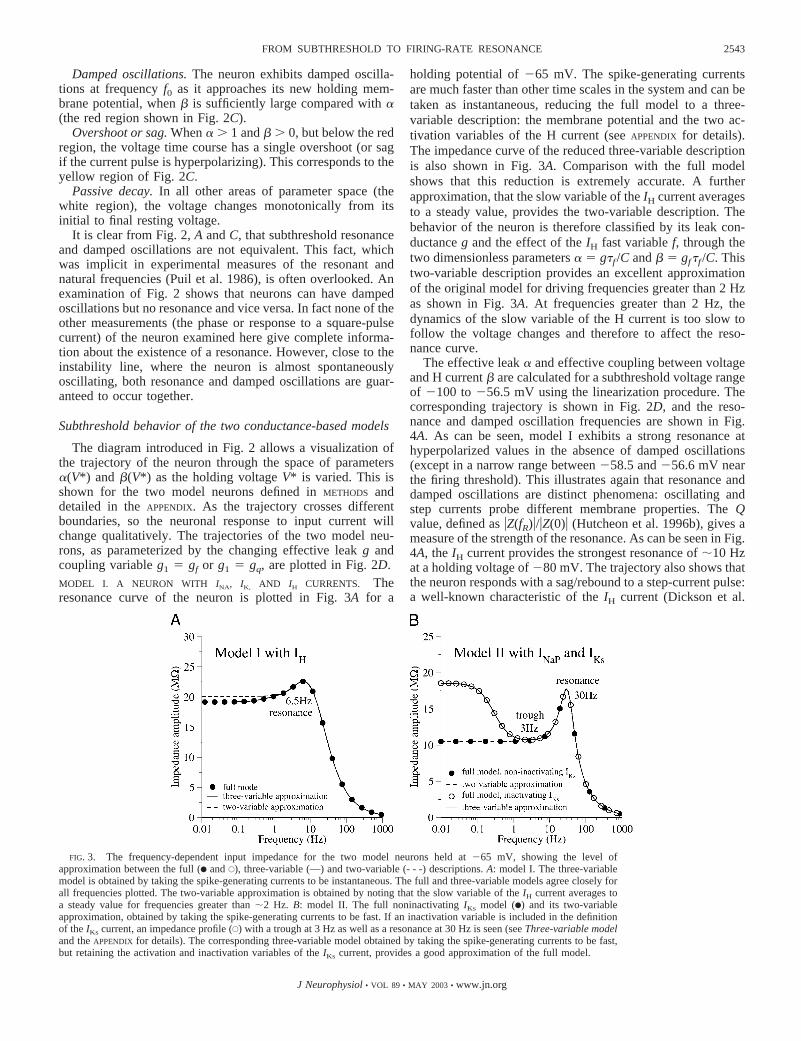
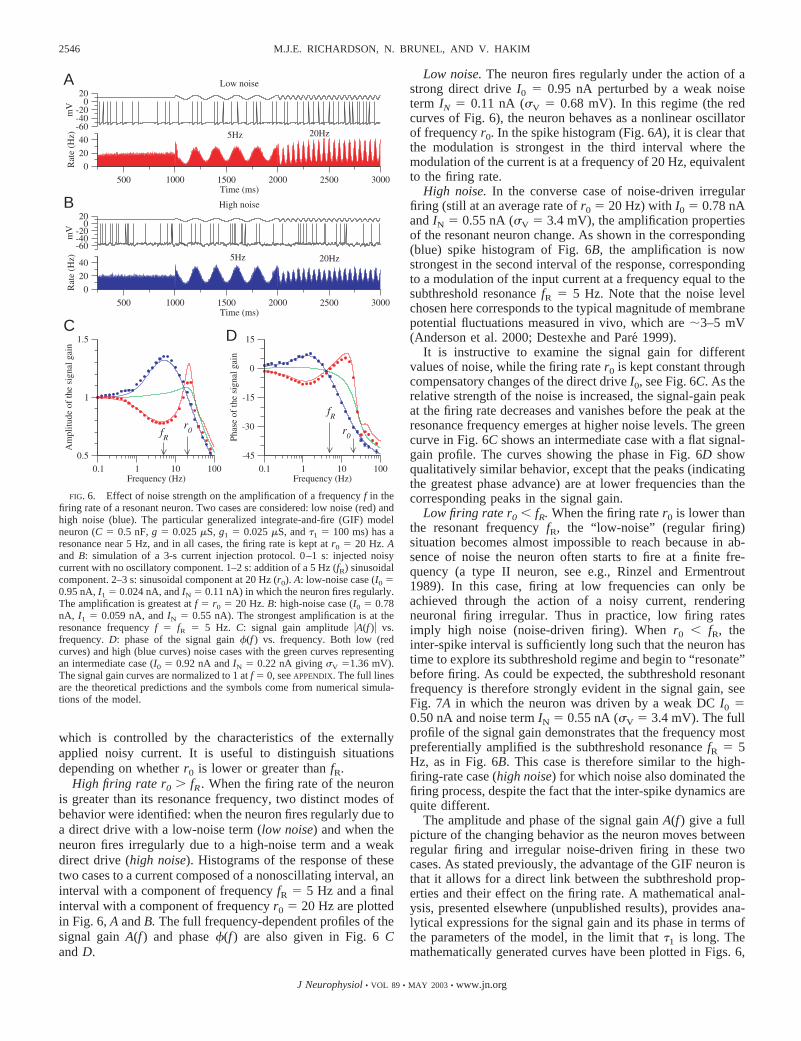
High firing rate r0 fR . When the firing rate of the neuronis greater than its resonance frequency, two distinct modes ofbehavior were identified: when the neuron fires regularly due toa direct drive with a low-noise term (low noise) and when theneuron fires irregularly due to a high-noise term and a weakdirect drive (high noise). Histograms of the response of thesetwo cases to a current composed of a nonoscillating interval, aninterval with a component of frequency fR � 5 Hz and a finalinterval with a component of frequency r0 � 20 Hz are plottedin Fig. 6, A and B. The full frequency-dependent profiles of thesignal gain A(f ) and phase �(f ) are also given in Fig. 6 Cand D.
Low noise. The neuron fires regularly under the action of astrong direct drive I0 � 0.95 nA perturbed by a weak noiseterm IN � 0.11 nA (�V � 0.68 mV). In this regime (the redcurves of Fig. 6), the neuron behaves as a nonlinear oscillatorof frequency r0. In the spike histogram (Fig. 6A), it is clear thatthe modulation is strongest in the third interval where themodulation of the current is at a frequency of 20 Hz, equivalentto the firing rate.
High noise. In the converse case of noise-driven irregularfiring (still at an average rate of r0 � 20 Hz) with I0 � 0.78 nAand IN � 0.55 nA (�V � 3.4 mV), the amplification propertiesof the resonant neuron change. As shown in the corresponding(blue) spike histogram of Fig. 6B, the amplification is nowstrongest in the second interval of the response, correspondingto a modulation of the input current at a frequency equal to thesubthreshold resonance fR � 5 Hz. Note that the noise levelchosen here corresponds to the typical magnitude of membranepotential fluctuations measured in vivo, which are 3–5 mV(Anderson et al. 2000; Destexhe and Pare 1999).
It is instructive to examine the signal gain for differentvalues of noise, while the firing rate r0 is kept constant throughcompensatory changes of the direct drive I0, see Fig. 6C. As therelative strength of the noise is increased, the signal-gain peakat the firing rate decreases and vanishes before the peak at theresonance frequency emerges at higher noise levels. The greencurve in Fig. 6C shows an intermediate case with a flat signal-gain profile. The curves showing the phase in Fig. 6D showqualitatively similar behavior, except that the peaks (indicatingthe greatest phase advance) are at lower frequencies than thecorresponding peaks in the signal gain.
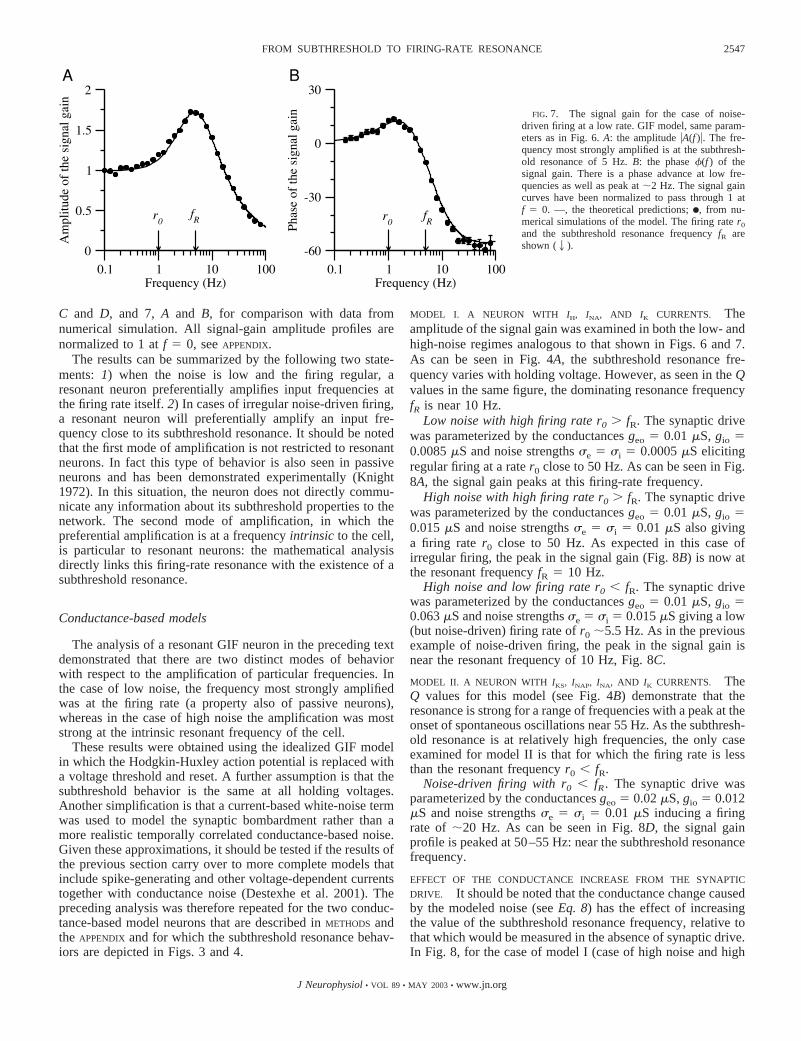
Low firing rate r0 � fR. When the firing rate r0 is lower thanthe resonant frequency fR, the “low-noise” (regular firing)situation becomes almost impossible to reach because in ab-sence of noise the neuron often starts to fire at a finite fre-quency (a type II neuron, see e.g., Rinzel and Ermentrout1989). In this case, firing at low frequencies can only beachieved through the action of a noisy current, renderingneuronal firing irregular. Thus in practice, low firing ratesimply high noise (noise-driven firing). When r0 � fR, theinter-spike interval is sufficiently long such that the neuron hastime to explore its subthreshold regime and begin to “resonate”before firing. As could be expected, the subthreshold resonantfrequency is therefore strongly evident in the signal gain, seeFig. 7A in which the neuron was driven by a weak DC I0 �0.50 nA and noise term IN � 0.55 nA (�V � 3.4 mV). The fullprofile of the signal gain demonstrates that the frequency mostpreferentially amplified is the subthreshold resonance fR � 5Hz, as in Fig. 6B. This case is therefore similar to the high-firing-rate case (high noise) for which noise also dominated thefiring process, despite the fact that the inter-spike dynamics arequite different.
The amplitude and phase of the signal gain A(f ) give a fullpicture of the changing behavior as the neuron moves betweenregular firing and irregular noise-driven firing in these twocases. As stated previously, the advantage of the GIF neuron isthat it allows for a direct link between the subthreshold prop-erties and their effect on the firing rate. A mathematical anal-ysis, presented elsewhere (unpublished results), provides ana-lytical expressions for the signal gain and its phase in terms ofthe parameters of the model, in the limit that �1 is long. Themathematically generated curves have been plotted in Figs. 6,
A
B
CD
FIG. 6. Effect of noise strength on the amplification of a frequency f in thefiring rate of a resonant neuron. Two cases are considered: low noise (red) andhigh noise (blue). The particular generalized integrate-and-fire (GIF) modelneuron (C � 0.5 nF, g � 0.025 �S, g1 � 0.025 �S, and �1 � 100 ms) has aresonance near 5 Hz, and in all cases, the firing rate is kept at r0 � 20 Hz. Aand B: simulation of a 3-s current injection protocol. 0–1 s: injected noisycurrent with no oscillatory component. 1–2 s: addition of a 5 Hz (fR) sinusoidalcomponent. 2–3 s: sinusoidal component at 20 Hz (r0). A: low-noise case (I0 �0.95 nA, I1 � 0.024 nA, and IN � 0.11 nA) in which the neuron fires regularly.The amplification is greatest at f � r0 � 20 Hz. B: high-noise case (I0 � 0.78nA, I1 � 0.059 nA, and IN � 0.55 nA). The strongest amplification is at theresonance frequency f � fR � 5 Hz. C: signal gain amplitude �A(f )� vs.frequency. D: phase of the signal gain �(f ) vs. frequency. Both low (redcurves) and high (blue curves) noise cases with the green curves representingan intermediate case (I0 � 0.92 nA and IN � 0.22 nA giving �V �1.36 mV).The signal gain curves are normalized to 1 at f � 0, see APPENDIX. The full linesare the theoretical predictions and the symbols come from numerical simula-tions of the model.
2546 M.J.E. RICHARDSON, N. BRUNEL, AND V. HAKIM
J Neurophysiol • VOL 89 • MAY 2003 • www.jn.org
C and D, and 7, A and B, for comparison with data fromnumerical simulation. All signal-gain amplitude profiles arenormalized to 1 at f � 0, see APPENDIX.
The results can be summarized by the following two state-ments: 1) when the noise is low and the firing regular, aresonant neuron preferentially amplifies input frequencies atthe firing rate itself. 2) In cases of irregular noise-driven firing,a resonant neuron will preferentially amplify an input fre-quency close to its subthreshold resonance. It should be notedthat the first mode of amplification is not restricted to resonantneurons. In fact this type of behavior is also seen in passiveneurons and has been demonstrated experimentally (Knight1972). In this situation, the neuron does not directly commu-nicate any information about its subthreshold properties to thenetwork. The second mode of amplification, in which thepreferential amplification is at a frequency intrinsic to the cell,is particular to resonant neurons: the mathematical analysisdirectly links this firing-rate resonance with the existence of asubthreshold resonance.
Conductance-based models
The analysis of a resonant GIF neuron in the preceding textdemonstrated that there are two distinct modes of behaviorwith respect to the amplification of particular frequencies. Inthe case of low noise, the frequency most strongly amplifiedwas at the firing rate (a property also of passive neurons),whereas in the case of high noise the amplification was moststrong at the intrinsic resonant frequency of the cell.
These results were obtained using the idealized GIF modelin which the Hodgkin-Huxley action potential is replaced witha voltage threshold and reset. A further assumption is that thesubthreshold behavior is the same at all holding voltages.Another simplification is that a current-based white-noise termwas used to model the synaptic bombardment rather than amore realistic temporally correlated conductance-based noise.Given these approximations, it should be tested if the results ofthe previous section carry over to more complete models thatinclude spike-generating and other voltage-dependent currentstogether with conductance noise (Destexhe et al. 2001). Thepreceding analysis was therefore repeated for the two conduc-tance-based model neurons that are described in METHODS andthe APPENDIX and for which the subthreshold resonance behav-iors are depicted in Figs. 3 and 4.
MODEL I. A NEURON WITH IH, INA, AND IK CURRENTS. Theamplitude of the signal gain was examined in both the low- andhigh-noise regimes analogous to that shown in Figs. 6 and 7.As can be seen in Fig. 4A, the subthreshold resonance fre-quency varies with holding voltage. However, as seen in the Qvalues in the same figure, the dominating resonance frequencyfR is near 10 Hz.
Low noise with high firing rate r0 fR. The synaptic drivewas parameterized by the conductances geo � 0.01 �S, gio �0.0085 �S and noise strengths �e � �i � 0.0005 �S elicitingregular firing at a rate r0 close to 50 Hz. As can be seen in Fig.8A, the signal gain peaks at this firing-rate frequency.
High noise with high firing rate r0 fR. The synaptic drivewas parameterized by the conductances geo � 0.01 �S, gio �0.015 �S and noise strengths �e � �i � 0.01 �S also givinga firing rate r0 close to 50 Hz. As expected in this case ofirregular firing, the peak in the signal gain (Fig. 8B) is now atthe resonant frequency fR � 10 Hz.
High noise and low firing rate r0 � fR. The synaptic drivewas parameterized by the conductances geo � 0.01 �S, gio �0.063 �S and noise strengths �e � �i � 0.015 �S giving a low(but noise-driven) firing rate of r0 5.5 Hz. As in the previousexample of noise-driven firing, the peak in the signal gain isnear the resonant frequency of 10 Hz, Fig. 8C.
MODEL II. A NEURON WITH IKS, INAP, INA, AND IK CURRENTS. TheQ values for this model (see Fig. 4B) demonstrate that theresonance is strong for a range of frequencies with a peak at theonset of spontaneous oscillations near 55 Hz. As the subthresh-old resonance is at relatively high frequencies, the only caseexamined for model II is that for which the firing rate is lessthan the resonant frequency r0 � fR.
Noise-driven firing with r0 � fR . The synaptic drive wasparameterized by the conductances geo � 0.02 �S, gio � 0.012�S and noise strengths �e � �i � 0.01 �S inducing a firingrate of 20 Hz. As can be seen in Fig. 8D, the signal gainprofile is peaked at 50–55 Hz: near the subthreshold resonancefrequency.
EFFECT OF THE CONDUCTANCE INCREASE FROM THE SYNAPTIC
DRIVE. It should be noted that the conductance change causedby the modeled noise (see Eq. 8) has the effect of increasingthe value of the subthreshold resonance frequency, relative tothat which would be measured in the absence of synaptic drive.In Fig. 8, for the case of model I (case of high noise and high
FIG. 7. The signal gain for the case of noise-driven firing at a low rate. GIF model, same param-eters as in Fig. 6. A: the amplitude �A(f )�. The fre-quency most strongly amplified is at the subthresh-old resonance of 5 Hz. B: the phase �(f ) of thesignal gain. There is a phase advance at low fre-quencies as well as peak at 2 Hz. The signal gaincurves have been normalized to pass through 1 atf � 0. —, the theoretical predictions; F, from nu-merical simulations of the model. The firing rate r0
and the subthreshold resonance frequency fR areshown (2).
2547FROM SUBTHRESHOLD TO FIRING-RATE RESONANCE
J Neurophysiol • VOL 89 • MAY 2003 • www.jn.org

firing rate), the conductance change corresponded to a 70%increase in the leak. This effect increased the subthresholdresonant frequency by 1 Hz over the voltage range �100 to�60 mV. For model II (for which the conductance increasewas 90%) the corresponding increase in the subthreshold res-onant frequency was �2 Hz. Larger synaptic conductanceslead to larger shifts in the subthreshold preferred frequency andconsequently in the firing-rate preferred frequency as shown inFig. 9 for the case of model II. The preferred frequency is closeto 50 Hz for a conductance change of 100% but increases to60 and 80 Hz for a conductance change of 200 and 400%—values similar to some estimates of conductance changes invivo (Destexhe and Pare 1999). The frequency where the spikerate is in phase with the input increases accordingly. The shiftof the firing rate resonant frequency is related to the shift insubthreshold frequency. The latter shift can be calculated usingEq. A6 of the APPENDIX. The strength of subthreshold resonancedecreases with an increase in synaptic conductance, near aparticular holding voltage. Thus one would expect that thestrength of the firing rate resonance would also decrease withthe conductance increase. However, this is not necessarily the
case, as shown in Fig. 9 where it is seen that the resonancestrength increases with the conductance increase. The increasein this case appears to be due to the fact that the neuron spendsmore time at values of the membrane potential close to thresh-old, where the subthreshold resonance is stronger (see Fig. 4).
In summary, the conclusions drawn in the analysis of theGIF model neuron also hold for two distinct conductance-based models of resonance: the neurons amplify frequenciesnear their subthreshold resonance frequency under conditionsof noise-driven irregular firing. A supplementary feature is thatconductance-based synaptic noise increases the subthresholdresonance frequency. This in turn increases the frequency forwhich the firing rate is preferentially modulated, in the irreg-ular firing regime.
D I S C U S S I O N
Many classes of neurons throughout the nervous systemexhibit subthreshold resonance. In this paper, we systemati-cally studied the effect of this intrinsic frequency preference onboth the subthreshold properties and the dynamics of the firing
FIG. 8. The spike-response (I1�A(f )�) to a weak applied os-cillating current (amplitude I1) for regular and noise-drivenfiring modes for two conductance-based models of resonantneurons. A: model I, regular firing (geo � 0.01 �S, gio � 0.0085�S, �e � �i � 0.0005 �S, I1 � 0.02 nA). The strongestamplification is at a frequency equal to the firing rate r0 � 50Hz. B: model I, noise-driven irregular firing at high rate (geo �0.01 �S, gio � 0.015 �S, �e � �i � 0.01 �S, I1 � 0.2 nA). Thestrongest amplification is now near the resonant frequency fR �10 Hz. C: model I, noise-driven firing at low rate r0 5.5 Hz(geo � 0.01 �S, gio � 0.063 �S, �e � �i � 0.015 �S, I1 � 0.1nA). Again the peak amplification is at the resonance frequencyfR � 10 Hz. D: model II, noise-driven firing at low rate (geo �0.02 �S, gio � 0.012 �S, �e � �i � 0.01 �S, I1 � 0.1 nA). Thestrongest amplification is near the resonant frequency of thisneuron, at 50 Hz. The error bars are smaller than the symbolsize.
FIG. 9. The effect of increasing synapticconductance on the modulation and phase ofthe spike-response (I1�A(f )�). Model II, forwhich gL � 0.037 �S, with synaptic-con-ductance input that increases this conduc-tance by 100% (F, geo � 0.021 �S, gio �0.016 �S), 200% (■ , geo � 0.038 �S gio
�0.036 �S), and 400% (}, geo � 0.076 �S,gio � 0.072 �S). A: spike rate modulation.The spike-rate resonant frequency is shiftedto 50, 60, and 80 Hz for conductance in-creases of 100, 200, and 400%, respectively.B: phase. The frequency where the spike rateis in phase with the input has a correspond-ing shift to higher values. In all cases, theamplitude of the sinusoidal current was 0.05nA and �e � �i � 0.01 �S, eliciting abackground firing rate of 20 Hz.
2548 M.J.E. RICHARDSON, N. BRUNEL, AND V. HAKIM
J Neurophysiol • VOL 89 • MAY 2003 • www.jn.org
rate. Using reduced models as well as two example conduc-tance-based model neurons, it was found that resonant neuronscan amplify an oscillatory component in their input as theytransmit it to postsynaptic targets. When the noise from thesynaptic bombardment is significant, the frequency moststrongly amplified is the subthreshold resonant frequency it-self. The results of this study underline the importance oftaking noise into account when examining neuronal responseand provides a first step in the understanding of the role ofresonance in oscillations at the network level.
Subthreshold dynamics
Our analysis of two- and three-variable neuronal modelsclassifies a broad range of subthreshold behavior, providing aunifying framework in which different models can be insertedand compared. In particular, it shows that resonance anddamped oscillations in response to transient inputs occur inoverlapping but different regions of parameters.
Neurons can exhibit resonance when they include a suffi-ciently slow variable that opposes voltage change as previouslyemphasized (see e.g., Hutcheon and Yarom 2000). In this case,the negative feedback at low frequencies together with thesuppressed response at high frequencies creates a band-passfilter that gives the resonant response but not a damped-oscil-latory response. Figure 2 shows that having a sufficiently slowvariable that opposes voltage change is indeed a sufficientcondition for resonant behavior. It is, however, not a necessarycondition because even a fast variable (i.e., �1 � C/g) canproduce resonance as long as its conductance g1 is sufficientlylarge. In fact, an examination of the regions in Fig. 2 showsthat resonant neurons with slow variables are generally non-oscillating, whereas those with fast variables are generallyintrinsically oscillating. Conversely, neurons exhibitingdamped oscillations do not necessarily have resonance if thedamping of the oscillation is strong enough. This appears in asmall parameter region where the effective coupling betweenthe two variables is weak, as shown in Fig. 2.
Our analysis also clarifies the relationship between the phaseand the amplitude of the impedance. Phase advance of themembrane potential at low frequencies implies a peak in theimpedance profile, but the reverse is not necessarily true, if theresonance is too weak.
Further analysis of three-variable models identified an im-pedance profile with a trough at low frequency followed by apeak at higher frequencies. Such behavior was recently foundexperimentally in CA1 interneurons of the hippocampus byPike et al. (2000). The criteria for a trough in the impedanceprofile are two active components that act on a slower timescale than the membrane time constant. The slowest of the twovariables must act to amplify voltage change, whereas thefaster should act to oppose the change. An explicit examplewas given in terms of a neuron with an inactivating slowpotassium current.
The analytical results presented can be used in the interpre-tation of experiment in two ways. They allow for the system-atic building of a minimal model of a neuron, given theexperimentally measured impedance profile. First the qualita-tive features of the resonance curve indicate the minimal num-ber of variables needed (e.g., two variables for neurons with asingle peak in the curve, three variables for neurons with a
trough followed by a peak); second, the parameters of themodel can be obtained quantitatively by fitting the impedancecurve of the given model to the data. From an experimentalpoint of view, they provide hints for the type of currents, orcombination of currents, needed to achieve given resonanceproperties (see also Hutcheon and Yarom 2000).
The general subthreshold “phase diagrams” that were intro-duced here are related to several diagrams, which appearedpreviously in the literature for particular neurons. In modelswith persistent sodium and slow potassium currents, diagramshave been drawn in parameter space gNaP-gKs (Hutcheon andYarom 2000; White et al. 1995). In Fig. 2, � is proportional tominus gNaP, whereas � is proportional to gKs. The triangularregion (of the above-mentioned diagram) where subthresholdoscillations occur corresponds to the area bounded by the linewhere spontaneous oscillations arise and the continuation ofthe straight line indicating a zero total conductance in Fig. 2.Likewise, the diagram of Manor et al. (1997), showing how thecellular behavior changes when the leak conductance and theconductance of a low-threshold calcium current are changed, isrelated to Fig. 2, by an appropriate change of variables. Theconductance of the low-threshold calcium channels enters bothon the � variable (through its instantaneous activation dynam-ics) and on the � variable.
Firing-rate dynamics
Resonance properties have traditionally been studied at thesingle-neuron level or in neurons coupled by gap junctions(Manor et al. 1997). On the other hand, firing properties ofresonant neurons have been less systematically studied. Suchstudies are important to assess the role of resonance in net-works in which the main coupling is chemical and not electri-cal. Indeed, for subthreshold resonant properties to affect net-work dynamics, as reported by Tiesinga et al. (2001) and Wang(2002), the firing properties of single neurons themselvesshould be sensitive to the resonance. In the present paper, thisquestion has been investigated, using both reduced models andconductance-based models. It has been shown how noise playsa crucial role in the appearance of resonance at subthresholdfrequencies of the firing rate modulated by a sinusoidal input.When noise is weak and firing is regular, the firing rate re-sponse is dominated by resonances at the background firingfrequency and the subthreshold resonance is masked. Whennoise is strong and firing is approximately Poisson, the reso-nance at the background firing rate disappears and the sub-threshold resonance is revealed. The phenomenon is mostclearly seen with the GIF model that has a subthreshold re-sponse independent of membrane potential and is submitted towhite-noise current inputs. This produces a single voltage-independent resonant frequency that can be directly comparedwith the frequency amplified in the firing rate. Given thesimplicity of the model, the shift of the firing rate resonancewith noise and its relation to the subthreshold can also bedemonstrated mathematically. However, neurons are more re-alistically modeled using a conductance-based description. Inaddition, synaptic “noise” is better modeled by conductancefluctuations that both modify the conductance of the neuronand give rise to correlated noise. This complicates the phenom-enon as compared with the GIF model. The neuronal conduc-tance and the preferred subthreshold frequency vary with the
2549FROM SUBTHRESHOLD TO FIRING-RATE RESONANCE
J Neurophysiol • VOL 89 • MAY 2003 • www.jn.org

membrane potential and with the input strengths. The effect ofincreasing synaptic conductance is to increase the subthresholdresonance frequency, and this effect leads, for noisy inputs, toa corresponding increase in firing rate resonance frequency.The noise correlations also modify the neuronal response athigh frequency as previously described (Brunel et al. 2001),but this happens at higher frequencies than those of interesthere. So the phenomenon observed with the GIF model isfound to remain true for the conductance-based models. At ageneral level of explanation, it can be attributed to the band-pass filter properties of the membrane subthreshold dynamicsthat amplify the response at the subthreshold preferred fre-quency.
Our study suggests a functional role for noise in makingknown to the network the frequency preferences of singleneurons. In a sense, noise allows the neurons to communicateto each other information about the particular subthresholdion-channel dynamics they exhibit, a message that otherwisewould be lost in regular spiking dynamics. These results on thefiring rate dynamics of resonant neurons could be tested in anyslice preparation in which resonant neurons are observed.Between 1,000 and 50,000 s of simulation time were needed toproduce accurate numerical data for this paper. However, sim-ulations also suggest that collecting spikes for 5–10 min perfrequency should be sufficient to see the effects of subthresholdresonance in the signal gain at a reasonable significance level.
It should perhaps be emphasized that the unmasking ofsubthreshold resonance properties by noise is quite distinctfrom the usual “stochastic resonance” effect (Wiesenfeld andMoss 1995) that quantifies the output at a given frequency asthe strength of noise is varied. In this case, resonance generallyarises as some stochastic rate coincides with the given oscil-lating frequency. A simple IF model, with passive membraneproperties, displays stochastic resonance (Bulsara et al. 1994)but not the subthreshold and firing-rate resonance studied here.
Firing rate resonance and the associated phase advance ofthe firing rate at low frequencies can also be due to othermechanisms, such as spike frequency adaptation (Fuhrmann etal. 2002). One difference between the two mechanisms is thatwith spike frequency adaptation the negative feedbackcomes through action potential-dependent currents, whereasin the case of subthreshold resonance negative feedbackcomes from the interspike subthreshold dynamics. Anotherdifference is that for the case of subthreshold resonance, thepeak response in the signal gain and corresponding zerophase lag near the resonant frequency do not appear undernoiseless conditions.
Implications for network synchronization
The firing rate signal gain examined in this paper is one ofthe crucial quantities that determines the synchronization prop-erties of large networks, together with the temporal character-istics of synaptic transmission. In particular, the existence ofphase advance of the firing rate at low frequency can generatean oscillation in networks of excitatory neurons as was shownfor the case of adapting neurons (Fuhrmann et al. 2002).Therefore we expect that in noisy in-vivo-like conditions,networks of excitatory neurons with subthreshold resonancecould generate oscillations.
From the theoretical point of view, we have introduced asimplified neuronal model for a resonant neuron, the general-ized IF neuron, that can be engineered to capture the subthresh-old dynamics of any conductance-based model neuron but witha fixed threshold for firing. Simple one-variable IF neuronshave proven very useful for understanding the dynamics oflarge networks because analytical tools can be applied to studyand understand in great detail the collective dynamics of suchnetworks (see e.g., Abbott and van Vreeswijk 1993; Amit andBrunel 1997; Amit and Tsodyks 1991; Brunel 2000; Bruneland Hakim 1999; Gerstner 2000; Treves 1993). However, IFneurons are clearly not suited to describe neurons with sub-threshold resonance. The generalized IF neuron that was intro-duced here provides an appropriate tool for the investigation ofthe collective properties of networks of resonant neurons. Suchtheoretical studies will help to obtain a deeper understanding ofthe functional role of subthreshold resonance in the nervoussystem.
A P P E N D I X
Model I: spiking neuron with an IH current
The model is defined as follows
CM
dV
dt� �IL IH INa IK Isyn Iapp
where the membrane capacitance CM � 0.37nF and the leak current IL
is defined by IL � g�L (V � EL ) with g�L � 0.037 �S and EL � �68mV. The other currents take the form
INa � g�Nam�3 h�V ENa�
IK � g�Kn4�V EK�
IH � g�H�0.8f 0.2s��V EH�
where the conductances g� and reversal potentials E are given in TableA1, and it should be noted that f� � s�. The time-varying activationand inactivation variables h, n, f, and s all follow equations of the form
TABLE 1. Definitions and parameters of the currents used for the conductance-based models
Current g� , �s E, mV Gating Variables x� �x, ms
INa 19.24 �55 m� � �m/(�m � �m) �m � 0h� � �h/(�h � �h) �h � 1/(�(�h � �h))
IK 7.4 �90 n� � �n/(�n � �n) �n � 1/(�(�n � �n))IH 0.03 �41 f� � 1/(1 � e(V�78)/7) �f � 38
s� � 1/(1 � e(V�78)/7) �s � 319INaP 0.037 �55 p� � 1/(1 � e�(V�51)/5) �p � 0IKs 2.59 �90 q� � 1/(1 � e�(V�34)/6.5) �q � 6IKs(2) 5.18 �90 q� � 1/(1 � e�(V�34)/6.5) �q � 6
k� � 1/(1 � e(V�65)/6.6) �k � 200 � 220/(1 � e�(V�71.6)/6.85)
2550 M.J.E. RICHARDSON, N. BRUNEL, AND V. HAKIM
J Neurophysiol • VOL 89 • MAY 2003 • www.jn.org
�x�V�dx
dt� x��V� x (A1)
The voltage dependence of the corresponding �x(V) and x�(V)parameters are also given in Table A1. All currents are taken to be atphysiological temperatures, and hence the time scale of the Hodgkin-Huxley spike-generating currents have been shortened by the temper-ature factor � � 3(36�6.3)/10 � 26.12. The resting voltage of thismodel neuron is equal to Vrest � �65.2 mV and the firing thresholdis close to �56.4 mV.
LINEARIZATION. Following the procedure outlined in METHODS, theconductance-based model outlined in the preceding text can be lin-earized around a holding voltage V* (which can be varied by changingIapp). This model yields the following set of linear equations
CMv � �gMv ghwh gnwn gfwf gsws
�hwh � v wh
�nwn � v wn
�f wf � v wf
�sws � v ws
The conductance gM � �Imem/�V is the slope of the instantaneousI-V curve at V*
gM � g�L g�Nam�3 h� g�Kn�
4 g�H(0.8f� 0.2s�)
�3g�Nam�2 h��V* ENa���m�
�v �*
where the convention that X* is the quantity X evaluated at the holdingvoltage V* is used. The other conductances introduced are
gh � g�Na�V* ENa�m�3��h�
�v �*
gn � 4g�K�V* EK�n�3��n�
�v �*
gf � g�H0.8�V* EH���f�
�v�*
gs � g�H0.2�V* EH���s�
�v�*
REDUCTION TO TWO VARIABLES. The variables wh and wn are muchfaster than other time scales in the system. Thus the substitution wh � vand wn � v in the voltage equation represents a good approximation. Theslow variable of the H current ws has a relatively long time scale andhence follows the time average of v (obtained from a solution of Eq. A1).For voltage changes that average to zero around the rest, the replacementws30 is a valid approximation. These approximations taken togetheryield the two-variable system of equations
Cdv
dt� �gv gf wf
�f
dwf
dt� v wf
where C � CM and g � gM � gh � gn.
Model II
The model is defined as follows
CM
dV
dt� �IL INaP IKs INa IK Isyn Iapp
where CM � 0.37 nF and the leak current is defined by IL � g�L (V �EL ) with g�L � 0.037 �S and EL � �60 mV. The spike-generatingcurrents are identical to those of model I. The INaP and noninactivatingIKs currents are defined (Wang 1993) by
INaP � g�NaPp��V � ENaP�
IKs � g�Ksq�V EKs�
The resting voltage of the neuron is Vrest � �66.2 mV and the onsetof spontaneous oscillations occurs near �57.2 mV.
LINEARIZATION. Linearizing this model at a fixed voltage V* yieldsthe following set of linear differential equations
Cv � �gMv ghwh gnwn gqwq
�hwh � v wh
�nwn � v wn
�qwq � v wq
where again the conductance gM � �Imem/dV is the slope of theinstantaneous I-V curve at V*
gM � g�L g�Nam�3 h� g�Kn�
4 g�NaPp� g�Ksq� 3g�Nam�2 h��V* ENa���m�
�v �*
g�NaP�V* ENa���p�
�v �*
and the other conductance not common to model I is
gq � g�Ks�V* EK��dq�
dv �*
where all voltage-dependent quantities are evaluated at V*.
REDUCTION TO TWO VARIABLES. Again the model can be reducedto the two-variable form by noting that the time scales of the spike-generating currents are much faster than other time scales in thevoltage equation. However, in this case the replacements wh � v �gh�hv and wn � v � gn�nv are used, giving a better agreement near theline where spontaneous oscillations appear. Thus the two-variablereduction of this model is
Cdv
dt� �vg gqwq
�q
dwq
dt� v wq
where C � CM � gh�h � gn�n and g � gM � gh � gn.
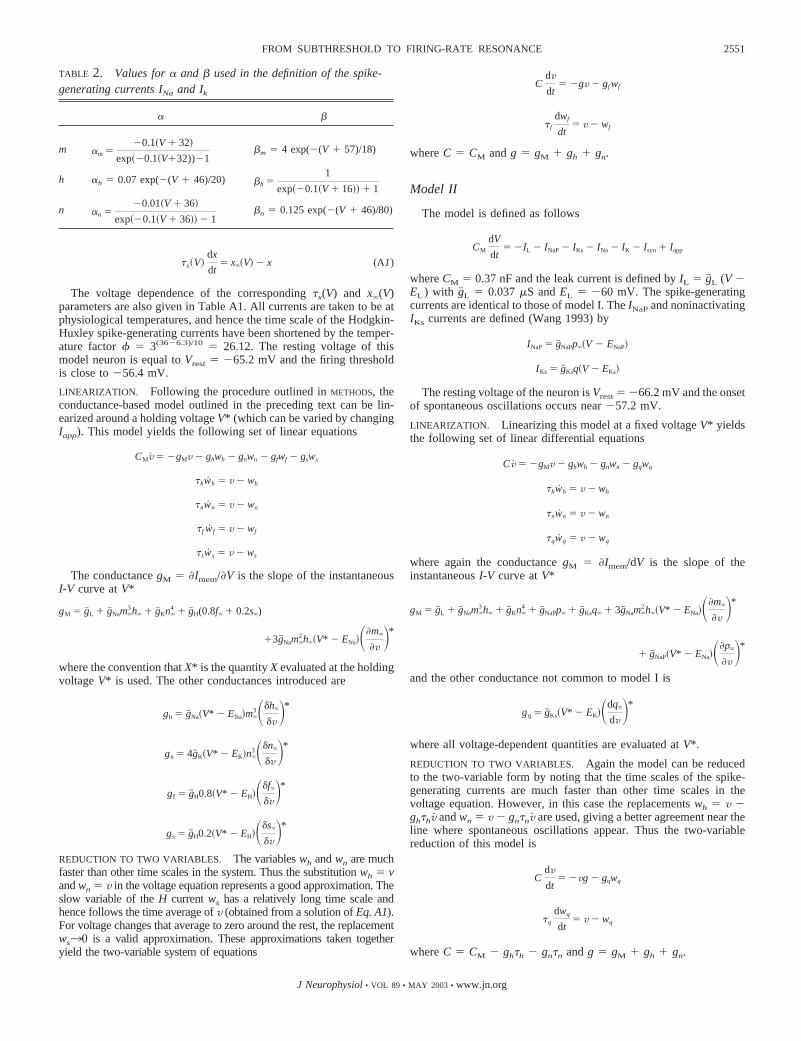
TABLE 2. Values for � and � used in the definition of the spike-generating currents INa and Ik
� �
m �m ��0.1�V 32�
exp��0.1�V�32))�1�m � 4 exp(�(V � 57)/18)
h �h � 0.07 exp(�(V � 46)/20) �h �1
exp��0.1�V 16�� 1
n �n ��0.01�V 36�
exp��0.1�V 36�� 1�n � 0.125 exp(�(V � 46)/80)
2551FROM SUBTHRESHOLD TO FIRING-RATE RESONANCE
J Neurophysiol • VOL 89 • MAY 2003 • www.jn.org
Model with a trough in the impedance
This model is similar to model II defined in the preceding text,except that in this case an inactivation term is included in the defini-tion of the slow potassium current
IKs�2� � g�Ksqk�V EK�
see Table A1 for the values of the various parameters. This model islinearized around �65 mV to give the following set of equations
Cv � �gMv ghwh gnwn gqwq gkwk
�hwh � v wh
�nwn � v wn
�qwq � v wq
�kwk � v wk
where in this case
gM � g�Nam�3 h� g�Kn�
4 g�NaPp� g�Ksq�k� g�NaP�V* ENa���p�
�v �*
3g�Nam�2 h��V*�ENa���m�
�v �*
and
gk � g�Ks�V* EK�q���k�
�v �*
gq � g�Ks�V* EK�k���q�
�v �*
The corresponding three-variable model is found by assuming the hand n variables are fast, leaving the set
Cv � �gv gqwq gkwk
�qwq � v wq
�kwk � v wk
where C � CM � gh�h � hn�n and gM � g � gn � gh.The two-variable approximation of this model is obtained by the
further assumption that the k variable is slow, and hence wk is set tozero. At V*� �65 mV, this two-variable model is identical to that ofmodel II given in the preceding text. The impedance curves of the full,three-, and two-variables models are given in Fig. 3B.
Impedance and eigenvalues of the two-variable model
The eigenvalues of the two-variable model are
�1 �1
2�1���� 1� ��� 1�2 4��
�2 �1
2�1���� 1� ��� 1�2 4�� (A3)
STABILITY OF THE MEMBRANE POTENTIAL. For the membranepotential to be stable, the real part of both eigenvalues must benegative. This gives the following bounds on the parameters � and �
� � �1 and � � � 0 (A4)
AMPLITUDE OF THE IMPEDANCE. For an oscillating current offrequency f � �/(2 ), the amplitude of the complex impedance �Z� isgiven as
�Z� � ��1
C� � �1 �1
2�2�
�� � �12�2�2 �1
2�2�1 ��2 (A5)
A subthreshold resonance, signaled by the existence of peak in�Z(f )� at some nonzero frequency, occurs if (Hutcheon et al. 1996a)
� � ��� 1�2 1 �1 ��
and at a frequency
fR �1
2 �1
���� � 1�2 �� 1�2�1/2 1�1/2 (A6)
THE PHASE OF THE IMPEDANCE. The phase �, defined in Eq. 11, is
tan � � �1�� �1 �1
2�2�
� ��1 �12�2�
(A7)
A zero phase-lag exists for � 1, whereas a phase lag 90° ispresent for � � 0.
RESPONSE TO A SQUARE-PULSE CURRENT. The response of theneuron to the onset of a square-pulse current Iapp � I�(t) can be foundin terms of the eigenvalues as
v � v� v�� e�1t��1�1�2 �2
�1 �2� e�2t��1�1�2 �1
�2 �1��
where v� � I/(g � g1) is the holding voltage corresponding to anapplied current of Iapp � I in the linear approximation. When the rootsare complex and written as � � �� � i�0 the form above can bewritten more conveniently as
v � v� v�e��t�cos ��0t� �� �1��2 �0
2�
�0� sin��0t�
The existence of complex eigenvalues indicates that the neuron hasdamped oscillations at a frequency f0. This occurs when 4� (� �1)2 (Puil et al. 1986) giving
�0 �1
2�1
�4� �� 1�2
The qualitatively different types of behavior that can occur are thefollowing: when � (� � 1)2/4, the membrane responds withdamped oscillations; when � 1 and 0 � � � (� � 1)2/4, themembrane has a single overshoot (or sag if the current pulse ishyperpolarizing); for all other cases, � � 1, � � (� � 1)2/4 and � 1, � � 0, the voltage changes monotonically from its initial to finalvalue.
Impedance and eigenvalues of the three-variable model
The complex impedance of the three-variable model model definedby Eq. 7 is
Z �1
g� �1 i��1� �1 i��2�
�1 i��m��1 i��1��1 i��2� �1�1 i��2� �2�1 i��1�� (A8)
where � � 2 f, �m � C/g, �1 � g1/g, and �2 � g2/g.To classify the behavior of the amplitude of the impedance versus
frequency curve in terms of the number of local minima and/ormaxima, the derivative of �Z� with respect to � is computed. Its signis determined by a fourth order polynomial in �2. The number of realpositive roots of this polynomial tell us how many local extrema thereare in the amplitude versus frequency curve. The roots of the poly-nomial are found numerically. From these roots, the boundaries of theregions with 0, 1, or 2 local minima, corresponding respectively to noresonance, simple resonance, and resonance preceded by a trough, arefound numerically.
The eigenvalues of the stability matrix of Eq. 7 are given by thefollowing cubic polynomial
2552 M.J.E. RICHARDSON, N. BRUNEL, AND V. HAKIM
J Neurophysiol • VOL 89 • MAY 2003 • www.jn.org
�3 � 1
�m
1
�1
1
�2��2 � 1
�1�2
1 �1
�1�m
1 �2
�2�m��
1 �1 �2
�m�1�2
� 0
(A8)
Insertion of � � 0 in Eq. A8 yields the line 1 � �1 � �2 � 0. Tofind the line where spontaneous oscillations appear, we set � � i� andobtain a half straight line in a parametric way
�1 ��m �2
�1 �2
�1 �2�12�
�2 � ��m �1
�1 �2
�1 �2�22�
Finally, to obtain the regions where damped oscillatory behaviorarise in response to a step current, the roots of the cubic polynomialare computed numerically. The boundaries of the area in which a pairof complex conjugate roots appear are then found.
Calculation of the firing-rate resonance
The modulation in the instantaneous firing rate due to a sinusoidalinput in the limit �1 � can be calculated analytically. Details willbe published elsewhere (Brunel et al. 2003). The modulation in thefiring rate can be written
A��� � �1 �Y ���
1 �Y ��� i��1�ALIF���
Y��� �1 g�m�v� vr�ALIF���
1 i��m
where � � g1/g, �m � C/g, and ALIF(�) is the firing-rate linearresponse (signal gain) of the IF neuron (Brunel and Hakim 1999;Brunel et al. 2001)
ALIF��� �r0
g��1 i��m)��U
�y�yt, ��m�
�U
�y�yr, ��m�
U�yt, ��m� U�yr, ��m�� (A9)
the noise strength here is given by � � (IN /g) �N /�m. The parametersyt, yr and the background firing rate r0 are given by the set of equations
yt �v� ��v� I0/g
�
yr �vr ��v� I0/g
�
�v� �I0/g �v� vr�r0�m
1 �(A10)
r0 � ��m� yr
yt
eu2�1 erf�u����1
where erf(u) is the standard error function, and U is given in terms ofcombinations of hypergeometric functions (Abramowitz and Stegun1970)
U�y, �� �ey2
���1 i��/2�M�1 i�
2,1
2, �y2�
2yey2
��i�/2�M�1
i�
2,3
2, �y2�(A11)
The amplitudes of the signal-gain profiles �A(f )� in Figs. 6 and 7have been normalized to 1 at zero frequency for both the analyticalresults (—) and data from numerical simulation (F). A systematic andfrequency-independent shift of 10% between theory and numericswas visible in the unnormalized curves due to the finite value of �1.
Such a shift can be captured analytically by examining higher ordersof the approximation that take the finite value of �1 into account.
We thank O. Paulsen for useful discussions, as well as C. Meunier and A.Tonnelier for detailed comments on a previous version of the manuscript.
M.J.E. Richardson acknowledges support from a European CommunityMarie Curie Fellowship. Laboratoire de Physique Statistique is Centre Na-tional de la Recherche Scientifique Unite Mixte de Recherche 8550, Associeaux Universites Paris VI et VII.
REFERENCES
Abbott LF, and van Vreeswijk C. Asynchronous states in networks ofpulse-coupled oscillators. Phys Rev E 48: 1483–1490, 1993.
Abramowitz M and Stegun IA. Tables of Mathematical Functions. NewYork: Dover Publications, 1970.
Adrian ED and Matthews BHC. The Berger rhythm: potential changes fromthe occipital lobes in man. Brain 57: 355–385, 1934.
Amit DJ and Brunel N. Model of global spontaneous activity and localstructured activity during delay periods in the cerebral cortex. Cereb Cortex7: 237–252, 1997.
Amit DJ and Tsodyks MV. Quantitative study of attractor neural networkretrieving at low spike rates. I. Substrate spikes, rates and neuronal gain.Network 2: 259–274, 1991.
Anderson JS, Lampl I, Gillespie DC, and Ferster D. The contribution ofnoise to contrast invariance of orientation tuning in cat visual cortex. Science290: 1968–1972, 2000.
Brunel N. Dynamics of sparsely connected networks of excitatory and inhib-itory spiking neurons. J Comput Neurosci 8: 183–208, 2000.
Brunel N, Chance FS, Fourcaud N, and Abbott LF. Effects of synapticnoise and filtering on the frequency response of spiking neurons. Phys RevLett 86: 2186–2189, 2001.
Brunel N and Hakim V. Fast global oscillations in networks of integrate-and-fire neurons with low firing rates. Neural Comput 11: 1621–1671, 1999.
Brunel B, Hakim V, and Richardson MJE. Firing rate resonance in ageneralized integrate-and-fire neuron with subthreshold resonance. Phys RevIn press.
Bulsara AR, Lowen SB, and Rees CD. Cooperative behavior in the period-ically modulated Wiener process: noise-induced complexity in a modelneuron. Phys Rev E 49: 4989–5000, 1994.
De Zeeuw CI, Simpson JI, Hoogenraad CC, Galjart N, Koekkoek SK, andRuigrok TJ. Microcircuitry and function of the inferior olive. TrendsNeurosci 21: 391–400, 1998.
Destexhe A and Pare D. Impact of network activity on the integrativeproperties of neocortical pyramidal neurons in vivo. J Neurophysiol 81:1531–1547, 1999.
Destexhe A, Rudolph M, Fellous J-M, and Sejnowski TJ. Fluctuatingsynaptic conductances recreate in vivo-like activity in neocortical neurons.Neuroscience 107: 13–24, 2001.
Dickson CT, Magistretti J, Shalinsky MH, Fransen E, Hasselmo ME, andAlonso A. Properties and role of I(h) in the pacing of subthreshold oscilla-tions in entorhinal cortex layer II neurons. J Neurophysiol 83: 2562–2579,2000.
Fuhrmann G, Markram H, and Tsodyks M. Spike frequency adaptationand neocortical rhythms. J Neurophysiol 88: 761–770, 2002.
Gerstner W. Population dynamics of spiking neurons: fast transients, asyn-chronous states, and locking. Neural Comput 12: 43–89, 2000.
Gutfreund Y, Yarom Y, and Segev I. Subthreshold oscillations and resonantfrequency in guinea pig cortical neurons: physiology and modelling.J Physiol 483: 621–640, 1995.
Hodgkin AL and Huxley AF. A quantitative description of membrane currentand its application to conductance and excitation in nerve. J Physiol 117:500–544, 1952.
Honeycutt RL. Stochastic Runge-Kutta algorithms. I. White noise. Phys RevA 45: 600–603, 1992.
Hutcheon B, Miura RM, and Puil E. Models of subthreshold membraneresonance in neocortical neurons. J Neurophysiol 76: 698–714, 1996a.
Hutcheon B, Miura RM, and Puil E. Subthreshold membrane resonance inneocortical neurons. J Neurophysiol 76: 683–697, 1996b.
Hutcheon B, Miura RM, Yarom Y, and Puil E. Low-threshold calciumcurrent and resonance in thalamic neurons: a model of frequency preference.J Neurophysiol 71: 583–594, 1994.
Hutcheon B and Yarom Y. Resonance, oscillation and the intrinsic frequencypreferences of neurons. Trends Neurosci 23: 216–222, 2000.
2553FROM SUBTHRESHOLD TO FIRING-RATE RESONANCE
J Neurophysiol • VOL 89 • MAY 2003 • www.jn.org
Izhikevich EM. Resonate-and-fire neurons. Neural Networks 14: 883–894,2001.
Jahnsen H and Karnup S. A spectral analysis of the integration of artificialsynaptic potentials in mammalian central neurons. Brain Res 666: 9–20,1994.
Knight BW. The relationship between the firing rate of a single neuron and thelevel of activity in a population of neurons. J Gen Physiol 59: 767–778,1972.
Koch C. Cable theory in neurons with active linearized membrane. BiolCybern 50: 15–33, 1984.
Koch C. Biophysics of Computation: Information Processing in Single Neu-rons. Oxford, UK: Oxford Univ. Press, 1999.
Lampl I and Yarom Y. Subthreshold oscillations of the membrane potential:a functional synchronizing and timing device. J Neurophysiol 70: 2181–2186, 1993.
Lampl I and Yarom Y. Subthreshold oscillations and resonant behavior: twomanifestations of the same mechanism. Neuroscience 78: 325–341, 1997.
Leung LS and Yu HW. Theta-frequency resonance in hippocampal CA1neurons in vitro demonstrated by sinusoidal current injection. J Neuro-physiol 79: 1592–1596, 1998.
Llinas R, Grace AA, and Yarom Y. In vitro neurons in mammalian corticallayer 4 exhibit intrinsic oscillatory activity in the 10- to 50-Hz frequencyrange. Proc Natl Acad Sci USA 88: 897–901, 1991.
Llinas R and Yarom Y. Oscillatory properties of guinea pig olivary neuronsand their pharmacological modulation: an in vitro study. J Physiol 376:163–182, 1986.
Manor Y, Rinzel J, Segev I, and Yarom Y. Low-amplitude oscillations in theinferior olive: a model based on electrical coupling of neurons with heter-ogeneous channel densitites. J Neurophysiol 77: 2736–2752, 1997.
Mauro A, Conti F, Dodge F, and Schor R. Subthreshold behavior andphenomenological impedance of the squid giant axon. J Gen Physiol 55:497–523, 1970.
Pike FG, Goddard RS, Suckling JM, Ganter P, Kasthuri N, and PaulsenO. Distinct frequency preferences of different types of rat hippocampalneurons in response to oscillatory input currents. J Physiol 529: 205–213,2000.
Puil E, Gimbarzevsky B, and Miura RM. Quantification of membraneproperties of trigeminal root ganglions in guinea pigs. J Neurophysiol 55:995–1016, 1986.
Puil E, Meiri H, and Yarom Y. Resonant behavior and frequency preferencesof thalamic neurons. J Neurophysiol 71: 575–582, 1994.
Rinzel J and Ermentrout GB. Analysis of neural excitability and oscillations.In: Methods in Neuronal Modeling. Cambridge, MA: MIT Press, 1989, p.135–169.
Spain WJ, Schwindt PC, and Crill WE. Anomalous rectification in neuronsfrom cat sensorimotor cortex in vitro. J Neurophysiol 57: 1555–1576, 1987.
Tiesinga PHE, Fellous JM, Jose JV, and Sejnowski TJ. Computationalmodel of carbachol-induced delta, theta, and gamma oscillations in thehippocampus. Hippocampus 11: 251–274, 2001.
Treves A. Mean-field analysis of neuronal spike dynamics. Network 4: 259–284, 1993.
Wang XJ. Ionic basis for intrinsic oscillations. Neuroreport 5: 221–224, 1993.Wang X-J. Pacemaker neurons for the theta rhythm and their synchronization
in the septohippocampal reciprocal loop. J Neurophysiol 87: 889–900,2002.
White JA, Budde T, and Kay AR. A bifurcation analysis of neuronalsubthreshold oscillations. Biophys J 69: 1203–1217, 1995.
Wiesenfeld K and Moss F. Stochastic resonance and the benefits of noise:from ice ages to crayfish and squids. Nature 373: 33–36, 1995.
2554 M.J.E. RICHARDSON, N. BRUNEL, AND V. HAKIM
J Neurophysiol • VOL 89 • MAY 2003 • www.jn.org