Embed Size (px)
Citation preview
� �Q/�009, Economic Perspectives
From tail fins to hybrids: How Detroit lost its dominance of the U.S. auto market
Thomas H. Klier
Thomas H. Klier is a senior economist in the Economic Research Department at the Federal Reserve Bank of Chicago. He thanks William Testa, Rick Mattoon, and Anna Paulson, as well as seminar participants at Temple University, for helpful comments. Vanessa Haleco-Meyer provided excellent research assistance.
Introduction and summary
From the mid-1950s through 2008, the Detroit auto-makers, once dubbed the “Big Three”—Chrysler LLC, Ford Motor Company, and General Motors Corporation (GM)—lost over 40 percentage points of market share in the United States, after having dominated the indus-try during its first 50 years. From today’s perspective, the elaborately designed tail fins that once adorned the Detroit automakers’ luxury marques symbolized the pinnacle of their market power. Fifty years later, the Detroit automakers were playing catch-up to com-pete with Toyota’s very successful entry into the hybrid car segment, the Prius. By 2008, Toyota, the largest Japanese automaker, had become the largest producer of vehicles worldwide—a position that had been pre-viously held by GM for 77 consecutive years.
Currently, Chrysler, Ford, and GM, now collectively referred to as the “Detroit Three,” find themselves in dire straits. The financial crisis that began in 2007 and the accompanying sharp deceleration of vehicle sales during 2008 raise serious challenges for all automakers. The current troubles of the Detroit Three, however, are also rooted in longer-term trends. In this article, I look at the history of the three Detroit automakers from their heyday in the 1950s through the present, providing a helpful context for analyzing the current situation. I illustrate in broad strokes how the Detroit automakers lost nearly half of the market they once dominated.
The auto industry has changed in many ways since the mid-1950s. The emergence of government regula-tion for vehicle safety and emissions, the entry of for-eign producers of auto parts and vehicles, a dramatic improvement in the quality of vehicles produced, and the implementation of a different production system stand out. Part of the transformation of the North American auto industry has been a remarkable decline of market power for the Detroit automakers over the past five-plus decades (see figure 1).
The industrial organization literature suggests that market shares can be a useful initial step in ana-lyzing the competitiveness of an industry (see, for example, Carlton and Perloff, 1990, p. 739).1 By that metric, the U.S. auto industry of the 1950s and 1960s was highly concentrated among a small number of companies and therefore not very competitive. On the one hand, the substantial market share decline experi-enced by the Detroit carmakers since then represents an increase in competition, resulting in more choices, tremendously improved vehicle quality, and increased vehicle affordability for consumers. On the other hand, the shift in market share from Detroit’s carmakers to foreign-headquartered producers has had important regional economic implications. Traditional locales of automotive activity in the Midwest continue to de-cline as communities located in southern states, such as Kentucky and Tennessee, have seen a sizable in-flux of auto-related manufacturing activity.2 For ex-ample, between 2000 and 2008, the U.S. auto industry (that is, assembly and parts production combined), shed over 395,000 jobs; 42 percent of these job losses occurred in Michigan alone.3 These regional effects of the auto industry restructuring were heightened by the sharp industry downturn during 2008.
Today, the Detroit Three are fighting for their very survival in the face of a rapid cyclical downturn that extends to all major markets. No carmaker has been shielded from the economic downturn. Even Toyota faces a downgrade of its long-term corporate credit rating. Yet the Detroit Three entered this recession at

�Federal Reserve Bank of Chicago
less than full strength, as they were already grappling with serious structural problems, such as the sizable legacy costs of their retired employees and their over-dependence on sales of large cars and trucks. In that way, cyclical and structural issues are currently intermingled.
It turns out that the decline in the U.S. market share of the Detroit automakers took place in several distinct phases. By the end of the 1960s, imports had established a solid foothold in the U.S. market, capturing nearly 15 percent of sales. The 1979 oil shock accom-panied by a severe downturn in the economy saw a fast increase in the share of imports from 18 percent in 1978 to 26.5 percent just two years later. As a result, the three Detroit carmakers’ market share fell to 73 percent for the first time (see figures 1 and 2). Chrysler narrowly avoided bankruptcy by successfully petitioning for gov-ernment support in 1979–80. During the following de-cade and a half, the fortunes of Chrysler, Ford, and GM as a group stabilized with the emergence of light trucks—such as minivans, sport utility vehicles (SUVs), and pickup trucks—as a popular and fast-growing seg-ment of the auto market.4 The Detroit carmakers aver-aged around 72 percent of total light vehicle sales—that is, sales of passenger cars and light trucks—in the U.S. market between 1980 and 1996.5 The most recent epi-sode of steadily (and, over the past three years, rather quickly) declining market share began in the mid-1990s.6 Foreign producers started to compete in the light truck segment, the last remaining stronghold of domestic
carmakers, while continuing to make inroads in the passenger car segment. Starting in 1998, the price of gasoline was rising again, after having been essentially flat for over a decade. As gas prices approached $4.00 per gallon at the beginning of the summer of 2008, the Detroit carmakers were scrambling to adjust to the rapid switch by consumers to smaller, more fuel-efficient vehicles. In combination with the ongoing market share loss, the sharp downturn of vehicle sales experienced during the second half of 2008 pushed the Detroit car-makers to the brink of extinction. The seriousness of the situation was highlighted when Chrysler and GM asked for federal government aid to stave off bankruptcy toward the end of 2008 and again in February 2009.
In this article, I discuss in detail how the Detroit automakers lost their dominance of the U.S. auto mar-ket. My key insight is that the decline in the fortunes of the Detroit automakers took place in three distinct phases: the mid-1950s to 1980, 1980 to 1996, and 1996 to 2008 (see figure 1).7 I also draw on evidence such as changes in the automakers’ profitability and bond ratings to illustrate the decline of the Detroit Three. In describing how the U.S. auto industry has evolved since the mid-1950s, my aim is to provide a historical frame of reference for the ongoing debate about the future of this industry.
Literature review
The industrial organization literature includes a number of studies examining the business decisions
FIguRE 1
The Detroit Three’s U.S. market share, 1955–2008
Notes: The Detroit Three are Chrysler LLC, Ford Motor Company, and General Motors Corporation. Over the 1955–79 period, the market share is measured for passenger cars only. From 1980 onward, it is measured for light vehicles (both passenger cars and light trucks, such as minivans, sport utility vehicles, and pickup trucks). The shaded areas indicate official periods of recession as identified by the National Bureau of Economic Research; the dashed vertical line indicates the most recent business cycle peak.Sources: Author’s calculations based on data from Ward’s Automotive Yearbook, various issues; Ward’s AutoInfoBank; and White (1971).
40
50
60
70
80
90
100
1956 ’60 ’64 ’68 ’72 ’76 ’80 ’84 ’88 ’92 ’96 2000 ’04 ’08
percent
� �Q/�009, Economic Perspectives
of the Detroit automakers from 1945 through the early 1980s. White (1972) explains in great detail how for-eign carmakers first entered the U.S. market during the second half of the 1950s by offering small cars. Impor-tantly, according to a report by the National Academy of Engineering and National Research Council (1982), at that time small cars were just as expensive to pro-duce as large cars for the Detroit carmakers; as a result, the domestic automakers were not able to compete profitably with the foreign producers in this market segment. Kwoka (1984) argues that the concentration of market power among Chrysler, Ford, and GM during the 1950s and 1960s influenced their response to com-petition in the following decades. This concentration of market power, Kwoka (1984, p. 509) writes, “ren-dered the companies vulnerable to outside forces and ultimately induced responses that proved damaging to the entire U.S. industry.” Since the Detroit carmakers had such great market power back then, they were complacent and not quick to change their automo-biles to match their new competitors’ innovations and the public’s changing tastes during the 1970s. Writing in the mid-1980s, Kwoka (1984, p. 521) contends that, “there seems abundant reason for continuing concern over the long-run competitive properties of the U.S. auto industry.”
Related literature focuses on structural changes in the industry. Womack, Jones, and Roos (1990) document the arrival of lean manufacturing techniques and their implications for competition in the auto industry. Lean manufacturing is a production system pioneered in Japan. It emphasizes production quality, speedy response to market conditions, low levels of inventory, and frequent deliveries of parts (Klier, 1994). Baily et al. (2005) attempt to measure the contribution of lean manufacturing to productivity improvements in the auto industry.8 Rubenstein (1992) illustrates how the market for motor vehicles has become more fragmented as the number of sales per individual model has fallen. He goes on to show how that particular trend helped reconcentrate the geography of car pro-duction in North America. Helper and Sako (1995) highlight the growing role of automaker–supplier re-lations, especially as a source of competitive advantage for certain automakers. McAlinden (2004; 2007a, b) provides analysis of the relations between the Detroit automakers and their principal union, the United Auto Workers (UAW),9 as they grappled with the issue of legacy costs of their retirees early in the twenty-first century. McCarthy (2007) presents an environmental history of the automobile, highlighting the interplay of consumer preferences, government regulations, and the business interests of carmakers. Klier and Linn (2008)
estimate the demand for fuel efficiency by consumers and suggest that up to half of the market share decline of the Detroit carmakers between 2002 and 2007 can be attributed to the rising price of gasoline. Klier and McMillen (2008) analyze the evolving geography of the motor vehicle parts sector. They document the emergence of “auto alley,” a north–south corridor in which the industry is concentrated. Auto alley ex-tends from Detroit to the Gulf of Mexico, with fingers reaching into Ontario, Canada.
Furthermore, a number of popular business books document the struggles of the U.S. automakers over the past two decades (for example, Ingrassia and White, 1994; and Maynard, 2003). As I mentioned previously, my contribution to this vast and varied literature is to further detail how the Detroit automakers lost their dominance of the U.S. automobile market in three distinct phases: the mid-1950s to 1980, 1980 to 1996, and 1996 to 2008. In the subsequent sections, I discuss what happened in each of these phases.
From mid-1950s to 1980: Imports and oil prices challenge Detroit
The dominance of Chrysler, Ford, and GM in the U.S. automobile market peaked in 1955, when their market share reached 94.5 percent.10 The three com-panies continued to dominate the U.S. auto industry for many years, yet their collective influence slowly began to wane.
Imports first make inroadsWhile the three Detroit automakers had more
than once considered producing small cars since 1945, they regularly dismissed these plans as being unprof-itable. In addition, neither Chrysler, Ford, nor GM wanted to enter the market for small cars on its own. The Detroit automakers felt the market for small cars needed to be big enough to accommodate all three of them (White, 1972; and Kwoka, 1984). Gomez-Ibanez and Harrison (1982, pp. 319–320) suggest that, tradi-tionally, the U.S. carmakers had been insulated from international competition by catering to the domestic demand for larger and more luxurious cars than those made elsewhere. Higher per capita incomes, lower gaso-line prices, longer driving distances, and wider roads all accounted for the fact that vehicles purchased in the U.S. market tended to be larger than those in other mar-kets. Conversely, a foreign producer would be somewhat reluctant to produce a U.S.-style automobile that it could not sell in significant numbers in its home mar-ket. According to Gomez-Ibanez and Harrison (1982, p. 320), imported vehicles “thus were largely restricted to small cars (which could also be sold in the foreign

5Federal Reserve Bank of Chicago
producer’s home market) and sports or specialty cars (where economy of scale may be less important).”
It took the independent American carmakers (at the time they were the Nash-Kelvinator Corporation, Kaiser-Frazer Corporation, Willys-Overland Motors, and Hudson Motor Car Company) to introduce small cars during 1950.11 However, as White (1972, p. 184) noted, “by setting prices that were above those of full-size sedans, the independents virtually eliminated any chances that their small cars might succeed.” Only a few years later, during the mid-1950s, small cars made their first significant appearance in the U.S. market by way of imports (figure 2). As the U.S. economy moved into recession during the second half of 1957, small, inexpensive European cars quickly became very suc-cessful in the American marketplace.12 According to McCarthy (2007, p. 142), “a substantial change in consumer preferences took place between 1955 and 1959.” Led by Germany’s Volkswagen (VW) Beetle, imports rose quickly during the second half of the 1950s, reaching 10.1 percent of the U.S. market in 1959. At the time, imports represented 75 percent to 80 percent of smaller economy cars in the United States (McCarthy, 2007, p. 144).
The Detroit automakers respondThe Detroit automakers responded by first import-
ing products from their European subsidiaries during 1957. In the fall of 1959, they introduced domestically produced compact cars in the U.S. market, such as the Chevrolet Corvair, the Ford Falcon, and the Plymouth Valiant. These vehicles were significantly smaller than
what Detroit carmakers had offered before. Their strategy of producing compact cars succeeded, quickly pushing back the level of imports—they fell to 4.9 percent of the U.S. market in 1962.
However, starting in the mid-1960s, the Detroit carmakers decided to make their compacts slightly larger. According to a report by the National Academy of Engineering and National Research Council (1982, p. 70), “the large domestic companies sought to fill a segment of the market just above the imports in terms of price and size.” These new models were produced in the United States and first introduced through the car companies’ middle-level brands. Within a few years, the Detroit automakers’ low-priced compacts started to grow in size and cost. Kwoka (1984, p. 517) notes the following: “By 1966, the Corvair had grown by 3.8 inches, the Falcon by 3.1 inches, and the Valiant by 4.6 inches. By the end of the 1960s, these vehicles would weigh from 250 to 600 pounds more than at introduction, and it was doubtful consumers perceived them as small cars any longer.” White (1972, p. 189) suggests that this response was prompted by the obser-vation that many consumers who bought small cars were willing to pay a premium for a deluxe interior and exterior trim. In effect the Detroit automakers grew their “small” vehicles in size after having beaten back the original entry of foreign small cars; as McCarthy (2007, p. 145) contends, “Detroit’s commitment to this market went no further than stemming the inroads of the imports.” It is not surprising that the victory over imported small cars proved to be only temporary.13
FIguRE �
Foreign brand import share of U.S. passenger car sales, 1955–80
Source: Author’s calculations based on data from Ward’s Automotive Yearbook, various issues.
percent
0
5
10
15
20
25
30
1955 ’56 ’57 ’58 ’59 ’60 ’61 ’62 ’63 ’64 ’65 ’66 ’67 ’68 ’69 ’70 ’71 ’72 ’73 ’74 ’75 ’76 ’77 ’78 ’79 ’80
� �Q/�009, Economic Perspectives
Déjà vu Continued preference for small cars among con-
sumers prompted a second wave of import growth, beginning in the mid-1960s.14 Spearheaded by VW’s success, import sales began to rise again, surpassing the previous record in 1968, when they had reached 10.8 percent of the U.S. market (see figure 2, p. 5). In response, the Detroit automakers again initially im-ported products from Europe (White, 1972). Only two years later, Detroit introduced the first U.S.-made sub-compacts: the GM Vega (in September 1970); the Ford Maverick (in April 1969) and Pinto (in September 1970); and the American Motors Corporation (AMC) Hornet (in August 1969) and Gremlin (in February 1970).15
This time the Detroit carmakers’ product strategy was not able to lower the import penetration of foreign nameplate products. By the early 1970s, import brands had become quite entrenched in the U.S. market. They had established stronger dealer networks as well as a solid reputation for quality among consumers (Kwoka 1984, p. 517; and National Academy of Engineering and National Research Council, 1982, pp. 72–73). Looking back at Detroit’s response to the two waves of imports, Kwoka (1984, p. 517) writes that “the domestic small cars did, however, manage to halt the growth of imports for about five years.” Unlike in the early 1960s, the imports did not get beaten back this time. The early 1970s also saw the Japanese nameplate imports out-sell those of VW, which had pioneered the segment of the small car import with its Beetle car in the 1950s.16
Around the same time, the safety of automobiles, especially that of the Detroit automakers’ products, re-ceived widespread attention as a result of Ralph Nader’s 1965 book, Unsafe at Any Speed: The Designed-In Dangers of the American Automobile. Nader (1965) detailed the reluctance of American car manufactur-ers to improve vehicle safety. In the wake of the en-suing public debate, the federal government for the first time established safety as well as environmental standards for motor vehicles—for example, mandating standards for bumpers in 1973 or requiring the instal-lation of equipment such as the catalytic converter (a device used to reduce the toxicity of emissions from an internal combustion engine) in 1975.
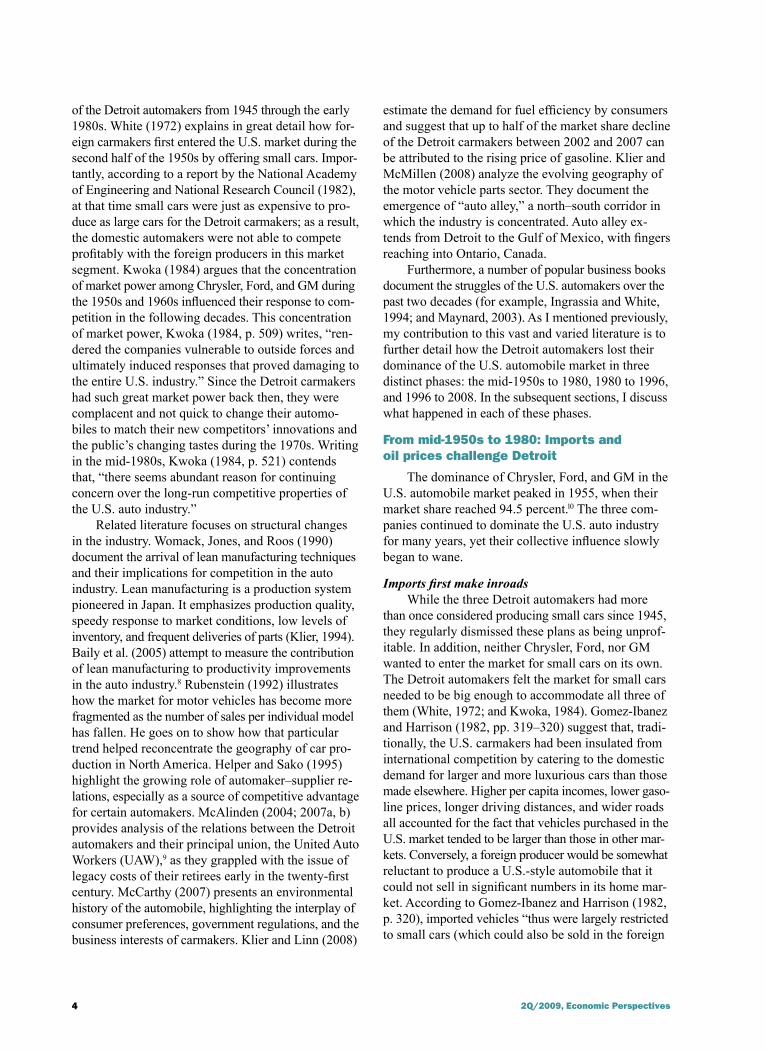
Similar to what the Detroit carmakers did with their compact cars introduced during the late 1950s, they grew their subcompacts launched during 1969 and 1970 in size and weight within a few years.17 In light of the two oil crises experienced during the 1970s, the timing of that decision was quite unfortunate. Be-tween October 1973 and May 1974, the real price of gasoline rose 28 percent. After flattening out, it increased again sharply during 1978 (figure 3). The market share of import brands started to grow again by the mid-1970s. It increased quite rapidly toward the end of the decade, breaking 25 percent for the first time in 1980 (figure 2, p. 5).
Consumers respondConsumers quickly responded to the rapid in-
crease in the price of gasoline following the Iran oil
FIguRE �
U.S. retail gasoline prices, 1970–2008
Notes: Real dollar values are in 2000 dollars. The shaded areas indicate official periods of recession as identified by the National Bureau of Economic Research; the dashed vertical line indicates the most recent business cycle peak.Sources: Author’s calculations based on data from the U.S. Department of Energy, Energy Information Administration; and White (1971).
dollars per gallon
0
0.5
1.0
1.5
2.0
2.5
3.0
3.5
1970 ’72 ’74 ’76 ’78 ’80 ’82 ’84 ’86 ’88 ’90 ’92 ’94 ’96 ’98 2000 ’02 ’04 ’06 ’08
Real
Nominal
�Federal Reserve Bank of Chicago
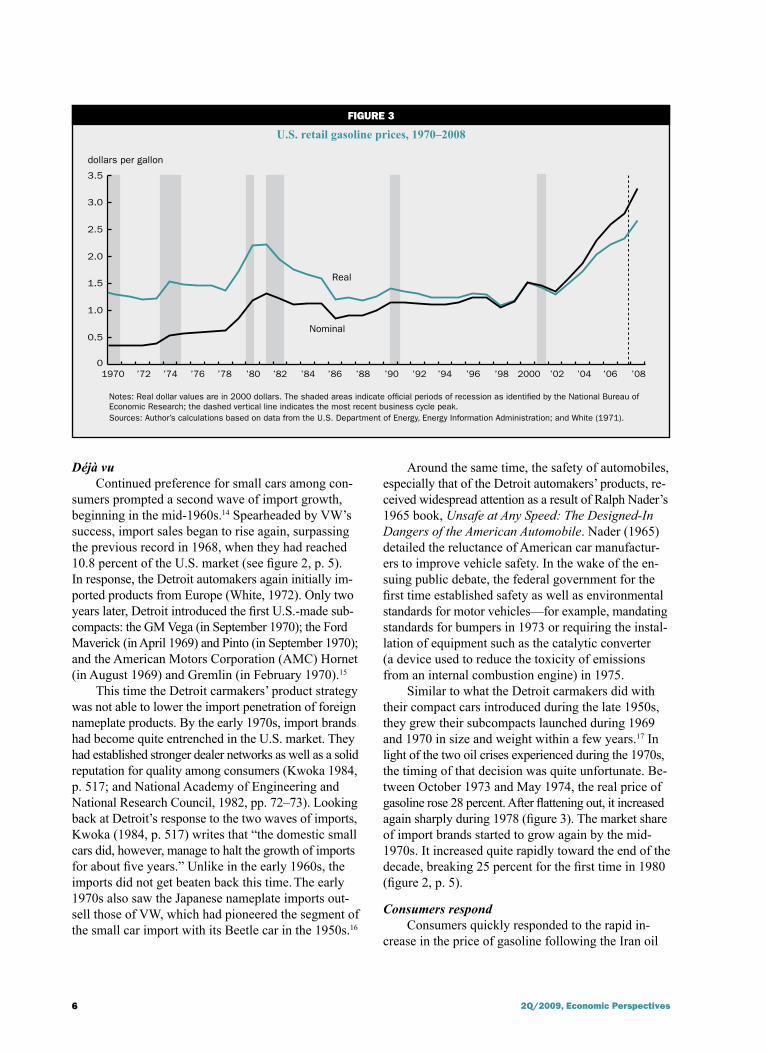
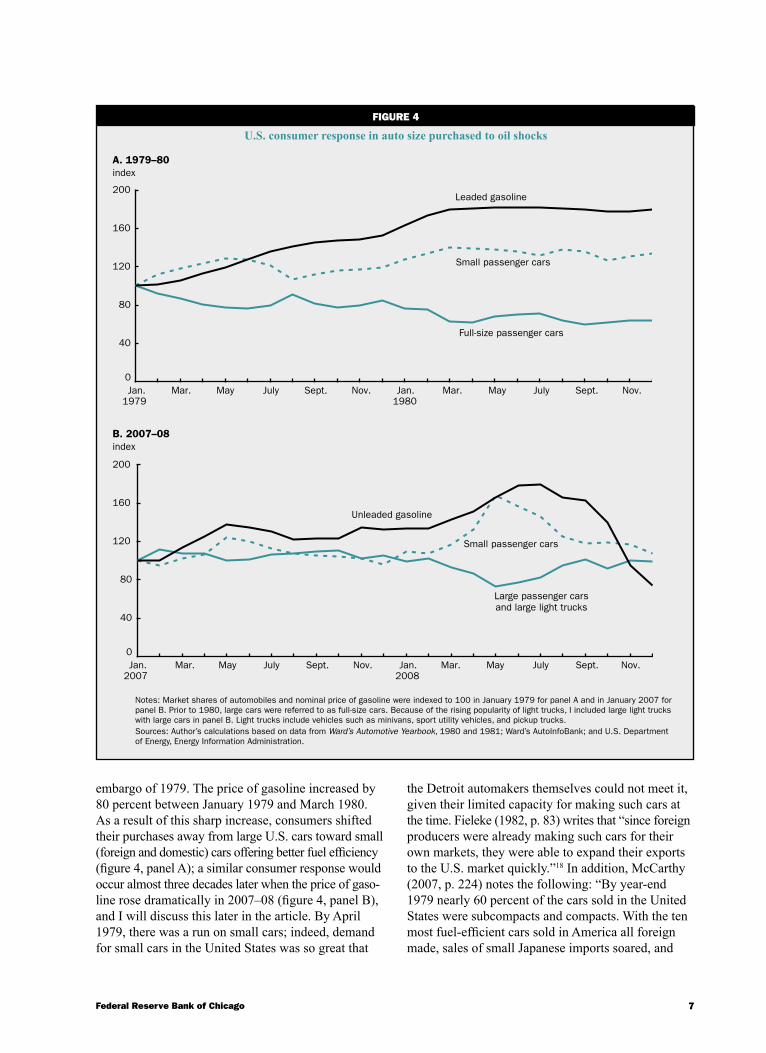
embargo of 1979. The price of gasoline increased by 80 percent between January 1979 and March 1980. As a result of this sharp increase, consumers shifted their purchases away from large U.S. cars toward small (foreign and domestic) cars offering better fuel efficiency (figure 4, panel A); a similar consumer response would occur almost three decades later when the price of gaso-line rose dramatically in 2007–08 (figure 4, panel B), and I will discuss this later in the article. By April 1979, there was a run on small cars; indeed, demand for small cars in the United States was so great that
the Detroit automakers themselves could not meet it, given their limited capacity for making such cars at the time. Fieleke (1982, p. 83) writes that “since foreign producers were already making such cars for their own markets, they were able to expand their exports to the U.S. market quickly.”18 In addition, McCarthy (2007, p. 224) notes the following: “By year-end 1979 nearly 60 percent of the cars sold in the United States were subcompacts and compacts. With the ten most fuel-efficient cars sold in America all foreign made, sales of small Japanese imports soared, and
4 FIguRE �
U.S. consumer response in auto size purchased to oil shocks
A. 1979–80index
Small passenger cars
0
40
80
120
160
200
Jan. Mar. May July Sept. Nov. Mar. May July Sept. Nov.Jan.1979 1980
B. 2007–08index
0
40
80
120
160
200
Jan. Mar. May July Sept. Nov. Mar. May July Sept. Nov.Jan.2007 2008
Notes: Market shares of automobiles and nominal price of gasoline were indexed to 100 in January 1979 for panel A and in January 2007 for panel B. Prior to 1980, large cars were referred to as full-size cars. Because of the rising popularity of light trucks, I included large light trucks with large cars in panel B. Light trucks include vehicles such as minivans, sport utility vehicles, and pickup trucks.Sources: Author’s calculations based on data from Ward’s Automotive Yearbook, 1980 and 1981; Ward’s AutoInfoBank; and U.S. Department of Energy, Energy Information Administration.
Leaded gasoline
Full-size passenger cars
Small passenger cars
Unleaded gasoline
Large passenger cars and large light trucks
8 �Q/�009, Economic Perspectives
foreign sales—70 percent of them by Japanese makers—approached the 25 percent market-share barrier for the first time.”
Foreign cars sold well in the United States not only because they offered better fuel efficiency, but also be-cause they were competitively priced and widely per-ceived to be of superior quality (Fieleke, 1982, p. 88). By the end of the 1970s, the Japanese automakers dominated the domestic producers in product quality ratings for every auto market segment, representing a formidable competitive advantage (National Academy of Engineering and National Research Council, 1982, p. 99). The quality gap between U.S.-produced cars and foreign cars was beyond dispute (Kwoka, 1984, p. 518).
Regulatory responseThe energy crisis subsequent to the 1973 Arab oil
embargo turned fuel economy into an important auto-mobile policy goal for the U.S. government (McCarthy, 2007, p. 217). In 1975, Congress imposed mandatory corporate average fuel economy (CAFE) standards for the first time. The standards were to become effec-tive by model year 1978 and result in an average fuel efficiency of passenger cars of 27.5 miles per gallon by 1985. To check for compliance, the U.S. Environmental Protection Agency was to test the vehicles in a lab and continues to do so today.
According to the CAFE requirements, for a given model year each manufacturer’s vehicles for sale in the United States are divided into three fleets: domestic passenger cars, foreign-produced passenger cars, and light trucks. Passenger cars were subject to a stricter fuel efficiency standard than light trucks.19 The origi-nal justification for establishing a different and more lenient fuel efficiency standard for light trucks was their primary usage as commercial and agricultural vehicles (Cooney and Yacobucci, 2005, p. 87). Subse-quently, the existence of two different standards has affected the ways in which new vehicles are designed (and classified).20
To sum up, by the early 1980s, foreign competi-tors had successfully challenged Chrysler, Ford, and GM in their home market, irrevocably changing the industry. Differences in product mix and product quality were key to the success of foreign carmakers. “The huge increase in the price of gasoline from 1979 to 1980 sharply exacerbated a long-run deterioration in the competitive position of the U.S. [auto] industry,” notes Fieleke (1982, p. 91). The auto sector, along with the rest of the economy, was pummeled by a severe recession; unit sales of motor vehicles fell by 18 per-cent from 1979 to 1980. Caught between competition from rising imports and a deteriorating economy, the
three Detroit automakers were reeling. Chrysler, on the verge of financial collapse, applied for federal loan guarantees in 1979 and received them in the amount of $1.5 billion in 1980 (Cooney and Yacobucci, 2005, p. 55). Ford and the UAW sought relief from the in-creased number of vehicle imports by filing a trade safeguard case in 1980. That request was denied by the U.S. International Trade Commission, which determined that imports were not the major cause of the industry’s troubles. Subsequently, a bill was proposed in 1981 that would have enacted quotas on motor vehicle imports from Japan. Following a suggestion by the Reagan administration, Japan instead agreed to impose a so-called voluntary export restraint, or VER.21
A National Academy of Engineering and National Research Council (1982, p. 4) report sums up the changes that had occurred in the U.S. auto industry during the 1970s and early 1980s as follows: “Com-petition in the U.S. auto industry has undergone fun-damental changes in the last 10 years, primarily because of increased market penetration by foreign manufac-turers and drastic shifts in the price of oil.”22
From 1980 to 199�: Detroit stages a comeback
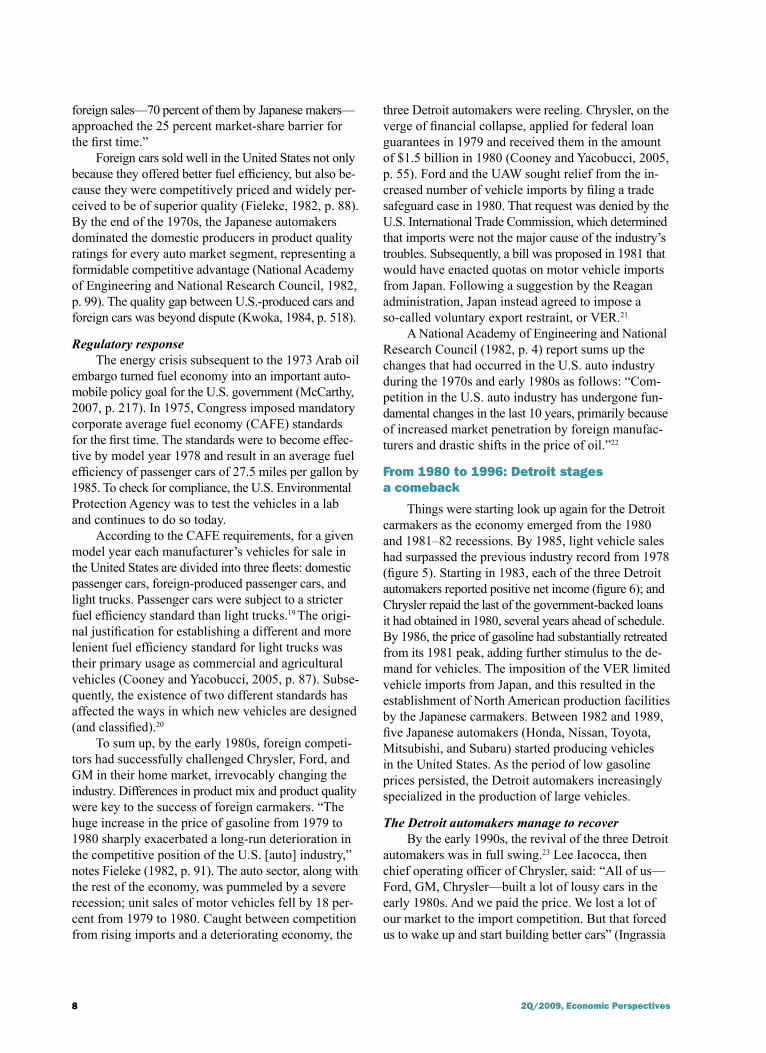
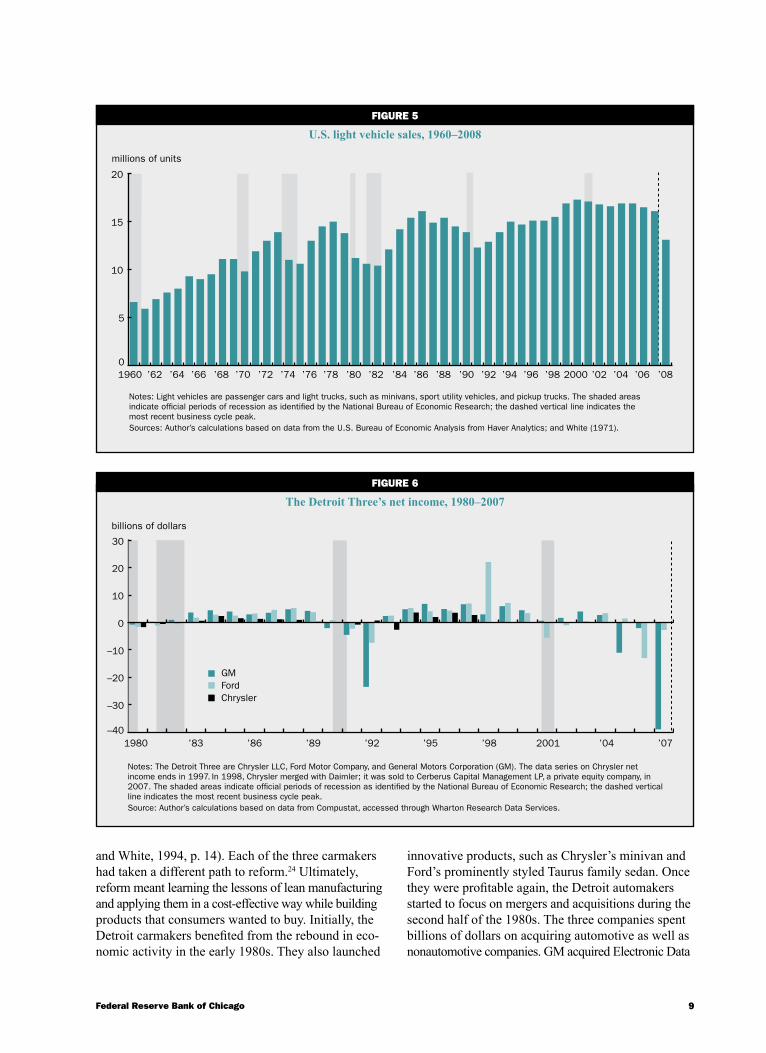
Things were starting look up again for the Detroit carmakers as the economy emerged from the 1980 and 1981–82 recessions. By 1985, light vehicle sales had surpassed the previous industry record from 1978 (figure 5). Starting in 1983, each of the three Detroit automakers reported positive net income (figure 6); and Chrysler repaid the last of the government-backed loans it had obtained in 1980, several years ahead of schedule. By 1986, the price of gasoline had substantially retreated from its 1981 peak, adding further stimulus to the de-mand for vehicles. The imposition of the VER limited vehicle imports from Japan, and this resulted in the establishment of North American production facilities by the Japanese carmakers. Between 1982 and 1989, five Japanese automakers (Honda, Nissan, Toyota, Mitsubishi, and Subaru) started producing vehicles in the United States. As the period of low gasoline prices persisted, the Detroit automakers increasingly specialized in the production of large vehicles.
The Detroit automakers manage to recoverBy the early 1990s, the revival of the three Detroit
automakers was in full swing.23 Lee Iacocca, then chief operating officer of Chrysler, said: “All of us—Ford, GM, Chrysler—built a lot of lousy cars in the early 1980s. And we paid the price. We lost a lot of our market to the import competition. But that forced us to wake up and start building better cars” (Ingrassia
9Federal Reserve Bank of Chicago
and White, 1994, p. 14). Each of the three carmakers had taken a different path to reform.24 Ultimately, reform meant learning the lessons of lean manufacturing and applying them in a cost-effective way while building products that consumers wanted to buy. Initially, the Detroit carmakers benefited from the rebound in eco-nomic activity in the early 1980s. They also launched
innovative products, such as Chrysler’s minivan and Ford’s prominently styled Taurus family sedan. Once they were profitable again, the Detroit automakers started to focus on mergers and acquisitions during the second half of the 1980s. The three companies spent billions of dollars on acquiring automotive as well as nonautomotive companies. GM acquired Electronic Data
FIguRE 5
U.S. light vehicle sales, 1960–2008
Notes: Light vehicles are passenger cars and light trucks, such as minivans, sport utility vehicles, and pickup trucks. The shaded areas indicate official periods of recession as identified by the National Bureau of Economic Research; the dashed vertical line indicates the most recent business cycle peak. Sources: Author’s calculations based on data from the U.S. Bureau of Economic Analysis from Haver Analytics; and White (1971).
millions of units
0
5
10
15
20
1960 ’72 ’74 ’76 ’78 ’80 ’82 ’84 ’86 ’88 ’90 ’92 ’94 ’96 ’98 2000 ’02 ’04 ’06 ’08’62 ’64 ’66 ’68 ’70
FIguRE �
The Detroit Three’s net income, 1980–2007
Notes: The Detroit Three are Chrysler LLC, Ford Motor Company, and General Motors Corporation (GM). The data series on Chrysler net income ends in 1997. In 1998, Chrysler merged with Daimler; it was sold to Cerberus Capital Management LP , a private equity company, in 2007. The shaded areas indicate official periods of recession as identified by the National Bureau of Economic Research; the dashed vertical line indicates the most recent business cycle peak.Source: Author’s calculations based on data from Compustat, accessed through Wharton Research Data Services.
billions of dollars
1980 ’83 ’86 ’89 ’92 ’95 ’98 2001 ’04 ’07–40
–30
–20
–10
0
10
20
30
GMFordChrysler
10 2Q/2009, Economic Perspectives
Systems (EDS) in 1984, as well as Hughes Aircraft in 1985. Chrysler bought Gulfstream in 1985 and AMC in 1987. All three automakers acquired major stakes in car rental companies during the late 1980s. Ford bought Jaguar in 1990, and GM acquired a majority of Saab in the same year. However, most of these transactions were unwound within a decade, and with the exception of the AMC acquisition,25 the car com-panies then acquired have since either been sold or are currently for sale. In any case, the acquisitions took up valuable time and attention of the companies’ management back then. And so the recovery of the three Detroit carmakers took twists and turns along the way. It also involved changes in top management and leadership. GM is a case in point.
During the early 1980s, GM’s leadership decided the best way to beat the foreign-based competition was to automate the production of automobiles when-ever possible with the help of sophisticated technology. As a result, the company invested heavily in new capital equipment. It turned out to be a costly experiment, since it raised GM’s cost structure to the point that its North American auto business was barely breaking even during the late 1980s—a time of very strong industry
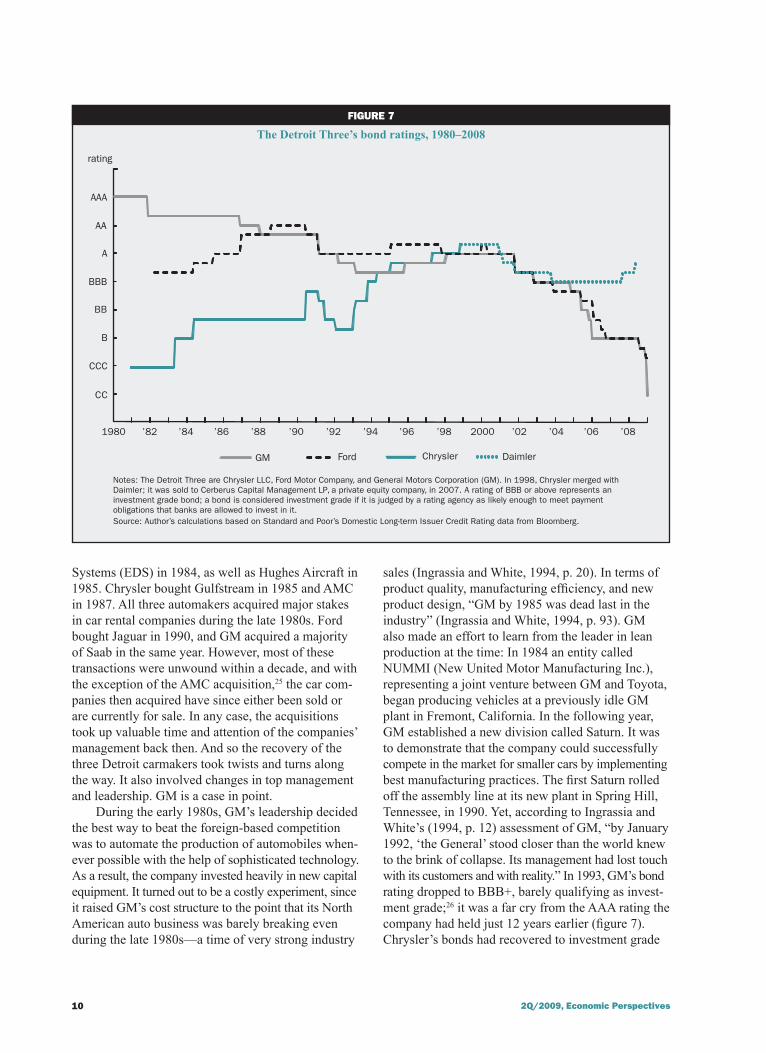
sales (Ingrassia and White, 1994, p. 20). In terms of product quality, manufacturing efficiency, and new product design, “GM by 1985 was dead last in the industry” (Ingrassia and White, 1994, p. 93). GM also made an effort to learn from the leader in lean production at the time: In 1984 an entity called NUMMI (New United Motor Manufacturing Inc.), representing a joint venture between GM and Toyota, began producing vehicles at a previously idle GM plant in Fremont, California. In the following year, GM established a new division called Saturn. It was to demonstrate that the company could successfully compete in the market for smaller cars by implementing best manufacturing practices. The first Saturn rolled off the assembly line at its new plant in Spring Hill, Tennessee, in 1990. Yet, according to Ingrassia and White’s (1994, p. 12) assessment of GM, “by January 1992, ‘the General’ stood closer than the world knew to the brink of collapse. Its management had lost touch with its customers and with reality.” In 1993, GM’s bond rating dropped to BBB+, barely qualifying as invest-ment grade;26 it was a far cry from the AAA rating the company had held just 12 years earlier (figure 7). Chrysler’s bonds had recovered to investment grade
figurE 7
The Detroit Three’s bond ratings, 1980–2008
Notes: The Detroit Three are Chrysler LLC, Ford Motor Company, and General Motors Corporation (GM). In 1998, Chrysler merged with Daimler; it was sold to Cerberus Capital Management LP , a private equity company, in 2007. A rating of BBB or above represents an investment grade bond; a bond is considered investment grade if it is judged by a rating agency as likely enough to meet payment obligations that banks are allowed to invest in it.Source: Author’s calculations based on Standard and Poor’s Domestic Long-term Issuer Credit Rating data from Bloomberg.
rating
AAA
AA
A
BBB
BB
B
CCC
CC
1980 ’02’98 2000 ’04 ’06 ’08’88 ’90 ’92 ’94 ’96’82 ’84 ’86
GM Ford Chrysler Daimler
11Federal Reserve Bank of Chicago
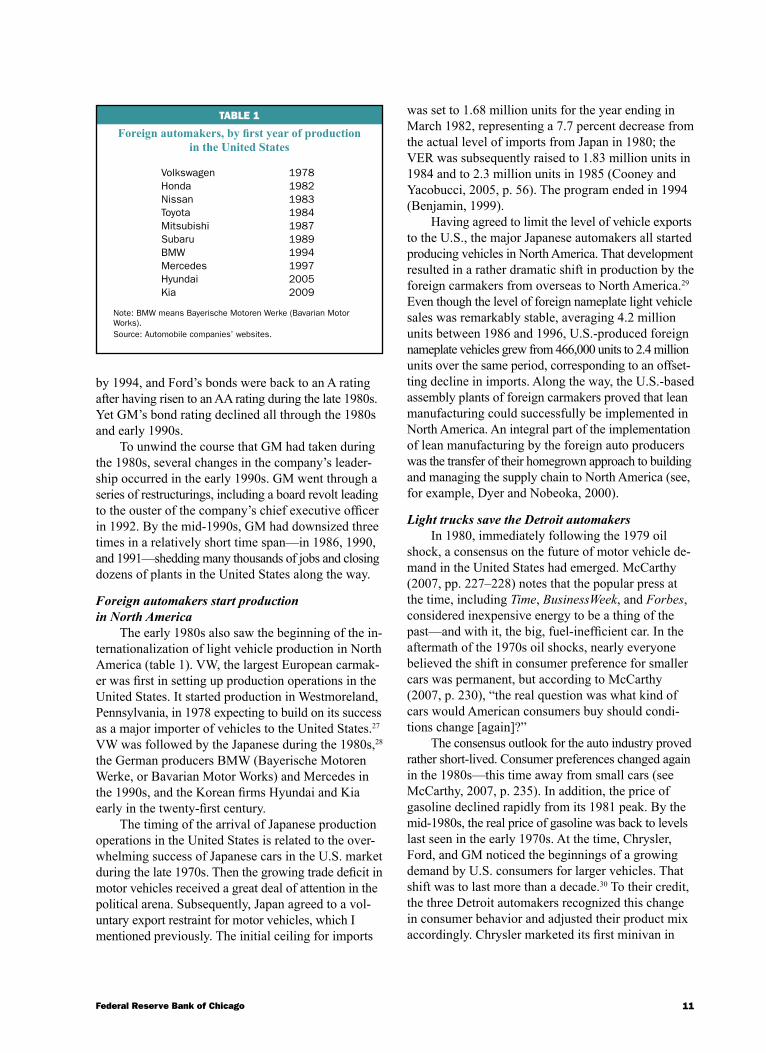
TaBLE 1
Foreign automakers, by first year of production in the United States
Volkswagen 1978 Honda 1982 Nissan 1983 Toyota 1984 Mitsubishi 1987 Subaru 1989 BMW 1994 Mercedes 1997 Hyundai 2005 Kia 2009
Note: BMW means Bayerische Motoren Werke (Bavarian Motor Works).Source: Automobile companies’ websites.
by 1994, and Ford’s bonds were back to an A rating after having risen to an AA rating during the late 1980s. Yet GM’s bond rating declined all through the 1980s and early 1990s.
To unwind the course that GM had taken during the 1980s, several changes in the company’s leader-ship occurred in the early 1990s. GM went through a series of restructurings, including a board revolt leading to the ouster of the company’s chief executive officer in 1992. By the mid-1990s, GM had downsized three times in a relatively short time span—in 1986, 1990, and 1991—shedding many thousands of jobs and closing dozens of plants in the United States along the way.
Foreign automakers start production in North America
The early 1980s also saw the beginning of the in-ternationalization of light vehicle production in North America (table 1). VW, the largest European carmak-er was first in setting up production operations in the United States. It started production in Westmoreland, Pennsylvania, in 1978 expecting to build on its success as a major importer of vehicles to the United States.27
VW was followed by the Japanese during the 1980s,28 the German producers BMW (Bayerische Motoren Werke, or Bavarian Motor Works) and Mercedes in the 1990s, and the Korean firms Hyundai and Kia early in the twenty-first century.
The timing of the arrival of Japanese production operations in the United States is related to the over-whelming success of Japanese cars in the U.S. market during the late 1970s. Then the growing trade deficit in motor vehicles received a great deal of attention in the political arena. Subsequently, Japan agreed to a vol-untary export restraint for motor vehicles, which I mentioned previously. The initial ceiling for imports
was set to 1.68 million units for the year ending in March 1982, representing a 7.7 percent decrease from the actual level of imports from Japan in 1980; the VER was subsequently raised to 1.83 million units in 1984 and to 2.3 million units in 1985 (Cooney and Yacobucci, 2005, p. 56). The program ended in 1994 (Benjamin, 1999).
Having agreed to limit the level of vehicle exports to the U.S., the major Japanese automakers all started producing vehicles in North America. That development resulted in a rather dramatic shift in production by the foreign carmakers from overseas to North America.29 Even though the level of foreign nameplate light vehicle sales was remarkably stable, averaging 4.2 million units between 1986 and 1996, U.S.-produced foreign nameplate vehicles grew from 466,000 units to 2.4 million units over the same period, corresponding to an offset-ting decline in imports. Along the way, the U.S.-based assembly plants of foreign carmakers proved that lean manufacturing could successfully be implemented in North America. An integral part of the implementation of lean manufacturing by the foreign auto producers was the transfer of their homegrown approach to building and managing the supply chain to North America (see, for example, Dyer and Nobeoka, 2000).
Light trucks save the Detroit automakers In 1980, immediately following the 1979 oil
shock, a consensus on the future of motor vehicle de-mand in the United States had emerged. McCarthy (2007, pp. 227–228) notes that the popular press at the time, including Time, BusinessWeek, and Forbes, considered inexpensive energy to be a thing of the past—and with it, the big, fuel-inefficient car. In the aftermath of the 1970s oil shocks, nearly everyone believed the shift in consumer preference for smaller cars was permanent, but according to McCarthy (2007, p. 230), “the real question was what kind of cars would American consumers buy should condi-tions change [again]?”
The consensus outlook for the auto industry proved rather short-lived. Consumer preferences changed again in the 1980s—this time away from small cars (see McCarthy, 2007, p. 235). In addition, the price of gasoline declined rapidly from its 1981 peak. By the mid-1980s, the real price of gasoline was back to levels last seen in the early 1970s. At the time, Chrysler, Ford, and GM noticed the beginnings of a growing demand by U.S. consumers for larger vehicles. That shift was to last more than a decade.30 To their credit, the three Detroit automakers recognized this change in consumer behavior and adjusted their product mix accordingly. Chrysler marketed its first minivan in
1� �Q/�009, Economic Perspectives
1983. Ford launched the Explorer, an SUV, in 1990; that year Ford produced more light trucks than cars at its U.S. assembly plants (Cooney and Yacobucci, 2005, p. 27). Light trucks turned out to be very profitable for the Detroit automakers. Foreign producers faced a 25 percent tariff on imported pickup trucks; yet they continued to focus on the production of cars in their North American plants.
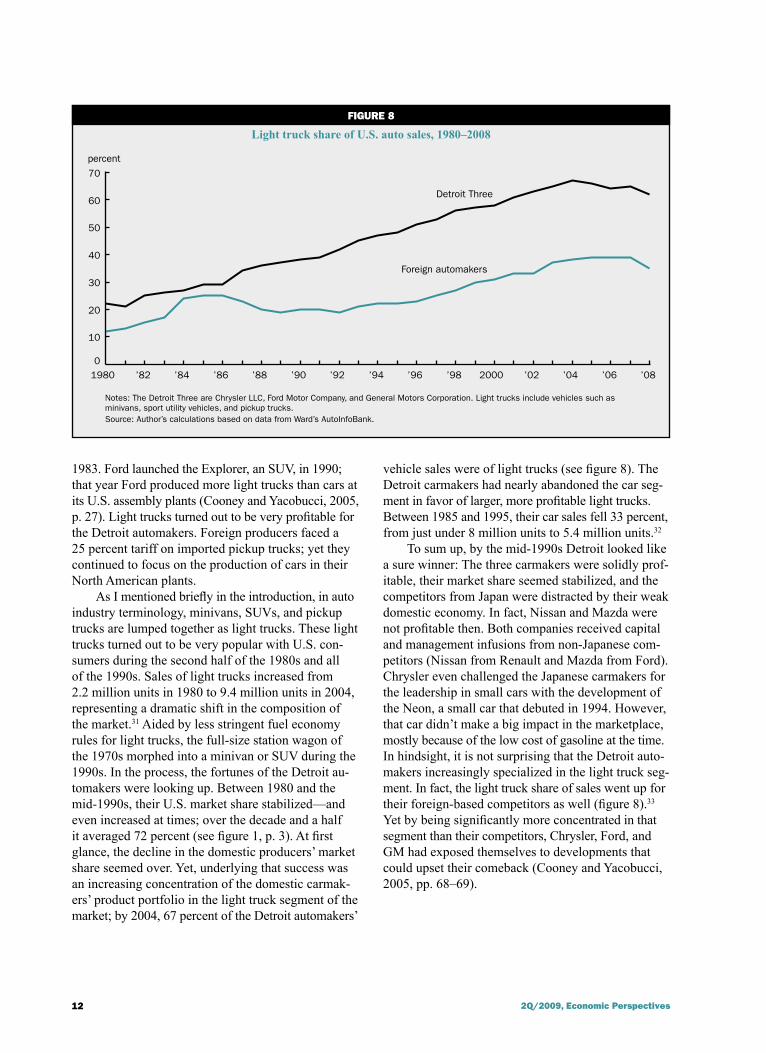
As I mentioned briefly in the introduction, in auto industry terminology, minivans, SUVs, and pickup trucks are lumped together as light trucks. These light trucks turned out to be very popular with U.S. con-sumers during the second half of the 1980s and all of the 1990s. Sales of light trucks increased from 2.2 million units in 1980 to 9.4 million units in 2004, representing a dramatic shift in the composition of the market.31 Aided by less stringent fuel economy rules for light trucks, the full-size station wagon of the 1970s morphed into a minivan or SUV during the 1990s. In the process, the fortunes of the Detroit au-tomakers were looking up. Between 1980 and the mid-1990s, their U.S. market share stabilized—and even increased at times; over the decade and a half it averaged 72 percent (see figure 1, p. 3). At first glance, the decline in the domestic producers’ market share seemed over. Yet, underlying that success was an increasing concentration of the domestic carmak-ers’ product portfolio in the light truck segment of the market; by 2004, 67 percent of the Detroit automakers’
vehicle sales were of light trucks (see figure 8). The Detroit carmakers had nearly abandoned the car seg-ment in favor of larger, more profitable light trucks. Between 1985 and 1995, their car sales fell 33 percent, from just under 8 million units to 5.4 million units.32
To sum up, by the mid-1990s Detroit looked like a sure winner: The three carmakers were solidly prof-itable, their market share seemed stabilized, and the competitors from Japan were distracted by their weak domestic economy. In fact, Nissan and Mazda were not profitable then. Both companies received capital and management infusions from non-Japanese com-petitors (Nissan from Renault and Mazda from Ford). Chrysler even challenged the Japanese carmakers for the leadership in small cars with the development of the Neon, a small car that debuted in 1994. However, that car didn’t make a big impact in the marketplace, mostly because of the low cost of gasoline at the time. In hindsight, it is not surprising that the Detroit auto-makers increasingly specialized in the light truck seg-ment. In fact, the light truck share of sales went up for their foreign-based competitors as well (figure 8).33 Yet by being significantly more concentrated in that segment than their competitors, Chrysler, Ford, and GM had exposed themselves to developments that could upset their comeback (Cooney and Yacobucci, 2005, pp. 68–69).
FIguRE 8
Light truck share of U.S. auto sales, 1980–2008
Notes: The Detroit Three are Chrysler LLC, Ford Motor Company, and General Motors Corporation. Light trucks include vehicles such as minivans, sport utility vehicles, and pickup trucks.Source: Author’s calculations based on data from Ward’s AutoInfoBank.
percent
1980 ’82 ’84 ’86 ’88 ’90 ’92 ’94 ’96 ’98 2000 ’02 ’04 ’06 ’080
10
20
30
40
50
60
70
Foreign automakers
Detroit Three
1�Federal Reserve Bank of Chicago
From 199� to �008: Detroit on the defensive—again
The foreign carmakers started to enter the U.S. light truck segment in earnest in the mid-1990s. For example, Honda launched its first minivan, the Odyssey, in 1995. Toyota began production of a full-size pick-up truck, the Tundra, in 1999. The Detroit automak-ers’ market share fell 26 percentage points from 1996 to the end of 2008, representing an average decline of just over 2 percentage points a year. Yet, industry sales volumes of light vehicles continued to rise until the year 2000 (see figure 5, p. 9). In fact, 1999 and 2000 were the two best-selling years for light vehicles. The rising sales volume enabled the Detroit carmakers to remain profitable despite the market share decline. Ford even acquired the car division of the Swedish company Volvo for nearly $6.5 billion in 1999. Yet the Detroit Three’s bond ratings were declining (fig-ure 7, p. 10). In fact, at the end of 2008, GM’s bond rating had fallen to CC, a full level below Chrysler’s bond rating in 1981. Detroit Three light truck sales leveled off in 1999 at 6.7 million units, while overall light truck sales continued to rise until 2004, to 9.4 million units.34 A remarkable run had come to an end.
Legacy costsThe U.S. auto industry nearly shrugged off the 2001
recession. With the help of clever incentive programs, such as “zero percent financing,” light vehicle sales in 2001 barely dipped below the record set the year before (see figure 5, p. 9). In fact, sales between 1999 and 2007 were above 16 million units per year, representing a period of unprecedented sales and production volume in this industry. Yet the long-term bond ratings of the Detroit carmakers continued to fall as they were hobbled by structural labor cost issues (see figure 7, p. 10). After years of shedding workers, the carmakers were left with a work force of long tenure as well as a large number of retirees who were able to draw on benefits negotiated during their active employment.35
In 2007, the Detroit carmakers negotiated a new labor agreement with the UAW. These contracts began to address the issue of legacy costs, which are primarily projected health care costs for retirees. The ratified contracts included agreements on the establishment of so-called VEBAs (voluntary employees’ beneficiary associations), which are independently administered trusts that are established with funds from the Detroit carmakers. The VEBAs were designed to take responsi-bility for retiree health care liabilities starting in 2010. The 2007 labor contracts also included agreements on a so-called second-tier wage for new hires.36 It was designed to allow the labor cost structure to be brought
in line with that of the foreign producers. Yet, in the overall declining market experienced since, as well as in the continuing decline in the Detroit Three’s market share, there has been little hiring at the lower wage rate, despite several rounds of employee buyout pro-grams offered by each of the Detroit carmakers. This has prolonged the period of relatively higher labor costs for the Detroit carmakers. According to the terms of the financing provided by the federal government in December 2008, the structure of the Detroit carmakers’ labor costs was one of the issues that needed to be addressed going forward.37 The onset of the current recession necessitated a less incremental approach to reforming the cost structure of the Detroit Three auto-makers than what had been agreed to in 2007.
Price of gasoline rises and segment shift ends era of big cars (trucks)—again
The Detroit automakers’ market share decline accelerated as the price of gasoline—which had inexora-bly inched up since the late 1990s—rose dramatically in 2007 and the first half of 2008, right as the overall economy began to soften (figure 3, p. 6). The rising cost of refueling a vehicle brought fuel efficiency con-siderations to the forefront of consumers’ minds once again. In fact, the consumer response to the increase in the price of gasoline in 2007–08 very closely re-sembled the consumer response to the 1979–80 oil price shock (see figure 4, p. 7). While the specific timing of the rise in the price of gasoline differs somewhat in the two episodes, the price of gasoline rose 80 per-cent in 1979–80 as well as in 2007–08. Consumers responded by purchasing more small cars and fewer large cars in both cases.
As a result, the Detroit Three quickly had to reverse course to meet the changing demand. For example, in 2007 and 2008, Toyota’s hybrid, the Prius, outsold the Ford Explorer by a factor of 1.6.38 It appeared once again as if the foreign producers had the upper hand. The abil-ity to quickly adjust production to meet demand emerged as a key competitive factor in light of this sudden shock facing the auto industry. The Japanese producers were importing small cars from production facilities around the world. The fact that the euro had appreciated substan-tially against the U.S. dollar prevented U.S. carmakers from quickly being able to draw on their European product offerings for the U.S. market.
During the second half of 2008, economic condi-tions worsened quickly. As consumer confidence was plunging to new depths, light vehicle sales rates dropped to barely above 10 million units on a seasonally ad-justed annual basis during the fourth quarter.39 The year ended with Chrysler and GM, as well as their financ-ing arms Chrysler Financial and GMAC (General
1� �Q/�009, Economic Perspectives
NOTES
Motors Acceptance Corporation), receiving nearly $25 billion in financial assistance from the federal government (for a detailed recap of the events, see Cooney et al., 2009). In light of further declines in auto sales during January and February of 2009, Chrysler and GM asked for additional assistance in mid-February, when they submitted their business plans to the U.S. Department of the Treasury.40 As this issue goes to press in early May 2009, Chrysler filed for Chapter 11 bank-ruptcy protection, having failed to reach an agreement on restructuring its debt—a key element in shaping a viable business plan by April 30, 2009, the deadline set by the federal government.41
Conclusion
In this article, I have illustrated in some detail how the Detroit Three’s market power in the U.S. auto industry eroded over the course of the past five-plus
1Additional factors to consider are the proper definition of the market of interest, possible barriers to entry into the market, and the dynamics of oligopoly discipline.
2See Klier and McMillen (2006).
3These numbers are my calculations based on data from the U.S. Bureau of Labor Statistics via Haver Analytics.
4A light truck, or light-duty truck, is a classification for trucks or truck-based vehicles with a payload capacity of less than 4,000 pounds.
5These are my calculations based on data from various issues of Ward’s Automotive Yearbook, as well as Ward’s AutoInfoBank (database by subscription).
6Detroit Three market share in 1996 stood at 74 percent. By 2005, it had fallen to 58 percent. By the end of 2008, it was down to 48 percent (see figure 1).
7The three periods were chosen based on trends in market shares.
8Baily et al. (2005, p. 11) attribute the largest contribution to auto sector productivity growth in the U.S. between 1987 and 2002 to process improvements in existing plants, such as the implementa-tion of lean manufacturing.
9The UAW’s full name is the International Union, United Automobile, Aerospace, and Agricultural Implement Workers of America.
10The year 1955 was also the breakthrough year for the German automaker Volkswagen (VW) in the United States; sales of the VW Beetle almost doubled from 28,907 in 1954 to 50,011 in 1955, repre-senting 55 percent of all auto imports at the time (McCarthy, 2007, p. 133).
11In early 1954, the Nash-Kelvinator Corporation and the Hudson Motor Car Company merged to form American Motors Corporation (AMC), which was headquartered in the Detroit area.
decades. The decline took place in three distinct phas-es: the mid-1950s to 1980, 1980 to 1996, and 1996 to 2008. The presence of foreign carmakers, the price of gasoline, and the emergence of light trucks played major roles in this transition. Today, even the terminology has adjusted to the new reality: Chrysler, Ford, and GM are now referred to as the Detroit Three (no longer as the Big Three), since the market structure in the U.S. automobile industry has changed from a Big Three model to a “Big Six” model.42 Today’s U.S. auto indus-try is also much more international, with ten foreign-headquartered automakers producing light vehicles in the United States.43 A period of remarkable dominance by a few companies in a large industry had come to an end at the beginning of the twenty-first century.
12Ironically, at the same time, cars produced by the Detroit Three were growing bigger and more expensive (White, 1972, p. 184).
13Kwoka (1984) suggests that the three Detroit carmakers’ strategy can be explained as “dynamic limit pricing.” Such a strategy can apply in a situation where a dominant firm or group of firms has little or no cost advantage over a fringe. Its long-run profit-maximiz-ing strategy therefore is to raise prices and thereby permit growth of the fringe, since doing this would at least initially result in ex-cess profit (Kwoka, 1984, pp. 512–513).
14According to a report by the National Academy of Engineering and National Research Council (1982, p. 70), “the rise of the small car reflected fundamental demographic trends (increased suburbaniza-tion, shifts in the age structure, changes in female labor participation) and the growth of multicar families.” The years in which import shares rose again, 1965–71, also marked a period in which domestic small cars were being redesigned into larger vehicles (Kwoka, 1984).
15McCarthy (2007). Chrysler, at the time, imported its subcompacts: The Plymouth Cricket was produced in England, and the Dodge Colt was built for Chrysler in Japan by Mitsubishi.
16By 1975, Toyota was the leading import brand, ahead of Volkswagen.
17A National Academy of Engineering and National Research Council (1982, p. 3) report suggests that the three Detroit carmakers’ response to imports of small cars had been “conditioned by a legacy of large-car production. Large cars were associated with luxury and prestige and commanded premium prices; in terms of cost, however, small cars were just about as expensive to make; the result: small cars, small profits.”
18In line with what Fieleke (1982) states, in 1980 Abraham Katz, then Assistant Secretary of Commerce, made the following obser-vation in testimony to the U.S. House of Representatives’ Committee on Ways and Means: “Early in 1979 … a sudden disruption in OPEC [Organization of the Petroleum Exporting Countries] oil shipments and large OPEC price increases led quickly to sharp increases in the price of gasoline and to renewed gas station lines. … Consumers reacted by shifting toward small, fuel-efficient cars. Small car sales
15Federal Reserve Bank of Chicago
32In 2002, foreign nameplate cars outsold domestic nameplate cars for the first time. By 2008, domestic nameplates represented only 35 percent of all U.S. auto sales. See note 31 for source.
33For example, early in the twenty-first century, Toyota built an assembly plant in San Antonio, Texas, that was dedicated to the production of the Tundra, its full-size pickup truck.
34These numbers are from Ward’s AutoInfoBank.
35See Cooney (2005) for a comparison of the steel and auto industries with regard to legacy costs. McAlinden (2007b) calculates the health care costs for active and retired employees per vehicle produced in 2005 to amount to $1,268 for GM and $945 for Ford.
36All entry hires’ base wages were set to range between $11.50 and $16.23 per hour, nearly half of the hourly base wage according to the existing pay scale (McAlinden, 2007a).
37On March 11, 2009, Ford announced that it had reached an agree-ment with the UAW on labor cost savings amounting to $500 million annually. According to the new agreement, Ford’s compensation (including benefits, pensions, and bonuses) will be $55 per hour; that compares with $48 per hour paid by foreign automakers pro-ducing in the United States (Bennett and Terlep, 2009).
38This number is my calculation based on data from Ward’s AutoInfoBank.
39Ibid.
40On March 30, 2009, the Obama administration announced it had found the business plans submitted by Chrysler and GM to be not viable. The administration extended the original deadline of March 31, 2009, for the two automakers to demonstrate their future viability—by 30 days for Chrysler and by 60 days for GM. Both companies were required to draw up more aggressive restruc-turing plans by their new respective deadlines. Until then, Chrysler and GM would be provided with working capital if needed. The administration’s assessment stated that, absent more drastic re-structuring, the two carmakers’ “best chance of success may well require utilizing the bankruptcy court in a quick and surgical way.” See www.whitehouse.gov/assets/documents/Fact_Sheet_GM_Chrysler_FIN.pdf.
41For more details on Chrysler entering bankruptcy, see www.whitehouse.gov/the_press_office/Obama-Administration-Auto- Restructuring-Initiative/.
42The Big Six consist of Chrysler, Ford, GM, Honda, Nissan, and Toyota.
43Despite the increase in the number of companies selling vehicles in the United States, the share of vehicles produced in North America since 1980 has remained remarkably stable at approximately 80 percent, according to my calculations using data from Ward’s AutoInfoBank.
jumped to a 57 percent share of the market in 1979. U.S. small car production ran virtually at capacity, but was unable to keep up with demand. With an inadequate supply of domestic small cars, many con-sumers turned to imports, the traditional source of small, fuel-efficient cars. Their present success in the United States is a case of being in the right place at the right time with the right product” (Katz, 1980).
19For cars, the standard stands at 27.5 miles per gallon for model year 2009; for light trucks, the standard is set at 23.1 miles per gallon for model year 2009 (Yacobucci, 2009).
20A set of stricter fuel efficiency regulations, CAFE II, was passed by Congress in December 2007. It established a new fleet average fuel efficiency standard of 35 miles per gallon by the model year 2020. While CAFE II will likely impose significant costs to meet compliance, it is not clear how individual carmakers will be affected, since the rules for implementing the new law have not been released yet (Yacobucci and Bamberger, 2008, p. 1).
21See Cooney and Yacobucci (2005, p. 56).
22Incidentally, increased foreign competition influenced the decision by the Federal Trade Commission to end its five-year antitrust investigation of automobile manufacturing in the United States (Fieleke, 1982, p. 89).
23This section draws on Ingrassia and White (1994).
24See Ingrassia and White (1994) for a wealth of examples describing the three companies’ travails during the 1980s.
25The Jeep brand is all that survived into the twenty-first century from what was once AMC.
26A bond is considered investment grade if it is judged by a rating agency as likely enough to meet payment obligations that banks are allowed to invest in it.
27These expectations were not borne out as VW closed that plant in 1989. The company recently announced its return to the United States as a producer. It will build a new assembly operation in Chattanooga, Tennessee, to begin production by 2010.
28Honda started producing cars in central Ohio in 1982. In 1989, its family sedan, the Honda Accord, became the best-selling car in the United States.
29According to my analysis using data from Ward’s AutoInfoBank, foreign nameplate vehicles represented 6 percent of U.S. production in 1985; 13 percent in 1990; 22 percent in 2000; and 41 percent in 2008.
30The groundswell of interest in sport utility vehicles began in 1983 (McCarthy, 2007, p. 233).
31By 1990, the share of light trucks among light vehicle sales had risen to 35 percent, according to my analysis using data from Ward’s AutoInfoBank. Between 2001 and 2008, light truck sales represented more than half the market.
1� �Q/�009, Economic Perspectives
Baily, Martin Neil, Diana Farrell, Ezra Greenberg, Jan-Dirk Henrich, Naoko Jinjo, Maya Jolles, and Jaana Remes, 2005, Increasing Global Competition and Labor Productivity: Lessons from the U.S. Automotive Industry, McKinsey Global Institute, report, November.
Benjamin, Daniel K., 1999, “Voluntary export re-straints on automobiles,” PERC Reports, Property and Environment Research Center, Vol .17, No. 3, September, pp. 16–17, available at www.perc.org/ articles/article416.php.
Bennett, Jeff, and Sharon Terlep, 2009, “Ford pact to even out labor costs with Toyota’s,” Wall Street Journal, March 12, available at http://online.wsj.com/article/SB123677910696394787.html, accessed on March 17, 2009.
Carlton, Dennis W., and Jeffrey M. Perloff, 1990, Modern Industrial Organization, New York: Harper Collins.
Cooney, Stephen, 2005, “Comparing automotive and steel industry legacy cost issues,” CRS Report for Congress, Congressional Research Service, No. RL33169, November 28.
Cooney, Stephen, James M. Bickley, Hinda Chaikind, Carol A. Pettit, Patrick Purcell, Carol Rapaport, and Gary Shorter, 2009, “U.S. motor vehicle industry: Federal financial assistance and restructuring,” CRS Report for Congress, Congressional Research Service, No. R40003, March 31.
Cooney, Stephen, and Brent D. Yacobucci, 2005, “U.S. automotive industry: Policy overview and re-cent history,” CRS Report for Congress, Congressional Research Service, No. RL32883, April 25.
Dyer, Jeffrey H., and Kentaro Nobeoka, 2000, “Creating and managing a high-performance knowl-edge-sharing network: The Toyota case,” Strategic Management Journal, Vol. 21, No. 3, March, pp. 345–367.
Fieleke, Norman S., 1982, “The automobile industry,” ANNALS of the American Academy of Political and Social Science, Vol. 460, No. 1, March, pp. 83–91.
Gomez-Ibanez, Jose A., and David Harrison, Jr., 1982, “Imports and the future of the U.S. automobile industry,” American Economic Review, Vol. 72, No. 2, May, pp. 319–323.
Helper, Susan, and Mari Sako, 1995, “Supplier rela-tions in Japan and the United States: Are they con-verging?,” Sloan Management Review, Vol. 36, No. 3, pp. 77–84.
Ingrassia, Paul, and Joseph B. White, 1994, Comeback: The Fall and Rise of the American Automobile Industry, New York: Simon and Schuster.
Katz, Abraham, 1980, statement of Assistant Secretary of Commerce for International Economic Policy before the Subcommittee on Trade, Committee on Ways and Means, U.S. House of Representatives, Washington, DC, March 18, quoted in National Academy of Engineering and National Research Council (1982, p. 12).
Klier, Thomas H., 1994, “The impact of lean manufacturing on sourcing relationships,” Economic Perspectives, Federal Reserve Bank of Chicago, Vol. 18, No. 4, July/August, pp. 8–18.
Klier, Thomas H., and Joshua Linn, 2008, “The price of gasoline and the demand for fuel efficiency: Evidence from monthly new vehicles sales data,” University of Illinois at Chicago, mimeo, September.
Klier, Thomas H., and Daniel P. McMillen, 2008, “Evolving agglomeration in the U.S. auto supplier in-dustry,” Journal of Regional Science, Vol. 48, No. 1, pp. 245–267.
__________, 2006, “The geographic evolution of the U.S. auto industry,” Economic Perspectives, Federal Reserve Bank of Chicago, Vol. 30, No. 2, Second Quarter, pp. 2–13.
Kwoka, John E., Jr., 1984, “Market power and market change in the U.S. automobile industry,” Journal of Industrial Economics, Vol. 32, No. 4, June, pp. 509–522.
Maynard, Micheline, 2003, The End of Detroit: How the Big Three Lost Their Grip on the American Car Market, New York: Doubleday.
McAlinden, Sean P., 2007a, “Initial thoughts on the 2007 GM/UAW labor agreement,” Center for Automotive Research, presentation, October 12.
__________, 2007b, “The big leave: The future of automotive labor relations,” presentation at the Center for Automotive Research breakfast briefing, Ypsilanti, MI, February 20.
REFERENCES
1�Federal Reserve Bank of Chicago
__________, 2004, “The meaning of the 2003 UAW–automotive pattern agreement,” Center for Automotive Research, report, June, available at www.cargroup.org/pdfs/LaborPaperFinal.pdf, accessed on October 15, 2007.
McCarthy, Tom, 2007, Auto Mania: Cars, Consumers, and the Environment, New Haven, CT: Yale University Press.
Nader, Ralph, 1965, Unsafe at Any Speed: The Designed-In Dangers of the American Automobile, New York: Grossman Publishers.
National Academy of Engineering, Committee on Technology and International Economic and Trade Issues of the Office of the Foreign Secretary, Auto-mobile Panel; and National Research Council, Commission on Engineering and Technical Systems, 1982, The Competitive Status of the U.S. Auto Industry: A Study of the Influences of Technology in Determining International Industrial Competitive Advantage, Washington, DC: National Academy Press.
Rubenstein, James M., 1992, The Changing U.S. Auto Industry: A Geographical Analysis, New York: Routledge.
White, Lawrence J., 1972, “The American automo-bile industry and the small car, 1945–70,” Journal of Industrial Economics, Vol. 20, No. 2, April, pp. 179–192.
__________, 1971, The Automobile Industry since 1945, Cambridge, MA: Harvard University Press.
Womack, James P., Daniel T. Jones, and Daniel Roos, 1990, The Machine that Changed the World, New York: Rawson Associates.
Yacobucci, Brent D., 2009, email message to Thomas H. Klier, March 23.
Yacobucci, Brent D., and Robert Bamberger, 2008, “Automobile and light truck fuel economy: The CAFE standards,” CRS Report for Congress, Congressional Research Service, No. RL33413, May 7.