Embed Size (px)
Citation preview

Cement Solutions I:
From the Research Lab to the Production Plant – Cost Savings with Automated Quantitative X-ray Diffraction

Welcome
Today’s TopicsNew challenges in cement productionUse of powder X-ray Diffraction (XRD) in controlling cement production
Speakers
Holger CordesSenior Applications Scientist, XRDMadison, WI
Arkady BumanTechnical Sales Support, XRF Madison, WI

Accurate clinker phase determination using alternative fuelsMill controlAdditive control in blended cementsQuantification of Lime stone additionsQuantification of Pozzolan admixtures, such as flyash, blast furnace slags, and silica fumeQuantification of raw materials
New Challenges in Cement Production

Rutil (yellow)Anatas (black)
Why X-ray Diffraction?
Example: TiO2 (Anatase / Rutil)
BOTH ARE 100% TiO2

Anatase
25 30 35 40 45 50 55 60
21063
10532
0
P o w d e r C e l l 2 . 2
Anatase
10
1
10
3
00
4
11
2
20
0
20
2
10
5
21
1
21
3
20
4
25 30 35 40 45 50 55 60
6033
016
P o w d e r C e l l 2 . 2
Rutile
10
1
20
0
11
1
21
0
21
1
22
0
00
2
Rutil
Structure XRD Pattern
Tetragonal TiO2
Trigonal TiO2
Phase
Why X-ray Diffraction?

Each crystalline phase has a distinctive pattern (“fingerprint")
QUALITATIVE PHASE ID
Intensity of the reflections from a phase are proportional to the concentration of the phase in the mixture
QUANTITATIVE PHASE ANALYSIS
The width of the reflection is a function of the crystallinityof the phase
WHY DO WE NEED TO KNOW THIS?
Why X-ray Diffraction?
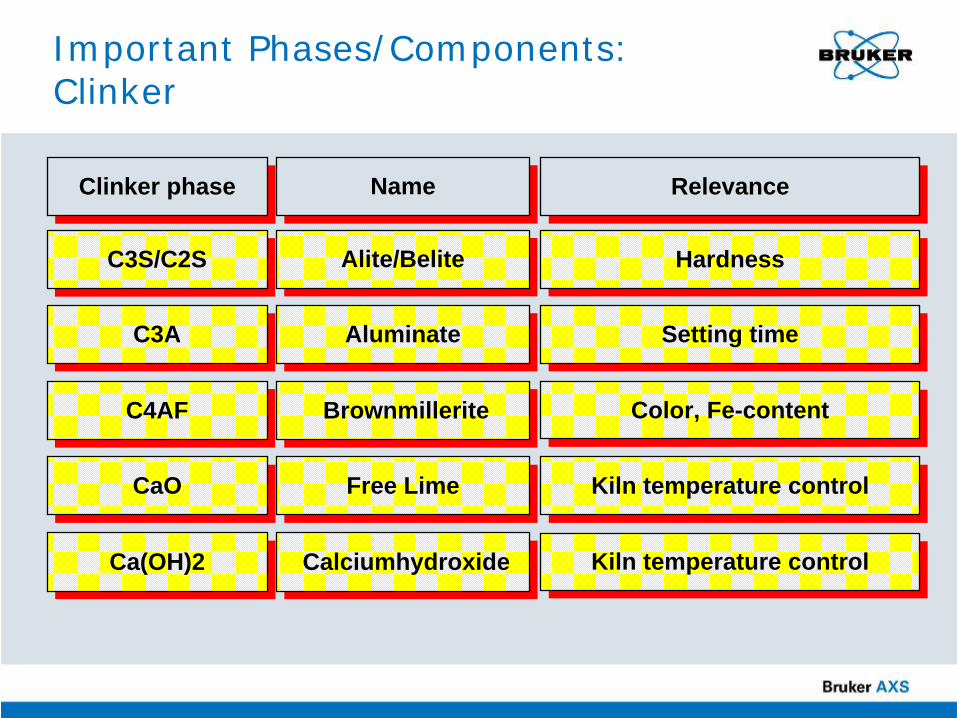
Important Phases/Components: Clinker
Alite/BeliteAlite/Belite
AluminateAluminate
BrownmilleriteBrownmillerite
C3S/C2SC3S/C2S
C3AC3A
C4AFC4AF
Clinker phaseClinker phase
CaOCaO
Ca(OH)2Ca(OH)2
NameName
Free LimeFree Lime
CalciumhydroxideCalciumhydroxide
HardnessHardness
Setting timeSetting time
Color, Fe-contentColor, Fe-content
RelevanceRelevance
Kiln temperature controlKiln temperature control
Kiln temperature controlKiln temperature control

Important Phases/Components: Cement
CalciteCalcite
Periclase / DolomitePericlase / Dolomite
CaCO3CaCO3
Mg phasesMg phases
Cement phaseCement phase
CaSO4·xH2OCaSO4·xH2O
NameName
Gypsum PhasesGypsum Phases
Limestone addition 3%Limestone addition 3%
Mg-rich quarriesMg-rich quarries
RelevanceRelevance
Dehydration / setting timeDehydration / setting time
Amorphous PhaseAmorphous PhaseGlassGlass CEM III / ReactivityCEM III / Reactivity
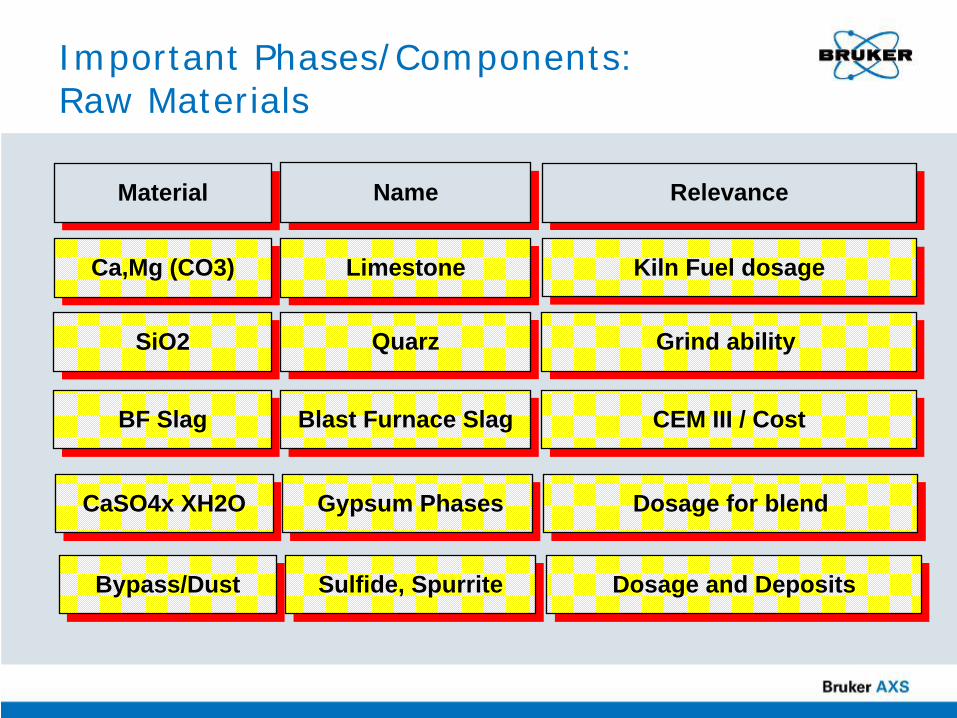
Important Phases/Components: Raw Materials
QuarzQuarz
Blast Furnace SlagBlast Furnace Slag
SiO2SiO2
BF SlagBF Slag
MaterialMaterial
Ca,Mg (CO3)Ca,Mg (CO3)
NameName
LimestoneLimestone
Grind ability Grind ability
CEM III / CostCEM III / Cost
RelevanceRelevance
Kiln Fuel dosageKiln Fuel dosage
Gypsum PhasesGypsum PhasesCaSO4x XH2OCaSO4x XH2O Dosage for blendDosage for blend
Sulfide, SpurriteSulfide, SpurriteBypass/DustBypass/Dust Dosage and DepositsDosage and Deposits

Please use your mouse to answer the question on the right of your screen:
What methods are you currently using for phase determination? (Check all that apply):
Freelime by titration onlyXRD channel in systemPowder X-ray Diffraction MicroscopyBogue calculationNone
Audience Poll
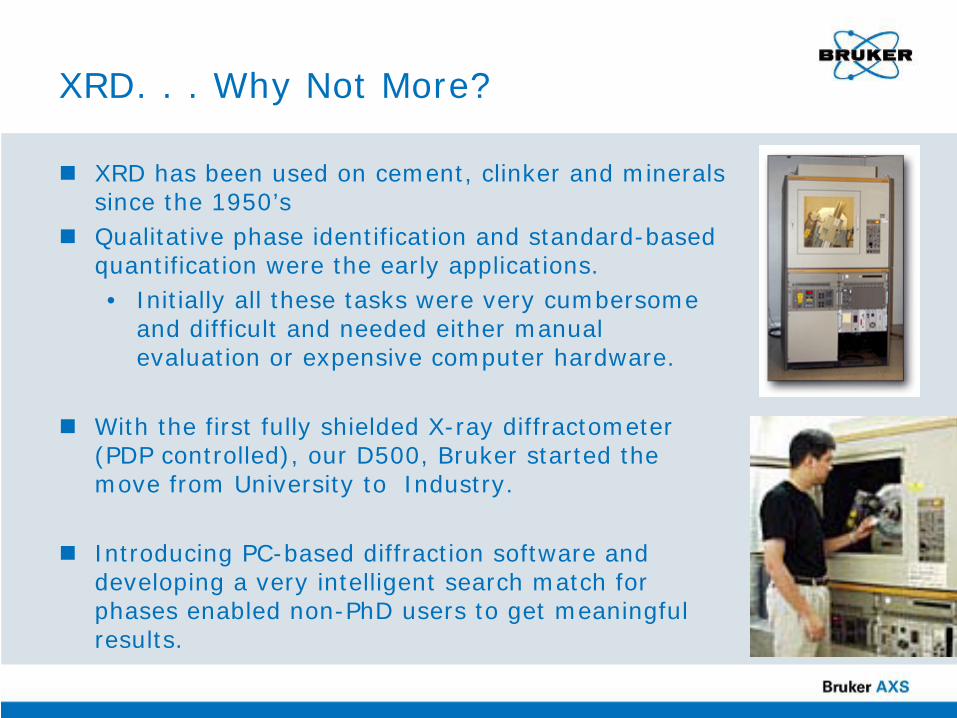
XRD. . . Why Not More?
XRD has been used on cement, clinker and minerals since the 1950’sQualitative phase identification and standard-based quantification were the early applications.• Initially all these tasks were very cumbersome
and difficult and needed either manual evaluation or expensive computer hardware.
With the first fully shielded X-ray diffractometer(PDP controlled), our D500, Bruker started the move from University to Industry.
Introducing PC-based diffraction software and developing a very intelligent search match for phases enabled non-PhD users to get meaningful results.

XRD. . . More and More
Quantitative XRD in the past could only be done using either internal standards (RIR) or by calibration with reference material.Standard (reference) based approach• Very similar to XRF approach• One or more peaks are unique to a phase and
are not overlapped • Relationship between Intensity and
Concentration is developed by measuring characterized reference samples using the same parameters
This works very well for simple systems such as CaO Freelime or the limestone addition or Respirable Quartz• Characteristic peaks are available and not
overlapped• Reference materials can be characterized
(titration) or mixed

13
X-ray Diffraction Systems for Powders
D8 ADVANCE: modular, expandable research system
D4 ENDEAVOR: compact system, high throughput, quality control, automation ready

Methods for Quantitative XRD Classical Reference Material Based

I
%
Quantitative XRD Phase Analysis Conventional Quantitative Analysis
measurement range

Solid Solution Effects Schematical Representation
Lin
(Cou
nts)
0
1000
2000
3000
4000
5000
6000
7000
8000
9000
10000
11000
12000
13000
14000
15000
16000
17000
2-Theta - Scale
28.5 29 30 31 32 33 34 35
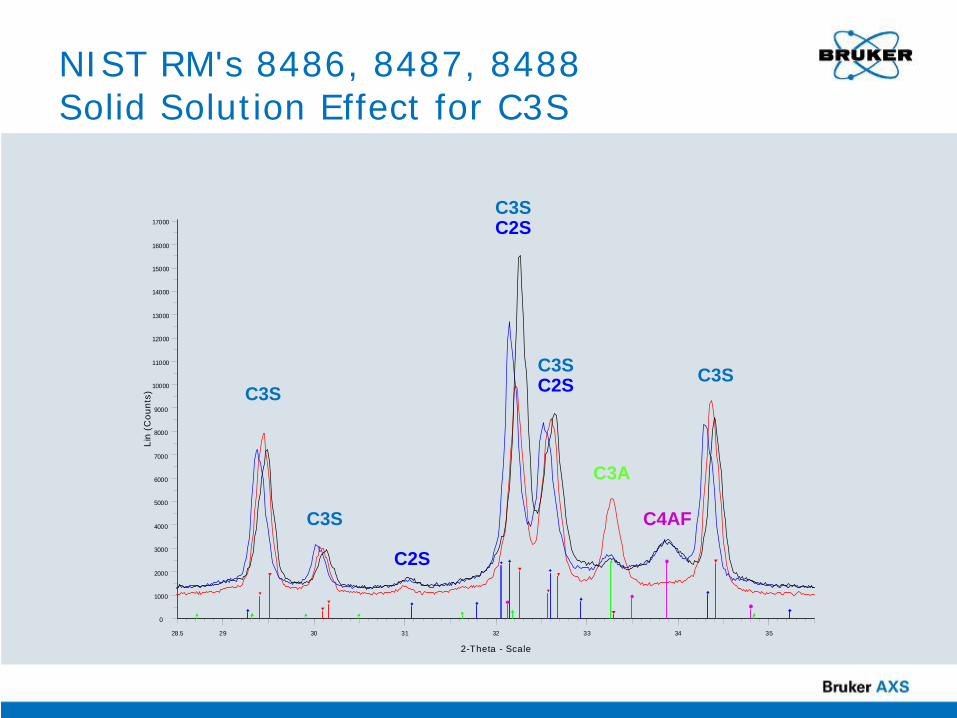
NIST RM's 8486, 8487, 8488 Solid Solution Effect for C3S
C3S
C3S
C3S
C3SC2S
C3SC2S
C2S
C3A
C4AF

Preferred Orientation Effects Schematical Representation
Randomly oriented powder Highly textured sample
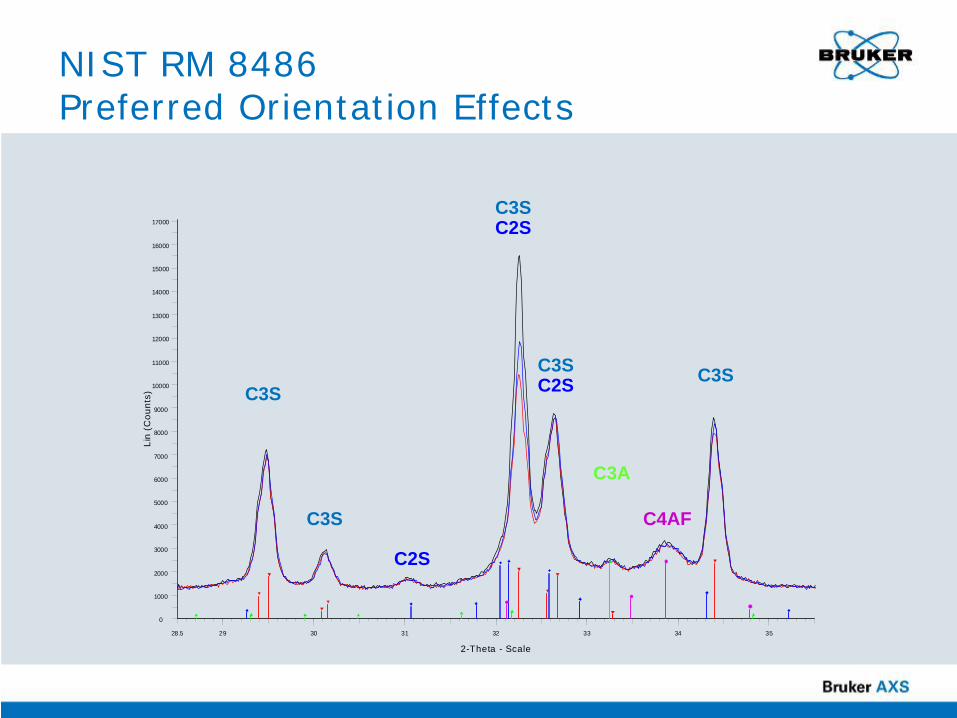
NIST RM 8486 Preferred Orientation Effects
C3S
C3S
C3S
C3SC2S
C3SC2S
C2S
C3A
C4AF
Lin
(Cou
nts)
0
1000
2000
3000
4000
5000
6000
7000
8000
9000
10000
11000
12000
13000
14000
15000
16000
17000
2-Theta - Scale
28.5 29 30 31 32 33 34 35

NIST RM's 8486, 8487, 8488 Conclusions
Alite (C3S) exhibits strong peak shifts due to changes in chemical composition and varying intensities due to changes in both chemical composition and preferred orientation effects
o C3A and C4AF clearly remain at the same positionsThe various background of the patterns is directly related to the various iron content of the clinkers
o Abundance of C4AF
Reliable clinker quantification is impossible using traditional XRD methods

Lin
(Cou
nts)
0
1000
2000
3000
4000
5000
6000
7000
8000
9000
10000
11000
12000
13000
14000
15000
16000
17000
2-Theta - Scale
28.5 29 30 31 32 33 34 35
Can a “Classical” Approach Work Here?
C3S
C3S
C3S
C3SC2S
C3SC2S
C2S
C3A
C4AF
NIST RM's 8486, 8487, 8488 Solid Solution Effect for C3S

Quantification Without Standards
The Rietveld method generates a calculated diffraction pattern from the phase list and their structures, that is compared with the observed data.The differences between observed and calculated diffraction patterns are minimized using least-squares procedures.
Observed pattern
Calculated pattern
Difference
Refinement

Methods for Quantitative XRD Rietveld Method 2
The Rietveld method:
A direct standardless full-pattern approach to quantitative phase analysis• No standards• No calibration
Independent of equipment and sample properties such as tube aging, solid solution effects, and preferred orientation• No drift correction required

More and More. . .
Lots of calculations required, as well as many parameters, limited the application to mainframes and Unix workstations (1994)• (none to be found in a cement plant)• Time to result for a sample > 120 minutes best case
The Rietveld “Refinement” uses many parameters; turn-on sequence and values need to be constrained to create meaningful results• Solid background in crystallography is required• Interactive type approach • Refinement needs to be tuned to instrument to empirically
determine the instrument response function to constrain some refinement parameters
Faster and faster PC’s allowed this technique to mature (e.g. ZEROQUANT on 1997, WINRIET), but still an expert was needed to control it, with time to result still > 15 minutes

Breakthrough. . . Changed the Industry
Using the PC platform and adapting the code to utilize Fundamental Parameters to describe the instrument function, new software was born.Instead of a parameter turn-on sequence and pure interactive approach, it uses a phase list and recipe and does not require ANY user input during its run.
TOPAS

TOPAS Standardless Quant
Time C3S C2S C3A C4AF MgONIST 58,47 23,18 1,15 13,68 3,21D8 Standard 38 min 57,14 22,39 2,13 14,31 4,03D5000Matic PSD 38 min 57,00 23,08 2,00 14,13 3,78D5000Matic PSD 19 min 57,08 22,95 2,05 14,16 3,75D5000Matic PSD 3,8 min 58,02 22,06 1,99 14,20 3,72
The unique TOPAS allows fully automated quantitative phase analysis from XRD data without any user input.
Typical calculation times are << 30s for a Pentium III
2003!

Quantitative Clinker Analysis No Standards, No Calibration (TOPAS!)
NIST RM 8488 – analytical performanceMean results plus precision (10 measurements)D4 ENDEAVOR, measurement time: 4 min (PSD) Benchmark in 2003
CompoundAlite C3S 64,77 (0,36) 64,97 (0,56) 57Belite C2S 19,51 (0,28) 18,51 (0,58) 22Aluminate C3A 4,04 (0,44) 4,34 (1,35) 7Ferrite C4AF 11,71 (0,43) 12,12 (1,50) 12
NIST (wt%)TOPAS (wt%) Bogue (wt%)
Very Easy. . .

Quantitative Phase Analysis of Cements: Quality and Process Control
Clinker• actual clinker composition• distinction of different C3 A modifications• distinction between Free Lime and MgO• understanding color changes in clinker by determination of actual C3 S and C4 AF composition• possibility to determine clinker grindability
Real phases, no Bogue assumption
Can you get this in 5 minutes by microscopy and with the same accuracy?

Please use your mouse to answer the question on the right of your screen:
How do you check the grinding time for your cement?
o Blaine/Fineness o DTA/TGo Fixed Timeo No check…
Audience Poll

Quantitative Cement Analysis. . . Fast

Quantitative Cement Analysis: Direct Calculation, No Interaction!
64626058565452504846444240383634323028262422201816141210
3,500
3,000
2,500
2,000
1,500
1,000
500
0
-500
-1,000
-1,500
C3S monoclinic (NISHI) 65.38 %C2S beta (MUMME) 7.97 %C3A Na orthorhombic 6.61 %C3A cubic 1.41 %C4AF Colville 8.68 %Peric lase 1.73 %Lime 0.24 %Arcanite K2SO4 1.82 %Gypsum 2.53 %Bassanite Bezou 0.58 %Portlandite 2.19 %Calcite 0.88 %
TOPAS. . . No turn-on sequence, automated!

Mill Control Real Composition of Gypsum Phases
What happens to the gypsum “additive” during milling?• Gypsum can loose “water” when ground too long -->
dehydration effect• Too high Bassanite will have detrimental effect• Too long milling will cost money; mill is a large factor in
energy consumption• All three sulfate phases have a different solubility• The ratio of the sulfates controls the setting behavior of the
cement• The production process influences the sulfates as cement
milling• Dehydrates gypsum to bassanite or even anhydrite• Typically in process control only the total SO3 content is
monitored by XRF

Sulfates in Cement with TOPAS
TOPASHkl approach
From RR data

Quantitative Phase Analysis of Cements Quality and Process Control
Cement• control of CO2 set points• control of dehydration characteristics in ball mill• control of amount of amorphous compounds• prediction of strength development in combination with other results• keeping a fingerprint of every sample as reference• check of competitor products

Quantification
of Blast Furnace
Slag
Cements
with
TOPAS

Quantification of Blast Furnace Slag Cements with TOPAS
2Th Degrees656055504540353025201510
Cou
nts
20,00019,00018,00017,00016,00015,00014,00013,00012,00011,00010,0009,0008,0007,0006,0005,0004,0003,0002,0001,000
0
How to quantify amorphous amounts like blast furnace slag in CEM III by Rietveld analysis?
We can calculate the crystalline phases
But how to handle amorhous humps as
indicated by the blue curve?
background

Quantification of Blast Furnace Slag Cements with TOPAS
Rietveld analysis can only take into account crystallinephases, which are normalized to 100 wt.% Using Rietveld analysis, amorphous phase abundancescan only be quantified by adding a standard (spikingmethod)In an automated plant laboratory this is not a favoredapproach or practical at all. It even would be an additional source of error.If the amorphous part of the slag could be treated as itsown phase, it could be seamlessly integrated into theRietveld analysis.

Measurement Data: Blast Furnace Slag
Sample: Slag sample of the VDZ Round Robin (2006): Material 1High quality blast furnace slag
2Th Degrees807570656055504540353025201510
Cou
nts
2,000
1,800
1,600
1,400
1,200
1,000
800
600
400
200
0
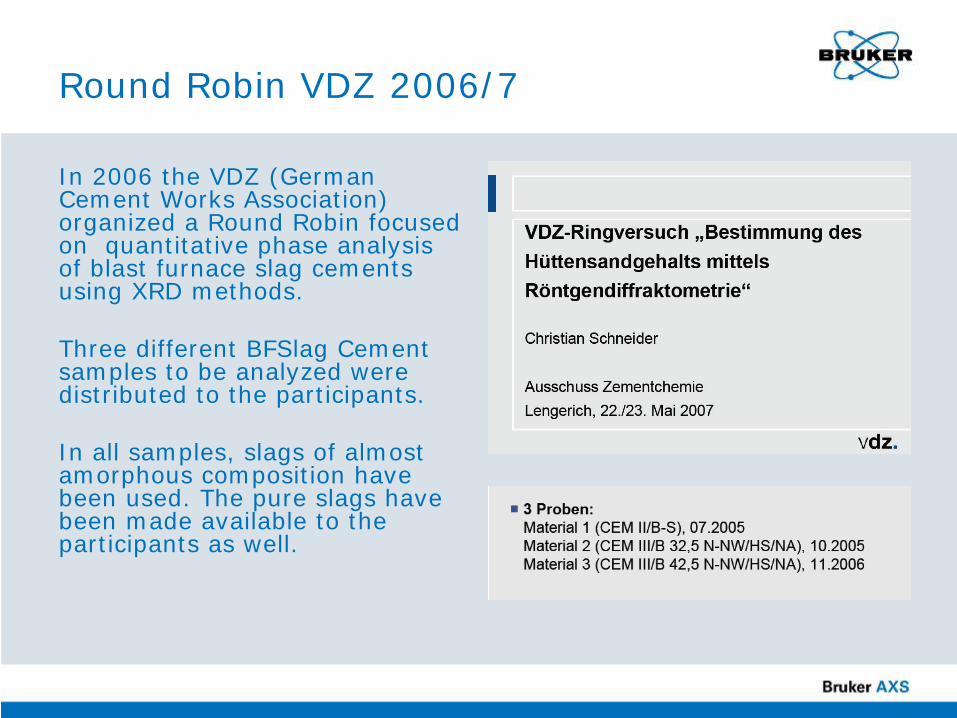
Round Robin VDZ 2006/7
In 2006 the VDZ (German Cement Works Association) organized a Round Robin focused on quantitative phase analysis of blast furnace slag cements using XRD methods.
Three different BFSlag Cement samples to be analyzed were distributed to the participants.
In all samples, slags of almost amorphous composition have been used. The pure slags have been made available to the participants as well.

Round Robin VDZ 2006/7
Results:Results reference
method

Application to the VDZ Round Robin Samples: Results
Accuracy
and Precision
(values
in wt. %, SD in brackets/1σ)
Every sample was measured 5 times (D4 ENDEAVOR, LynxEye Detector)The same emperical value for the mass of the hkl_phase was used for all samplesReference values:• sample 1: 25,0 wt.% • sample 2: 67,0 wt.%• sample 3: 72,0 wt.%
Sample 1 Sample 2 Sample 3
Measurement 1 25,0 67,2 71,7Measurement 2 25,1 67,3 71,9Measurement 3 24,7 67,0 71,6Measurement 4 25,1 67,3 71,9Measurement 5 25,3 67,0 71,5Mean 25,1 67,2 71,7SD 0,2 0,2 0,2
Effects can be seen which other methods do not detect at all (Bogue) or only after long analysis (microscopy)Control of the alkali mass flow (C3A cubic/orthorhombic, Alkalisulphates) – very important for Cement Setting BehaviorCloser operation to the limits of the process (saving of energy and expensive raw materials) – instead of blind following of traditional LSF (Lime Saturation Factor), Silica and Alumina module Freelime analysis can be done more reliably with TOPAS –interference stability!Control of the cement milling – dehydration of the sulphates
TOPAS Improves Process and Quality Control

Benefits:Reliable resultsDoes not break down when sample composition changes like other packages
Best available reproducibility
TOPAS (Total Pattern Analysis Solutions)
Latest generation Rietveld software

The Time for XRD is Now. . .
From pick-up to result in less than 5 minutes! As fast as XRFQuantitative XRD enhances ability for process and quality control. Real phases equals real information.Cost savings will cover instrument investment • High margin cement is no accident. . . or luck. . .
Push-button approach brings XRD to the control room

Automation Software AXSLAB Push Buttons to Start Routine Jobs
Simply click a button to start a sample or a batch job
Configurable by the user

Automation Software AXSLAB User Interface with Color-coded Results Table

Quantitative Rietveld Analysis Cement Industry
Milestone reference:
Paul, M., Hornung, D., Enders, M. & Schmidt, R. (2004): "Process monitoring in a cement plant: The combination of optimized preparation procedures for clinker and cement and Rietveld analysis" World of Cement, 2, 35-42.

Quantitative Rietveld Analysis Cement Industry
The cement industry is currently the fastest growing application area for quantitative Rietveld analysis
The question is not IF, but WHEN the Rietveld method will be implemented for quality optimization and process control in ALL cement plants
Paul, M. (2004)

Sample Preparation – Key to Success
Ring and puck mill traditionally used will o Dehydrate the cemento Destroy crystal structure -> amorphouso Settings for XRF usually too long for XRDo Easy to automate
Mortar mills o Too slowo Fine for XRDo Cannot be automated
Mortar and pestleo Too slow x 2o Operator dependent
Powder mounts • too operator dependent• Not reproducible

Sample Preparation
Pressed pellets (steel rings)• Gentle grinding: free lime, sulfate phases, calcite• Uniform pressure: preferred orientation effects• Automation: Application in routine analysis

Automatic
Preparation
Module

Features:
Grinding with or without bind sample
Predefined procedures for typical materials (RM, CLI, CM)
Simple entry of individual parameters
One button operation
Predefined special programs (only grinding, only pressing)

Fine grinding mill
Grinding aid dosing
Tablet press
Tablet cleaning
Steel ring magazine
Manual sample input

Compact module for automatic sample preparation
600
600
1260

Material in
Tablet out

POLAB®
APM: Automatic Sample
Preparation Module
new machine withsample changer

D4 ONLINE
AXSLabUser Interface
Automation Control
Lan network
APMplus
Transfer of results via LAN, e.g. to plant control system, LIMS system, Blending Software
Lab Automation – AXSLABConfiguration: D4 with APMplus
Thank you for attending!
Please provide feedback by completing our brief survey.
Also, please type any questions you may have in the Q&A panel.

www.bruker-axs.com
Upcoming events:
Apr 20-24 ICMA, Reno, NV
May 7 Cement Solutions II Webinar: Improved C-114 Qualification with WDXRF
May 18-22 IEEE/PCA, Miami, FL
Oct 5-9 MS&T, Pittsburgh, PA