Embed Size (px)
Citation preview

From UPED to REMI:From UPED to REMI:
Utah’s Experience in Developing Long-Utah’s Experience in Developing Long-Term Economic and Demographic Term Economic and Demographic
ProjectionsProjections
Utah Governor’s Office of Planning and Utah Governor’s Office of Planning and BudgetBudget
January 2006January 2006

Synopsis of Current Situation Synopsis of Current Situation
►Utah bought its REMI Policy Insight Utah bought its REMI Policy Insight models in 2002models in 2002
►The REMI models replaced Utah’s in-The REMI models replaced Utah’s in-house models, which had been used for house models, which had been used for over 30 yearsover 30 years
►The 2005 Baseline long-term projection The 2005 Baseline long-term projection series is the first one to incorporate the series is the first one to incorporate the REMI modelsREMI models

Background of UPEDBackground of UPED► UPED combines a cohort component and an UPED combines a cohort component and an
economic base modeleconomic base model
► It produces projections of population, It produces projections of population, components of change, households, and components of change, households, and employment by industry at the county and employment by industry at the county and state levelstate level
► UPED was developed and implemented as UPED was developed and implemented as Utah’s official projection model in the 1970sUtah’s official projection model in the 1970s
► UPED produced extremely accurate UPED produced extremely accurate population projectionspopulation projections 1970 projection of state population in 2000 within 1970 projection of state population in 2000 within
8% of actual decennial Census count8% of actual decennial Census count
Historical Historical DataData

Utah is in the Center of the Utah is in the Center of the Fastest Growing Area of the Fastest Growing Area of the
CountryCountry
NM20.1
UT29.6
AZ40.0
CA13.8
NV66.3
OR20.4
TX22.8
OK9.7
CO30.6
WA21.1
ID28.5
MT12.9
WY8.9
ND0.5
SD8.5
MN12.4
NE8.4
KS8.5
IA5.4
MO9.3
AR13.7
LA5.9
WI9.6
IL8.6
IN9.7
OH4.7
FL23.5
TN 16.7
KY9.7
MS10.5
AL10.1
GA26.4
SC
15.1
NC21.4
VA14
WV0.8
PA3.4
NY5.5
ME3.8
AK14.0
HI9.3
MA5.5
VT8.2
NH11.4
RI4.5CT
3.6NJ8.9
DE17.6
MD10.8
Percent Change in Population for States: 1990 to 2000U.S. Rate = 13.2%
Source: U.S Census Bureau
MI6.9
Percent Change
39.6 or more (More than Three Times the U.S. Rate)
26.4 to 39.5 (More than Twice the U.S. Rate)

Utah’s Fastest Utah’s Fastest Growing Growing CountiesCounties
1990 - 20001990 - 2000
DAVIS
BOX ELDER CACHERICH
WEBER
TOOELE
SALTLAKE
MORGAN
SUMMIT DAGGETT
UTAHWASATCH
DUCHESNEUINTAH
JUAB
SANPETE
CARBON
EMERY GRANDMILLARD
PIUTE
GARFIELD
SEVIER
WAYNE
SAN JUAN
IRON
BEAVER
WASHINGTON KANE
40.0% Increase or Greater
Increase of 20.0% - 39.9%
Increase of less than 20%
Source: US Census Bureau

46% 48%
52%56%
65%
75%
80%84%
87% 88%
0%
10%
20%
30%
40%
50%
60%
70%
80%
90%
100%
1910 1920 1930 1940 1950 1960 1970 1980 1990 2000
Source: U.S. Census Bureau
Percent Urban
Utah is an Urban StateUtah is an Urban State
DAVIS
BOX ELDER CACHERICH
WEBER
TOOELE
SALTLAKE
MORGAN
SUMMIT DAGGETT
UTAHWASATCH
DUCHESNEUINTAH
JUAB
SANPETE
CARBON
EMERY GRANDMILLARD
PIUTE
GARFIELD
SEVIER
WAYNE
SAN JUAN
IRON
BEAVER
WASHINGTON KANE
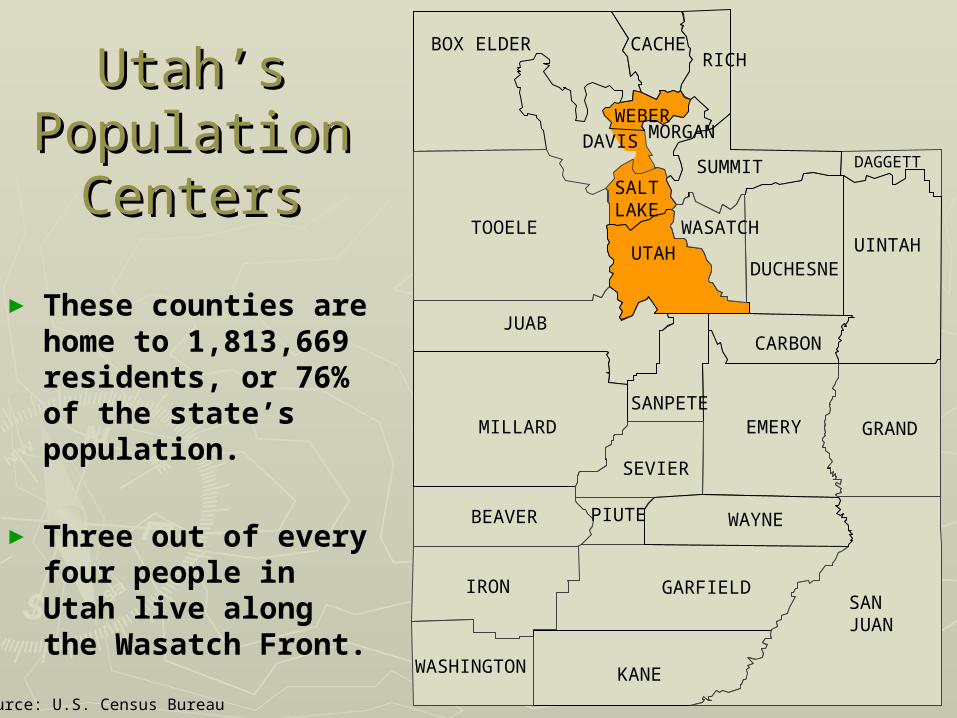
► These counties are home to 1,813,669 residents, or 76% of the state’s population.
► Three out of every four people in Utah live along the Wasatch Front.
Utah’s Utah’s Population Population
CentersCenters
Source: U.S. Census Bureau

DAVIS
BOX ELDER CACHERICH
WEBER
TOOELE
SALTLAKE
MORGAN
SUMMIT DAGGETT
UTAHWASATCH
DUCHESNEUINTAH
JUAB
SANPETE
CARBON
EMERY GRANDMILLARD
PIUTE
GARFIELD
SEVIER
WAYNE
SAN JUAN
IRON
BEAVER
WASHINGTON KANE
Utah’s Utah’s Population Population
CentersCenters
► These counties are home to 1,973,207 residents, or 83% of the state’s population.
Source: U.S. Census Bureau
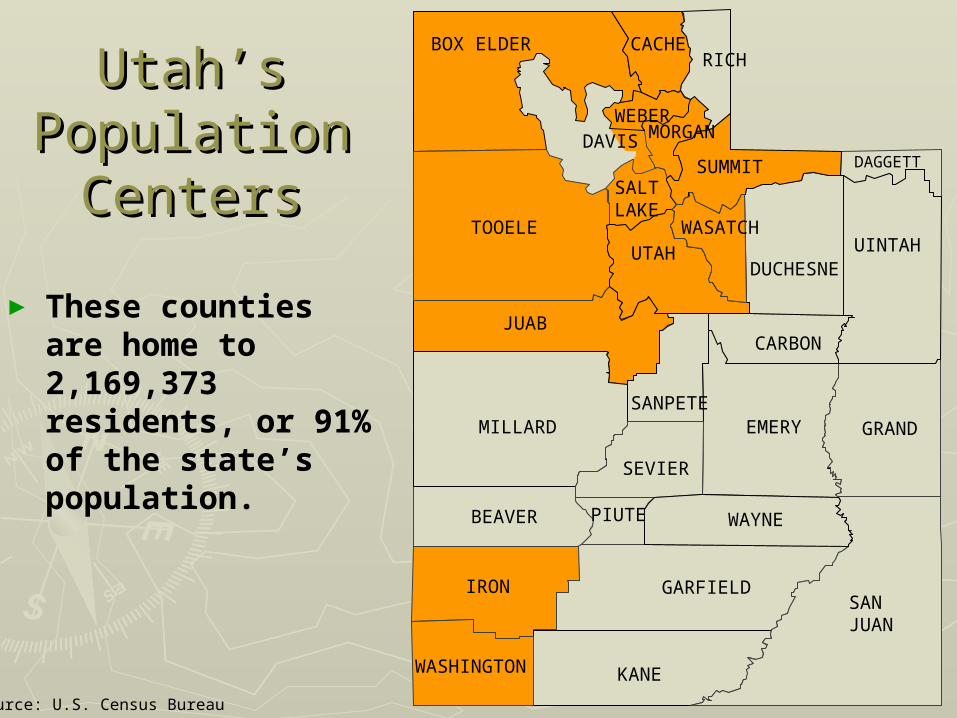
DAVIS
BOX ELDER CACHERICH
WEBER
TOOELE
SALTLAKE
MORGAN
SUMMIT DAGGETT
UTAHWASATCH
DUCHESNEUINTAH
JUAB
SANPETE
CARBON
EMERY GRANDMILLARD
PIUTE
GARFIELD
SEVIER
WAYNE
SAN JUAN
IRON
BEAVER
WASHINGTON KANE
► These counties are home to 2,169,373 residents, or 91% of the state’s population.
Utah’s Utah’s Population Population
CentersCenters
Source: U.S. Census Bureau

19721972
19821982
19931993
19971997


Utah Has the Largest Utah Has the Largest Households in the NationHouseholds in the Nation
Average U.S. Household Size: 2.59Average U.S. Household Size: 2.59
Utah....................Utah.................... 3.133.13Hawaii................Hawaii................ 2.922.92California............California............ 2.872.87Alaska.................Alaska................. 2.742.74Texas..................Texas.................. 2.742.74
Maine..................Maine.................. 2.392.39
A “household is a person or group of persons who live in a housing unit. These equal the count of occupied housing units in a census.
Source: U.S. Census Bureau, 2000 Census

Comparing UPED and Comparing UPED and REMI REMI

Advantages and Disadvantages of Advantages and Disadvantages of UPEDUPED
AdvantagesAdvantages
► AccuracyAccuracy 8% in 19708% in 1970 2% in 19802% in 1980 0.2% in 19840.2% in 1984
► AcceptabilityAcceptability► InstitutionalizedInstitutionalized► Alternate ScenariosAlternate Scenarios
DisadvantagesDisadvantages
► Lack of Lack of documentationdocumentation
► ComplexityComplexity► IndividualizedIndividualized

Advantages and Disadvantages of Advantages and Disadvantages of REMIREMI
AdvantagesAdvantages
► REMI has been tested REMI has been tested and documentedand documented
► The design and results The design and results are similar to UPEDare similar to UPED
► Cost savingsCost savings► Continued local controlContinued local control► CustomizableCustomizable
DisadvantagesDisadvantages
► Data differencesData differences National vs state dataNational vs state data
► Assumption Assumption differencesdifferences
► Model Model “irregularities”“irregularities”
► Demographics is Demographics is more of a byproductmore of a byproduct
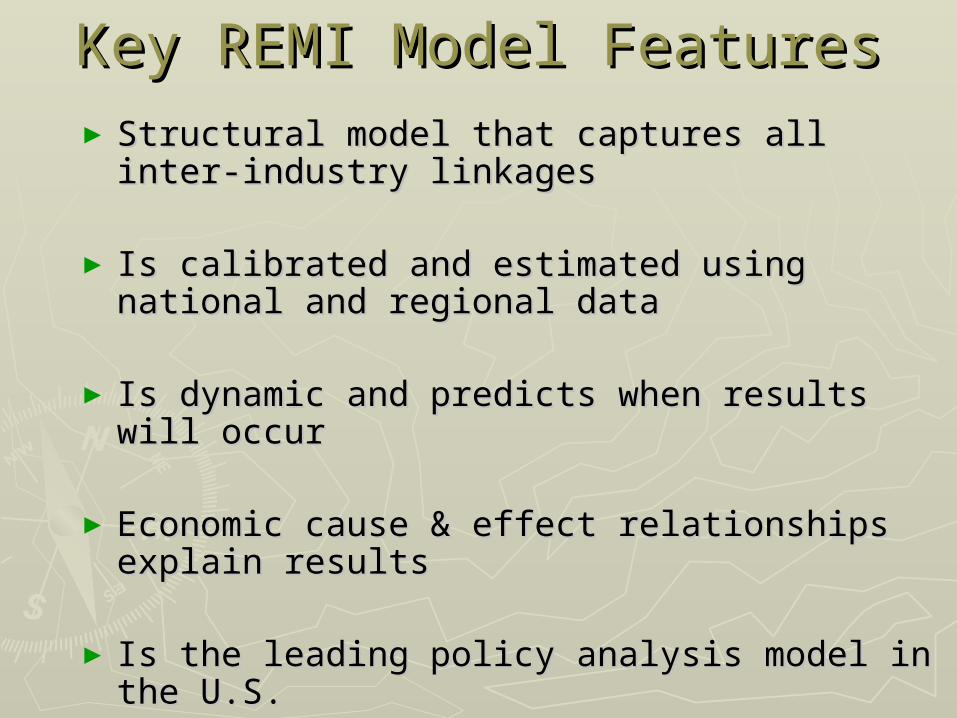
Key REMI Model FeaturesKey REMI Model Features► Structural model that captures all inter-Structural model that captures all inter-
industry linkagesindustry linkages
► Is calibrated and estimated using national Is calibrated and estimated using national and regional dataand regional data
► Is dynamic and predicts when results will Is dynamic and predicts when results will occuroccur
► Economic cause & effect relationships Economic cause & effect relationships explain resultsexplain results
► Is the leading policy analysis model in the Is the leading policy analysis model in the U.S. U.S.

State of Utah Projections ProcessState of Utah Projections Process
Economic Base Model
Economic Base Model
Cohort Component Model
Cohort Component Model
Integrated Economic and Demographic ProjectionsIntegrated Economic and Demographic Projections

REMI Model StructureREMI Model StructureOutput
Market SharesLabor & Capital Demand
Population & Labor Supply
Wages, Prices, & Profits

2005 Baseline2005 Baseline
Assumptions/ProceAssumptions/Processss

AssumptionsAssumptions

► Population growth is a combination of Population growth is a combination of migration and natural increase.migration and natural increase.
► Employment drives migration.Employment drives migration.
► National employment is projected based on National employment is projected based on U.S. Census Bureau population projections.U.S. Census Bureau population projections.
Growth AnalysisGrowth Analysis

Fertility Rates for Utah and the Fertility Rates for Utah and the U.S. U.S.
3.33.1
2.6 2.62.5 2.5 2.5 2.5 2.5
3.6
2.4
1.8
2.1 2.1 2.1 2.1 2.2 2.2 2.2
4.3
0.0
0.5
1.0
1.5
2.0
2.5
3.0
3.5
4.0
4.5
1960 1970 1980 1990 2000 2010 2020 2030 2040 2050
Utah United States

1950-2004
22%
78%
Migration Natural Increase
► Migration Migration contributed 22% contributed 22% of population of population increase from increase from 1950 – 20041950 – 2004
► During the 1990s, During the 1990s, migration rose to migration rose to 36%.36%.
► Migration Migration projected to be projected to be 26% from 2005 – 26% from 2005 – 20352035
Components of ChangeComponents of Change

ProcessProcess

0.0%
0.2%
0.4%
0.6%
0.8%
1.0%
1.2%
1.4%
1.6%
1.8%
2.0%
1969 1974 1979 1984 1989 1994 1999 2004 2009 2014 2019 2024 2029 2034 2039 2044 2049
Actual Projected Trend 1969-2002 Trend 1987-2000
The employment projection is based on a trend analysis of
Utah’s historical share of national employment.
Utah’s Share of National Utah’s Share of National EmploymentEmployment

2005 Baseline Process2005 Baseline Process
►Begin with the state modelBegin with the state model Incorporate employment using employment Incorporate employment using employment
updateupdate Incorporate fertility assumptions using Incorporate fertility assumptions using
policy variable selectionpolicy variable selection
►Disaggregate to the counties using the Disaggregate to the counties using the multi region county modelmulti region county model
►Testing and review to assure Testing and review to assure believabilitybelievability

-2.0%
0.0%
2.0%
4.0%
6.0%
8.0%
10.0%
12.0%
1950 1955 1960 1965 1970 1975 1980 1985 1990 1995 2000
Annual Growth Rate Ten Year Average 50 Year AARC 40 Year AARC
30 Year AARC 20 Year AARC 10 Year AARC
Washington County Washington County Population Growth AnalysisPopulation Growth Analysis

-
100,000
200,000
300,000
400,000
500,000
600,000
700,000
2000 2005 2010 2015 2020 2025 2030 2035 2040 2045 2050
Po
pu
latio
n...
0.0%
1.0%
2.0%
3.0%
4.0%
5.0%
6.0%
7.0%
Gro
wth
Rate
Population Growth Rate
Washington County Washington County Population GrowthPopulation Growth


2005 Baseline 2005 Baseline ResultsResults
EmploymentEmployment

0.0%
1.0%
2.0%
3.0%
4.0%
5.0%
1950s 1960s 1970s 1980s 1990s 2000s 2010s 2020s 2030s 2040s
Avera
ge A
nnual R
ate
of C
hange ..
.
State of Utah United States
Source: 2005 Baseline Projections, GOPBSource: 2005 Baseline Projections, GOPB
Employment Growth by Employment Growth by Decade Decade
for Utah and the U.S.for Utah and the U.S.

0
100,000
200,000
300,000
400,000
500,000
600,000
700,000
800,000
900,000
1,000,000
1969 1974 1979 1984 1989 1994 1999 2004 2009 2014 2019 2024 2029 2034
Services Government Agriculture Mining Construction
Manufacturing TCPU Trade FIRE
Source: Provisional 2004 Baseline Projections, Governor’s Office of Planning and Budget
SIC Major Industries in Utah: SIC Major Industries in Utah: 1969 to 20351969 to 2035

NAICS Major Industries in Utah: NAICS Major Industries in Utah: 2001-20502001-2050
0
100,000
200,000
300,000
400,000
500,000
600,000
700,000
800,000
900,000
2000 2010 2020 2030 2040 2050
Empl
oym
ent b
y In
dust
ry
Natural Resources and Mining Construction ManufacturingTrade, Trans., Utilities Information Financial ActivityProfessional & Business Services Education & Health Services Leisure & HospitalityOther Services Government

Location Quotients: Location Quotients: State EmploymentState Employment
0.50
0.60
0.70
0.80
0.90
1.00
1.10
1.20
1.30
1.40
2000 2010 2020 2030 2040 2050
Empl
oym
ent b
y In
dust
ry
Natural Resources and Mining Construction ManufacturingTrade, Trans., Utilities Information Financial ActivityProfessional & Business Services Education & Health Services Leisure & HospitalityOther Services Government

Utah Employment by Industry as Utah Employment by Industry as a Share of Total State a Share of Total State
EmploymentEmployment2050
Mining1%
Construction6%
Manufacturing8%
Information1%
Professional & Business Services
16%
Education & Health
Services24%Leisure &
Hospitality7%
Other Services
5%
Government11%
Financial Activity
8%
Trade, Trans., Utilities
13%
2006
Mining2%
Construction7%
Manufacturing8%
Trade, Trans., Utilities
17%
Information2%
Financial Activity
10%
Professional & Business Services
13%
Education & Health
Services11%
Leisure & Hospitality
9%Other Services
6%
Government15%
Source: 2005 Baseline Projections, GOPBSource: 2005 Baseline Projections, GOPB

2005 Baseline 2005 Baseline ResultsResults
PopulationPopulation

688,862890,627
1,059,273
1,461,0371,722,850
2,246,553
2,833,337
3,486,218
4,086,319
4,701,369
5,368,567
1950 1960 1970 1980 1990 2000 2010 2020 2030 2040 2050
A 100 Year Look at A 100 Year Look at Utah’s PopulationUtah’s Population
Sources: Historical, U.S. Census Bureau; Projected, 2005 Baseline Projections
Utah Population 1950 to 2050
GrowthGrowth

-20
-10
0
10
20
30
40
50
60
70
80
1950 1960 1970 1980 1990 2000 2010 2020 2030 2040 2050
Per
sons
(In
Thou
sand
s)
Net Migration Natural Increase Total Population Change
State of Utah Components of State of Utah Components of Population ChangePopulation Change
Source: 2005 Baseline Projections, GOPBSource: 2005 Baseline Projections, GOPB

27.228.5
30.231.9 32.5 33.3 34.0
35.4 36.2 37.038.0
39.0 39.1 39.1
0
4
8
12
16
20
24
28
32
36
40
44
2000 2005 2010 2020 2030 2040 2050
State of Utah United States
Projected Median Age for Projected Median Age for Utah and the United StatesUtah and the United States
Source: 2005 Baseline Projections, GOPBSource: 2005 Baseline Projections, GOPB

200,000 150,000 100,000 50,000 0 50,000 100,000 150,000 200,000
0- 4 5- 9
10-1415-1920-2425-2930-3435-3940-4445-4950-5455-5960-6465-6970-7475-7980-84 85+ Femal
eMale
2000
2030Source: Provisional 2004 Baseline Projections, Governor’s Office of Planning and Budget
Utah’s Changing Age StructureUtah’s Changing Age Structure

250,000 150,000 50,000 50,000 150,000 250,000
0-4
5-9
10-14
15-19
20-24
25-29
30-34
35-39
40-44
45-49
50-54
55-59
60-64
65-69
70-74
75-79
80-84
85+
Population
FemaleMale
2000 2050Source: 2005 Baseline Projections, GOPB.Source: 2005 Baseline Projections, GOPB.
Utah’s Changing Age StructureUtah’s Changing Age Structure

Growth of School-Age Population: Growth of School-Age Population: 2000 to 20302000 to 2030
0
100,000
200,000
300,000
400,000
500,000
600,000
700,000
800,000
900,000
1,000,000
2000 2005 2010 2015 2020 2025 2030
Po
pu
lati
on
Ag
es 5
-17
0.0%
0.5%
1.0%
1.5%
2.0%
2.5%
3.0%
An
nu
al Gro
wth
Rate A
ges 5-17
Population Growth Rate
Source: 2005 Baseline Projections, GOPB.Source: 2005 Baseline Projections, GOPB.

0
100,000
200,000
300,000
400,000
500,000
600,000
2000 2005 2010 2015 2020 2025 2030
Po
pu
lati
on
Ag
es 6
5 an
d O
lder
0.0%
0.5%
1.0%
1.5%
2.0%
2.5%
3.0%
3.5%
4.0%
4.5%
5.0%
An
nu
al Gro
wth
Rate A
ges 65 an
d O
lder
Population Growth Rate
Growth of 65 and Older Age Group: Growth of 65 and Older Age Group: 2000 to 20302000 to 2030
Source: 2005 Baseline Projections, GOPB.Source: 2005 Baseline Projections, GOPB.

Age Group Growth Rate ComparisonAge Group Growth Rate Comparison
0.0%
0.5%
1.0%
1.5%
2.0%
2.5%
3.0%
3.5%
4.0%
4.5%
5.0%
2000
2001
2002
2003
2004
2005
2006
2007
2008
2009
2010
2011
2012
2013
2014
2015
2016
2017
2018
2019
2020
2021
2022
2023
2024
2025
2026
2027
2028
2029
2030
5 to 17 Age Group 65 and Older Age Group Total Population
Source: 2005 Baseline Projections, GOPB.Source: 2005 Baseline Projections, GOPB.

Historical and Projected Dependency Historical and Projected Dependency Ratios for Utah and the U.S.Ratios for Utah and the U.S.
55
60
65
70
75
80
85
90
1990 1995 2000 2005 2010 2015 2020 2025 2030 2035 2040 2045 2050
De
pe
nd
en
cy
Ra
tio
State of Utah United States
Source: 2005 Baseline Projections, GOPB.Source: 2005 Baseline Projections, GOPB.
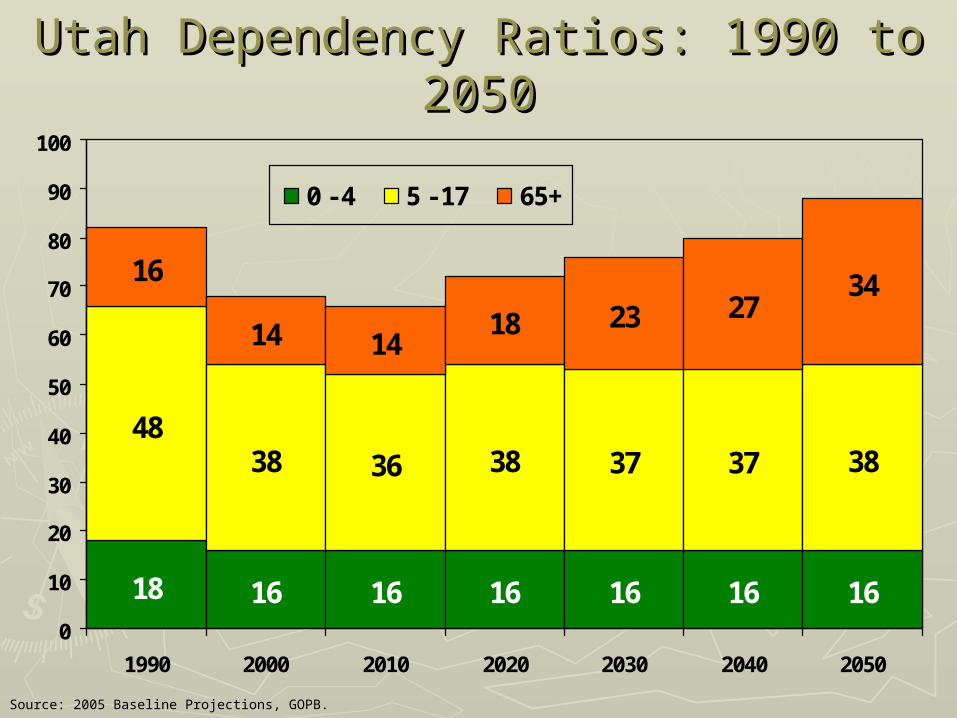
18 16 16 16 16 16 16
4838 36 38 37 37 38
16
14 1418 23 27
34
0
10
20
30
40
50
60
70
80
90
100
1990 2000 2010 2020 2030 2040 2050
0 - 4 5 - 17 65+
Utah Dependency Ratios: 1990 to 2050Utah Dependency Ratios: 1990 to 2050
Source: 2005 Baseline Projections, GOPB.Source: 2005 Baseline Projections, GOPB.

12 11 11 11 12 12 12
29 30 27 29 30 30 30
20 20 2127
35 36 37
0
10
20
30
40
50
60
70
80
90
100
1990 2000 2010 2020 2030 2040 2050
0 - 4 5 - 17 65+
U.S. Dependency Ratios: 1990 to 2050U.S. Dependency Ratios: 1990 to 2050
Source: 2005 Baseline Projections, GOPB.Source: 2005 Baseline Projections, GOPB.

0
1,000,000
2,000,000
3,000,000
4,000,000
5,000,000
6,000,000
1940 1950 1960 1970 1980 1990 2000 2010 2020 2030 2040 2050
Uintah Basin MCD Southeast MCD Central MCD Bear River MCDSouthwest MCD Mountainland MCD Wasatch Front MCD
Population by Multi-County Population by Multi-County District: 1940 to 2030District: 1940 to 2030
Source: 2005 Baseline Projections, GOPBSource: 2005 Baseline Projections, GOPB

-1.0%
0.0%
1.0%
2.0%
3.0%
4.0%
5.0%
6.0%
2000 2005 2010 2015 2020 2025 2030 2035 2040 2045 2050
Bear River Wasatch Front Mountainland Central Southwest
Uintah Basin Southeast State of Utah United States
Source: Provisional 2004 Baseline Projections, Governor’s Office of Planning and Budget
Population Growth Rates Population Growth Rates by Multi-County District: 2000 to 2050by Multi-County District: 2000 to 2050

Utah PopulationAnnual Average
Growth RatesBy County
2000 to 2050
State Average = 1.8%
Increase of 1.0 to 1.7
Change of less than 1.0
Increase of 2.9 or Greater
Increase of 1.8 to 2.8
Box Elder1.7
Cache2.2
Rich0.7
Weber 1.3
Tooele2.6
Salt Lake
1.2
Morgan
3.8Summit
3.0Daggett 0.7
Utah1.0
Wasatch 2.9 Duchesne
1.2Uintah
0.5
Juab1.5
Sanpete1.0
Carbon0.9
Emery0.6 Grand
0.4
Millard1.7
Piute0.7
Garfield1.0
Sevier0.9
Wayne1.2
San Juan0.6
Iron2.3
Beaver2.1
Washington3.9
Kane1.4
Davis 1.1
Box Elder1.7
Cache2.2
Rich0.7
Weber 1.3
Tooele2.6
Salt Lake
1.2
Morgan
3.8Summit
3.0Daggett 0.7
Utah1.0
Wasatch 2.9 Duchesne
1.2Uintah
0.5
Juab1.5
Sanpete1.0
Carbon0.9
Emery0.6 Grand
0.4
Millard1.7
Piute0.7
Garfield1.0
Sevier0.9
Wayne1.2
San Juan0.6
Iron2.3
Beaver2.1
Washington3.9
Kane1.4
Davis 1.1

► Utah has a long history of producing timely Utah has a long history of producing timely and accurate long term economic and and accurate long term economic and demographic projectionsdemographic projections
► Utah has higher rates of economic and Utah has higher rates of economic and population growth than the nation.population growth than the nation.
► While Utah is becoming more like the nation, While Utah is becoming more like the nation, it will continue to have unique demographic it will continue to have unique demographic characteristics that set it apart.characteristics that set it apart.
► The REMI models enable Utah to continue to The REMI models enable Utah to continue to produce quality population projections at the produce quality population projections at the local levellocal level
SummarySummary

Robert SpendloveRobert Spendlove
Governor’s Office of Planning and BudgetGovernor’s Office of Planning and BudgetE210 State Capitol ComplexE210 State Capitol Complex
Salt Lake City, UT 84114Salt Lake City, UT 84114
[email protected]@utah.gov
801-538-1027801-538-1027
www.governor.utah.govwww.governor.utah.gov